exploiting post-transcriptional regulation to probe rna ... · exploiting post-transcriptional...
TRANSCRIPT

Published online 21 November 2014 Nucleic Acids Research, 2015, Vol. 43, No. 2 e13doi: 10.1093/nar/gku1191
Exploiting post-transcriptional regulation to probeRNA structures in vivo via fluorescenceSteven W. Sowa1,†, Jorge Vazquez-Anderson2,†, Chelsea A. Clark2, Ricardo De La Pena2,Kaitlin Dunn2, Emily K. Fung2, Mark J. Khoury2 and Lydia M. Contreras2,*
1Microbiology Graduate Program, University of Texas at Austin, 100 E. 24th Street, A6500, Austin, TX 78712, USAand 2McKetta Department of Chemical Engineering, University of Texas at Austin, 200 E. Dean Keeton St., StopC0400, Austin, TX 78712, USA
Received January 31, 2014; Revised October 31, 2014; Accepted November 3, 2014
ABSTRACT
While RNA structures have been extensively charac-terized in vitro, very few techniques exist to probeRNA structures inside cells. Here, we have exploitedmechanisms of post-transcriptional regulation tosynthesize fluorescence-based probes that assayRNA structures in vivo. Our probing system involvesthe co-expression of two constructs: (i) a target RNAand (ii) a reporter containing a probe complementaryto a region in the target RNA attached to an RBS-sequestering hairpin and fused to a sequence encod-ing the green fluorescent protein (GFP). When a re-gion of the target RNA is accessible, the area can in-teract with its complementary probe, resulting in flu-orescence. By using this system, we observed variedpatterns of structural accessibility along the lengthof the Tetrahymena group I intron. We performedin vivo DMS footprinting which, along with previ-ous footprinting studies, helped to explain our prob-ing results. Additionally, this novel approach repre-sents a valuable tool to differentiate between RNAvariants and to detect structural changes caused bysubtle mutations. Our results capture some differ-ences from traditional footprinting assays that couldsuggest that probing in vivo via oligonucleotide hy-bridization facilitates the detection of folding inter-mediates. Importantly, our data indicate that intracel-lular oligonucleotide probing can be a powerful com-plement to existing RNA structural probing methods.
INTRODUCTION
Biotechnological applications of RNA have exploded in re-cent years, amplifying the need to develop tools to betterunderstand RNA folding dynamics and structural changes.RNA structures have been extensively studied using a va-
riety of in vitro techniques (1–3). Prominent among thesetechniques is the use of chemical or enzymatic modifications(e.g. dimethyl sulfate (DMS), hydroxyl radicals, metal ions,RNase, S1 nuclease mapping) to map RNA structures (4–6). While these methods have provided valuable structuraldata, most do not provide information on RNA folding dy-namics or structural changes in vivo.
RNA folding is influenced by a complex cellular mi-lieu that is difficult to replicate in vitro (7,8). Cellular fac-tors such as the speed and directionality of transcription,metabolite levels, RNA localization and other bimolecularinteractions can all have a significant impact on the acquisi-tion of native RNA structures (7–10). With these considera-tions in mind, a few groups have developed protocols basedon chemical modification for characterizing RNA struc-tures in vivo (11–14). One of the most recent examples ofin vivo RNA structural probing is selective 2′-hydroxyl acy-lation analyzed by primer extension in living cells (14). Thistechnique adapts traditional chemical probing to an in vivosetting.
A common feature of chemical probing techniques is thatthey rely on non-targeted modification of RNA molecules.Since the chemical probe does not modify a unique se-quence within the molecule, chemical footprinting meth-ods are less likely to detect transient differences within spe-cific regions that hallmark rare folding intermediates (15).These rare folding intermediates can have alternative func-tions when compared to the final structure and can be im-portant to understand RNA folding pathways (16,17). Inorder to detect these intermediates in vivo, a more targetedapproach would be required.
In this work, we demonstrate the novel in vivo RNAStructural Sensing System (iRS3) for probing RNA struc-tures in vivo. Our design exploits the ability of a previ-ously designed, well-studied riboregulator to control greenfluorescent protein (GFP) expression post-transcriptionally(18,19). The fundamental premise of this approach is thathighly structured areas are physically blocked from bind-
*To whom correspondence should be addressed. Tel: +(512) 471-2453; Fax: +(512) 471-7060; Email: [email protected]†These authors contributed equally to this work.
C© The Author(s) 2014. Published by Oxford University Press on behalf of Nucleic Acids Research.This is an Open Access article distributed under the terms of the Creative Commons Attribution License (http://creativecommons.org/licenses/by-nc/4.0/), whichpermits non-commercial re-use, distribution, and reproduction in any medium, provided the original work is properly cited. For commercial re-use, please [email protected]
e13 Nucleic Acids Research, 2015, Vol. 43, No. 2 PAGE 2 OF 13
ing the designed structural reporter. In contrast, ‘open’ re-gions that do not participate in any intra- or inter-molecularcontacts or that are simply not hindered by the topology ofthe molecule will be more readily available to bind to thereporter. Hereby, we present the iRS3 as a useful tool, notbased on chemical modifications, capable of probing RNAstructure in living cells.
To demonstrate the value of this system, we use the iRS3
to explore the structural organization of the Tetrahymenagroup I intron (gI intron). This gI intron is a well-studied(∼400 nt) catalytic RNA (5,20–21) that has been struc-turally characterized by a variety of different in vitro tech-niques (22–25). The gI intron has also been confirmed tobe catalytically active when expressed heterologously in E.coli (9,26). We establish the ability of our system to distin-guish between the wild type and two mutant introns and toidentify some of the most accessible regions of each intron.When compared to all available DMS and hydroxyl radicalfootprinting data (including our own in vivo DMS data), re-sults from our iRS3 probing revealed a higher potential todetect low abundance folding intermediates. As such, theiRS3 methodology complements other in vivo and in vitroprobing methods based on small-molecule accessibility.
MATERIALS AND METHODS
Plasmid and strains
To build our new in vivo reporter system, we cloned thegroup I intron variants into the engineered riboregulator-harboring plasmid (18) and modified it to contain probescomplementary to the group I intron. The pZER21��12aGplasmid incorporates two promoters to drive gene expres-sion, the pBAD promoter which expressed the gI intronvariants and the pLtetO promoter which expressed thehairpin-GFP reporter. We designed complementary probesto be inserted immediately upstream of the hairpin-GFP re-porter, creating a probe-hairpin-GFP reporter. The cloningstrategies for all plasmids in this study are described in Sup-plementary Table S3.
The primary sequence of all constructs was confirmedby using primers E and F (Supplementary Table S2) in se-quencing reactions performed by the University of Texascore facility. We provide the sequence of the wild-type intron(WTI) Probe 1 reporter (WTI Probe 1 reporter) in Supple-mentary Text File 1 and the plasmid is available upon re-quest. The probes (15–18 and 9–10 nucleotides long) weredesigned to be fully complementary to the gI intron (tar-get RNA) and to give good coverage of regions within theintron (Supplementary Table S1). All probes were also pur-chased as oligonucleotide primers (25 nmol, standard de-salting) from Integrated DNA Technologies (Coralville, IA,USA).
Computational analysis of probes
NUPACK (27) was used to estimate minimum free ener-gies (MFEs) of the probe-reporter (EcoRI-Probe-CB-LP-RBS-+35 nucleotides) and to test for the strand-to-strandbinding affinity between the probe-reporters and the gI in-tron. The following user input settings were used: RNA nu-cleic acid type at 25◦C, one strand species and one strand
maximum complex size for probe-reporters (structure forprobe-reporter was predicted to test for base-pairing inter-actions of probes with downstream GFP coding sequence)and two strand species and two strand maximum complexsize for probe-reporters and introns. The concentration ofthe hairpin-GFP reporters and introns was assumed to beequimolar (2 �M) in order to test for the relative level ofbinding of the intron-hairpin complex. NUPACK was alsoused to calculate the binding energy (�MFE) using thesame parameters above described.
Flow cytometry
For all experiments, the fluorescence output of each probewas measured using at least quadruplicate samples. Cellswere grown overnight in Luria–Bertani (LB) medium(Benton-Dickenson and Company, Sparks, MD, USA) and10 mg/ml kanamycin (Amresco, Solon, OH, USA), seededinto 20 ml of LB plus 100 �l kanamycin (10 mg/ml stock)and cultured for 2 h. The remainder of the experiment wascarried out under two conditions: (i) samples induced with800 �l of 20% arabinose (final concentration 0.8%) and20 �l of anhydrotetracycline (aTc) (final concentration 100ng/�l), (ii) non-induced samples, where neither of the in-ducers were added. Five hours after induction, we sampled100 �l to measure the optical density and an additional 100�l was pelleted and re-suspended in 1× phosphate bufferedsaline (Amresco) for flow cytometry. The flow cytometrydata were collected with a Benton Dickinson FACSCal-ibur flow cytometer with a 488 nm argon laser and 530 nmFL1 logarithmic amplifier. Sample data were collected us-ing CellQuest Pro (Benton-Dickenson and Company) witha user defined gate. Fluorescent measurements were col-lected from ∼150 000 cells and analyzed using MicrosoftExcel and JMP, a statistical software package. The medi-ans of the populations for non-inducing and inducing con-ditions were normalized by the average fluorescence for allprobes of a given intron variant.
To generate the graphs in Figure 5, we determined shiftsby calculating differences in fluorescence between the av-erage of median values for the induced and non-inducedsamples of the same probe 5 h after induction of appro-priate samples. To quantify the error associated with theseshifts, we calculated the standard error of the mean (SEM)as propagated from the original data points after normal-ization.
In vitro binding assays
An in vitro binding assay was performed to demonstrate theability for probes to bind to intron expressed in cellular ex-tracts. Radiolabeled oligonucleotides were prepared as perthe protocol described in (28). In vivo samples of the gI in-tron were harvested and purified using the techniques de-scribed in previously published methods (29). RNA fromthese sources was suspended in 7 �l of buffered solution (50mM KCl (Avantor Performance Materials Inc.) and 80 mM3-(N-morpholino)propanesulfonic acid buffer (MOPS) (pH7.0 Amresco)) and denatured at 95◦C for 2 min. After de-naturing, 10 �l of the radioactive probes were immediatelyadded to all samples and hybridization occurred at 37◦C for
PAGE 3 OF 13 Nucleic Acids Research, 2015, Vol. 43, No. 2 e13
30 min. 2× RNA loading dye (NEB) was added to all sam-ples and to the ladder to get a final concentration of 10% pervolume and then nuclease free H2O (Ambion) was addedto make the sample volume consistent. The samples wereloaded onto a 6% native polyacrylamide gel that was runat two watts for 24 h. The gel was then carefully placed onblotting paper (VWR International), loosely covered withsaran wrap and left to dry for 3–4 h at 70◦C in a vacuumdryer (BioRad). Upon removal from the dryer, the gel wasexposed to a phosphor screen (GE Healthcare) for 3–4 h at4◦C. Following exposure, the phosphor screen was imagedusing a Typhoon Phosphorimager.
Northern blot analysis of iRS3 transcript
To determine the steady state levels of iRS3 transcript, RNAwas extracted as per protocol described in (29) from cellsexpressing the iRS3 reporter at 2.5 and 5 h after induction.The RNA was run down an agarose/formaldehyde gel andblotted using previously described methods (30) (see Sup-plementary Table S1 for 16S rRNA and iRS3 transcriptprobes).
In vivo dimethyl sulfate footprinting
Primers fluorescent labeling. 5′ Amine modified primers(DMS primers K, L and M in Supplementary Table S2)were fluorescently labeled according to previously pub-lished protocols (17). For the labeling reaction 1 �l of thepurified amine primer (25 mg/ml), 1.2 �l of distilled wa-ter, 15 �l of Borax buffer (0.1 M) and 3 �l of NHS-Dye(IRDye R© 650 Infrared Dye, Li-Cor) were mixed and in-cubated in the dark for 3–4 h. Finally, the primers weregel-purified and re-dissolved in 60 �l of nuclease-free wa-ter. Their concentrations were estimated using 260 nm ab-sorbance and the extinction coefficients provided by Inte-grated DNA Technologies (IDT) for each primer.
In vivo dimethyl sulfate treatment. Cells containing WTIplasmid (Supplementary Table S3) were grown overnight at37◦C in 5 ml of LB medium. The main culture was inducedwith 4 ml of 20% arabinose (final concentration 0.8%) at anOD600 between 0.15 and 0.3, and the culture was left to growfor 5 h at 37◦C. Samples were then treated with DMS andprepared as described in (31) and total RNA was extractedfrom cells using previously described methods (29). Afterextraction, 4 �g of total RNA were reverse-transcribed us-ing Superscript III RT (Invitrogen) as per manufacturer’sinstructions.
Capillary electrophoresis. A capillary electrophoresis (CE)system (Beckman Coulter A26572 GenomeLabTM GeXPGenetic Analysis System) was used to separate the DMStreated fragments. Each cDNA sample obtained abovewas mixed with 1 �l of a DNA size standard 600 ladder(GenomeLab Beckman Coulter 608095) and nuclease-freewater was added to a final volume of 30 �l in a conical96-well plate. The samples were separated in the CE sys-tem using the following parameters: temperature pre-set to60◦C, denaturation at 90◦C for 150 s, injection at 2.0 kV for30 s and separation at 3.0 kV for 90 min. Lastly, the data
obtained were analyzed using Capillary Automated Foot-printing Analysis (CAFA) (32). The CE traces obtainedwere aligned to the ladder peaks using CAFA. Then, usingCAFA, the fit data were filtered and normalized using the‘no-DMS’ control. All samples were run by technical andbiological duplicates.
RESULTS
Molecular design and optimization of iRS3
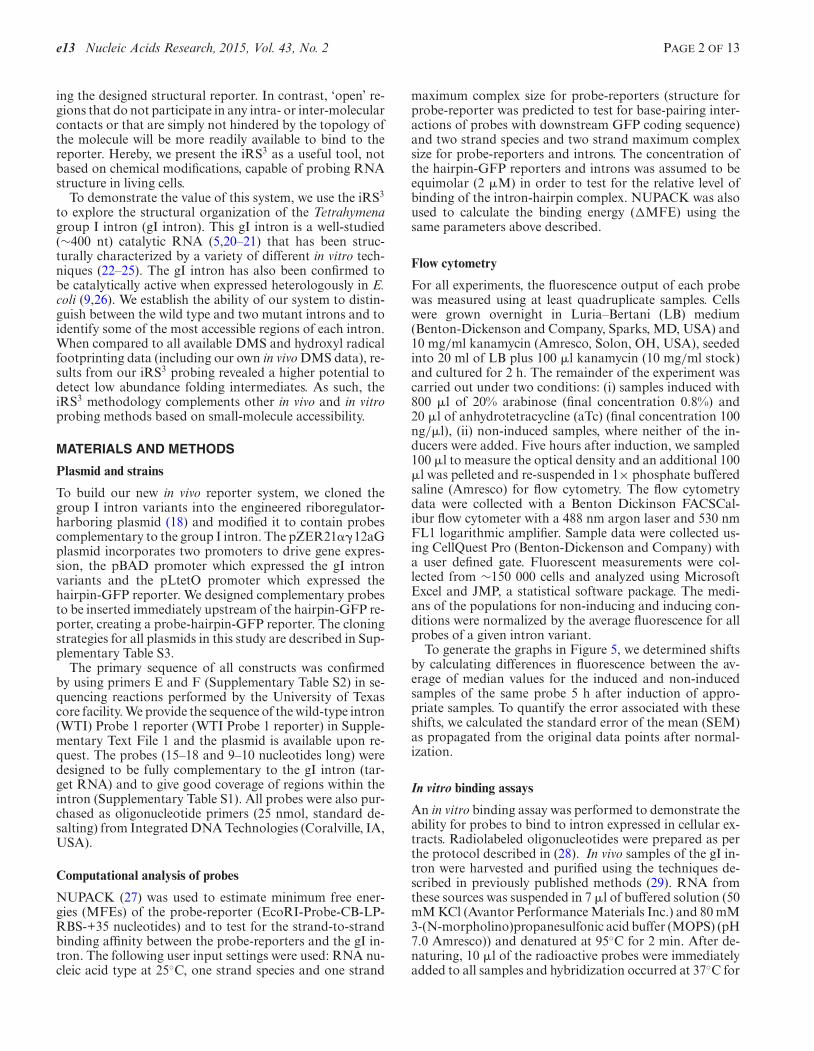
Our design is an alteration of a previously published, highlycontrollable riboregulator that inhibits the synthesis ofGFP in the presence of a regulatory hairpin and promotesthe synthesis of GFP in the absence of the same hairpin(18). As illustrated in Figure 1, this new structural reporteris comprised of five segments at the RNA level: (i) a specific15–18 nucleotide sequence (probe) that is complementaryto a specific region of the target RNA sequence, (ii) a cis-blocking (CB) region complementary to the ribosome bind-ing site (RBS), (iii) a linker region (LR) in between the RBSand its complement, (iv) a region containing an RBS and (v)a region encoding GFP. The probe, which is the only vari-able feature of this system, acts as a sensor for a specific re-gion within the target RNA. The RBS, LR and the CB forma stable hairpin. The stability of this hairpin is controlled bythe expression of a separate molecule (e.g. the TetrahymenagI intron) in trans that can base pair to the probe and desta-bilize the hairpin, most likely by steric hindrance and/orby subsequent structural reconfigurations upon probe bind-ing. In addition, once the hairpin is opened, the iRS3 tran-script could be further stabilized by interactions with the ri-bosome; similar protection effects have been reported (30).Thus, the hairpin acts as an adaptor converting the extentof the RNA–probe interaction into fluorescence readout.
We initially tested two designs for the riboregulator. Thefirst design contained a NotI restriction site between theprobe and the CB–RBS hairpin, which was intended to sim-plify cloning. However, we did not observe a significantshift in fluorescence upon induction of the intron (data notshown). As a result, we created a second design which con-tained the probe immediately adjacent to the CB–RBS hair-pin. This probe design allowed us to detect a shift in fluores-cence upon induction of the target and was therefore usedfor the remainder of our analyses.
To determine an appropriate length for the complemen-tary probes, we carried out binding predictions (see Ma-terials and Methods: Computational Analysis of Probes)and discovered that 15–18 mers gave a more stable boundcomplex than 8–12 mers (data not shown). Therefore, wechose to continue our studies with 15–18 mers given theirhigher specificity, stronger binding and their ability to pro-vide more intron coverage for our initial studies. Althoughwe proceeded with 15–18 mers, our computational predic-tions suggested that 8–12 mers could provide sufficient, al-beit weaker, binding to be used in these studies to increasethe structural resolution of the system. From these prelim-inary studies, we developed a general methodology for de-signing the iRS3 system to target different RNAs (Supple-mentary Figure S1).
e13 Nucleic Acids Research, 2015, Vol. 43, No. 2 PAGE 4 OF 13
Fluo
resc
ence
Target RNA
GFPRBSProbe
CB
Fluo
resc
ence
pBAD
pLtetO
Target RNA
GFP
pBAD
pLtetO
Target RNA
RBS
CB Probe Y
GFP
LR
No interaction
A.
B.
Target RNAProbe X iRS3
RBS
CBProbe X
GFP
LR
LR
RBSProbe
CB
LR
Probe X iRS construct3
Target RNA
Interaction
Probe Y iRS construct3
Target RNAProbe Y iRS3
–+
++
–+
++
Figure 1. Fundamentals of the in vivo RNA Structural Sensing System (iRS3). (A) Accessible region on target RNA. Our system is expressed on a plasmidusing two promoters, pBAD and PLtetO. The RNA reporter construct (Probe X iRS3 construct) incorporates a GFP transcript (green) whose translationis inhibited due to ribosome binding site (RBS, blue) sequestration by a cis-blocking region (CB, orange) that is connected to the RBS through a flexiblelinker region (LR, black). If the probe (purple) targets an accessible region on the target RNA, an interaction will occur causing the hairpin loop to open,exposing the RBS and lead to GFP expression. (B) Inaccessible region on target RNA. If the probe (red) targets an inaccessible region on the target RNA,there will be reduced interaction between the intron and the probe, the hairpin loop will not open and a negligible increase in fluorescence will be observedcompared to non-induced levels.
iRS3 fluorescence is specific to the interaction between probeand target RNA
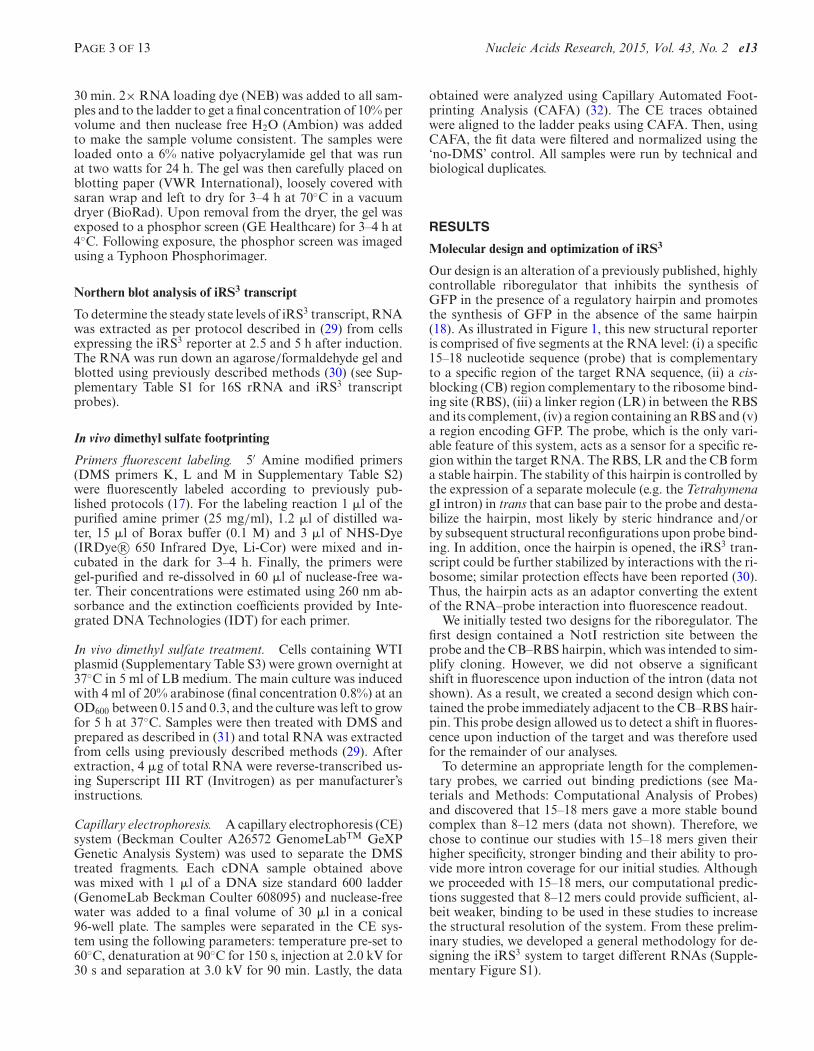
After determining an appropriate design for the iRS3 (Fig-ure 1), we then built several controls to verify that thefluorescence observed was specific to the recognition andbinding of the probe to the target gI intron. All controlswere built in the context of Probe 1 (Supplementary TableS1). We hypothesized that a shift in fluorescence would re-sult from the 5′ target region binding to its complementaryprobe-iRS3 reporter. The binding location of Probe 1 on theintron (and all other probes used) is shown in Figure 2.
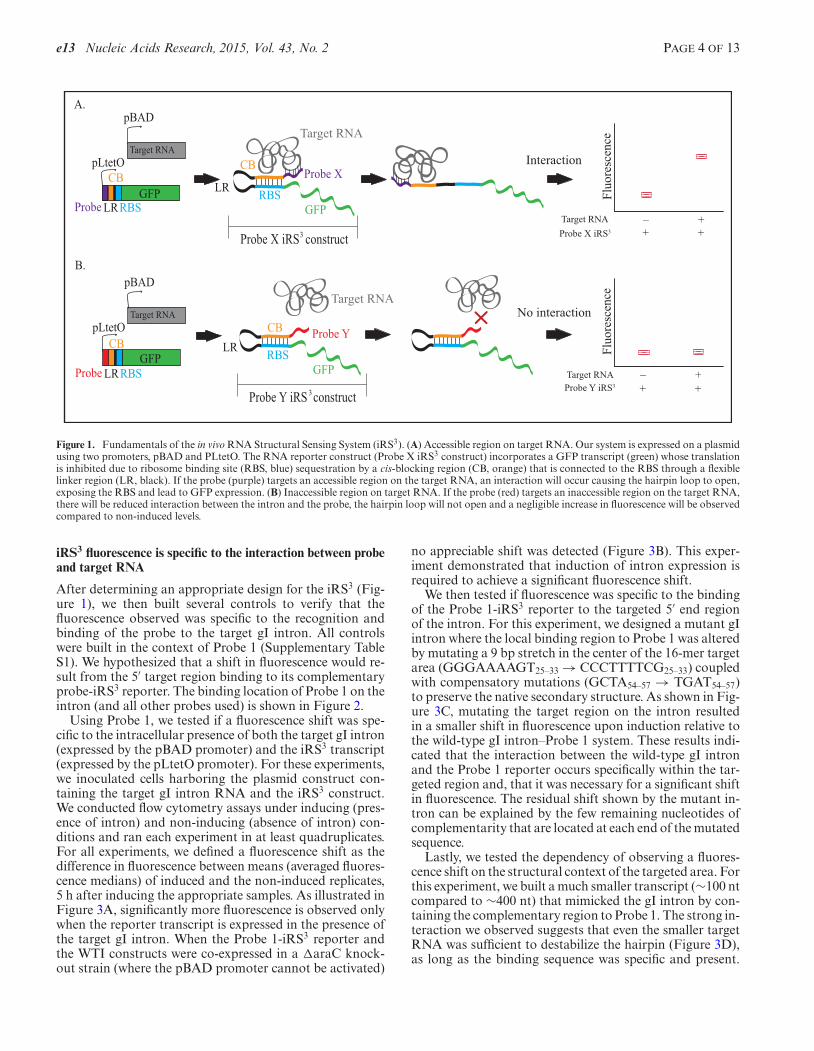
Using Probe 1, we tested if a fluorescence shift was spe-cific to the intracellular presence of both the target gI intron(expressed by the pBAD promoter) and the iRS3 transcript(expressed by the pLtetO promoter). For these experiments,we inoculated cells harboring the plasmid construct con-taining the target gI intron RNA and the iRS3 construct.We conducted flow cytometry assays under inducing (pres-ence of intron) and non-inducing (absence of intron) con-ditions and ran each experiment in at least quadruplicates.For all experiments, we defined a fluorescence shift as thedifference in fluorescence between means (averaged fluores-cence medians) of induced and the non-induced replicates,5 h after inducing the appropriate samples. As illustrated inFigure 3A, significantly more fluorescence is observed onlywhen the reporter transcript is expressed in the presence ofthe target gI intron. When the Probe 1-iRS3 reporter andthe WTI constructs were co-expressed in a �araC knock-out strain (where the pBAD promoter cannot be activated)
no appreciable shift was detected (Figure 3B). This exper-iment demonstrated that induction of intron expression isrequired to achieve a significant fluorescence shift.
We then tested if fluorescence was specific to the bindingof the Probe 1-iRS3 reporter to the targeted 5′ end regionof the intron. For this experiment, we designed a mutant gIintron where the local binding region to Probe 1 was alteredby mutating a 9 bp stretch in the center of the 16-mer targetarea (GGGAAAAGT25–33 → CCCTTTTCG25–33) coupledwith compensatory mutations (GCTA54–57 → TGAT54–57)to preserve the native secondary structure. As shown in Fig-ure 3C, mutating the target region on the intron resultedin a smaller shift in fluorescence upon induction relative tothe wild-type gI intron–Probe 1 system. These results indi-cated that the interaction between the wild-type gI intronand the Probe 1 reporter occurs specifically within the tar-geted region and, that it was necessary for a significant shiftin fluorescence. The residual shift shown by the mutant in-tron can be explained by the few remaining nucleotides ofcomplementarity that are located at each end of the mutatedsequence.
Lastly, we tested the dependency of observing a fluores-cence shift on the structural context of the targeted area. Forthis experiment, we built a much smaller transcript (∼100 ntcompared to ∼400 nt) that mimicked the gI intron by con-taining the complementary region to Probe 1. The strong in-teraction we observed suggests that even the smaller targetRNA was sufficient to destabilize the hairpin (Figure 3D),as long as the binding sequence was specific and present.
PAGE 5 OF 13 Nucleic Acids Research, 2015, Vol. 43, No. 2 e13
C C U G G U A G C U A
P9.1aP9.1
P9
P9.2
P7
P3
P8
P2.1P2
P1
40
60
80
100
280300
320
340
360380
400
5’
3’
GGAGGG
AAAAGUUAUCAGGCAU
C A G U C U U U A A A C C A A U A
G
AUU
G
CAUC
GGUUUAAA
AGGC
A
GACCG
UCA
C AGACUA
AAUGU
CGGUC
GGGGAAGAU
GUAUUCUUCUCA
U
A
A
G
A
U
AUAGUCG
GA
CCUCUCCUUAA
U G
C U A G C G G A U G A A G U G
A
UG
A
A
CACUGGAG
CCGCUGGGA ACA A UUUGA UGUGAAAG U AU A U
UG A U A G U U
U G G
AG
U
G
C
U
UC
P9a
A
P6b
P6a
P6
P4
P5P5a
P5b
P5c
120
140
160
180
200
220
240
260
AAU
UGCGGG
AAA
GGGGUCA
ACAGCCG UUCAGU
ACCA
AGUCUCAGGGG
AAACUUUGAGAU
GGCCUUGCA A A G G
G U A UGGUA
AU
A AG
CUGACGGACA
UGGUCC
U
A
ACCA CGCA
GC
CAA
GUCC
UAA
GUCAACAGA
U C UU
CUGUUGAU
AU
GGAUGC
AGU
UC A
U
G G G A
UUUUUU
GG
C
CUU
GCU
U
GGCU
UC
1
2
3
45
6
7
8
9
10
U
A
AU
alt-P3
A-Rich Bulge(nt 184-189)
Figure 2. GI intron Tetrahymena Ribozyme Model System. This figure depicts the sequence and secondary structure of the Tetrahymena wild-type gIintron. Probe numbers are circled and indicated next to black dashed lines, which show the regions of the molecule being targeted by these complementaryprobes. Structural domains are indicated by the letter ‘P’ followed by a number. The dashes between the nucleotides on opposing sides of each stem loopindicate complementary base pairing, with the dots signifying G–U wobble base pairing. The quintuple mutant contains a total of five mutated regions(black boxes) and the letters outside of the boxes represent the new mutant sequences. These mutations abolish five key tertiary contacts within the group Iintron molecule shown as thick gray arrows. The A-rich bulge mutant has the same A-rich bulge mutation as the quintuple mutant, but contains no othermutations.
In this way, we demonstrated that the probe can still bindoutside of the molecular context provided by the gI intron.Importantly, these results implied that the use of this sys-tem could be extended beyond large molecules such as thegI intron.
iRS3 can discriminate between accessible and protected re-gions along the group I intron
After identifying a sensitive molecular design that led to flu-orescence in the presence of specific binding between theProbe 1 reporter and an accessible region of the gI intron,we tested if the iRS3 could capture contrast in structural ac-cessibility along the target gI intron. For these experiments,we designed nine additional constructs with different prob-ing regions along the gI intron (Figure 2, Supplementary
Tables S1 and S3), resulting in 33% sequence coverage of thegI intron. The probes were numbered sequentially accord-ing to their position in the primary sequence of the intron.
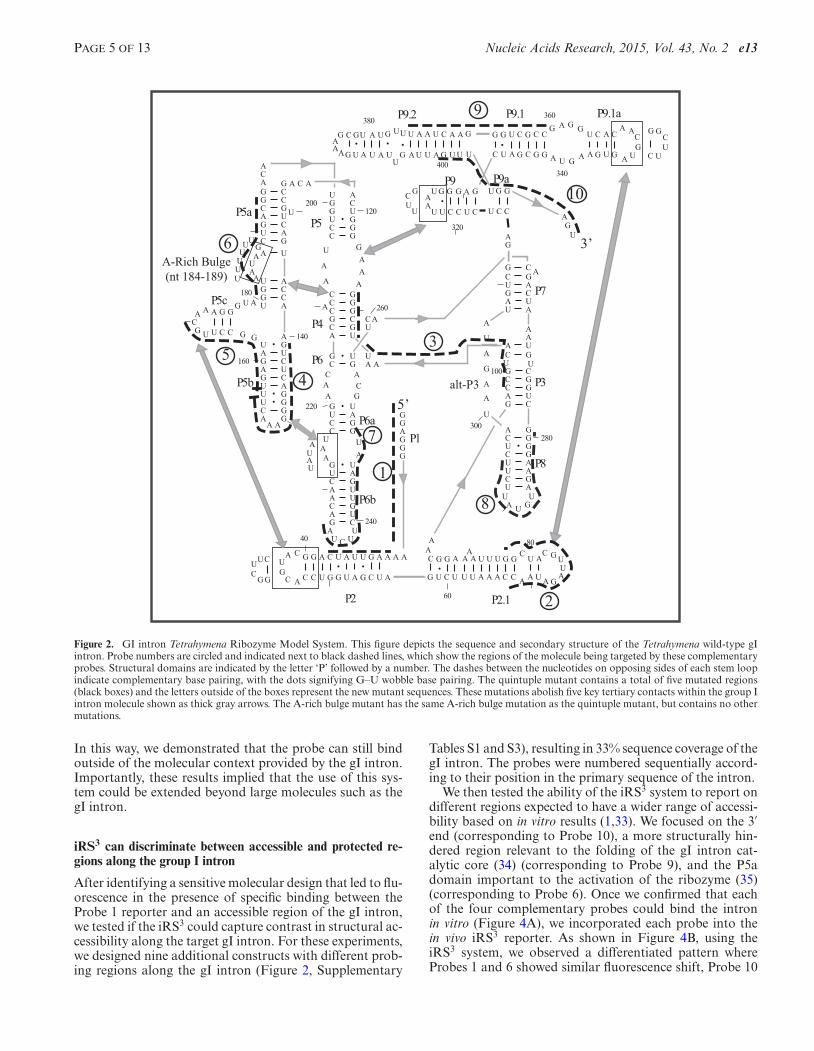
We then tested the ability of the iRS3 system to report ondifferent regions expected to have a wider range of accessi-bility based on in vitro results (1,33). We focused on the 3′end (corresponding to Probe 10), a more structurally hin-dered region relevant to the folding of the gI intron cat-alytic core (34) (corresponding to Probe 9), and the P5adomain important to the activation of the ribozyme (35)(corresponding to Probe 6). Once we confirmed that eachof the four complementary probes could bind the intronin vitro (Figure 4A), we incorporated each probe into thein vivo iRS3 reporter. As shown in Figure 4B, using theiRS3 system, we observed a differentiated pattern whereProbes 1 and 6 showed similar fluorescence shift, Probe 10

e13 Nucleic Acids Research, 2015, Vol. 43, No. 2 PAGE 6 OF 13
Probe 1 Reporter Probe 1 Reporter
Interaction
Complementary Fragment
Wild Type Structural Context Control
Local Specific Binding Control
No Expression Control
Group I intron
Probe 1 ReporterInteraction
Strain MG1655 MG1655∆araC MG1655 MG1655
- +
+
-
-
Induction of target RNA
Induction of Probe 1 reporter
A B C D
+
Fluo
resc
ence
(Arb
itrar
y U
nits
)
4
4.5
5
5.5
6
6.5
7
7.5
8
+
+
-
-
+
+
-
-
+
+
-
-
No Interaction
MutantGroup I intron
Probe 1 Reporter
Figure 3. Fluorescence shifts result from specific interactions between the reporter and the trans target RNA. (A) The wild-type sample shows the in-teraction between wild-type intron and the IRS3-Probe 1 construct. (B) The wild-type intron and the IRS3-Probe 1 transformed into a �araC knockoutstrain to impair expression of the group I intron. (C) The IRS3-Probe 1 construct with an intron where 9/16 nucleotides in the target region are mutated,such that Probe 1 is no longer as specific to its target region. (D) The IRS3 -Probe 1 construct co-expressed with a shorter target RNA that contains acomplementary sequence to Probe 1. The box plots represent the 75% quartile (upper red line), the median (middle red line) and the 25% quartile (lowerred line) of the median fluorescence of at least quadruplicate samples. Whiskers above and below the box plot indicate the furthest data point that is within1.5× the interquartile range from the box.
showed the largest shift in fluorescence and Probe 9 thelowest shift in fluorescence upon intron induction. We alsodemonstrated using northern blotting analysis that the flu-orescence observed from these probes does not correlatewith detected levels of the probe-iRS3 mRNA transcript(Supplementary Figure S2). These results suggested that theiRS3 system could detect differences in accessibility betweentarget regions by differential shifts in fluorescence.
It is important to note that prior to testing the differentreporters, we performed a computational analysis using theNUPACK (27) software suite to test the probe sequences forself-dimerizations or unwanted hairpin formation (see Ma-
terials and Methods: Computational Analysis of Probes).We also used NUPACK to test for the strand-to-strandbinding affinity between the iRS3 reporters and the targetWTI. All probes designed and tested in this study were pre-dicted to bind with the target region on the intron withoutmany side interactions (data not shown), albeit with rela-tively different strength. As a result, we expected that eachiRS3 reporter probe needed to be individually normalized.That is, as confirmed experimentally, each probe affectedthe intrinsic stability of the hairpin in the iRS3 constructdifferently and lead to varying baseline levels of fluores-cence. Differential baseline levels of fluorescence observed

PAGE 7 OF 13 Nucleic Acids Research, 2015, Vol. 43, No. 2 e13
Denatured Tetrahymena group I intron
Probe 1 Probe 6 Probe 10Probe 9
B
A
Probe reporter 1
Fluorescence (Abritrary Units)
Probe reporter 9
Fluorescence (Abritrary Units)
Probe reporter 10
Fluorescence (Abritrary Units)
Fluorescence (Abritrary Units)
Probe reporter 6
Figure 4. Pilot test reveals that fluorescence assay can detect relative levels of accessibility. (A) In vitro binding assays show that the probes can bind to thegI intron. Total cellular RNA containing the gI intron was extracted from cells, denatured and then hybridized to the corresponding P32 labeled probe.The resulting hybridized mixture was loaded onto a native polyacrylamide gel, dried and imaged. Black arrows point to the location of the gI intron band.(B) Representative flow cytometry curves from cells harboring the gI intron and the IRS3 construct non-induced (blue) induced (red) samples after 5 h.
between probes can also be explained by the presence of alow amount of gI intron (confirmed by northern blottinganalysis, data not shown), even under non-inducing condi-tions.
Assaying a probe library along the group I intron
After confirming that the iRS3 could discriminate betweendifferent levels of accessibility along the target RNA by dis-playing differential levels of fluorescence, we tested if fluo-rescence shifts represented a good measure of accessibilityacross a wide range of probes. We confirmed the binding ca-pabilities of all probes to the gI intron by conducting in vitrobinding assays in which we hybridized 5′P32 labeled probes
to denatured total RNA extracted from E. coli cells overex-pressing the gI intron (Supplementary Figure S3). After wesaw that the probes could bind to the denatured intron, weincorporated the remainder of our designed probes into thestructure sensing system and co-expressed each constructwith the gI intron in cells. According to previous in vitrostudies: (i) Probes 3, 4, 5 and 6 target important regions forthe catalytic activity of the intron (36,37), (ii) Probes 2, 5and 6 target key tertiary contacts (38), (iii) Probe 7 targetsthe P6a and P6b domains of the gI intron (5) and (iv) Probe3 (domains P3 and P4) targets a heavily base-paired regionlikely in the interior of the molecule and thus relatively hin-dered (33). By selecting these key areas, we anticipated a

e13 Nucleic Acids Research, 2015, Vol. 43, No. 2 PAGE 8 OF 13
Figure 5. iRS3 can capture difference in accessibility along the length of the wild-type group I intron. (A) Fluorescence shifts resulting from probingdifferent regions along the length of the group I intron. The dashed line represents the median of the fluorescence shift means for all probes. The calculationof standard error is described in the Materials and Methods section. (B) Map of the wild-type Tetrahymena gI intron marked with the relative accessibility forregions as determined by comparison of their fluorescence shifts. The data are separated into two general categories with regions showing protection (blue)or higher accessibility (red). Regions whose fluorescence shift mean falls within one standard deviation of the overall median in Panel A (dashed line) wereconsidered in between (gray). (C) Footprinting data for regions assayed by probes. In vivo DMS data, performed as part of this work (Supplementary FigureS5), were discretized by considering the normalized DMS reactivity (DMS reactivity = DMS – no DMS) values between 0.5 and 1.5 as mildly protected(gray), values below 0.5 as protected (blue) and values over 1.5 as exposed (red). The in vitro DMS and hydroxyl radical footprinting data were adaptedfrom (40*) using an equivalent discretization scheme. All chemical reactivities were normalized by the global average reactivity. Nucleotides marked inwhite indicate that the footprinting method is not capable of detecting accessibility for this nucleotide. *Within (40), see Appendix A and SupplementaryFigure S1.
wide representation of accessible and inaccessible regionsas well as biologically relevant areas within the intron.
As shown in Figure 5A, we observed meaningful differ-ences in the accessibility of the regions probed. We calcu-lated statistical error using the SEM for the fluorescenceshift, as propagated from the SEM of multiple determi-nations (≥4) of fluorescence at non-inducing and inducingconditions. We determined that accessibility of regions was
statistically different from each other when the means of ourobservations differed by at least two standard errors. Us-ing this highly stringent metric, we concluded that Probes3 and 7 were significantly more exposed than Probes 2, 4,5 and 9. This observation supported that the iRS3 systemcan discriminate between exposed and protected regions.We then categorized each region as exposed, protected orin between based on comparing each fluorescence shift to

PAGE 9 OF 13 Nucleic Acids Research, 2015, Vol. 43, No. 2 e13
the median accessibility of all regions (Figure 5B). To de-termine if the inherent thermodynamic properties of eachprobe could cause the observed fluorescence patterns, weplotted the MFE of the bound complex between the probesequence and the specific target region versus the normal-ized fluorescence shift. As can be seen from SupplementaryFigure S4, there is no significant bias in the binding affin-ity of the probes (note that the slope of the trend line andthe R2 value approximate to zero and, points are randomlydistributed around the trend line).
To explain the general accessibility of each target region,we conducted an in vivo DMS footprinting analysis cover-ing approximately 92% of the entire intron (except about35 nucleotides at the 3′ and 5′ ends of the intron). Addi-tionally, we compared the iRS3 results to structural stud-ies of the group I intron reported in the literature (1,5,39–40). A particularly useful study was performed by Russellet al. when they explored the structure of the group I intronusing DMS footprinting and hydroxyl radical footprintingin vitro (40). We found reliable consistency between in vivoand in vitro DMS footprinting of the group I intron struc-ture when looking at the overall protection level of each areatargeted by our different probes (Figure 5C, SupplementaryFigure S5). In general, our iRS3 reporters show some agree-ment with the in vitro hydroxyl radical footprinting (40) andDMS footprinting data (Figure 5). Specifically, the regiontargeted by Probe 5 appear to be protected, Probes 4 and6 targeted regions appear to be moderately protected andexposed respectively and, Probes 7 and 8 regions appear tobe more exposed when doing a qualitative assessment of allthree footprinting patterns (Figure 5C). Overall, we notedtwo major differences when comparing Figure 5B and C.
First, in general the footprinting results generally esti-mate an overall higher exposure level (Figure 5C) for the re-gion targeted by Probe 9 than iRS3 determinations (Figure5A). This difference is likely due to the region being a stableand heavily based-paired helix (34) potentially more diffi-cult to be disrupted by oligonucleotide hybridization thanmodified by chemical probes. The discrepancy between hy-droxyl radical footprinting and iRS3 is reasonably logicalgiven that hydroxyl radical footprinting cleaves the RNAphosphodiester backbone and this cleavage is less influ-enced by base pairing in the intron structure (1,39). WhileDMS footprinting identified a few exposed nucleotides inthe Probe 9 target region, this region has enough protectedand undetermined nucleotides to preclude drawing conclu-sions about the global region’s accessibility from in vivoDMS. These findings strongly suggest that the iRS3 is ameasure of global accessibility that may provide differentinformation, specifically, how available an entire region isto form base-pairing interactions.
Second, iRS3 accessibility results for the region assayedby Probe 3 appear to contradict all footprinting studies ingeneral (Figures 5 and 6A). We reasoned that the greateraccessibility of this region to the IRS3 reporter could reflectan ability of the probe to interact with folding intermedi-ates in which the complementary segment of the intron isexposed. This hypothesis was supported by previous find-ings that transitions from some folding intermediates to thenative form require transient disruption of the long-rangeP3 base pairs (41,42). Upon P3 disruption, the 5′ strand of
P3 is expected to be accessible to Probe 3, while the 3´ strandmost likely forms the alternative base pairs alt P3 (43). Totest whether the accessibility of Probe 3 depends on expo-sure of the P3 region, we split up the targeted area into twoshorter target sequences: P3 (nt 95–104 targeted by Probe3a, 10 nucleotides) and P4 (nt 104–112 targeted by Probe 3b,9 nucleotides) (Figure 6B). After demonstrating that theseshorter probes bound to the group I intron in vitro (Sup-plementary Figure S3), we incorporated the probes intothe iRS3 construct. Interestingly, Probe 3a showed an evenhigher fluorescence shift than Probe 3 while Probe 3b dis-played no fluorescence shift (Figure 6C). We conclude thatindeed, the high accessibility to Probe 3 likely arises frominteraction with the 5′ strand of P3, probably because theprobe is able to interact with and partially folded trappedintermediate (see Discussion). These results also confirmedour ability to obtain higher structural resolution in our sys-tem when using shorter probes.
iRS3 can discriminate between group I intron mutants
We also examined if our system could be used to assay struc-tural differences between RNA variants. For these experi-ments, we compared the wild-type gI intron to two intronvariants, the quintuple mutant and the A-rich bulge mu-tant (37). The quintuple mutant contains mutations in fivecritical tertiary contacts (Figure 2) that are known to behighly disruptive to the tertiary structure and catalytic ac-tivity of the intron (38). Based on this, we hypothesized thatthe quintuple mutant would exhibit significant differencesin accessibility using the IRS3 relative to the WTI. Giventhat most of the targeted regions of the intron remained un-altered (at the primary sequence level) in the quintuple mu-tant, we used the same library of probe-reporters designedfor the wild-type gI intron. As for the A-rich bulge mutant,it is a milder variant than the quintuple mutant as it disruptsonly one tertiary contact (P5a, Figure 2).
As shown in Figure 7, expression of the quintuple mu-tant results in significantly different shifts in fluorescence(marked with asterisks) relative to the WTI for Probes 1,2 and 7 (Supplementary Table S4). From these results, welearned that a couple of areas of the intron become more ac-cessible to oligonucleotides in vivo (e.g. domains P1 (Probe1) and P6ab (Probe 7)), while others become more protectedas a result of the quintuple mutations (e.g. domain P2.1, cor-responding to Probe 2). Furthermore, the increase in the av-erage fluorescence observed in the quintuple mutant relativeto the WTI (∼30%) indicates the potential of capturing in-creased molecular accessibility in the quintuple mutant thatresults from its lack of tertiary structure relative to the WTI(44). On the other hand, the A-rich bulge mutant shows po-tential differences mostly around the area of mutations, do-main P5ac (Probes 4 and 5). The P5abc domain is known tobe important to the stabilization and catalytic activity of theintron (33), and it is plausible that mutations affect tertiarycontacts in this local area. It is important to note that the9/10 probes were designed to target regions in the mutantsthat contain the same sequence as the WTI.
The area targeted by Probe 3 displayed particular differ-ences in accessibility between the WTI and quintuple mu-tant. Specifically, Probe 3 showed an increased fluorescence

e13 Nucleic Acids Research, 2015, Vol. 43, No. 2 PAGE 10 OF 13
P7
P3100
5’
GACCG
UCA
AGACUA
AAUGU
CGGUC
A
A
G
A
U
AUAGUC
P6
P4
220
260
AAU
UGCGGG
AA
ACCA CGCA
GC
CAAG U
GCA
GU
UC A
3
CG3’
A3a
3b
A B
C
Probe 3 region secondary structure
alt-P3
0
0.5
1
1.5
2
3 3a 3bProbe
Probe 3 Region
0
1
2
3
4
5
6
C98 C102 A103 A104 A105 C109
DM
S re
activ
ity
Nucleotide
Fluo
resc
ence
shift
0
1
2
3
4
5
6
93 98 103 108 113
Ban
d in
tens
ity
Nucleotide number
Probe 3No DMS
DMS
Figure 6. iRS3 differs from in vivo DMS footprinting findings in the P3 domain of the gI intron. Panel (A) shows a relatively low DMS reactivity for the5′ strands of domains P3 and P4 in the gI intron suggesting an overall protected area. The upper plot is a representative footprinting pattern where thedashed box represents the region of interest. The lower plot is a subtraction between ‘DMS’ and ‘no DMS’ band intensities averaged for two independentdeterminations. Panel (B) illustrates the Probe 3 target area, where dash lines indicate the target segments of each probe and the letter ‘P’ followed by anumber indicates the different structural domains. Panel (C) shows the fluorescence shift for Probe 3 (domains P3 and P4) and shorter versions Probe 3a(domain P3) and Probe 3b (domain P4).
Probe1 2 3 4 5 6 7 8 9 10
A-richQuintuple
Wild Type Baseline
Fold
Cha
nge
rela
tive
to w
ild ty
pe
*
*
*
1
1.5
0.5
2
0
Figure 7. iRS3 can detect different levels of structural disruption in intron variants. Structural differences between the wild-type gI intron, quintuplemutant and A-rich bulge mutants were measured by calculating the change of the fluorescence shift from the wild type (Fold Change = Fluorescence shiftfor mutant using Probe X/Fluorescence shift for wild-type intron using Probe X). Standard error of the mean (SEM) for the fold change was calculated aspropagated from the SEM for the fluorescence shifts. Differences in accessibility (compared to the wild type) for a given region were considered statisticallysignificant (marked with asterisks) if the mean differed by at least two standard errors from the wild-type baseline (indicated as a dashed line).

PAGE 11 OF 13 Nucleic Acids Research, 2015, Vol. 43, No. 2 e13
shift in the quintuple mutant relative to the WTI indicatinghigher accessibility in this region. This was expected giventhat Probe 3 targets domain P3–P4, which does not prop-erly base pair in the quintuple mutant due to the absence ofrequired long-range interactions (33,45–47). Likewise, wecaptured differences between the WTI and the quintuplemutant via IRS3 fluorescence shifts in the P6b region (tar-geted by Probe 7). We expected that the P6ab area would bemore accessible in the quintuple mutant because this do-main normally contributes to a tertiary contact that hasbeen mutated in the quintuple mutant (5). Interestingly, forProbe 7, the A-rich bulge mutant shows a milder differencewith respect to the wild type than the one shown for thequintuple mutant. This finding supports the iRS3 sensitiv-ity to discriminate more subtle structural differences.
DISCUSSION
In this work, we have combined the traditional idea of us-ing nucleotide accessibility as a measure of RNA struc-ture (1,33) with a genetically encoded biosensor to sensethat availability. The novelty of our approach lies in thecreative implementation of oligo-hybridization probing di-rectly in living cells. In this work, we demonstrated the po-tential of the iRS3 to be used as a powerful tool in the studyof RNA structures in vivo. First, we showed the ability tocapture differential structural accessibilities (as defined bybase-pairing interactions) with high specificity within var-ious local regions throughout the Tetrahymena gI intron.We also established the ability of the iRS3 to capture struc-tural differences between wild type intron and a distant vari-ant (quintuple mutant). Finally we have also showcased theability of the iRS3 to sense milder mutations as it is the caseof the A-rich bulge mutant with respect to the quintuplemutant.
Despite the fact that most of the regions of the gI intronexhibited similar structural behaviors in vivo and in vitro, forthis stable model intron, we discovered some regions thatbehave differently when probed using oligonucleotides inliving cells. The most unambiguous example of regions thatbehave differently when probed with the iRS3 in vivo wasthe region P3 (assayed by Probe 3), which appeared signif-icantly more accessible by oligonucleotide hybridization invivo, relative to all three standard techniques: in vitro hy-droxyl radical footprinting and, in vitro and in vivo DMSfootprinting techniques. This difference could exist becausethe misfolded RNA is not at a high enough concentration tobe detected by classical primer extension, but is detectablethrough oligonucleotide probing.
Figure 8 illustrates the fundamental differences in usingoligonucleotide probes versus small molecules for in vivoRNA structural probing that can explain increased sensi-tivity to the detection of low abundance intermediates inour iRS3 approach. We illustrate the simplest case of a twostate folding equilibrium system to represent the dynamicsof folding in a region (Region X) presumed to be mostlyprotected (State 1). However, as expected given dynamicfolding equilibrium, other structural conformations are alsoobserved. These structures may be more exposed (e.g. State2), but appear at a lower frequency (indicated by the largerequilibrium arrow pointing to State 1, Figure 8A). Based on
Target RNA
Region X
State 1protected
Small molecule
Oligonucleotide
A
B
C
Modification site
State 2>>>accessible
Figure 8. Oligonucleotide versus small-molecule in vivo structural prob-ing. (A) Equilibrium between two conformations of the target RNA. Theconformation on the left (State 1) exhibiting relative protection for RegionX is more favorable. The less favorable alternative conformation (State 2)on the left exhibits increased exposure of Region X. The equilibrium ar-rows indicate the relative abundance of each state. (B) The addition of asmall molecule to react with the target RNA results in single-hit kineticswhere, on average, at most one specific A or C nucleotide (in the case ofDMS footprinting) is modified per molecule (‘X’ representing site of mod-ification); the figure illustrates the low likeliness of modifying nucleotideswithin Region X. Equilibrium shown is same as described above. (C) Anoligonucleotide has an increased probability to hit and bind Region X asit bares full base-pairing complementarity to Region X. Additionally, theoligonucleotide can benefit from capturing the less-favorable State 2 bylocking the target RNA at the more exposed conformation, shifting theequilibrium toward the less favorable alternative conformation (illustratedby the longer blue arrow, relative to panels A and B).
these dynamics, the potential of modifying Region X (dur-ing its less favorable but more accessible equilibrium states)by a small molecule like DMS is rather low (Figure 8B). Thisis due to the intrinsic single-hit kinetics of these chemicalprobing approaches that result in, at most, one modificationper molecule. These modifications can happen at any cyti-dine or adenosine of the molecule not specifically within thetarget region. In contrast, an oligonucleotide that has strongcomplementarity for a target region can bind with highspecificity to its target. This oligonucleotide–target interac-tion can lock less-favorable structures in that state, shiftingthe equilibrium toward less abundant conformations andgiving a signal for exposure that is larger than the exposureof the region in the absence of probe, when exposure is con-sidered as a fraction of the RNA population (Figure 8C).We suggest that this process underlies the ability of iRS3 tocapture the presence of low level folding intermediates thatare accessible to Probe 3, whereas these intermediates arenot observed in the steady state by DMS or hydroxyl rad-ical footprinting methods (540). The ability of the iRS3 tocapture folding equilibrium intermediates of importance tothe RNA folding pathway makes it a useful complement tocurrent in vivo small-molecule-based structural probing ap-proaches.

e13 Nucleic Acids Research, 2015, Vol. 43, No. 2 PAGE 12 OF 13
We believe that the structural information gained fromthe iRS3 can enrich in vivo RNA structural studies for a cou-ple of reasons. First, the ability of the iRS3 to capture fold-ing equilibrium intermediates of the RNA folding pathwaymakes it a useful complement to current structural prob-ing approaches. Second, iRS3 probing provides a funda-mentally different measure of structural accessibility thanchemical methods, namely that accessibility of a region canbe interpreted as the availability of a given region to partic-ipate in interactions with other macromolecules (i.e. DNA,RNA). Given these capabilities, potential applications ofthe iRS3 include detecting alternative structural conforma-tions, and observing the structural effects of tuning RNA–RNA interfaces using mutations.
Another major appeal of this in vivo oligonucleotide-based structural probing approach is the ability to designthe central riboregulator of the system to sense any tar-get RNA in a rational way. Simple manipulation of theiRS3 plasmid (e.g. making plasmid compatible for goldengate cloning) should make the system highly amenable forrapid insertion of any probe of choice. Although this systemcould be incorporated in other organisms beyond E. coli,further studies are required to determine if the iRS3systemcan detect RNAs at native levels. Given these advantages,our method has the potential to provide a relatively easy-to-use platform to capture dynamic structural changes in awide range of RNAs within living systems.
SUPPLEMENTARY DATA
Supplementary data are available at NAR Online.
ACKNOWLEDGEMENTS
We would like to thank Dr Rick Russell for his kind gift ofthe gI intron mutants, the L-21/ScaI plasmid, the use of acapillary electrophoresis (CE) system, for providing us withthe in vitro DMS footprinting raw data from Russell et al.(40) and for meaningful discussions throughout the courseof the project. Special thanks to Brant Gracia and LukeWard from the Russell lab for their assistance on the opera-tion of the CE system and other meaningful discussions. Wewould also like to thank Dr James Collins for his generousgift of the pZER riboregulator plasmid used in this work.We also acknowledge Fade Gong who helped with the ini-tial design of the reporter system, Mathew Pribadi for hisassistance in molecular cloning and Grant Gelderman forhis assistance with the DMS footprinting.Author contributions. Designed research: K.D., C.C., R.D.,M.K., E.F., S.S., J.V.A., L.M.C.; performed experiments:S.S., J.V.A., C.C., M.K., E.F., R.D., K.D.; analyzed data:S.S., J.V.A., E.F., C.C., M.K., R.D., L.M.C.; wrote paper:L.M.C., S.S. and J.V.A.
FUNDING
Welch Foundation [F-1756]; National Science Founda-tion [MCB 1330862]; Consejo Nacional de Ciencia y Tec-nologıa [CONACYT-194638 to J.V.A.]. Funding for openaccess charge: Welch Foundation [F-1756]; National Sci-ence Foundation CAREER Program [CBET-1254754]; Air
Force Office of Scientific Research (AFOSR) Young Inves-tigator Program [FA9550-13-1-0160].Conflict of interest statement. None declared.
REFERENCES1. Tijerina,P., Mohr,S. and Russell,R. (2007) DMS footprinting of
structured RNAs and RNA-protein complexes. Nat. Protocols, 2,2608–2623.
2. Edwards,A., Garst,A. and Batey,R. (2009) Chapter 9: DeterminingStructures of RNA Aptamers and Riboswitches by X-rayCrystallography . In: Mayer,G (ed.). Nucleic Acid and PeptideAptamers, Vol. 535. Humana Press, New York, pp. 135–163.
3. Scott,L. and Hennig,M. (2008)Chapter 2: RNA StructureDetermination by NMR . In: Keith,J (ed.).Bioinformatics, Vol. 452. Humana Press, New York, pp. 29–61.
4. Shcherbakova,I. and Brenowitz,M. (2008) Monitoring structuralchanges in nucleic acids with single residue spatial and millisecondtime resolution by quantitative hydroxyl radical footprinting. Nat.Protocols, 3, 288–302.
5. Wan,Y., Suh,H., Russell,R. and Herschlag,D. (2010) Multipleunfolding events during native folding of the Tetrahymena Group IRibozyme. J. Mol. Biol., 400, 1067–1077.
6. Wurst,R.M., Vournakis,J.N. and Maxam,A.M. (1978) Structuremapping of 5′-32P-labeled RNA with S1 nuclease. Biochemistry, 17,4493–4499.
7. Zemora,G. and Waldsich,C. (2010) RNA folding in living cells. RNABiol., 7, 634–641.
8. Emerick,V.L. and Woodson,S.A. (1993) Self-splicing of theTetrahymena pre-rRNA is decreased by misfolding duringtranscription. Biochemistry, 32, 14062–14067.
9. Zhang,F., Ramsay,E.S. and Woodson,S.A. (1995) In vivo facilitationof Tetrahymena group I intron splicing in Escherichia colipre-ribosomal RNA. RNA, 1, 284–292.
10. Schroeder,R., Grossberger,R., Pichler,A. and Waldsich,C. (2002)RNA folding in vivo. Curr. Opin. Struct. Biol., 12, 296–300.
11. Lindell,M., Romby,P. and Wagner,E.G.H. (2002) Lead(II) as a probefor investigating RNA structure in vivo. RNA, 8, 534–541.
12. Wells,S.E., Hughes,J.M., Igel,A.H. and Ares,M. Jr. (2000) Use ofdimethyl sulfate to probe RNA structure in vivo. Methods Enzymol.,318, 479–493.
13. Kertesz,M., Wan,Y., Mazor,E., Rinn,J.L., Nutter,R.C., Chang,H.Y.and Segal,E. (2010) Genome-wide measurement of RNA secondarystructure in yeast. Nature, 467, 103–107.
14. Spitale,R.C., Crisalli,P., Flynn,R.A., Torre,E.A., Kool,E.T. andChang,H.Y. (2013) RNA SHAPE analysis in living cells. Nat. Chem.Biol., 9, 18–20.
15. Wan,Y., Kertesz,M., Spitale,R.C., Segal,E. and Chang,H.Y. (2011)Understanding the transcriptome through RNA structure. Nat. Rev.Genet., 12, 641–655.
16. Lai,D., Proctor,J.R. and Meyer,I.M. (2013) On the importance ofcotranscriptional RNA structure formation. RNA, 19, 1461–1473.
17. Grohman,J.K., Gorelick,R.J., Kottegoda,S., Allbritton,N.L., Rein,A.and Weeks,K.M. (2014) An immature retroviral RNA genomeresembles a kinetically trapped intermediate state. Journal of virology,88, 6061–6068.
18. Isaacs,F.J., Dwyer,D.J., Ding,C., Pervouchine,D.D., Cantor,C.R. andCollins,J.J. (2004) Engineered riboregulators enablepost-transcriptional control of gene expression. Nat. Biotechnol., 22,841–847.
19. Vazquez-Anderson,J. and Contreras,L.M. (2013) Regulatory RNAs:charming gene management styles for synthetic biology applications.RNA Biol., 10, 1778–1797.
20. Kruger,K., Grabowski,P.J., Zaug,A.J., Sands,J., Gottschling,D.E. andCech,T.R. (1982) Self-splicing RNA: autoexcision andautocyclization of the ribosomal RNA intervening sequence ofTetrahymena. Cell, 31, 147–157.
21. Koduvayur,S.P. and Woodson,S.A. (2004) Intracellular folding of theTetrahymena group I intron depends on exon sequence and promoterchoice. RNA, 10, 1526–1532.
22. Golden,B.L., Gooding,A.R., Podell,E.R. and Cech,T.R. (1998) Apreorganized active site in the crystal structure of the TetrahymenaRibozyme. Science, 282, 259–264.

PAGE 13 OF 13 Nucleic Acids Research, 2015, Vol. 43, No. 2 e13
23. Cech,T.R., Damberger,S.H. and Gutell,R.R. (1994) Representationof the secondary and tertiary structure of group I introns. Nat.Struct. Mol. Biol., 1, 273–280.
24. Russell,R., Zhuang,X., Babcock,H.P., Millett,I.S., Doniach,S.,Chu,S. and Herschlag,D. (2002) Exploring the folding landscape of astructured RNA. Proc. Natl. Acad. Sci., 99, 155–160.
25. Kieft,J.S. and Tinoco,I. (1997) Solution structure of a metal-bindingsite in the major groove of RNA complexed with cobalt (III)hexammine. Structure, 5, 713–721.
26. Waring,R.B., Ray,J.A., Edwards,S.W., Scazzocchio,C. andDavies,R.W. (1985) The Tetrahymena rRNA intron self-splices in E.coli: in vivo evidence for the importance of key base-paired regions ofRNA for RNA enzyme function. Cell, 40, 371–380.
27. Zadeh,J.N., Steenberg,C.D., Bois,J.S., Wolfe,B.R., Pierce,M.B.,Khan,A.R., Dirks,R.M. and Pierce,N.A. (2011) NUPACK: analysisand design of nucleic acid systems. J. Comput. Chem., 32, 170–173.
28. DiChiara,Jeanne M., Contreras-Martinez,Lydia M., Livny,Jonathan,Smith,Dorie, McDonough,Kathleen A. and Belfort,Marlene (2010)Multiple small RNAs identified in Mycobacterium bovis BCG arealso expressed in Mycobacterium tuberculosis and Mycobacteriumsmegmatis. Nucleic acids research, 38, 4067–4078 [PubMed].
29. Hee Cho,Seung, Lei,Roy, Trey,D. Henninger and Lydia,M.Contreras (2014) Discovery of ethanol-responsive small RNAs inZymomonas mobilis. Applied and environmental microbiology, 80,4189–4198 [PubMed].
30. Contreras,L.M., Huang,T., Piazza,C.L., Smith,D., Qu,G.,Gelderman,G., Potratz,J.P., Russell,R. and Belfort,M. (2013) GroupII intron-ribosome association protects intron RNA fromdegradation. RNA, 19, 1497–1509.
31. Waldsich,C., Grossberger,R. and Schroeder,R. (2002) RNAchaperone StpA loosens interactions of the tertiary structure in the tdgroup I intron in vivo. Genes Dev., 16, 2300–2312.
32. Mitra,S., Shcherbakova,I.V., Altman,R.B., Brenowitz,M. andLaederach,A. (2008) High-throughput single-nucleotide structuralmapping by capillary automated footprinting analysis. Nucleic AcidsRes., 36, e63.
33. Zarrinkar,P.P. and Williamson,J.R. (1994) Kinetic intermediates inRNA folding. Science, 265, 918–924.
34. Zarrinkar,P. and Williamson,J. (1996) The P9.1–P9.2 peripheralextension helps guide folding of the Tetrahymena ribozyme. NucleicAcids Res., 24, 854–858.
35. Ikawa,Y., Yoshimura,T., Hara,H., Shiraishi,H. and Inoue,T. (2002)Two conserved structural components, A-rich bulge and P4 XJ6/7
base-triples, in activating the group I ribozymes. Genes Cells, 7,1205–1215.
36. Strobel,S.A. and Shetty,K. (1997) Defining the chemical groupsessential for Tetrahymena group I intron function by nucleotideanalog interference mapping. Proc. Natl. Acad. Sci., 94, 2903–2908.
37. Naito,Y., Shiraishi,H. and Inoue,T. (1998) P5abc of the Tetrahymenaribozyme consists of three functionally independent elements. RNA,4, 837–846.
38. Das,R., Kwok,L.W., Millett,I.S., Bai,Y., Mills,T.T., Jacob,J.,Maskel,G.S., Seifert,S., Mochrie,S.G.J., Thiyagarajan,P. et al. (2003)The fastest global events in RNA folding: electrostatic relaxation andtertiary collapse of the Tetrahymena Ribozyme. J. Mol. Biol., 332,311–319.
39. Lehnert,V., Jaeger,L., Michele,F. and Westhof,E. (1996) Newloop–loop tertiary interactions in self-splicing introns of subgroup ICand ID: a complete 3D model of the Tetrahymena thermophilaribozyme. Chem. Biol., 3, 993–1009.
40. Russell,R., Das,R., Suh,H., Travers,K.J., Laederach,A.,Engelhardt,M.A. and Herschlag,D. (2006) The paradoxical behaviorof a highly structured misfolded intermediate in RNA folding. J. Mol.Biol., 363, 531–544.
41. Mitchell,D. 3rd, Jarmoskaite,I., Seval,N., Seifert,S. and Russell,R.(2013) The long-range P3 helix of the Tetrahymena ribozyme isdisrupted during folding between the native and misfoldedconformations. J. Mol. Biol., 425, 2670–2686.
42. Mitchell,D. III and Russell,R. (2014) Folding pathways of theTetrahymena Ribozyme. J. Mol. Biol., 426, 2300–2312.
43. Pan,J. and Woodson,S.A. (1998) Folding intermediates of aself-splicing RNA: mispairing of the catalytic core. J. Mol. Biol., 280,597–609.
44. Benz-Moy,T.L. and Herschlag,D. (2011) Structure–function analysisfrom the outside in: long-range tertiary contacts in RNA exhibitdistinct catalytic roles. Biochemistry, 50, 8733–8755.
45. Woodson,S.A. (2005) Structure and assembly of group I introns.Curr. Opin. Struct. Biol., 15, 324–330.
46. Pan,J. and Woodson,S.A. (1999) The effect of long-range loop–loopinteractions on folding of the Tetrahymena self-splicing RNA. J. Mol.Biol., 294, 955–965.
47. Rangan,P., Masquida,B., Westhof,E. and Woodson,S.A. (2003)Assembly of core helices and rapid tertiary folding of a smallbacterial group I ribozyme. Proc. Natl. Acad. Sci., 100, 1574–1579.