expert report to judge rhodes 071814
TRANSCRIPT

1
UNITED STATES BANKRUPTCY COURT
EASTERN DISTRICT OF MICHIGAN
SOUTHERN DIVISION
In re: Chapter 9
City of Detroit, Michigan, Case No. 13-53846
Debtor, Hon. Steven W. Rhodes
___________________________/
EXPERT REPORT OF MARTHA E.M. KOPACZ
REGARDING THE FEASIBILITY OF THE CITY OF DETROIT PLAN OF
ADJUSTMENT
On April 22, 2014, Judge Rhodes entered an Order1 appointing me as the
Court’s expert witness. Pursuant to that Order, “(t)he Court’s expert shall investigate
and a reach a conclusion on:
(a) Whether the City’s plan is feasible as required by 11 U.S.C. § 943(b)(7);
and
(b) Whether the assumptions that underlie the City’s cash flow projections and
forecasts regarding its revenues, expenses and plan payments are
reasonable.”
I am providing this Report under Fed. R. Evid. 706(a). Should additional information
become available, I reserve the right to amend or supplement this Report.
1 Docket #4215, Order Appointing Expert Witness

2
Section A – Introduction, Scope and Approach
Introduction
I am a Senior Managing Director with Phoenix Management Services,
LLC (“Phoenix”), Boston, MA and my curriculum vitae is attached as Exhibit
1. I have been assisted throughout this engagement by my colleagues from
Phoenix. My billing rate is $595 per hour and the billing rates of my
colleagues range from $100 per hour to $550 per hour. As a courtesy, we are
reducing our rates by 10% in this case. I have testified previously as noted in
my proposal.2
Scope and Approach
The scope of my engagement is limited to providing an opinion only as to
feasibility of the Plan of Adjustment (“POA” or “Plan”) of the City of Detroit
(“Detroit” or the “City”). My engagement does not include providing an opinion
regarding the best interest of creditors. There is little applicable case law related to
what constitutes feasibility in a chapter 9 proceeding and even less guidance on my
2 Docket #4068, Notice Regarding Interviews of Expert Witness Applicants, pages
266-267
3
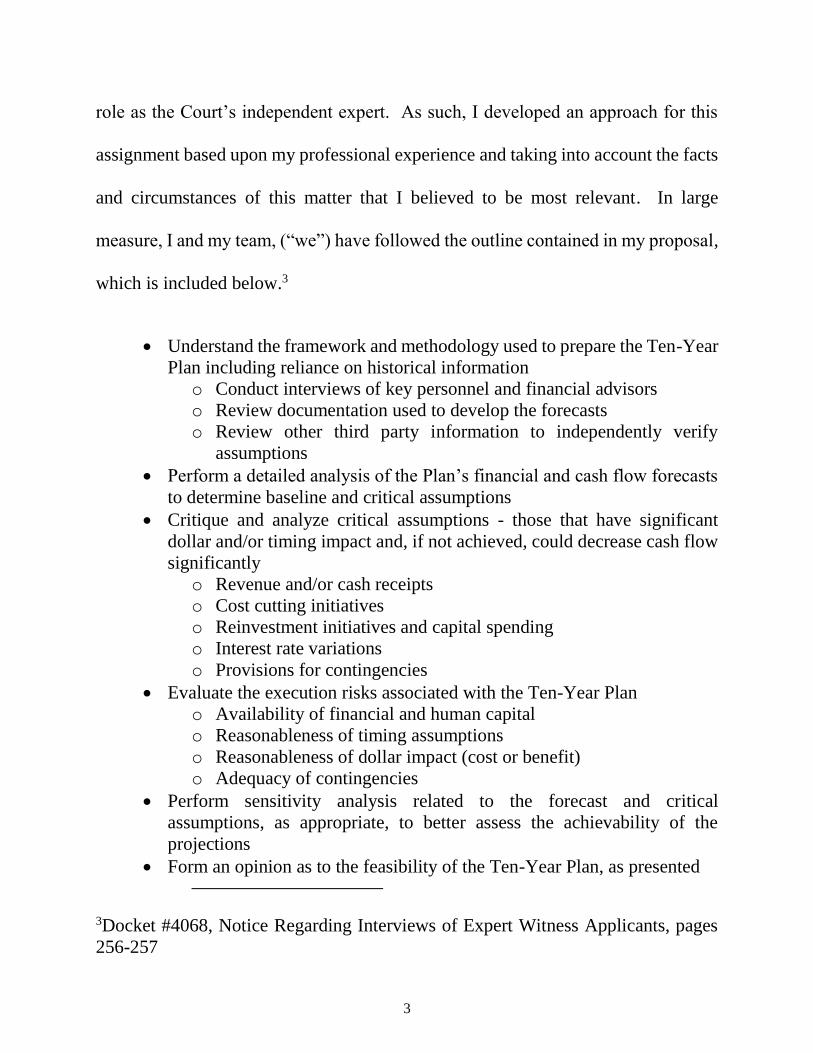
role as the Court’s independent expert. As such, I developed an approach for this
assignment based upon my professional experience and taking into account the facts
and circumstances of this matter that I believed to be most relevant. In large
measure, I and my team, (“we”) have followed the outline contained in my proposal,
which is included below.3
Understand the framework and methodology used to prepare the Ten-Year
Plan including reliance on historical information
o Conduct interviews of key personnel and financial advisors
o Review documentation used to develop the forecasts
o Review other third party information to independently verify
assumptions
Perform a detailed analysis of the Plan’s financial and cash flow forecasts
to determine baseline and critical assumptions
Critique and analyze critical assumptions - those that have significant
dollar and/or timing impact and, if not achieved, could decrease cash flow
significantly
o Revenue and/or cash receipts
o Cost cutting initiatives
o Reinvestment initiatives and capital spending
o Interest rate variations
o Provisions for contingencies
Evaluate the execution risks associated with the Ten-Year Plan
o Availability of financial and human capital
o Reasonableness of timing assumptions
o Reasonableness of dollar impact (cost or benefit)
o Adequacy of contingencies
Perform sensitivity analysis related to the forecast and critical
assumptions, as appropriate, to better assess the achievability of the
projections
Form an opinion as to the feasibility of the Ten-Year Plan, as presented
3Docket #4068, Notice Regarding Interviews of Expert Witness Applicants, pages
256-257
4
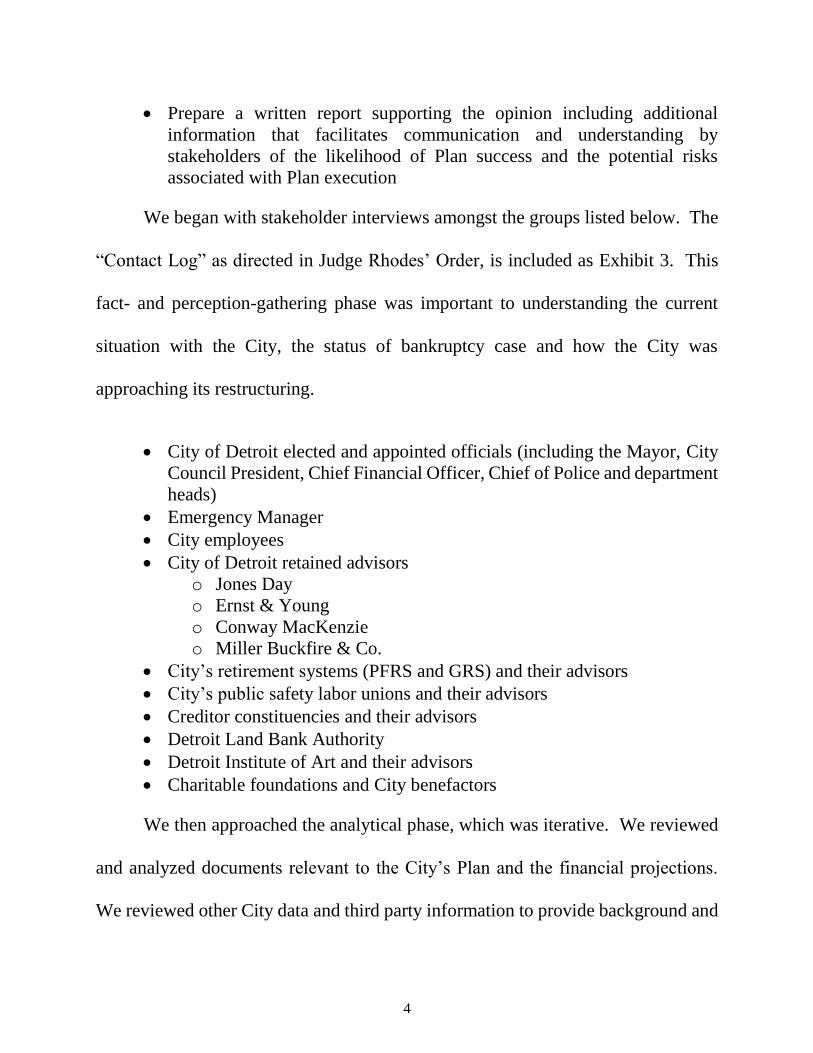
Prepare a written report supporting the opinion including additional
information that facilitates communication and understanding by
stakeholders of the likelihood of Plan success and the potential risks
associated with Plan execution
We began with stakeholder interviews amongst the groups listed below. The
“Contact Log” as directed in Judge Rhodes’ Order, is included as Exhibit 3. This
fact- and perception-gathering phase was important to understanding the current
situation with the City, the status of bankruptcy case and how the City was
approaching its restructuring.
City of Detroit elected and appointed officials (including the Mayor, City
Council President, Chief Financial Officer, Chief of Police and department
heads)
Emergency Manager
City employees
City of Detroit retained advisors
o Jones Day
o Ernst & Young
o Conway MacKenzie
o Miller Buckfire & Co.
City’s retirement systems (PFRS and GRS) and their advisors
City’s public safety labor unions and their advisors
Creditor constituencies and their advisors
Detroit Land Bank Authority
Detroit Institute of Art and their advisors
Charitable foundations and City benefactors
We then approached the analytical phase, which was iterative. We reviewed
and analyzed documents relevant to the City’s Plan and the financial projections.
We reviewed other City data and third party information to provide background and

5
perspective on the Ten Year (“10 Yr”) and Forty Year (“40 Yr”) projections and the
Restructuring and Reinvestment Initiatives (“RRIs”). We asked more questions of
the City, its advisors and other stakeholders, requested more information, and
analyzed that information. This process was repeated as necessary until our
questions were answered. Some general categories of data, documents and
information we reviewed and analyzed are identified below. A more complete
listing is included in Exhibit 2.
Court Documents – POA, Disclosure Statement, City Motions and
Creditors’ Objections, Eligibility Opinion, Court Orders, Court Docket
May 5, 2014 and July 2, 2014 10 Yr projections, 40 Yr projections and
RRIs, including working models
Third Party Reports
o Detroit Blight Removal Task Force Plan
o Detroit Future City Strategic Framework Plan
o Consulting reports – McKinsey
o State and various task force reports on Detroit’s financial condition
o Various federal, state and regional government reports
We critiqued the methodology used to develop the financial projections, as
well as the data and information used as the foundation for the assumptions. An
explanation of these models is contained in Part II, Section E. We identified the
assumptions used to create the June 2013 Baseline Projections and the assumptions
that formed the 40 Yr projections. We identified and analyzed the assumptions
contained in the RRIs and tested both projections (May 5th and July 2nd) for
mathematical integrity.
6
My assessment focused primarily on operations that are accounted for in the
City’s General Fund. In addition to the City’s General Fund activities, the City has
numerous operations that are accounted for in Enterprise Funds. Only Enterprise
Funds that have an impact on the City’s General Fund were evaluated to determine
their impact on the feasibility. 4
The Report
This Report is comprised of four parts. Part I includes my opinion and the
building blocks I used to formulate that opinion. This includes background and
contextual information that underpin my assessment as well as the definition I and
my team formulated for “feasibility” which establishes the framework for my
opinion. Part I includes Sections A through D.
Part II is comprised of Sections E through H and provides insight into the
quantitative factors that impact my feasibility assessment. Part III consists of
4For example the Detroit Department of Transportation (DDOT) operates primarily
as an Enterprise Fund but receives a significant subsidy from the General Fund to
fund negative cash flow in the Enterprise Fund; therefore, the failure of DDOT to
achieve its plans directly impacts the City General Fund.

7
Sections I through O and include those issues that affect feasibility in a qualitative
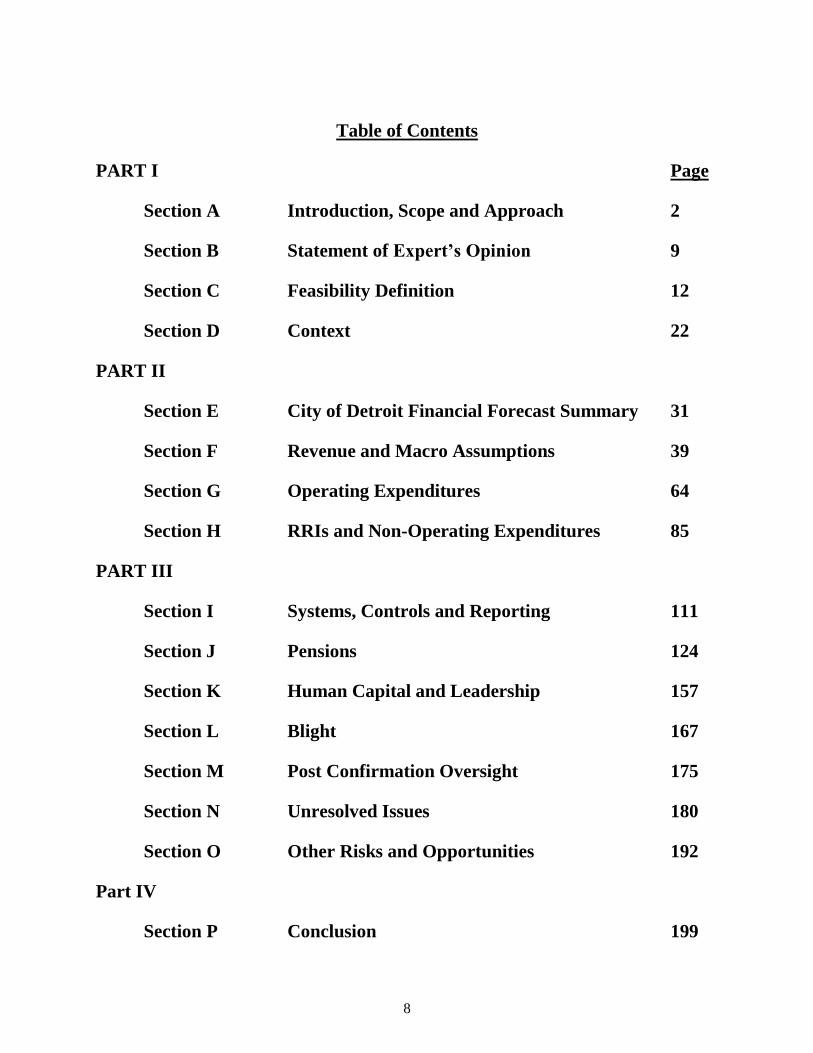
manner. Part IV contains the Conclusion. A Table of Contents follows.
8
Table of Contents
PART I Page
Section A Introduction, Scope and Approach 2
Section B Statement of Expert’s Opinion 9
Section C Feasibility Definition 12
Section D Context 22
PART II
Section E City of Detroit Financial Forecast Summary 31
Section F Revenue and Macro Assumptions 39
Section G Operating Expenditures 64
Section H RRIs and Non-Operating Expenditures 85
PART III
Section I Systems, Controls and Reporting 111
Section J Pensions 124
Section K Human Capital and Leadership 157
Section L Blight 167
Section M Post Confirmation Oversight 175
Section N Unresolved Issues 180
Section O Other Risks and Opportunities 192
Part IV
Section P Conclusion 199

9
Section B – Statement of Expert’s Opinion
On April 22, 2014, Judge Rhodes entered an Order5 appointing me as the
Court’s expert witness. Pursuant to that order, “(t)he Court’s expert shall investigate
and a reach a conclusion on:
(c) Whether the City’s plan is feasible as required by 11 U.S.C. § 943(b)(7);
and
(d) Whether the assumptions that underlie the City’s cash flow projections and
forecasts regarding its revenues, expenses and plan payments are
reasonable.”
This Report contains my expert opinion and the basis for that opinion. I was
assisted by my colleagues at Phoenix Management Services LLC. My work has
been guided by the approach that was outlined in my proposal6 and discussed during
5 Docket # 4215, Order Appointing Expert Witness
6 Docket # 4068, Notice Regarding Interviews of Expert Witness Applicants, pages
256 and 257

10
my interview on April 18, 20147. I, and members of my team, have conducted more
than two hundred interviews and fact gathering meetings with persons involved in
this matter or with persons I believed to be helpful to me in forming my opinion.
Based on this work, I conclude that:
(a) The City’s plan is feasible as required by 11 U.S. C. § 943(b)(7); and
(b) The assumptions that underlie the City’s plan of adjustment projections
regarding its revenues, expenses and plan payments are reasonable.
It should be noted that this opinion is rendered in an environment where there
are many factors that will have influence on the City’s conditions post confirmation
that are unknown and unknowable. Throughout this Report, I have noted some of
these factors, while other factors may not even be recognized today as potentially
having an impact. My opinion is necessarily limited by these unknown factors. It
should be recognized, that these factors, when known, could have a material impact
on my view of feasibility.
The above statement should only be viewed in the context of this entire
Report. No reliance should be made on these statements outside of the context of
this Report.
7 Transcript of Hearing, April 18, 2014

11
The remainder of this Report will provide my definition of feasibility, the
context in which I am rendering my opinion and my assessment of the key factors
affecting my feasibility assessment. While my opinion is arguably very narrowly
limited to “feasibility”, the assessment I and my team did to arrive at my opinion is
multifaceted. This Report attempts to clearly and succinctly lay out the foundation,
framework and details supporting my opinion.
The following section, Section C, addresses my definition of feasibility and
relies upon numerous resources – legal and otherwise – and my own experience to
establish the benchmarks against which I assessed feasibility. Section D discusses
the context in which I am rendering my opinion. While there are common
experiences among every restructuring and even among municipalities, the unique
mix that is Detroit and this chapter 9 proceeding, necessarily impact my perspective
and opinion. My intent is not to rehash every issue or pleading that has occurred in
this case or even Detroit’s recent history, but rather, to highlight a few aspects of the
facts and circumstances of this case which have had an important impact on the
formulation of my opinion. The last sections of the Report provide a more in depth
review of the issues, quantitative and qualitative, I found particularly relevant to my
assessment of feasibility. By no means does this Report include every factor I
reviewed or considered but does include those issues that shaped my opinion to the
greatest extent.
12
Section C – Feasibility Definition
Defining a Feasibility Standard
Section 943(b)(7) of the Bankruptcy Code requires that before a plan of
adjustment may be confirmed the Court must determine that the plan is feasible.
However, the Bankruptcy Code does not define “feasible.” Few chapter 9 cases
address the feasibility requirement8 and there is little in the way of authoritative
writing published regarding feasibility. 9
In assessing feasibility, I have examined available legal authority and
consulted with counsel and other experienced professionals to assist in the formation
of an appropriate approach to determining feasibility of the City’s POA. Every
8 In re Mount Carbon Metropolitan District, 242 B.R. 18, 31 (Bankr. D. Colo. 1999)
(“The Code does not define feasibility in Chapter 9 nor does it specify what factors
the Court should consider in determining whether the Plan is feasible. Due to the
relative rarity of Chapter 9 cases, neither the parties nor the Court have found case
law specifically addressing the issue.”)
9 Pryor, Scott C., Who Bears the Cost? The Necessity of Taxpayer Participation in
Chapter 9, (June 11, 2014) Available at SSRN, http://ssrn.com/abstract=2448997.
The author referring to feasibility: “(w)hat is merely unclear in chapter 11 is an
impenetrable fog in chapter 9.”

13
restructuring professional, with some degree of experience, probably believes they
understand what feasibility is and what it is not. However, in my early discussions
with professionals in this case, my own research, and consultations with
professionals not involved in the Detroit matter, I found a variety of nuanced points
of view regarding a definition of feasibility. Therefore, while it will ultimately be
up to the Court to articulate the precise legal parameters of feasibility in this Case,
I, along with the Phoenix team, have developed the following feasibility definition
(the “Standard”), which I believe is crucial to serving the Court’s purpose for my
appointment:
‘Is it likely that the City of Detroit, after the confirmation of the
Plan of Adjustment, will be able to sustainably provide basic
municipal services to the citizens of Detroit and to meet the
obligations contemplated in the Plan without the significant probability of a default?’
Two Dimensions of the Standard
While I believe that there are certain imposed limitations on feasibility within
this Standard, I have taken a relatively structured approach to my view of what is
included in feasibility. The Standard includes both quantitative and qualitative
components:

14
Quantitative
Are the projections contained in the POA mathematically correct and
materially reasonable?
Are the assumptions that the City has used to develop its projections
individually, and when taken as a group, reasonable?
Is there an adequate contingency included in the projections?
Qualitative
Does the City have the human resources, or can it likely recruit the human
resources, required to meet its obligations under the POA?
Does the City have the appropriate systems and procedures to monitor its
financial performance and to provide early warning signs of variances in
performance that might cause the City to fall short of the projections and
be unable to meet its obligations under the POA?
Are there appropriate structures to ensure the City’s compliance with the
POA and with reasonable government standards of operation?
Will the City be able to reasonably deliver a minimum level of municipal
services?
Is the City’s trajectory sustainable?
The quantitative assessment of feasibility is straightforward but exacting. As
will be more fully discussed in Part II, the projections10 in the POA are (correctly
10 For purposes of this Report, “projections in the Plan” are inclusive of the 10 Yr
plan, the 40 Yr plan and the RRIs. If only one of these is discussed, it will be noted.
The term “forecast” is often used as a synonym for “projections”. While this is not
technically correct within accounting literature, the terms will be used
interchangeably in this Report to provide variety. The term “model” is used in this
Report to describe the one or more excel spreadsheets that together form a financial
projection. A “values only model” or “flat model” is essentially a printout of the
excel spreadsheets, although it may be provided in electronic format rather than in
hard copy. A “working model” contains all the cell references, formulas and

15
so) quite detailed in many areas. Financial modeling is a highly subjective
undertaking that is affected by the assumptions made and the professional biases of
the analyst developing the model. Financial modeling is both a science and an art.
When the analyst forecasts growing revenue, declining costs, or a change in
headcount, he or she has a number of ways to write the mathematical formulas which
arrive at the intended numbers. In this case, the POA projections are comprised of
multiple forecasts, inclusive of hundreds of individual spreadsheets, prepared by
many different individuals and then concatenated into what we all simply call the
“projections”11. Simple questions, such as “are the salaries used to determine the
cost of newly hired employees reasonable?” become detailed. For example, the
salary estimates are multifaceted depending on which model and which analyst did
the modeling and appear in many of the RRI projections. Because of this, the
“macro” commands that are within the spreadsheets and allows a reviewer of the
model to understand what the inputs and assumptions are that create the projections.
It is in the working model that a reviewer can understand the “art” of the analyst’s
modeling.
11 Expert Report of Charles M. Moore, CPA, CTP, CFF in re City of Detroit,
Michigan. In footnote 2, Mr. Moore provides a similar explanation of modeling
methodology: “Given the number and diversity of the departments my team and I
examined, the specific methodology utilized was not exactly the same for each
department. Notwithstanding any particular deviations that were necessary, this core
methodology and approach was generally utilized across our analysis and
development of the Reinvestment Initiatives.” This is an example of differences that
can occur within a model built by the same firm. There were also differences in
modeling approach used by Conway MacKenzie, Mr. Moore’s firm, and Ernst &
Young, the City’s other financial advisor.
16
quantitative assessment of “reasonableness” surrounding the individual
assumptions, and assumptions taken as a group, of the POA projections was more
involved than I would have expected.
The qualitative aspects of the Standard include what I have come to refer to,
as “skill and will” and are as important as the quantitative assessment. Qualitative
aspects also include external influences that can affect the implementation of the
Plan. Part III, Section K – Leadership and Human Capital, discusses the City’s need
for more highly skilled employees. Another qualitative issue is the upcoming
transition from the leadership of the Emergency Manager to the leadership of Mayor
Duggan and his administration. When that transition occurs, there will be little more
than three years remaining within which the current elected officials will have the
responsibility to operate the City consistent with the POA – therefore political ‘will’
must be passed to future elected officials. This is not a problem limited to Detroit,
but to all municipal proceedings. Section M – Post-Confirmation Oversight
discusses ways to mitigate this variable.

17
The Aspect of Time on the Standard
A municipal government is an entity designed to exist in perpetuity.
Therefore, as we considered feasibility there is a requirement to determine the
timeframe for the feasibility assessment. As we developed the feasibility Standard,
we considered the following questions:
Given the electoral system and the requirement for strong leadership, do
we limit the timeframe to the next election cycle?
Is there some other timeframe at which feasibility stops? For example, if
after 5 years, visibility into the operations of the City becomes more
opaque, do we only consider the first 5 years?
Do we consider the timeframe over which financial commitments are made
in the POA? That is, do we look at the restructured pension obligations of
the retirees and current employees and attempt to determine whether the
POA is feasible during their entire lifetimes?
Ultimately, we based our Standard on an indeterminate time period.
However, I believe that the issues of feasibility must be viewed both in terms of their
quantitative or qualitative impact and the time horizon over which the impacts may
occur. That is, as the time horizon expands, so too does the magnitude required for
an issue to impact feasibility. For example, a potential $50 million shortfall in year
1 will have a much more significant impact on the assessment of feasibility than the
same shortfall in year 20.

18
The Standard Allows for a Range of Values
An additional aspect to my definition of feasibility is the concept that the
reasonableness of the quantitative and qualitative components of the Standard can
be a range of values. When looking at the reasonableness of assumptions and
projections, most people understand that “reasonable” can exist along a continuum.
Projections can be reasonable and favor the views of the debtor and projections can
be reasonable and favor the views of creditors. Of course, at the outer edges of
“reasonable”, values become unreasonable, either because they are exceptionally
conservative or wildly aggressive. We have evaluated the assumptions imbedded
with the financial forecasts within this continuum of reasonableness.
Detroit differs from a company emerging from chapter 11 in that the City does
not have to be service delivery solvent to emerge from bankruptcy. It will be on a

19
trajectory towards service delivery solvency12 and in some areas, the current level of
service is adequate. I do not need to envision that Detroit will become a best in class
municipality to determine that the POA is feasible. For Detroit, emerging from
essential services failure to adequate and reasonable service delivery will be a
success.13
What Feasibility is Not
When we developed the feasibility definition, we also considered what
feasibility does not include. First, and foremost, feasibility is not a guarantee. If the
City were to propose a plan under which, based on reasonable assumptions, the City
could not help but meet its obligations – effectively a guaranteed outcome – it is
likely that while feasible, such plan would not satisfy the best interests of creditors
test under section 943(b)(7) of the Bankruptcy Code.14
12 Eligibility Opinion of Judge Rhodes
13 Anderson, Michelle Wild “The New Minimal Cities” http://yalelawjournal.org/article/the-
new-minimal-cities; March 2014
14 The “best interest test of creditors” is specifically outside the scope of my
appointment and as such, is not part of the opinion I have formed. See Docket #4215,
Order Appointing Expert Witness, ¶2 and 3.

20
Similarly, but at the other end of the spectrum, a feasible plan should avoid
visionary schemes primarily based on “mere hopes, desires and speculation”15.
Further, the Court must determine whether there is a reasonable prospect of
successful completion of the proposed plan.16 As a point of reference, a frequently
cited legal standard for feasibility in Chapter 11 is whether the factual showing at
the plan confirmation hearing establishes a "reasonable assurance of success,"
though “success need not be guaranteed."17
Lastly, I do not believe the Standard entails: (1) whether the projections in the
POA may generate more cash to distribute and therefore provide greater recoveries
for creditors or (2) whether there may be alternative plans that could produce a better
outcome for the City or its creditors. During my team’s evaluation of feasibility, we
have been exposed to numerous views on these subjects. Because this is outside my
scope and not included in our Standard, I have not attempted to form, nor have I
formed, any opinion on these matters.
15 242 B.R. 18 (1999) in re Mount Carbon Metropolitan District.
16 Lawall, Francis J. and Miller, J. Gregg, Debt Adjustments for Municipalities
Under Chapter 9 of the Bankruptcy Code, a Collier Monograph, 2012.
17 Case, Stephen H., Some Confirmed Chapter 11 Plans Fail, So What?, 47 B.C. L.
Rev. 59 (2005), http://lawdigitalcommons.bc.edu/bclr/vol47/iss1/4.

21
In summary, the Standard we have defined includes both quantitative and
qualitative assessments of feasibility, including a risk assessment measured against
a time horizon and allows for a reasonable range of values within the projections.
This Standard is the backdrop against which the remainder of this Report should be
read.

22
Section D - Context
This section of the Report attempts to identify some of the contextual
parameters for my expert opinion. The role as the Court’s expert on feasibility is
both vast and specific, and subsumed within a unique set of facts and circumstances
surrounding the City of Detroit, its history and plethora of challenges. Included
amongst these topics are:
The impact of the bankruptcy process on the feasibility assessment
An “as is” perspective of Detroit which anchors my opinion
An explanation of what the Plan of Adjustment is and is not
Identification of factors that affect my opinion separate and apart from the
proposed POA
Bankruptcy Process Impact
I am humbled and honored to have been selected as the Court’s expert in this
matter. The speed with which this restructuring and bankruptcy case has progressed
is nothing short of extraordinary. The speed has been both an advantage and a
disadvantage to the feasibility of the POA.

23
The restructuring profession generally views quick trips through the
bankruptcy process to be advantageous for a variety of reasons: less distraction of
the management team, lower professional costs, more negotiated (vs. litigated)
solutions, quicker payments to creditors, and less uncertainty for employees and
vendors. This could all be true with the Detroit case.
However, I believe the speed of this proceeding has negatively impacted the
level of feasibility of the POA. This bankruptcy has been largely focused on
deleveraging the City, often to the exclusion of fixing the City’s broken operations.
The bilateral mediations between the City and the creditor groups worked well to
quickly deliver settlements of key disputes. However, the lack of time available for
multiparty negotiation has resulted in settlements that, taken in total, greatly reduce
the contingency available in the Plan. Pain sharing is an important component of
the restructuring process that helps ensure that all the stakeholders appreciate the
“size of the pie” as opposed to creating the proverbial “win-lose” tug of war between
the debtor and the creditor.

24
Detroit “As Is”
Detroit is at a tipping point. While some may consider the chapter 9 filing as
the low point in this great City’s history, I believe that it was the beginning of
creating what can become a virtuous cycle of revitalization, improving economics
and quality of life betterments for those who choose to live and work within the City.
It is hard to imagine that people with such diverse political and socio-economic
perspectives would have come together as they have in this process without the
bankruptcy filing. Traditional political maneuverings are working to Detroit’s
advantage and residents have the prospect of once again living in a community that
is more safe and supportive. Black, white, Republican, Democrat, poor, wealthy,
educated, illiterate and everyone in between have an opportunity to contribute to the
virtuous cycle of revitalization, or not.
The City of Detroit’s chapter 9 filing has justifiably received extensive
attention across international media and within legal and financial circles. The
outcomes will be referenced extensively for years, for what was accomplished and
arguably, what could have been accomplished during the proceedings. As the largest
chapter 9 to date, if any municipality ever needed the protection and tools of the
bankruptcy process, it is Detroit. At every level, Detroit was failing as a city – as
measured by the shrinking of its population, useful infrastructure and purposeful

25
enterprises - and as a government – as measured by its inability to deliver essential
services. Having spent a large amount of time in Detroit since my appointment, my
interaction with citizens, City employees and stakeholders in the bankruptcy have
influenced my view of both the in-court restructuring and the out-of-court work that
is equally important to Detroit’s ability to effectuate its POA.
The Plan of Adjustment
Even after many years of practice with dysfunctional, insolvent, operationally
troubled enterprises, I was confused by the City’s projections in POA. Section E of
this Report provides detail on how the projections and RRIs are structured. Suffice
it to say that the “10 Yr projections”, the “10 Yr/40 Yr projections,” and the
“Restructuring and Reinvestments Initiatives” form an unusual construct for a
financial plan for an enterprise attempting to emerge from bankruptcy. The baseline
projections (“10 Yr projection, Exhibit J to the Disclosure Statement) were prepared
in June 2013 to show what would happen to the City without a restructuring, which
they did very well. The “10 Yr/40 Yr projection” (Exhibit K in the Disclosure
Statement) expands the baseline, steady state projection for the 40 Yr time horizon
of the POA. Then, in order to begin to understand how the restructured Detroit might
operate – delivering services and paying creditors – one must factor in the RRIs

26
contained in Exhibit J to the Disclosure Statement. This is convoluted and
contributes to the feelings amongst many creditors in this case that the financial
projections in the POA are a “black box” and that it was the City’s intent to obfuscate
important information. I choose to believe that is was simply an unfortunate result
of two advisory firms sharing responsibilities18 rather than one firm “owning” the
financial projections start to finish, as is, and should be, the norm.
The City’s Plan of Adjustment is primarily limited to a “balance sheet”
restructuring, as chapter 11 veterans would characterize it, and it includes only some
of the City’s operations. This is loosely analogous to a company that files a
bankruptcy for the parent company and some, but not all, of the subsidiaries. The
chapter 9 proceeding has been overwhelmingly focused on deleveraging the City for
the long term, reducing future obligations. That is good. However, the operational
restructuring that often occurs with commercial reorganizations will be left largely
to Mayor Duggan and his managers for the post confirmation period. That is
18Ernst & Young, originally retained by the City of Detroit in May 2011, and
Conway MacKenzie, originally retained by the City of Detroit in January 2013, have
served the City post-petition in a collaborative arrangement. Each firm has taken
responsibility for certain aspects of typical debtor “financial advisory” services and
the firms work well together. No comments herein should be construed as criticism
of this collaboration; rather, I believe it would have been preferable for a single firm
to have prepared a single, integrated financial projection for the POA.
27
unfortunate but is understandable given the speed with which this bankruptcy has
occurred and the Emergency Manager’s priorities during his similarly short tenure.
Readers of the POA should view the Plan projections as a “sources and uses”
statement which describes cash available to fund delivery of some of the services
the City provides and certain payments to creditors. As such, these projections are
useful only for purposes of confirming the POA (or not, as the case may be) and
directionally providing guidance for the City to plan its finances going forward for
those operations that are addressed in the POA. It is important to understand that
the POA projections are not a business plan for the City. They are not the City’s
budget. They are not the “financial plan” referenced in Public Acts 181 and 182 of
2014, also referred to as the “Grand Bargain” legislation.
The confusion about the projections in the POA and these other financial plans
is evident within the City including its employees, amongst the media and the
stakeholders. The projections in the POA have not been harmonized with the City’s
budget that was passed by the City Council on June 5, 2014. As such, any funding
of the RRIs will require first identification of a funding source, and then approval by
the CFO and Mayor, and finally, approval by the City Council of a budget
amendment to support the appropriations. Although the City has many financial
reporting priorities, it is highly advisable that the budget department amend the

28
approved June budget for the numerous anticipated changes post confirmation,
harmonizing the current headcounts and spending levels with the RRIs that the City
intends to execute in the coming year, and submit a new budget to the City Council
for approval.
The sooner the City can divorce itself from the confusion created by the POA
projections, the better. The City needs a multi-year Business Plan which can act as
a single financial and operational plan, including all departments and enterprise
activities (of which an amended budget would be a part) as well as capital plans that
can be publicly communicated and compared to actual performance. A “bridge”
should be prepared which identifies the components of the POA projections that are
included in the City’s Business Plan and then the POA projections can be archived.
Another confusion I believe exists in the POA is the investment plan for
infrastructure and service delivery improvements that are required to revitalize the
City. Those funds will necessarily come from reducing costs of existing service
delivery either through efficiency improvements or elimination of activities. The
media has created the impression that the City’s investment of more than $1 billion
over the course of the coming years is a “given”. This is incorrect. There is no
funding source for these investments, including blight removal, other than the Exit

29
Financing19 and the projected structural surplus in the POA projections; that is: the
projected revenues must exceed the projected expenses of the City for the
foreseeable future. It is important that readers of the POA understand there is no
cash in a bank account to fund the RRIs. The cash for the investments will come
from the Mayor and the departmental leaders delivering services as economically
and efficiently as the POA forecasts.
Outside Factors of Influence
I can say, unequivocally, that without the positive and capable leadership of
Mayor Duggan and the constructive relationship between the City Council and the
Mayor, I would be unable to opine that the plan, as currently proposed, is feasible.
The near term future will require course adjustments as undoubtedly revenues and
expenses will vary from projections and unforeseen events will demand changes in
plans. The democratic system has put in place individuals who, at least for the next
three years, can choose to continue the positive course for the City. I believe they
will do so.
19 The City’s investment banker, Miller Buckfire & Co. has prepared solicitation
materials as is the process of sourcing this financing.

30
Southeast Michiganders and Detroiters are extensively engaged in civic and
charitable pursuits that benefit the revitalization of Detroit. While detractors cite
crime rates and nonfunctioning public works, there are a similar group of
enthusiastic, impassioned supporters of Detroit’s bright future. Two tangible
examples are the Detroit Future City plan and the Blight Task Force report. Each of
these privately funded efforts resulted in professionally stellar frameworks that
current and future elected officials should consider as components of Detroit’s
master plan. I find it encouraging that there are the underpinnings of business plans
for the City which can be blended with financial plans to improve the prospects of
success.
In addition, the level of private funds invested in Detroit annually is
significant. During my interviews, one executive estimated that private foundations,
collectively, spend between $150-$200 million annually on “public” works to
support investments in the safety, health and welfare and economic development
within the City of Detroit. This level of funding is significant to the overall
revitalization efforts outlined in the POA.
31
Section E - City of Detroit Financial Forecast Summary
Introduction
The City’s Plan of Adjustment incorporates multiple, interrelated financial
forecasts that must be individually and collectively evaluated in order to fully
understand how the City intends to operate after a confirmation of the Plan of
Adjustment. These forecasts, which vary in both duration and intended scope,
emanated from the various City professional advisors and their original
responsibilities. To fully appreciate the operating plan for the City, Phoenix has
reviewed each of the financial forecasts and has worked with the City and its
professionals to understand how each of these documents bridge to one another.
The Plan of Adjustment’s financial forecasts are as follows:
1. Plan of Adjustment – Ten Year Financial Projections (the “10 Yr Plan”),
2. Plan of Adjustment – Forty Year Financial Projections (the “40 Yr Plan”)
3. Plan of Adjustment – Restructuring and Reinvestment Initiatives (the “RRIs”)
4. City of Detroit – Triennial Executive Budget (“City Budget”)

32
Plan of Adjustment – Ten Year Financial Projections
The 10 Yr Plan, built and modified by Ernst & Young (“E&Y”), is the City’s
financial forecast for the fiscal years 2014-2023. This plan was originally developed
to show how Detroit would operate exclusive of the chapter 9 bankruptcy
proceeding. That is, it is effectively the baseline plan. This forecast was built on a
department level basis and does not include the quantitative impacts of the
restructuring initiatives, the cancellation of debt, the cash flow ramifications from
the alterations in the City’s pension plans and OPEB20, and other impacts of the
bankruptcy proceedings.
The City and its advisors produced, as part of the Fourth Amended Plan for
the Adjustment of Debts of the City of Detroit and the corresponding Fourth
Amended Disclosure Statement (dated May 5, 2014), an updated version of the 10
Yr Plan which reflected the then most current forecast assumptions and terms of
negotiated agreements. In light of the incremental negotiations, modified forecast
assumptions and other changes, a newer 10 Yr Plan (in concert with an updated 40
Yr Plan and modified RRIs) has been produced by the City advisors and is dated
July 2, 2014. For the purpose of this Report, Phoenix used the July 2, 2014 version
20 Other Post Employment Benefits
33
of the City’s financial forecasts. The following analysis21 identifies the quantifiable
variances between the most recent iterations of the City’s financial forecasts. While
the net of all changes only impacted the Plan by $5.2 million, on an absolute value
basis, the July 2nd version of the 10 Yr Plan contains changes that are in aggregate
$491 million versus the May 5th version for the FY2014-2023 time period.
21 The analysis is sourced from the 5.5.14 POA and 7.2.14 POA and figures are from
the bibliography: Conway Mackenzie Models:1-54 and Ernst & Young Models 8-
11

34
10 Year Variance Absolute Value Change
Base Model Revenue
State Revenue Sharing 36.6$ 36.6$
Wagering Taxes (13.1)$ 13.1$
Property Taxes (15.7)$ 15.7$
Sales and Charges for Services (0.9)$ 0.9$
Total Base Model Revenue 6.9$ 66.3$
Base Model Operating Expenditures
DDOT Subsidy (59.7)$ 59.7
Delay in Payroll Processing (4.4)$ 4.4
PLD LED Lights (2.7)$ 2.7
Total Base Model Operating Expenditures (66.8)$ 66.8$
A. Total Changes to Base Model (59.9)$ 133.1$
Reinvestment Revenue
GSD Grant 5.7$ 5.7$
Total Reinvestment Revenue 5.7$ 5.7$
Reinvestment Operating Expenditures
Fire Department Labor Change (49.8)$ 50.7$
Police Department - Adjust Avg Salary to Act. in Base Forecast 22.5$ 22.5$
Fire Department- Adjust Avg Salary to Act. in Base Forecast 45.2$ 45.2$
All Other Labor 1.5$ 2.5$
DPD - Increse in Annual Facility Costs of New Precincts (6.2)$ 6.2$
Training (1.1)$ 1.1$
Purchased Services (0.7)$ 0.7$
Total Reinvestment Operating Expenditures 11.4$ 129.0$
Capital Investments
Police Fleet Spending 10.0$ 10.0$
GSD Facility Maintenance and Other Capex 6.1$ 6.1$
Deferral of Airport Bay Upgrades and T-Hangars 5.0$ 5.0$
R&M Fire Dept Facilities 3.0$ 3.0$
Rec Facilities 2.5$ 2.5$
311 System 0.6$ 0.6$
Total Capital Investments 27.3$ 27.3$
B. Total Changes to RRI's 44.4$ 162.0$
Potential Deals
Public Safety 3% Bonus in FY 16 (5.6)$ 5.6$
OPEB now $1MM for PFRS 11.7$ 11.7$
Pension now 12.25% of wages (21.1)$ 21.1$
Total Potential Deals (15.0)$ 38.4$
Non Operating
Adjusted Note B (55.0)$ 55.0$
Add Note A2 6.1$ 6.1$
QOL Exit Financing P&I 85.1$ 85.1$
Deferrals (10.7)$ 10.7$
Contingency (0.2)$ 0.2$
Total Non Operating 25.3$ 157.1$
C. Total Changes due to New Deals/Non Operating 10.3$ 195.5$
Total Net Change (A+B+C) (5.2)$ 490.6$
7.2.14 POA vs 5.5.14 POA

35
Plan of Adjustment – Forty Year Financial Projections
The 40 Yr Plan, also built and modified by E&Y, is the financial forecast for
the fiscal years 2014-2053 that purports to indicate the City’s performance over the
next 40 years. Contrary to the 10 Yr Plan, the 40 Yr Plan includes the impact of the
RRIs, the cancellation of debt, the cash flow ramifications from the alterations in the
City’s pension plans and OPEB, and other impacts of the bankruptcy proceedings.
The 40 Yr Plan has not been built by department and is only a summary of the overall
expected City performance.
Plan of Adjustment - Restructuring and Reinvestment Initiatives
The Restructuring and Reinvestment Initiatives have been constructed and
amended by Conway Mackenzie (“CM”) following CM’s City-wide departmental
review begun in January 2013. The reinvestment initiatives include funding for
additional City personnel and operating requirements, targeted capital expenditures,
and blight removal. In total, the RRIs assume the City will invest approximately
$1.7 billion in restructuring initiatives. This $1.7 billion of investment is funded in
part by $483 million of incremental revenue generated as a result of the RRIs and
$358 million of anticipated costs savings from the execution of the RRIs over the
FY2014-2023 period. The remaining funding source for the RRIs will be generated
by operating City surpluses and the Exit Financing. The process to develop these

36
detailed initiatives included highly detailed inputs, risks, constraints and other
factors in how the initiatives will be implemented.
City of Detroit - Triennial Executive Budget
The City annually develops a Triennial Executive Budget that forecasts the
financial operations of the City for the subsequent three fiscal years. This budget
historically forms the basis for how the City intends to operate on a departmental
level and is developed in line with historical government reporting protocols. The
Triennial Budget is developed in a manner that allows for reconciliation with the
City’s fund accounting22 and only includes items for which funding has been
received, approved and allocated. The City’s FY2015 budget was unanimously
approved by the Detroit City Council on June 5, 2014.
The timing of the City’s annual budget cycle, including review and approval
by the City Council, and the timing of the bankruptcy proceedings created a bit of a
22 Governmental fund accounting is beyond the scope of this Report. However, the
reader should appreciate that 1) government accounting standards can vary
significantly from those used in the private sector, 2) fund accounting can sometimes
create artificial classifications of revenues and expenses that do not resemble how
the entity operates on a regular basis and 3) the City’s POA projections were
prepared separately from the City’s Triennial Budget. In the past few weeks, the
City’s budget team and the financial advisors have worked to reconcile the major
differences between the POA projections and the City’s budget.

37
conundrum for the FY2015 budget. As such, the FY2015 budget does not reflect
many of the POA proposals, including most of the RRIs and the revised debt service
requirements. This may create a procedural bottleneck in that funding for the RRIs
will require first, approval by the Emergency Manager, Mayor and Chief Financial
Officer,23 and then a budget amendment to be approved by the City Council.
Phoenix Review
Phoenix has thoroughly reviewed each of the above identified forecasts. In
addition, numerous meetings have been held to discuss the forecasts with the City,
E&Y, and CM. While Phoenix appreciates the inherent complexity of any financial
forecast for an enterprise of this magnitude, a number of concerns regarding how the
multiple forecasts impact one another warrants discussion.
First and most importantly, the City does not have a consolidated,
departmental financial forecast that incorporates the baseline forecast and all of the
POA proposals, specifically, the RRIs. While the respective 10 Yr, 40 Yr, and RRI
forecasts have been expertly researched, constructed, and amended, the fact remains
23 This group is referred to as the “Approving Parties”. Procedures have been
established to manage the RRI activities. The Approving Parties will assess the RRI
funding requests from the various department heads for appropriateness, ensure that
the City has the cash for fund the initiatives and allocate the money amongst the
requested initiatives.

38
that the City does not have an aggregated forecast to use as a fiscal roadmap going
forward. During our many meetings with City leadership and department heads, it
was evident that the individuals responsible for delivering essential services did not
have an adequate understanding of the POA impacts to their operations and the
manner in which the RRIs would occur.
I have participated in the budget review meetings with the Mayor, the
department heads and their respective teams and believe that the sooner the POA
projections, in their current form, can be archived, the better. Although improving,
there is still a gap in the understanding by the department heads, relating to their
budgets and the impact the RRIs will play in what they will be responsible for in the
future. In the next few years, the funding for the RRIs is largely, if not exclusively,
dependent on the Exit Financing. At this point, we understand the Exit Financing is
not committed and the amount and terms have not been determined. For purposes of
my assessment and resulting opinion, I have assumed that Exit Financing will be
available in an amount sufficient to implement the POA as set forth in detail later in
this Report.

39
Section F - Revenue and Macro Assumptions
Summary24
The City of Detroit’s Plan of Adjustment include 10 Yr revenue projections
for the fiscal years 2014-2023 and 40 Yr revenue projections for the fiscal years
2014-2053 (“40 Yr Plan”). The 10 Yr Plan revenues were forecasted including and
excluding the assumed accretive impact of the proposed RRIs detailed in the Plan of
Adjustment. As illustrated below, the total revenues projected in the 10 Yr Plan -
exclusive of the impact of the RRIs - is $10.4 billion; alternatively, the 10 Yr Plan’s
cumulative revenues inclusive of the impact of the RRIs is $11.2 billion.
24 Unless otherwise stated the financial projections referenced in section F are
sourced from the bibliography: Ernst & Young Models: 10-11
General Fund Revenues
Municipal income tax 2,566$ 25% 2,770$ 25% 3,510$ 29% 4,591$ 32% 6,059$ 35%
State revenue sharing 2,000$ 19% 2,000$ 18% 2,121$ 18% 2,307$ 16% 2,533$ 15%
Wagering taxes 1,733$ 17% 1,733$ 15% 1,906$ 16% 2,105$ 15% 2,325$ 13%
Sales and charges for services 1,118$ 11% 1,118$ 10% 1,161$ 10% 1,415$ 10% 1,725$ 10%
Property taxes 964$ 9% 1,074$ 10% 1,370$ 11% 1,640$ 11% 1,903$ 11%
Other revenue 713$ 7% 713$ 6% 754$ 6% 918$ 6% 1,120$ 6%
General Fund reimbursements 260$ 2% 260$ 2% 239$ 2% 291$ 2% 355$ 2%
Utility users' 252$ 2% 257$ 2% 304$ 3% 353$ 2% 410$ 2%
Department Revenue Initiatives -$ 0% 483$ 4% 586$ 5% 715$ 5% 871$ 5%
Transfers in 829$ 8% 829$ 7% 148$ 1% 22$ 0% -$ 0%
Total General Fund Revenues 10,434$ 100% 11,237$ 100% 12,098$ 100% 14,358$ 100% 17,302$ 100%
FY2044-2053
With
Reinvestment
With
Reinvestment
FY2024-2033 FY2034-2043
With
Reinvestment
Without
Reinvestment
With
Reinvestment
FY2014-2023

40
The analyses below will identify the City’s individual revenue components
(on an annual and cumulative basis), the estimated growth for each revenue category
over the time periods of both forecasts, and the key assumptions utilized for each
revenue category. The following analyses will also identify and compare, where
applicable, third party assumptions for various operating metrics (e.g. wages,
employment, population, etc.) as they relate to the assumptions the City used to
derive these forecasts. Finally, this revenue analysis provides sensitivity scenarios
designed to illustrate the variability of the revenue forecasts as underlying
assumptions are changed.
Municipal Income Tax
The City of Detroit, in accordance with the Michigan Public Act 284 of 1964,
has been one of 22 Michigan municipalities to impose a municipal income tax on its
residents, nonresidents working in Detroit, and resident businesses. The City’s
municipal income tax receipts, due to declines in population and the economy, have
decreased by 30% since 2002. Municipal income tax revenues are forecasted to
account for 25% of General Fund revenue in the FY2014-2023 period.
As mentioned above, the City’s POA projections estimate revenues for the 10
year period covering FY2014-2023 with and without the incremental revenue impact

41
of the RRIs. The following analysis illustrates the “without Restructuring and
Reinvestment Initiatives” scenario.
10 Yr Plan - Without RRIs
The City’s 10 Yr Plan forecasts annual municipal income tax through the
estimation of the year-over-year (“YoY”) growth in taxable income for the following
subsections:
City residents
o Average annual YoY taxable income growth: 0.85%
o Income tax rate: 2.4%
o FY2014-2023 City resident income taxes: $1,561 million
Non-residents
o Average annual YoY taxable income growth: 1.18%
o Income tax rate: 1.2%
o FY2014-2023 non-resident income taxes: $761 million
Corporations
o Average annual YoY taxable income growth: 1.63%
o Income tax rate: 2.0%
o FY2014-2023 corporation income taxes: $245 million
The taxable income growth assumptions appear to be reasonably conservative
relative to the recent uptick in taxable income in FY2011-2013. For Detroit
residents, taxable income growth has averaged 3.4% annually for those three years.
During the same period, taxable income growth has averaged 3.5% for non-residents
and 2.2% for corporations. The annual taxable income growth during FY2011-2013

42
is likely reflective of the recovery from the 2008-2009 financial crisis, when the
City’s taxable income base suffered double-digit YoY percentage declines.
10 Year Plan – Municipal Income Tax (Without RRIs)
The POA’s 10 Yr projections “build up” the annual taxable income growth
assumption by adding separate assumptions for annual wage growth and
employment growth.
Wage Growth (Without RRIs)
The 10 Yr Plan estimates – for both the City residents and nonresident
categories – an average wage growth of 1.25% for the FY2014-FY2023 period, an
FY2014-2023
2014 2015 2016 2017 2018 2019 2020 2021 2022 2023 Average/Total
City Residents (A)
Taxable income growth 1.94% 1.45% 0.46% 0.46% 0.46% 0.46% 0.65% 0.65% 1.00% 1.00% 0.85%
Taxable income 6,294.0$ 6,385.5$ 6,414.7$ 6,444.0$ 6,473.5$ 6,503.3$ 6,545.8$ 6,588.6$ 6,654.5$ 6,721.1$ 65,025.1$
Income tax rate 2.4% 2.4% 2.4% 2.4% 2.4% 2.4% 2.4% 2.4% 2.4% 2.4%
Total City Resident income taxes 151.1 153.3 154.0 154.7 155.4 156.1 157.1 158.1 159.7 161.3 1,560.6
Non-Residents (B)
Taxable income growth 2.23% 1.70% 0.70% 0.70% 0.70% 0.69% 0.50% 1.19% 1.69% 1.69% 1.18%
Taxable income 6,065.0$ 6,168.1$ 6,211.2$ 6,254.5$ 6,298.0$ 6,341.7$ 6,373.4$ 6,449.4$ 6,558.5$ 6,669.3$ 63,389.0$
Income tax rate 1.2% 1.2% 1.2% 1.2% 1.2% 1.2% 1.2% 1.2% 1.2% 1.2%
Total Non-Resident income taxes 72.8 74.0 74.5 75.1 75.6 76.1 76.5 77.4 78.7 80.0 760.7$
Corporations (C)
Net tax collection growth 2.34% 2.50% 2.00% 2.00% 2.00% 1.50% 1.00% 1.00% 1.00% 1.00% 1.63%
Taxable income (implied) 1,128.3$ 1,156.5$ 1,179.6$ 1,203.2$ 1,227.3$ 1,245.7$ 1,258.2$ 1,270.7$ 1,283.5$ 1,296.3$ 12,249.3$
Corporate tax rate 2.0% 2.0% 2.0% 2.0% 2.0% 2.0% 2.0% 2.0% 2.0% 2.0%
Net tax collections 22.6 23.1 23.6 24.1 24.5 24.9 25.2 25.4 25.7 25.9 245.0$
Total Municipal income taxes (D) = (A+B+C)
Taxable income 13,487.3$ 13,710.2$ 13,805.5$ 13,901.7$ 13,998.8$ 14,090.7$ 14,177.4$ 14,308.8$ 14,496.5$ 14,686.7$ 140,663.5$
Calculated tax rate 1.8% 1.8% 1.8% 1.8% 1.8% 1.8% 1.8% 1.8% 1.8% 1.8% 1.8%
Total Municipal income taxes 246.4 250.4 252.1 253.8 255.5 257.1 258.7 260.9 264.1 267.3 2,566.3$
Adjustment Municipal income taxes
Adjustment for actuals - - - - - - - - - - -$
Total Adjusted Municipal income taxes 246.4$ 250.4$ 252.1$ 253.8$ 255.5$ 257.1$ 258.7$ 260.9$ 264.1$ 267.3$ 2,566.3$
Preliminary forecast

43
estimate that appears reasonable when compared to the state and national forecasts
highlighted below. The income growth forecast for corporations is 1.63% and is
conservative relative to the State forecast. The Michigan Senate Fiscal Agency
assumed an average 2.65% wage growth rate for Detroit which is reflective of the
average state forecast of 3.65% reduced by a 1% structural adjustment for the City
of Detroit.
Employment Growth (without RRIs)
The annual employment rate of City residents is forecasted to decline by 0.4%
for the FY2014-FY2023 period. Non-residents’ average annual employment is
estimated to decrease by 0.07% for this time period. As was the case with forecasted
wage growth, the employment growth assumptions seem reasonable when compared
to the recent actual employment growth for the entire City of Detroit over the last
three fiscal years which averaged 0.4%.

44
10 Year Plan – Municipal Income Tax (Without RRIs)
Taxable Income Growth Metrics
10 Yr Plan with RRIs
The 10 Yr projections forecast annual municipal tax income through the
estimation of the year-over-year (“YoY”) growth in taxable income for the following
subsections:
City residents
o Average annual YoY taxable income growth: 2.32%
o Income tax rate: 2.4%
o FY2014-FY2023 City resident income taxes: $1,693 million
Non-residents
o Average annual YoY taxable income growth: 2.37%
o Income tax rate: 1.2%
o FY2014-FY2023 non-resident income taxes: $817 million
Corporations
o Average annual YoY taxable income growth: 2.65%
o Income tax rate: 2.0%
o FY2014-FY2023 corporations income taxes: $260 million
Due primarily to the more optimistic City residents’ taxable income growth
assumptions in the “With Reinvestment Initiatives” scenario, the latter scenario
FY2014-2023
2014 2015 2016 2017 2018 2019 2020 2021 2022 2023 Average/Total
City Residents (A)
Wage Growth 2.53% 2.00% 1.00% 1.00% 1.00% 1.00% 1.00% 1.00% 1.00% 1.00% 1.25%
Employment Growth -0.59% -0.55% -0.54% -0.54% -0.54% -0.54% -0.35% -0.35% 0.00% 0.00% -0.40%
Taxable income growth 1.94% 1.45% 0.46% 0.46% 0.46% 0.46% 0.65% 0.65% 1.00% 1.00% 0.85%
Non-Residents (B)
Wage Growth 2.53% 2.00% 1.00% 1.00% 1.00% 1.00% 1.00% 1.00% 1.00% 1.00% 1.25%
Employment Growth -0.30% -0.30% -0.30% -0.30% -0.30% -0.31% -0.50% 0.19% 0.69% 0.69% -0.07%
Taxable income growth 2.23% 1.70% 0.70% 0.70% 0.70% 0.69% 0.50% 1.19% 1.69% 1.69% 1.18%
Corporations (C)
State CIT forecast (SFA est. May 2013) 3.80% 5.70% 5.00% 4.00% 3.00% 3.00% 3.00% 3.00% 3.00% 3.00% 3.65%
Detroit structural adjust. -1.00% -1.00% -1.00% -1.00% -1.00% -1.00% -1.00% -1.00% -1.00% -1.00% -1.00%
Net growth rate 2.80% 4.70% 4.00% 3.00% 2.00% 2.00% 2.00% 2.00% 2.00% 2.00% 2.65%
Assumed Forecast Growth Rate 2.34% 2.50% 2.00% 2.00% 2.00% 1.50% 1.00% 1.00% 1.00% 1.00% 1.63%
Preliminary forecast
45
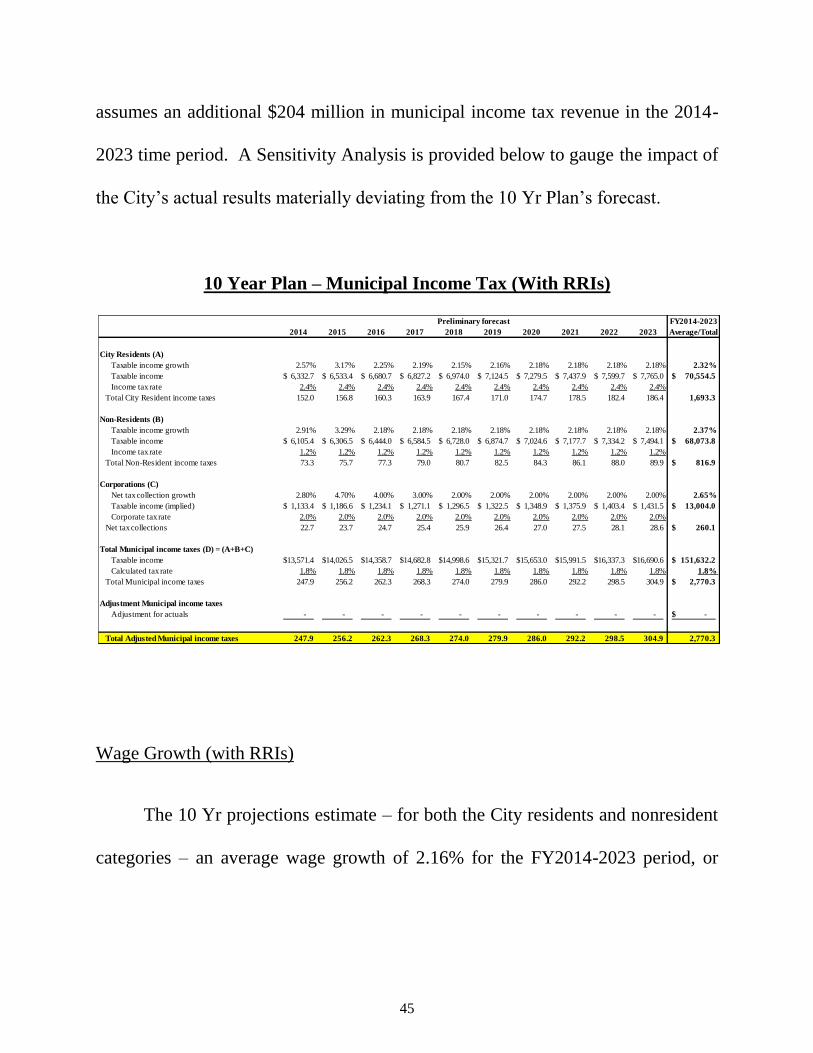
assumes an additional $204 million in municipal income tax revenue in the 2014-
2023 time period. A Sensitivity Analysis is provided below to gauge the impact of
the City’s actual results materially deviating from the 10 Yr Plan’s forecast.
10 Year Plan – Municipal Income Tax (With RRIs)
Wage Growth (with RRIs)
The 10 Yr projections estimate – for both the City residents and nonresident
categories – an average wage growth of 2.16% for the FY2014-2023 period, or
FY2014-2023
2014 2015 2016 2017 2018 2019 2020 2021 2022 2023 Average/Total
City Residents (A)
Taxable income growth 2.57% 3.17% 2.25% 2.19% 2.15% 2.16% 2.18% 2.18% 2.18% 2.18% 2.32%
Taxable income 6,332.7$ 6,533.4$ 6,680.7$ 6,827.2$ 6,974.0$ 7,124.5$ 7,279.5$ 7,437.9$ 7,599.7$ 7,765.0$ 70,554.5$
Income tax rate 2.4% 2.4% 2.4% 2.4% 2.4% 2.4% 2.4% 2.4% 2.4% 2.4%
Total City Resident income taxes 152.0 156.8 160.3 163.9 167.4 171.0 174.7 178.5 182.4 186.4 1,693.3
Non-Residents (B)
Taxable income growth 2.91% 3.29% 2.18% 2.18% 2.18% 2.18% 2.18% 2.18% 2.18% 2.18% 2.37%
Taxable income 6,105.4$ 6,306.5$ 6,444.0$ 6,584.5$ 6,728.0$ 6,874.7$ 7,024.6$ 7,177.7$ 7,334.2$ 7,494.1$ 68,073.8$
Income tax rate 1.2% 1.2% 1.2% 1.2% 1.2% 1.2% 1.2% 1.2% 1.2% 1.2%
Total Non-Resident income taxes 73.3 75.7 77.3 79.0 80.7 82.5 84.3 86.1 88.0 89.9 816.9$
Corporations (C)
Net tax collection growth 2.80% 4.70% 4.00% 3.00% 2.00% 2.00% 2.00% 2.00% 2.00% 2.00% 2.65%
Taxable income (implied) 1,133.4$ 1,186.6$ 1,234.1$ 1,271.1$ 1,296.5$ 1,322.5$ 1,348.9$ 1,375.9$ 1,403.4$ 1,431.5$ 13,004.0$
Corporate tax rate 2.0% 2.0% 2.0% 2.0% 2.0% 2.0% 2.0% 2.0% 2.0% 2.0%
Net tax collections 22.7 23.7 24.7 25.4 25.9 26.4 27.0 27.5 28.1 28.6 260.1$
Total Municipal income taxes (D) = (A+B+C)
Taxable income 13,571.4$ 14,026.5$ 14,358.7$ 14,682.8$ 14,998.6$ 15,321.7$ 15,653.0$ 15,991.5$ 16,337.3$ 16,690.6$ 151,632.2$
Calculated tax rate 1.8% 1.8% 1.8% 1.8% 1.8% 1.8% 1.8% 1.8% 1.8% 1.8% 1.8%
Total Municipal income taxes 247.9 256.2 262.3 268.3 274.0 279.9 286.0 292.2 298.5 304.9 2,770.3$
Adjustment Municipal income taxes
Adjustment for actuals - - - - - - - - - - -$
Total Adjusted Municipal income taxes 247.9 256.2 262.3 268.3 274.0 279.9 286.0 292.2 298.5 304.9 2,770.3
Preliminary forecast

46
roughly 91 basis points25 higher than the “without RRIs” scenario. The wage growth
forecast for corporations is 2.65%, or equivalent to the Michigan Senate Fiscal
Agency assumption.
Employment Growth (with RRIs)
The number of City residents employed is forecasted to increase 0.15% for
the FY2014-2023 period, while the non-residents’ average annual employment is
anticipated to increase 0.21% over this time period.
10 Year Plan – Municipal Income Tax (With RRIs)
Taxable Income Growth Metrics
25 A basis point is equivalent to 0.01%; therefore 100 basis equals 1%
FY2014-2023
2014 2015 2016 2017 2018 2019 2020 2021 2022 2023 Average/Total
City Residents (A)
Wage Growth 2.53% 3.03% 2.00% 2.00% 2.00% 2.00% 2.00% 2.00% 2.00% 2.00% 2.16%
Employment Growth -0.13% 0.14% 0.25% 0.19% 0.15% 0.16% 0.18% 0.18% 0.18% 0.18% 0.15%
Taxable income growth 2.57% 3.17% 2.25% 2.19% 2.15% 2.16% 2.18% 2.18% 2.18% 2.18% 2.32%
Non-Residents (B)
Wage Growth 2.53% 3.03% 2.00% 2.00% 2.00% 2.00% 2.00% 2.00% 2.00% 2.00% 2.16%
Employment Growth 0.38% 0.26% 0.18% 0.18% 0.18% 0.18% 0.18% 0.18% 0.18% 0.18% 0.21%
Taxable income growth 2.91% 3.29% 2.18% 2.18% 2.18% 2.18% 2.18% 2.18% 2.18% 2.18% 2.37%
Corporations (C)
State CIT forecast (SFA est. May 2013) 3.80% 5.70% 5.00% 4.00% 3.00% 3.00% 3.00% 3.00% 3.00% 3.00% 3.65%
Detroit structural adjust. -1.00% -1.00% -1.00% -1.00% -1.00% -1.00% -1.00% -1.00% -1.00% -1.00% -1.00%
Taxable income growth 2.80% 4.70% 4.00% 3.00% 2.00% 2.00% 2.00% 2.00% 2.00% 2.00% 2.65%
Preliminary forecast

47
Comparable Assumptions
When comparing the City of Detroit’s wage growth assumptions versus its
state or national estimates, the POA’s wage assumptions appear reasonable in light
of the City’s history of lagging state/national statistics.
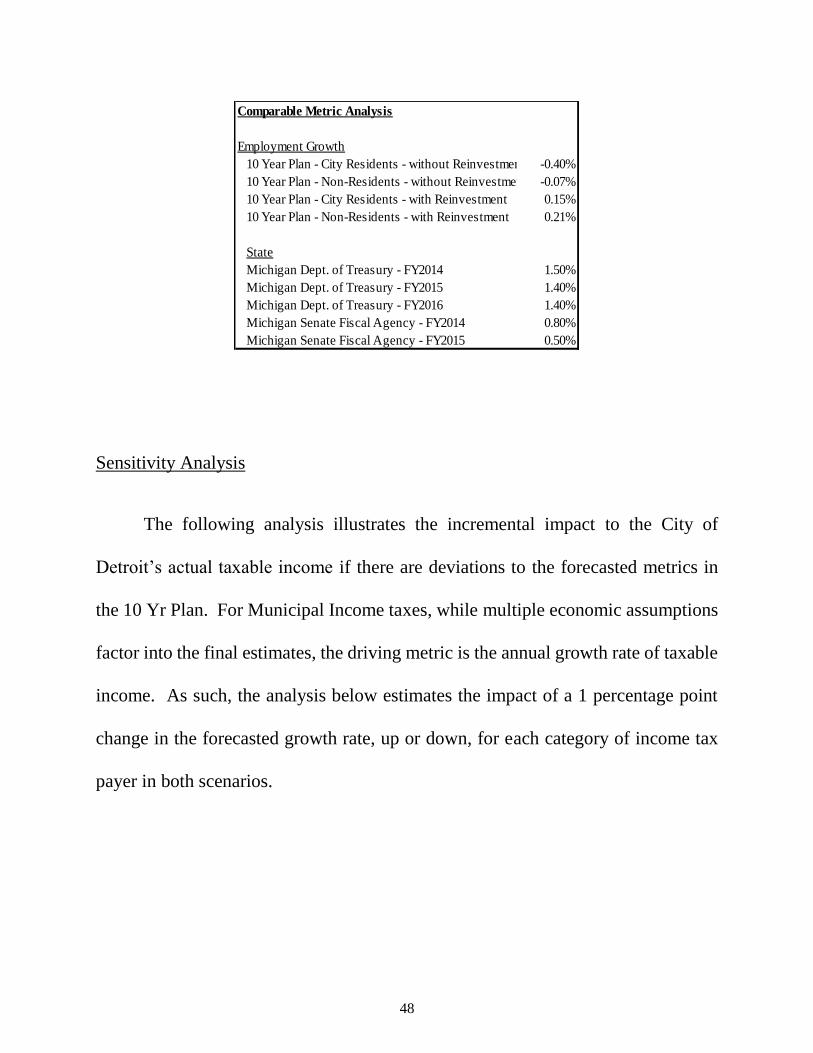
In a similar fashion to forecasted wage growth, the City’s employment growth
assumptions for FY2014-2023 are more conservative relative to the applicable State
of Michigan forecasts and the City’s recent actual results.
Comparable Metric Analysis
Wage Growth
10 Year Plan - without Reinvestment 1.25%
10 Year Plan - with Reinvestment 2.16%
State
Michigan Dept. of Treasury - FY2014 3.90%
Michigan Dept. of Treasury - FY2015 3.90%
Michigan Dept. of Treasury - FY2016 3.90%
Michigan Senate Fiscal Agency - FY2014 2.30%
Michigan Senate Fiscal Agency - FY2015 2.60%
Federal
CBO - Real Wage Growth 2.47%
48
Sensitivity Analysis
The following analysis illustrates the incremental impact to the City of
Detroit’s actual taxable income if there are deviations to the forecasted metrics in
the 10 Yr Plan. For Municipal Income taxes, while multiple economic assumptions
factor into the final estimates, the driving metric is the annual growth rate of taxable
income. As such, the analysis below estimates the impact of a 1 percentage point
change in the forecasted growth rate, up or down, for each category of income tax
payer in both scenarios.
Comparable Metric Analysis
Employment Growth
10 Year Plan - City Residents - without Reinvestment -0.40%
10 Year Plan - Non-Residents - without Reinvestment -0.07%
10 Year Plan - City Residents - with Reinvestment 0.15%
10 Year Plan - Non-Residents - with Reinvestment 0.21%
State
Michigan Dept. of Treasury - FY2014 1.50%
Michigan Dept. of Treasury - FY2015 1.40%
Michigan Dept. of Treasury - FY2016 1.40%
Michigan Senate Fiscal Agency - FY2014 0.80%
Michigan Senate Fiscal Agency - FY2015 0.50%

49
For the Without RRIs scenario, every 1 percentage point deviation in the 10
Yr Plan’s assumption will result in an approximate $25 million in collected income
tax revenues variance for the FY2014-2023 period. Due to higher income tax
forecast in the With Reinvestment Initiatives case, the estimated variance – as
compared to the original 10 Yr Plan - increases to $27 million over that ten year
period in question.
State Revenue Sharing
The City of Detroit receives aid from the State of Michigan in connection with
constitutional and statutory sharing of sales tax revenue and economic vitality
incentive payments (“EVIP”). Per Michigan’s constitution, the State is required to
distribute 15% of all state taxes imposed on retailers. The constitutional revenue
sharing is a function of a municipality’s population relative to the other
FY2014-2023
($ million) 2014 2015 2016 2017 2018 2019 2020 2021 2022 2023 Total
For Every 1% Change in Annual Taxable Income Growth Rate
Without Reinvestment
City Residents 1.5 1.5 1.5 1.5 1.5 1.6 1.6 1.6 1.6 1.6 15.5
Non-Residents 0.7 0.7 0.7 0.7 0.8 0.8 0.8 0.8 0.8 0.8 7.5
Corporations 0.2 0.2 0.2 0.2 0.2 0.2 0.2 0.3 0.3 0.3 2.4
Total 2.4 2.5 2.5 2.5 2.5 2.6 2.6 2.6 2.6 2.6 25.4
With Reinvestment
City Residents 1.5 1.5 1.6 1.6 1.6 1.7 1.7 1.7 1.8 1.8 16.6
Non-Residents 0.7 0.7 0.8 0.8 0.8 0.8 0.8 0.8 0.9 0.9 8.0
Corporations 0.2 0.2 0.2 0.2 0.3 0.3 0.3 0.3 0.3 0.3 2.5
Total 2.4 2.5 2.6 2.6 2.7 2.7 2.8 2.9 2.9 3.0 27.1
Preliminary forecast

50
municipalities in Michigan, while the statutory revenue sharing is distributed to
municipalities that comply with certain “best practices” and reporting requirements.
Constitutional Payments
The State of Michigan’s constitutional payments emanate from the statutory
sharing of sales tax revenue and are based upon the population of Detroit (as
measured by the decennial Census) as a percentage of the total State’s population.
The constitutional payments are distributed every other month via a formula
multiplying Detroit’s population by defined distribution rates.
The 10 Yr projections utilize Detroit’s population from the 2010 Census –
712,501 – to factor the State’s constitutional payment for the fiscal years 2014-2021.
For FY2022 and FY2023, the 10 Yr Plan utilized the Southeast Michigan Council
of Governments (“SEMCOG”) forecast which reflects a 12.3% decline in Detroit’s
population to 625,152.
10 Year
2014 2015 2016 2017 2018 2019 2020 2021 2022 2023 Total
State Revenue Sharing Calculations
Constitutional Payment 53.5 54.8 56.9 58.5 60.2 62.0 63.8 57.3 59.0 60.7 586.8$
Statutory Payment 136.3 140.5 140.5 140.5 140.5 140.5 140.5 140.5 140.5 140.5 1,400.5$
Estimated State Revenue Sharing 189.8$ 195.3$ 197.4$ 199.0$ 200.7$ 202.5$ 204.3$ 197.8$ 199.5$ 201.2$ 1,987.3$
Other shared taxes (including liquor and beer licenses) 1.3$ 1.3$ 1.3$ 1.3$ 1.3$ 1.3$ 1.3$ 1.3$ 1.3$ 1.3$ 13.2$
Total State Revenue Sharing 191.2$ 196.6$ 198.7$ 200.3$ 202.0$ 203.8$ 205.6$ 199.1$ 200.8$ 202.5$ 2,000.5$
Preliminary forecast
51
Statutory Payments
The State’s EVIP funds are appropriated annually by the State Legislature and
therefore carry more inherent risk than the mandated State constitutional payments.
The EVIP funds are allocated per the following categories:
Category 1 – Accountability and Transparency
o Each municipality is required by October 1st to produce a citizen’s
guide of its most recent local finances, including a recognition of
unfunded liabilities, a performance dashboard, a debt service report,
and a project budget report
Category 2 – Consolidation of Services
o Each municipality is required by February 1st to produce a service
consolidation plan that is submitted to the Michigan Department of
the Treasury; including details of service cooperation,
consolidations, and privatizations with estimated cost savings
Category 3 – Unfunded Accrual Liability Plan
o Each municipality with unfunded accrual liabilities is required by
June 1st to produce a plan to lower all such unfunded accrual
liabilities; detailing previous actions taken and a go forward plan of
existing and new initiatives
The 10 Yr projections assume that the City continues to receive 100% of its
possible State allocation, or approximately $140 million annually for the entire
FY2014-2023 time period.
Sensitivity Analysis
The following analysis illustrates the incremental impact to the City if State
Revenue Sharing deviates from the assumptions in the 10 Yr forecast. The analysis

52
below estimates the impact of a 5% change in the 2020 Census forecasted population
and a 5% change in the statutory payment allocation. Because the constitutional
payment is based on the 2010 Census figure through FY2021, the impact of a 5%
population change would only be realized in FY2022 and FY2023. For the statutory
payment, a 5% change in the allocation would have a cumulative impact of $70
million to the General Fund during the FY2014-2023 period.
The City of Detroit recently saw its portion of State’s revenue sharing
decrease significantly, from a combined annual total of $267 million in FY2009 to
as low as $173 million in FY2012. While the State’s revenue sharing to Detroit has
increased in FY2013 and FY2014, the City remains susceptible to decreases in
revenue sharing should the State’s budget position change.
Wagering Taxes
The City of Detroit, per the Michigan Gaming Control and Revenue Act, is
authorized to impose a 10.9% wagering tax on casinos operating within the City. In
addition, the City collects other fees from the casinos in the City based on operating
10 Year
2014 2015 2016 2017 2018 2019 2020 2021 2022 2023 Total
For Every 5% Change in Applicable State Revenue Sharing Metric
Constitutional Payment - - - - - - - - 3.0 3.0 6.0$
Statutory Payment 6.8 7.0 7.0 7.0 7.0 7.0 7.0 7.0 7.0 7.0 70.0$
Total State Revenue Sharing 6.8$ 7.0$ 7.0$ 7.0$ 7.0$ 7.0$ 7.0$ 7.0$ 10.0$ 10.1$ 76.0$
Preliminary forecast

53
agreements with each. Wagering tax revenues are forecasted to account for 17% of
General Fund revenue in the FY2014-2023 period.
As a result of the wagering tax rate (10.9%) and the additional 2006 tax rate
(1.0%) being held constant, the key assumption in the 10 Yr forecast is the annual
percentage change in casino gross receipts. The Detroit casinos have experienced
increasing competition recently due to the openings of casinos in Cleveland and
Toledo, Ohio resulting in declining wagering tax revenues for the City. The 10 Yr
projections assume a 2.5% YoY decline in FY2014, a 1.0% decline in FY2015, a
0.5% annual increase in FY2016 and FY2017, and a 1.0% annual increase in
FY2018-2023.
10 Year
2014 2015 2016 2017 2018 2019 2020 2021 2022 2023 Total
Wagering Taxes Drivers
% Change in Gross Receipts -2.5% -1.0% 0.5% 0.5% 1.0% 1.0% 1.0% 1.0% 1.0% 1.0% 0.3%
Wagering Taxes Calculation
Adjusted Gross Receipts (A)
MGM 565.4$ 559.7$ 562.5$ 565.3$ 571.0$ 576.7$ 582.5$ 588.3$ 594.2$ 600.1$ 5,765.8$
Motorcity 445.6 441.2 443.4 445.6 450.0 454.5 459.1 463.7 468.3 473.0 4,544.4$
Greektown 331.6 328.3 329.9 331.6 334.9 338.2 341.6 345.0 348.5 352.0 3,381.7$
1,342.6$ 1,329.2$ 1,335.8$ 1,342.5$ 1,355.9$ 1,369.5$ 1,383.2$ 1,397.0$ 1,411.0$ 1,425.1$ 13,691.8$
Wagering Tax Rate (B) 10.9% 10.9% 10.9% 10.9% 10.9% 10.9% 10.9% 10.9% 10.9% 10.9%
Additional Payment (per 2006 operating agreement) (C) 1.0% 1.0% 1.0% 1.0% 1.0% 1.0% 1.0% 1.0% 1.0% 1.0%
Subtotal Wagering Tax (D) = (A)*(B+C)
MGM 67.3 66.6 66.9 67.3 67.9 68.6 69.3 70.0 70.7 71.4 686.1$
Motorcity 53.0 52.5 52.8 53.0 53.6 54.1 54.6 55.2 55.7 56.3 540.8$
Greektown 39.5 39.1 39.3 39.5 39.9 40.3 40.7 41.1 41.5 41.9 402.4$
Revenue Target Supplemental Wagering Tax (E)
MGM 5.7 5.6 5.6 5.7 5.7 5.8 5.8 5.9 6.0 6.0 57.8$
Motorcity 4.5 4.4 4.4 4.5 4.5 4.6 4.6 4.6 4.7 4.7 45.5$
Greektown - - - - - - - - - - -$
Total Wagering Tax (F) = (D+E)
MGM 72.9 72.2 72.6 72.9 73.7 74.4 75.1 75.9 76.7 77.4 743.9$
Motorcity 57.5 56.9 57.2 57.5 58.1 58.6 59.2 59.8 60.4 61.0 586.3$
Greektown 39.5 39.1 39.3 39.5 39.9 40.3 40.7 41.1 41.5 41.9 402.4$
Total Wagering Tax 169.9 168.2 169.0 169.9 171.6 173.3 175.0 176.8 178.6 180.3 1,732.6$
Preliminary forecast

54
Through the first six calendar months of 2014, Detroit’s aggregate casino
revenues decreased 3.6% versus the same six month period in 2013. These actual
results for the first six calendar months of 2014 represent a 110 basis points negative
variance to the POA’s FY2014 forecast and a 260 basis points negative variance to
the FY2015 forecast.
Sensitivity Analysis
The following analysis illustrates the incremental impact of the City’s actual
Casino Wagering tax deviating from the assumptions in the 10 Yr projections. The
analysis below estimates the impact of a 1% change, up or down, in the estimated
casino gross receipts. The current projections assume casino gross receipts will
average annual growth of 0.3% for FY2014-2023. Every 1 percentage point change
in the gross receipts assumption will result in an approximate $16 million variance
in the FY2014-2023 period.
10 Year
2014 2015 2016 2017 2018 2019 2020 2021 2022 2023 Total
For Every 1% Change in Gross Receipts
Annual Impact on Total Wagering Tax 1.6 1.6 1.6 1.6 1.6 1.6 1.6 1.6 1.7 1.7 16.2
Preliminary forecast

55
Sales and Charges for Services
Detroit receives revenues for City delivered-services such as maintenance and
construction, recreation, ambulance services, court fees, permits and licenses, etc.
Nearly half of these revenues are reflected as “Non Departmental” (e.g. municipal
servicing fees on gross wagering revenues, personal services IPOs). Sales and
Charges for Services revenues are forecasted to account for 11% of General Fund
revenue in the FY2014-2023 period.
During the ten year period, the largest change relates to transitioning responsibility
for the City’s street lights from the PLD to the Public Lighting Authority beginning
in FY2014. When the seven year transition is complete, the City will no longer
collect revenue from external customers. The balance of the revenue categories are
assumed to remain relatively constant over the FY2014-2023 time period.
10 Year
2014 2015 2016 2017 2018 2019 2020 2021 2022 2023 Total
Non-Departmental 51.8 51.7 52.1 52.6 53.1 53.6 54.1 54.7 55.2 55.7 534.7
PLD 41.2 28.7 26.1 23.5 20.8 18.1 15.3 12.3 10.6 10.7 207.2
Fire 14.9 14.9 14.9 14.9 14.9 14.9 14.9 14.9 14.9 14.9 149.0
36th District Court 10.0 10.0 10.0 10.0 10.0 10.0 10.0 10.0 10.0 10.0 100.3
Police 4.6 4.6 4.6 4.6 4.6 4.6 4.6 4.6 4.6 4.6 45.8
General Services 2.3 2.3 2.3 2.3 2.3 2.3 2.3 2.3 2.3 2.3 23.1
Human Resources 2.3 2.3 2.3 2.3 2.3 2.3 2.3 2.3 2.3 2.3 22.5
Law 1.7 1.7 1.7 1.7 1.7 1.7 1.7 1.7 1.7 1.7 17.3
Health & Wellness 1.0 - - - - - - - - - 1.0
ITS 0.5 0.5 0.5 0.5 0.5 0.5 0.5 0.5 0.5 0.5 5.1
Other 1.2 1.2 1.2 1.2 1.2 1.2 1.2 1.2 1.2 1.2 12.0
Sales and charges for services 131.5$ 118.0$ 115.8$ 113.6$ 111.4$ 109.2$ 107.0$ 104.4$ 103.3$ 104.0$ 1,118.0$
YoY $ Change 7.7$ (13.5)$ (2.2)$ (2.2)$ (2.2)$ (2.2)$ (2.2)$ (2.5)$ (1.1)$ 0.7$
YoY % Change 6.2% -10.3% -1.9% -1.9% -1.9% -2.0% -2.0% -2.4% -1.1% 0.6%
Preliminary forecast

56
Property Taxes
The City of Detroit levies property taxes to fund general operations and
support various tax obligations. Detroit also levies additional property taxes to fund
the Detroit Public Library, Detroit Public Schools, Wayne County Community
College, the State of Michigan, and a number of special authorities.
City of Detroit Millage
Non-Departmental (General City): 19.9520 mills
Debt Service: 9.771 mills
Library: 4.631 mills
Property tax revenues are forecasted to account for approximately 9% of
General Fund revenue in the FY2014-2023 period. As previously mentioned, the
City’s Plan of Adjustment estimates revenues for the 10 year period covering
FY2014-2023 both with and without the incremental revenue associated with the
RRIs. The following analysis illustrates the “without RRIs” scenario.
10 Yr Projections - Without RRIs
The City’s forecasted property tax revenues, due to the relatively-constant
millage rates, are largely predicated upon the assumed changes in assessed property
values and the estimated collection rates going forward.
57
Assessed Property Values
The 10 Yr projections assume individualized, average annual property value
growth rates for each of the City’s three property classifications: real property,
personal property, and the Renaissance Zone. The 10 Yr projections assume real
property values will decline 4% annually during the FY2014-2023 period, and
personal property values will decline 0.3% for the same time period. The
Renaissance Zone forecast assumes a 4.8% annual increase – aided by the 47%
forecasted growth assumption in FY2014 which is consistent with the FY2012-2013
average.
Collection Rates
The POA forecast assumes improving property tax collections over the
FY2014-2023 timeframe. The 10 Yr projections assume that collections for the non-
departmental property taxes improve from an assumed 78% in FY2014 to 80% in
FY2015-2019 to 84% in the last four years of this ten year period. Estimated
collections for debt service is projected to decrease from an assumed 82% in FY2014
to 80% in FY2015-2019 to 84% in the last four years of this ten year period.
Estimated collections for library property taxes are assumed to improve from 82%
in FY2014-2016 to 84% in FY 2017 to 85% in FY2018-2023.
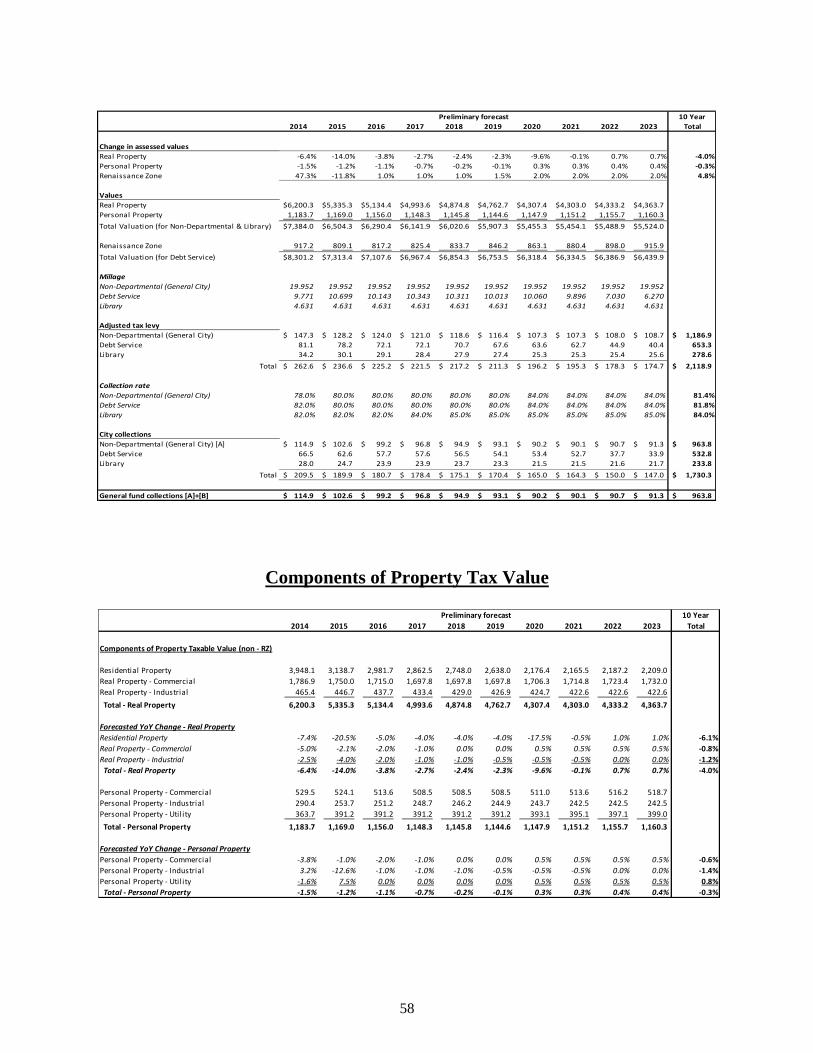
58
Components of Property Tax Value
10 Year
2014 2015 2016 2017 2018 2019 2020 2021 2022 2023 Total
Change in assessed values
Real Property -6.4% -14.0% -3.8% -2.7% -2.4% -2.3% -9.6% -0.1% 0.7% 0.7% -4.0%
Personal Property -1.5% -1.2% -1.1% -0.7% -0.2% -0.1% 0.3% 0.3% 0.4% 0.4% -0.3%
Renaissance Zone 47.3% -11.8% 1.0% 1.0% 1.0% 1.5% 2.0% 2.0% 2.0% 2.0% 4.8%
Values
Real Property 6,200.3$ 5,335.3$ 5,134.4$ 4,993.6$ 4,874.8$ 4,762.7$ 4,307.4$ 4,303.0$ 4,333.2$ 4,363.7$
Personal Property 1,183.7 1,169.0 1,156.0 1,148.3 1,145.8 1,144.6 1,147.9 1,151.2 1,155.7 1,160.3
Total Valuation (for Non-Departmental & Library) 7,384.0$ 6,504.3$ 6,290.4$ 6,141.9$ 6,020.6$ 5,907.3$ 5,455.3$ 5,454.1$ 5,488.9$ 5,524.0$
Renaissance Zone 917.2 809.1 817.2 825.4 833.7 846.2 863.1 880.4 898.0 915.9
Total Valuation (for Debt Service) 8,301.2$ 7,313.4$ 7,107.6$ 6,967.4$ 6,854.3$ 6,753.5$ 6,318.4$ 6,334.5$ 6,386.9$ 6,439.9$
Millage
Non-Departmental (General City) 19.952 19.952 19.952 19.952 19.952 19.952 19.952 19.952 19.952 19.952
Debt Service 9.771 10.699 10.143 10.343 10.311 10.013 10.060 9.896 7.030 6.270
Library 4.631 4.631 4.631 4.631 4.631 4.631 4.631 4.631 4.631 4.631
Adjusted tax levy
Non-Departmental (General City) 147.3$ 128.2$ 124.0$ 121.0$ 118.6$ 116.4$ 107.3$ 107.3$ 108.0$ 108.7$ 1,186.9$
Debt Service 81.1 78.2 72.1 72.1 70.7 67.6 63.6 62.7 44.9 40.4 653.3
Library 34.2 30.1 29.1 28.4 27.9 27.4 25.3 25.3 25.4 25.6 278.6
Total 262.6$ 236.6$ 225.2$ 221.5$ 217.2$ 211.3$ 196.2$ 195.3$ 178.3$ 174.7$ 2,118.9$
Collection rate
Non-Departmental (General City) 78.0% 80.0% 80.0% 80.0% 80.0% 80.0% 84.0% 84.0% 84.0% 84.0% 81.4%
Debt Service 82.0% 80.0% 80.0% 80.0% 80.0% 80.0% 84.0% 84.0% 84.0% 84.0% 81.8%
Library 82.0% 82.0% 82.0% 84.0% 85.0% 85.0% 85.0% 85.0% 85.0% 85.0% 84.0%
City collections
Non-Departmental (General City) [A] 114.9$ 102.6$ 99.2$ 96.8$ 94.9$ 93.1$ 90.2$ 90.1$ 90.7$ 91.3$ 963.8$
Debt Service 66.5 62.6 57.7 57.6 56.5 54.1 53.4 52.7 37.7 33.9 532.8
Library 28.0 24.7 23.9 23.9 23.7 23.3 21.5 21.5 21.6 21.7 233.8
Total 209.5$ 189.9$ 180.7$ 178.4$ 175.1$ 170.4$ 165.0$ 164.3$ 150.0$ 147.0$ 1,730.3$
General fund collections [A]+[B] 114.9$ 102.6$ 99.2$ 96.8$ 94.9$ 93.1$ 90.2$ 90.1$ 90.7$ 91.3$ 963.8$
Preliminary forecast
10 Year
2014 2015 2016 2017 2018 2019 2020 2021 2022 2023 Total
Components of Property Taxable Value (non - RZ)
Residential Property 3,948.1 3,138.7 2,981.7 2,862.5 2,748.0 2,638.0 2,176.4 2,165.5 2,187.2 2,209.0
Real Property - Commercial 1,786.9 1,750.0 1,715.0 1,697.8 1,697.8 1,697.8 1,706.3 1,714.8 1,723.4 1,732.0
Real Property - Industrial 465.4 446.7 437.7 433.4 429.0 426.9 424.7 422.6 422.6 422.6
Total - Real Property 6,200.3 5,335.3 5,134.4 4,993.6 4,874.8 4,762.7 4,307.4 4,303.0 4,333.2 4,363.7
Forecasted YoY Change - Real Property
Residential Property -7.4% -20.5% -5.0% -4.0% -4.0% -4.0% -17.5% -0.5% 1.0% 1.0% -6.1%
Real Property - Commercial -5.0% -2.1% -2.0% -1.0% 0.0% 0.0% 0.5% 0.5% 0.5% 0.5% -0.8%
Real Property - Industrial -2.5% -4.0% -2.0% -1.0% -1.0% -0.5% -0.5% -0.5% 0.0% 0.0% -1.2%
Total - Real Property -6.4% -14.0% -3.8% -2.7% -2.4% -2.3% -9.6% -0.1% 0.7% 0.7% -4.0%
Personal Property - Commercial 529.5 524.1 513.6 508.5 508.5 508.5 511.0 513.6 516.2 518.7
Personal Property - Industrial 290.4 253.7 251.2 248.7 246.2 244.9 243.7 242.5 242.5 242.5
Personal Property - Util ity 363.7 391.2 391.2 391.2 391.2 391.2 393.1 395.1 397.1 399.0
Total - Personal Property 1,183.7 1,169.0 1,156.0 1,148.3 1,145.8 1,144.6 1,147.9 1,151.2 1,155.7 1,160.3
Forecasted YoY Change - Personal Property
Personal Property - Commercial -3.8% -1.0% -2.0% -1.0% 0.0% 0.0% 0.5% 0.5% 0.5% 0.5% -0.6%
Personal Property - Industrial 3.2% -12.6% -1.0% -1.0% -1.0% -0.5% -0.5% -0.5% 0.0% 0.0% -1.4%
Personal Property - Util ity -1.6% 7.5% 0.0% 0.0% 0.0% 0.0% 0.5% 0.5% 0.5% 0.5% 0.8%
Total - Personal Property -1.5% -1.2% -1.1% -0.7% -0.2% -0.1% 0.3% 0.3% 0.4% 0.4% -0.3%
Preliminary forecast

59
10 YR Projections - With RRIs
Assessed Property Values
The 10 Yr projections – with RRIs - assumes real property values will decline
1.7% during the FY2014-2023 period, and personal property will increase by 0.9%
during that same time period. The Renaissance Zone is forecasted to increase 4.8%
annually during the ten year period – aided by the 47% forecasted growth assumption
in FY2014.
In January 2014, the City launched a property tax assessment reform designed
to make Detroit more attractive to current and prospective residents. As initial
studies have indicated that significant portions of the City are over-assessed, the
assessment reform is likely to result, in the near term, in reduced assessments and
property tax revenues. This scenario is forecasted via an assumed 9% decline in real
property assessments in FY2015 and a 3-4% drop in FY2015. The City believes that
reduced assessments will result in improved property tax collection rates and, in the
longer term, increased property values as Detroit becomes a more desirable location.
Collection Rates
The POA forecast assumes improving property tax collection over the
FY2014-2023 timeframe. The 10 Yr projections assume collections for non-
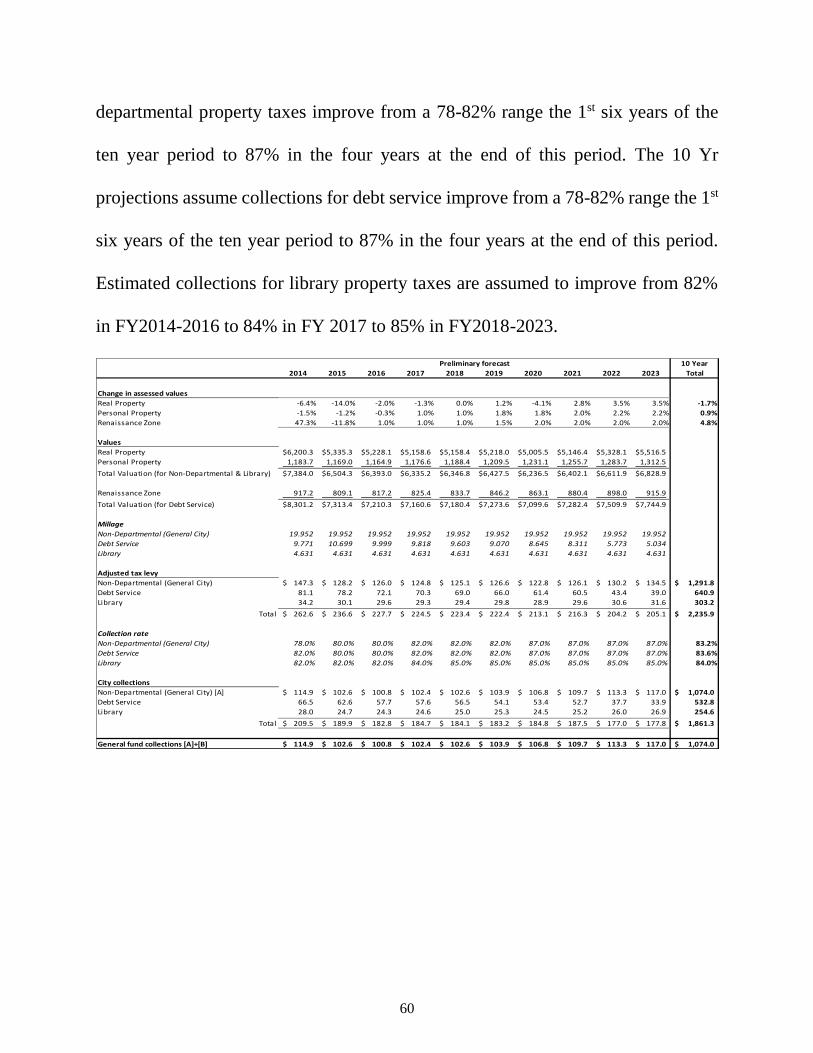
60
departmental property taxes improve from a 78-82% range the 1st six years of the
ten year period to 87% in the four years at the end of this period. The 10 Yr
projections assume collections for debt service improve from a 78-82% range the 1st
six years of the ten year period to 87% in the four years at the end of this period.
Estimated collections for library property taxes are assumed to improve from 82%
in FY2014-2016 to 84% in FY 2017 to 85% in FY2018-2023.
10 Year
2014 2015 2016 2017 2018 2019 2020 2021 2022 2023 Total
Change in assessed values
Real Property -6.4% -14.0% -2.0% -1.3% 0.0% 1.2% -4.1% 2.8% 3.5% 3.5% -1.7%
Personal Property -1.5% -1.2% -0.3% 1.0% 1.0% 1.8% 1.8% 2.0% 2.2% 2.2% 0.9%
Renaissance Zone 47.3% -11.8% 1.0% 1.0% 1.0% 1.5% 2.0% 2.0% 2.0% 2.0% 4.8%
Values
Real Property 6,200.3$ 5,335.3$ 5,228.1$ 5,158.6$ 5,158.4$ 5,218.0$ 5,005.5$ 5,146.4$ 5,328.1$ 5,516.5$
Personal Property 1,183.7 1,169.0 1,164.9 1,176.6 1,188.4 1,209.5 1,231.1 1,255.7 1,283.7 1,312.5
Total Valuation (for Non-Departmental & Library) 7,384.0$ 6,504.3$ 6,393.0$ 6,335.2$ 6,346.8$ 6,427.5$ 6,236.5$ 6,402.1$ 6,611.9$ 6,828.9$
Renaissance Zone 917.2 809.1 817.2 825.4 833.7 846.2 863.1 880.4 898.0 915.9
Total Valuation (for Debt Service) 8,301.2$ 7,313.4$ 7,210.3$ 7,160.6$ 7,180.4$ 7,273.6$ 7,099.6$ 7,282.4$ 7,509.9$ 7,744.9$
Millage
Non-Departmental (General City) 19.952 19.952 19.952 19.952 19.952 19.952 19.952 19.952 19.952 19.952
Debt Service 9.771 10.699 9.999 9.818 9.603 9.070 8.645 8.311 5.773 5.034
Library 4.631 4.631 4.631 4.631 4.631 4.631 4.631 4.631 4.631 4.631
Adjusted tax levy
Non-Departmental (General City) 147.3$ 128.2$ 126.0$ 124.8$ 125.1$ 126.6$ 122.8$ 126.1$ 130.2$ 134.5$ 1,291.8$
Debt Service 81.1 78.2 72.1 70.3 69.0 66.0 61.4 60.5 43.4 39.0 640.9
Library 34.2 30.1 29.6 29.3 29.4 29.8 28.9 29.6 30.6 31.6 303.2
Total 262.6$ 236.6$ 227.7$ 224.5$ 223.4$ 222.4$ 213.1$ 216.3$ 204.2$ 205.1$ 2,235.9$
Collection rate
Non-Departmental (General City) 78.0% 80.0% 80.0% 82.0% 82.0% 82.0% 87.0% 87.0% 87.0% 87.0% 83.2%
Debt Service 82.0% 80.0% 80.0% 82.0% 82.0% 82.0% 87.0% 87.0% 87.0% 87.0% 83.6%
Library 82.0% 82.0% 82.0% 84.0% 85.0% 85.0% 85.0% 85.0% 85.0% 85.0% 84.0%
City collections
Non-Departmental (General City) [A] 114.9$ 102.6$ 100.8$ 102.4$ 102.6$ 103.9$ 106.8$ 109.7$ 113.3$ 117.0$ 1,074.0$
Debt Service 66.5 62.6 57.7 57.6 56.5 54.1 53.4 52.7 37.7 33.9 532.8
Library 28.0 24.7 24.3 24.6 25.0 25.3 24.5 25.2 26.0 26.9 254.6
Total 209.5$ 189.9$ 182.8$ 184.7$ 184.1$ 183.2$ 184.8$ 187.5$ 177.0$ 177.8$ 1,861.3$
General fund collections [A]+[B] 114.9$ 102.6$ 100.8$ 102.4$ 102.6$ 103.9$ 106.8$ 109.7$ 113.3$ 117.0$ 1,074.0$
Preliminary forecast

61
Components of Property Tax Value
Sensitivity Analysis
The Sensitivity analysis below estimates the impact of a 1% change in the
forecasted collection rate for each category of property classification in both the
“with RRIs” and “without RRIs” scenarios.
For the Without RRIs scenario, every 1% change in the 10 Yr assumption will
result in an approximate $21 million change in collected income tax revenues in the
10 Year
2014 2015 2016 2017 2018 2019 2020 2021 2022 2023 Total
Components of Property Taxable Value (non - RZ)
Residential Property 3,948.1 3,138.7 3,044.5 2,953.2 2,908.9 2,923.4 2,660.3 2,740.1 2,849.7 2,963.7
Real Property - Commercial 1,786.9 1,750.0 1,732.5 1,749.8 1,784.8 1,820.5 1,856.9 1,903.3 1,960.4 2,019.2
Real Property - Industrial 465.4 446.7 451.1 455.7 464.8 474.1 488.3 502.9 518.0 533.6
Total - Real Property 6,200.3 5,335.3 5,228.1 5,158.6 5,158.4 5,218.0 5,005.5 5,146.4 5,328.1 5,516.5
Forecasted YoY Change - Real Property
Residential Property -7.4% -20.5% -3.0% -3.0% -1.5% 0.5% -9.0% 3.0% 4.0% 4.0% -3.3%
Real Property - Commercial -5.0% -2.1% -1.0% 1.0% 2.0% 2.0% 2.0% 2.5% 3.0% 3.0% 0.7%
Real Property - Industrial -2.5% -4.0% 1.0% 1.0% 2.0% 2.0% 3.0% 3.0% 3.0% 3.0% 1.1%
Total - Real Property -6.4% -14.0% -2.0% -1.3% 0.0% 1.2% -4.1% 2.8% 3.5% 3.5% -1.7%
Personal Property - Commercial 529.5 524.1 513.6 518.8 523.9 534.4 545.1 558.7 575.5 592.8
Personal Property - Industrial 290.4 253.7 256.3 258.8 261.4 264.0 266.7 269.3 272.0 274.7
Personal Property - Util ity 363.7 391.2 395.1 399.0 403.0 411.1 419.3 427.7 436.2 445.0
Total - Personal Property 1,183.7 1,169.0 1,164.9 1,176.6 1,188.4 1,209.5 1,231.1 1,255.7 1,283.7 1,312.5
Forecasted YoY Change - Personal Property
Personal Property - Commercial -3.8% -1.0% -2.0% 1.0% 1.0% 2.0% 2.0% 2.5% 3.0% 3.0% 0.8%
Personal Property - Industrial 3.2% -12.6% 1.0% 1.0% 1.0% 1.0% 1.0% 1.0% 1.0% 1.0% -0.1%
Personal Property - Util ity -1.6% 7.5% 1.0% 1.0% 1.0% 2.0% 2.0% 2.0% 2.0% 2.0% 1.9%
Total - Personal Property -1.5% -1.2% -0.3% 1.0% 1.0% 1.8% 1.8% 2.0% 2.2% 2.2% 0.9%
Preliminary forecast
FY2014-2023
2014 2015 2016 2017 2018 2019 2020 2021 2022 2023 Total
For Every 1% Change in Annual Collection Rates
Without Reinvestment
Real Property 1.5 1.3 1.2 1.2 1.2 1.2 1.1 1.1 1.1 1.1 11.9
Personal Property 0.8 0.8 0.7 0.7 0.7 0.7 0.6 0.6 0.4 0.4 6.5
Renaissance Zone 0.3 0.3 0.3 0.3 0.3 0.3 0.3 0.3 0.3 0.3 2.8
Total 2.6 2.4 2.3 2.2 2.2 2.1 2.0 2.0 1.8 1.7 21.2
With Reinvestment
Real Property 1.5 1.3 1.3 1.2 1.3 1.3 1.2 1.3 1.3 1.3 12.9
Personal Property 0.8 0.8 0.7 0.7 0.7 0.7 0.6 0.6 0.4 0.4 6.4
Renaissance Zone 0.3 0.3 0.3 0.3 0.3 0.3 0.3 0.3 0.3 0.3 3.0
Total 2.6 2.4 2.3 2.2 2.2 2.2 2.1 2.2 2.0 2.1 22.4
Preliminary forecast
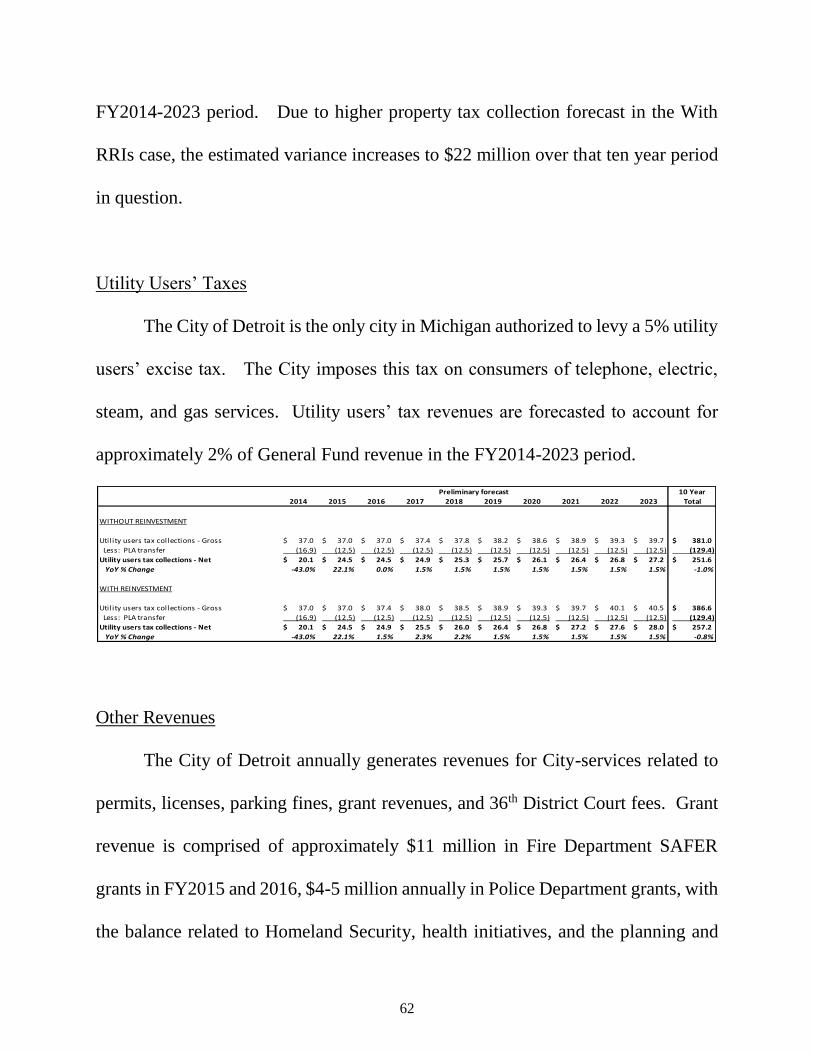
62
FY2014-2023 period. Due to higher property tax collection forecast in the With
RRIs case, the estimated variance increases to $22 million over that ten year period
in question.
Utility Users’ Taxes
The City of Detroit is the only city in Michigan authorized to levy a 5% utility
users’ excise tax. The City imposes this tax on consumers of telephone, electric,
steam, and gas services. Utility users’ tax revenues are forecasted to account for
approximately 2% of General Fund revenue in the FY2014-2023 period.
Other Revenues
The City of Detroit annually generates revenues for City-services related to
permits, licenses, parking fines, grant revenues, and 36th District Court fees. Grant
revenue is comprised of approximately $11 million in Fire Department SAFER
grants in FY2015 and 2016, $4-5 million annually in Police Department grants, with
the balance related to Homeland Security, health initiatives, and the planning and
10 Year
2014 2015 2016 2017 2018 2019 2020 2021 2022 2023 Total
WITHOUT REINVESTMENT
Utility users tax collections - Gross 37.0$ 37.0$ 37.0$ 37.4$ 37.8$ 38.2$ 38.6$ 38.9$ 39.3$ 39.7$ 381.0$
Less: PLA transfer (16.9) (12.5) (12.5) (12.5) (12.5) (12.5) (12.5) (12.5) (12.5) (12.5) (129.4)
Utility users tax collections - Net 20.1$ 24.5$ 24.5$ 24.9$ 25.3$ 25.7$ 26.1$ 26.4$ 26.8$ 27.2$ 251.6$
YoY % Change -43.0% 22.1% 0.0% 1.5% 1.5% 1.5% 1.5% 1.5% 1.5% 1.5% -1.0%
WITH REINVESTMENT
Utility users tax collections - Gross 37.0$ 37.0$ 37.4$ 38.0$ 38.5$ 38.9$ 39.3$ 39.7$ 40.1$ 40.5$ 386.6$
Less: PLA transfer (16.9) (12.5) (12.5) (12.5) (12.5) (12.5) (12.5) (12.5) (12.5) (12.5) (129.4)
Utility users tax collections - Net 20.1$ 24.5$ 24.9$ 25.5$ 26.0$ 26.4$ 26.8$ 27.2$ 27.6$ 28.0$ 257.2$
YoY % Change -43.0% 22.1% 1.5% 2.3% 2.2% 1.5% 1.5% 1.5% 1.5% 1.5% -0.8%
Preliminary forecast

63
development department. Other revenues are forecasted to account for
approximately 7% of General Fund revenue in the FY2014-2023 period.
10 Year
2014 2015 2016 2017 2018 2019 2020 2021 2022 2023 Total
Parking/court fines and other revenue 29.2$ 29.2$ 29.2$ 29.2$ 29.2$ 29.2$ 29.2$ 29.2$ 29.2$ 29.2$ 291.9$
YoY % Change -7.1% 0.0% 0.0% 0.0% 0.0% 0.0% 0.0% 0.0% 0.0% 0.0% -0.7%
Grant revenue 27.9$ 27.1$ 25.6$ 14.2$ 14.5$ 14.8$ 15.0$ 15.3$ 15.5$ 15.8$ 185.7$
YoY % Change -52.0% -3.1% -5.3% -44.7% 2.5% 1.7% 1.7% 1.7% 1.6% 1.6% -9.4%
Licenses, permits and inspection charges 9.0$ 9.1$ 9.1$ 9.1$ 9.2$ 9.2$ 9.3$ 9.3$ 9.3$ 9.4$ 92.0$
YoY % Change -15.5% 0.4% 0.4% 0.4% 0.4% 0.5% 0.5% 0.5% 0.5% 0.5% -1.1%
Revenue from use of assets 4.1$ 11.7$ 5.2$ 5.2$ 3.6$ 3.6$ 3.6$ 3.6$ 3.6$ 3.6$ 47.6$
YoY % Change -64.3% 185.7% -55.4% 0.0% -31.9% 0.0% 0.0% 0.0% 0.0% 0.0% 3.4%
Other Taxes 9.6$ 9.6$ 9.6$ 9.6$ 9.6$ 9.6$ 9.6$ 9.6$ 9.6$ 9.6$ 95.6$
YoY % Change -16.7% 0.0% 0.0% 0.0% 0.0% 0.0% 0.0% 0.0% 0.0% 0.0% -1.7%
Total - Other Revenue 79.8$ 86.6$ 78.7$ 67.3$ 66.0$ 66.3$ 66.6$ 66.9$ 67.2$ 67.5$ 712.8$
-28.6% 8.5% -9.1% -14.5% -1.9% 0.4% 0.5% 0.4% 0.4% 0.4% -4.3%
Preliminary forecast

64
Section G - Operating Expenditures
Summary26
The operating expenditures in the City of Detroit’s POA 40 Yr Projections are
summarized below:
The City’s 10 Yr projections were developed by E&Y primarily to reflect the
“baseline” financial condition of the City in the summer of 2013, assuming no
changes in legacy obligations. These projections were prepared in significant detail
and are the initial building block for the financial forecasts that are contained in the
POA. The analysis below identifies the City’s individual operating expense
categories, the estimated growth for each category, and the key assumptions utilized.
These expenditures exclude the expenditures related to the RRIs even though the
26 Unless otherwise stated the financial projections referenced section G are sourced
from the bibliography: Ernst & Young Models: 10-11
General Fund Operating Expenditures
Salaries/Overtime/Fringe 3,768$ 47.3% 4,612$ 48.8% 5,700$ 48.1% 7,121$ 47.5%
Health Benefits 753$ 9.4% 928$ 9.8% 1,374$ 11.6% 2,034$ 13.6%
Active Pension 348$ 4.4% 444$ 4.7% 548$ 4.6% 683$ 4.6%
OPEB Future Retirees 32$ 0.4% 37$ 0.4% 43$ 0.4% 51$ 0.3%
Professional and contractual servicesOther Operating Expenses 3,073$ 38.5% 3,437$ 36.3% 4,190$ 35.3% 5,108$ 34.1%
Total General Fund Operating Expenditures 7,974$ 100.0% 9,458$ 100.0% 11,855$ 100.0% 14,997$ 100.0%
FY2014-2023 FY2044-2053FY2024-2033 FY2034-2043
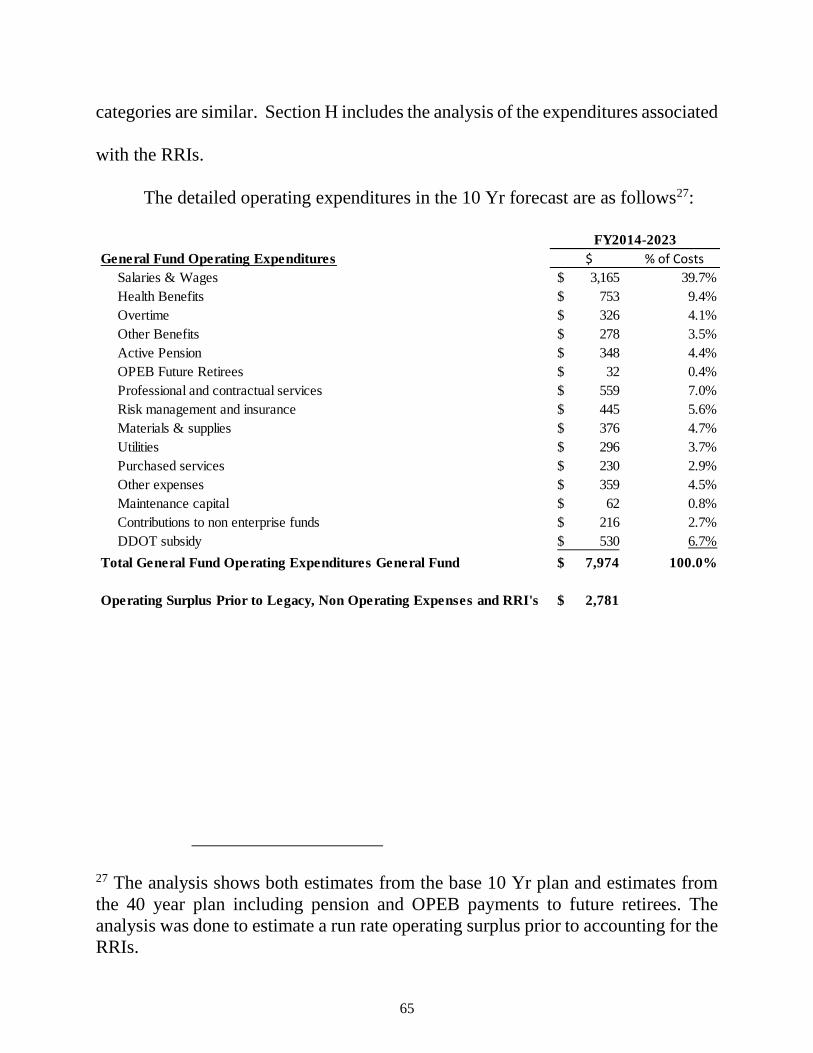
65
categories are similar. Section H includes the analysis of the expenditures associated
with the RRIs.
The detailed operating expenditures in the 10 Yr forecast are as follows27:
27 The analysis shows both estimates from the base 10 Yr plan and estimates from
the 40 year plan including pension and OPEB payments to future retirees. The
analysis was done to estimate a run rate operating surplus prior to accounting for the
RRIs.
General Fund Operating Expenditures $ % of Costs
Salaries & Wages 3,165$ 39.7%
Health Benefits 753$ 9.4%
Overtime 326$ 4.1%
Other Benefits 278$ 3.5%
Active Pension 348$ 4.4%
OPEB Future Retirees 32$ 0.4%
Professional and contractual services 559$ 7.0%
Risk management and insurance 445$ 5.6%
Materials & supplies 376$ 4.7%
Utilities 296$ 3.7%
Purchased services 230$ 2.9%
Other expenses 359$ 4.5%
Maintenance capital 62$ 0.8%
Contributions to non enterprise funds 216$ 2.7%
DDOT subsidy 530$ 6.7%
Total General Fund Operating Expenditures General Fund 7,974$ 100.0%
Operating Surplus Prior to Legacy, Non Operating Expenses and RRI's 2,781$
FY2014-2023

66
Salaries & Wages
Salaries and wages related to the General Fund were $297.6 million in
FY2013 and accounted for 40.4% of the City’s estimated operating expenses. By
FY2023, the City is projecting Salaries and Wages to represent 39.7% of operating
expenses prior to the additional headcount from the RRIs.
Headcount
City-wide headcount in FY2013 was 10,04328 versus the prior 5 year average
of 12,610. The City projected headcount using the projected FY2013 headcount by
department and assuming that headcount remained constant over the next ten years
except for the following exceptions:
Departments that are being outsourced including: DWDD, Human
Services, PLD, Homeland Security and the majority of the Health and
Wellness and City Council Departments. The City also adjusted some
department headcount estimates higher or lower than FY2013 based on the
most recent information from FY2014
The Finance and HR department headcount reductions due to the
implementation of a new payroll service in FY2017
The Police and Fire Departments include projections for attrition and new
hires beginning in FY2015
28 The 2013 headcount is from the 10 Yr base model and was the estimated
headcount when the financial model was initially prepared. The assumptions are
based off of the projected headcount going forward. Actual headcount by
department differs by this amount. The analysis in this section will reference the
2013 headcount in the base 10 Yr plan.

67
Total employees across all departments is projected to be 9,742 in FY2023
versus 10,043 in FY2013 or a 3.1% decrease. The average headcount from FY2008-
FY2012 was 12,610 and the FY2023 headcount represents a 22.7% decrease from
this level. Projected headcount by department:
A comparison of FY2023 with FY2013 headcount for the General Fund and
Enterprise Funds is shown below:
Department 2014 2015 2016 2017 2018 2019 2020 2021 2022 2023
Police 2,706 2,747 2,882 2,895 2,895 2,895 2,895 2,895 2,895 2,895
Fire 1,183 1,238 1,228 1,228 1,228 1,228 1,228 1,228 1,228 1,228
Transportation 978 1,048 1,065 1,065 1,065 1,065 1,065 1,065 1,065 1,065
Sewer 1,016 1,016 1,016 1,016 1,016 1,016 1,016 1,016 1,016 1,016
Water 873 873 873 873 873 873 873 873 873 873
36th District Court 362 362 362 362 362 362 362 362 362 362
Library 335 335 335 335 335 335 335 335 335 335
General Services 298 272 272 272 272 272 272 272 272 272
Waste 265 265 265 265 265 265 265 265 265 265
Streets 230 225 225 225 225 225 225 225 225 225
Finance 216 216 216 206 206 206 206 206 206 206
Recreation 202 202 202 202 202 202 202 202 202 202
BSED 192 192 192 192 192 192 192 192 192 192
Planning & Development 116 113 113 113 113 113 113 113 113 113
Parking 90 90 90 90 90 90 90 90 90 90
Law 86 86 86 86 86 86 86 86 86 86
Elections 80 60 60 60 60 60 60 60 60 60
Human Resources 84 84 84 60 60 60 60 60 60 60
ITS 35 38 38 38 38 38 38 38 38 38
Mayor 22 24 24 24 24 24 24 24 24 24
Public Works 14 19 19 19 19 19 19 19 19 19
Non-Departmental 21 17 17 17 17 17 17 17 17 17
Auditor General 17 17 17 17 17 17 17 17 17 17
Budget 16 16 16 16 16 16 16 16 16 16
City Clerk 15 15 15 15 15 15 15 15 15 15
Zoning 11 11 11 11 11 11 11 11 11 11
City Council 9 10 10 10 10 10 10 10 10 10
Health & Wellness 14 9 9 9 9 9 9 9 9 9
Ombudsperson 6 6 6 6 6 6 6 6 6 6
Human Rights 5 5 5 5 5 5 5 5 5 5
Airport 5 5 5 5 5 5 5 5 5 5
Administrative Hearings 4 4 4 4 4 4 4 4 4 4
PLD 70 12 7 5 3 3 3 2 - -
Total 9,578 9,634 9,770 9,747 9,745 9,745 9,745 9,744 9,742 9,742
Preliminary Forecast
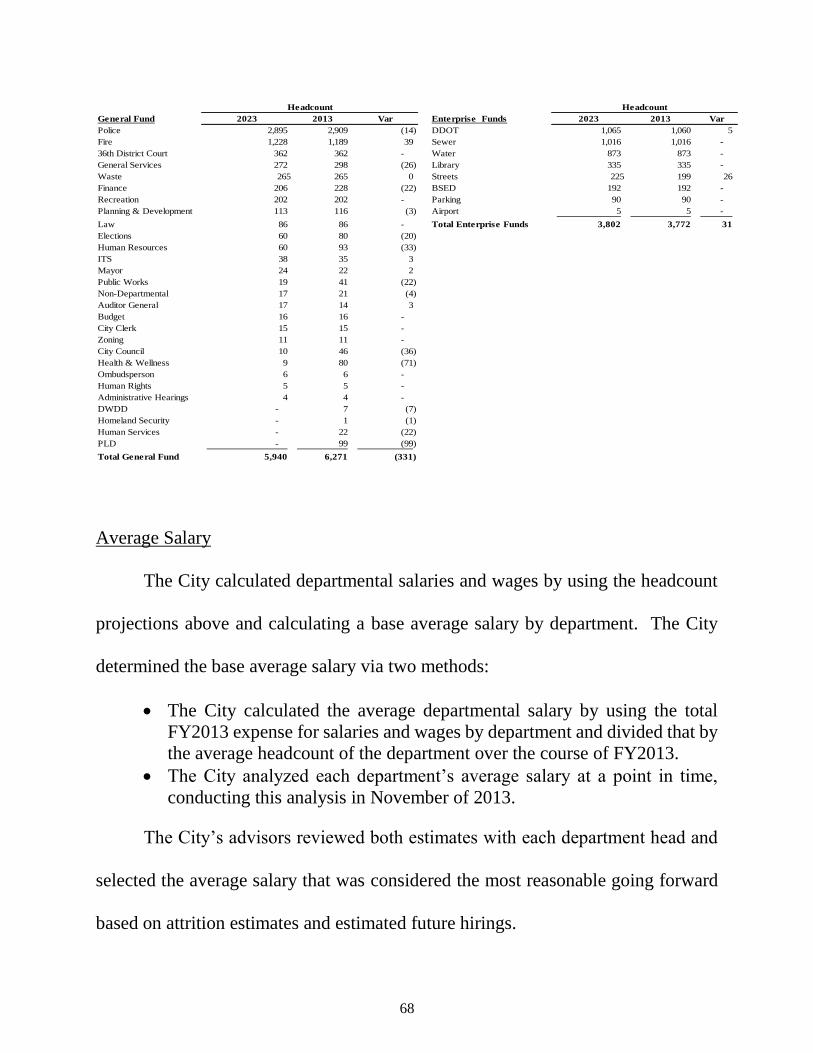
68
Average Salary
The City calculated departmental salaries and wages by using the headcount
projections above and calculating a base average salary by department. The City
determined the base average salary via two methods:
The City calculated the average departmental salary by using the total
FY2013 expense for salaries and wages by department and divided that by
the average headcount of the department over the course of FY2013.
The City analyzed each department’s average salary at a point in time,
conducting this analysis in November of 2013.
The City’s advisors reviewed both estimates with each department head and
selected the average salary that was considered the most reasonable going forward
based on attrition estimates and estimated future hirings.
General Fund 2023 2013 Var Enterprise Funds 2023 2013 Var
Police 2,895 2,909 (14) DDOT 1,065 1,060 5
Fire 1,228 1,189 39 Sewer 1,016 1,016 -
36th District Court 362 362 - Water 873 873 -
General Services 272 298 (26) Library 335 335 -
Waste 265 265 0 Streets 225 199 26
Finance 206 228 (22) BSED 192 192 -
Recreation 202 202 - Parking 90 90 -
Planning & Development 113 116 (3) Airport 5 5 -
Law 86 86 - Total Enterprise Funds 3,802 3,772 31
Elections 60 80 (20)
Human Resources 60 93 (33)
ITS 38 35 3
Mayor 24 22 2
Public Works 19 41 (22)
Non-Departmental 17 21 (4)
Auditor General 17 14 3
Budget 16 16 -
City Clerk 15 15 -
Zoning 11 11 -
City Council 10 46 (36)
Health & Wellness 9 80 (71)
Ombudsperson 6 6 -
Human Rights 5 5 -
Administrative Hearings 4 4 -
DWDD - 7 (7)
Homeland Security - 1 (1)
Human Services - 22 (22)
PLD - 99 (99)
Total General Fund 5,940 6,271 (331)
Headcount Headcount

69
City-wide 10% wage reductions were implemented prior to FY2014 for the
majority of employees. The Fire and Police departments FY2014 average salaries
were adjusted by 4.1% and 2.1% in the projections respectively to account for 10%
wage reductions for the remaining employees with contracts that expired in FY2013.
It should be noted that the baseline 10 Yr model used average salaries for the
Fire and Police departments even though employees leaving via attrition will be
replaced by employees at lower wages and new employees will most likely be entry
level employees at lower salary levels. This assumption change was made recently
and adjusted in the July 2, 2014 RRIs for each respective department. The add backs
can be seen in Section H. The average wages also include a 10% wage reduction to
36th District Court employees from FY2013 levels in 2014. For all employees, wage
inflation is assumed with the following schedule:
Year YoY Change
2015 5.0%
2016 0.0%
2017 2.5%
2018 2.5%
2019 2.5%
2020 2.0%
2021 2.0%
2022 2.0%
2023 2.0%

70
Projected average salary by department by year:
Department Salaries and Wages
The Police and Fire departments represent 76.5% of total salaries and wages
in the General Fund. The following charts summarize the salaries and wages by
department over the 10 year period for labor costs reflected in the General Fund and
the Enterprise Funds:
Department 2014 2015 2016 2017 2018 2019 2020 2021 2022 2023
Police 51,514$ 54,454$ 54,454$ 55,816$ 57,211$ 58,641$ 59,814$ 61,010$ 62,231$ 63,475$
Fire 55,950$ 58,747$ 58,747$ 60,216$ 61,721$ 63,264$ 64,530$ 65,820$ 67,137$ 68,479$
Transportation 30,767$ 32,306$ 32,306$ 33,113$ 33,941$ 34,790$ 35,486$ 36,195$ 36,919$ 37,658$
Sewer 56,127$ 58,933$ 58,933$ 60,406$ 61,916$ 63,464$ 64,734$ 66,028$ 67,349$ 68,696$
Water 40,481$ 42,505$ 42,505$ 43,568$ 44,657$ 45,774$ 46,689$ 47,623$ 48,575$ 49,547$
36th District Court 46,252$ 48,564$ 48,564$ 49,779$ 51,023$ 52,299$ 53,345$ 54,411$ 55,500$ 56,610$
Library -$ -$ -$ -$ -$ -$ -$ -$ -$ -$
General Services 33,501$ 35,176$ 35,176$ 36,056$ 36,957$ 37,881$ 38,639$ 39,412$ 40,200$ 41,004$
Waste 33,188$ 34,847$ 34,847$ 35,718$ 36,611$ 37,527$ 38,277$ 39,043$ 39,823$ 40,620$
Streets 33,188$ 34,847$ 34,847$ 35,718$ 36,611$ 37,527$ 38,277$ 39,043$ 39,823$ 40,620$
Finance 45,415$ 47,685$ 47,685$ 48,878$ 50,099$ 51,352$ 52,379$ 53,427$ 54,495$ 55,585$
Recreation 16,904$ 17,749$ 17,749$ 18,193$ 18,648$ 19,114$ 19,496$ 19,886$ 20,284$ 20,690$
BSED 47,306$ 49,672$ 49,672$ 50,913$ 52,186$ 53,491$ 54,561$ 55,652$ 56,765$ 57,900$
Planning & Development 53,640$ 56,322$ 56,322$ 57,730$ 59,173$ 60,652$ 61,865$ 63,103$ 64,365$ 65,652$
Parking 33,594$ 35,274$ 35,274$ 36,156$ 37,060$ 37,986$ 38,746$ 39,521$ 40,312$ 41,118$
Law 71,497$ 75,072$ 75,072$ 76,949$ 78,873$ 80,844$ 82,461$ 84,111$ 85,793$ 87,509$
Elections 27,971$ 29,370$ 29,370$ 30,104$ 30,856$ 31,628$ 32,260$ 32,906$ 33,564$ 34,235$
Human Resources 49,727$ 52,213$ 52,213$ 53,519$ 54,857$ 56,228$ 57,353$ 58,500$ 59,670$ 60,863$
ITS 57,494$ 60,369$ 60,369$ 61,878$ 63,425$ 65,011$ 66,311$ 67,637$ 68,990$ 70,369$
Mayor 92,861$ 97,504$ 97,504$ 99,942$ 102,440$ 105,001$ 107,101$ 109,243$ 111,428$ 113,657$
Public Works 46,029$ 41,811$ 41,811$ 42,856$ 43,927$ 45,025$ 45,926$ 46,844$ 47,781$ 48,737$
Non-Departmental 80,395$ 84,414$ 84,414$ 86,525$ 88,688$ 90,905$ 92,723$ 94,578$ 96,469$ 98,399$
Auditor General 65,304$ 68,569$ 68,569$ 70,283$ 72,041$ 73,842$ 75,318$ 76,825$ 78,361$ 79,928$
Budget 64,173$ 67,381$ 67,381$ 69,066$ 70,792$ 72,562$ 74,013$ 75,494$ 77,003$ 78,544$
City Clerk 46,300$ 48,615$ 48,615$ 49,831$ 51,076$ 52,353$ 53,400$ 54,468$ 55,558$ 56,669$
Zoning 25,120$ 26,376$ 26,376$ 27,035$ 27,711$ 28,404$ 28,972$ 29,551$ 30,142$ 30,745$
City Council 68,378$ 71,500$ 71,500$ 73,288$ 75,120$ 76,998$ 78,538$ 80,108$ 81,711$ 83,345$
Health & Wellness 60,946$ 73,547$ 73,547$ 75,386$ 77,270$ 79,202$ 80,786$ 82,402$ 84,050$ 85,731$
Ombudsperson 81,064$ 85,117$ 85,117$ 87,245$ 89,426$ 91,662$ 93,495$ 95,365$ 97,272$ 99,217$
Human Rights 57,093$ 59,948$ 59,948$ 61,447$ 62,983$ 64,558$ 65,849$ 67,166$ 68,509$ 69,879$
Airport 64,882$ 68,126$ 68,126$ 69,829$ 71,575$ 73,364$ 74,832$ 76,328$ 77,855$ 79,412$
Administrative Hearings 82,422$ 86,544$ 86,544$ 88,707$ 90,925$ 93,198$ 95,062$ 96,963$ 98,902$ 100,881$
PLD 49,211$ 84,190$ 81,474$ 79,817$ 79,591$ 81,182$ 82,806$ 84,462$ -$ -$
Preliminary Forecast
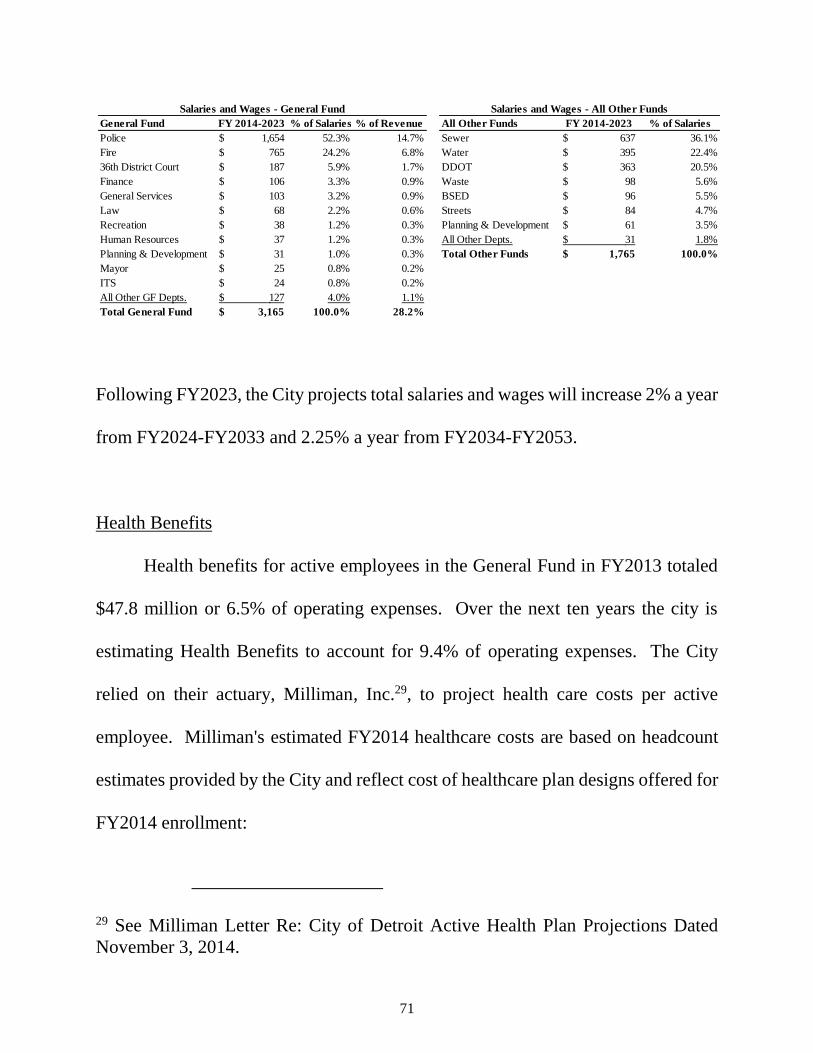
71
Following FY2023, the City projects total salaries and wages will increase 2% a year
from FY2024-FY2033 and 2.25% a year from FY2034-FY2053.
Health Benefits
Health benefits for active employees in the General Fund in FY2013 totaled
$47.8 million or 6.5% of operating expenses. Over the next ten years the city is
estimating Health Benefits to account for 9.4% of operating expenses. The City
relied on their actuary, Milliman, Inc.29, to project health care costs per active
employee. Milliman's estimated FY2014 healthcare costs are based on headcount
estimates provided by the City and reflect cost of healthcare plan designs offered for
FY2014 enrollment:
29 See Milliman Letter Re: City of Detroit Active Health Plan Projections Dated
November 3, 2014.
General Fund FY 2014-2023 % of Salaries % of Revenue All Other Funds FY 2014-2023 % of Salaries
Police 1,654$ 52.3% 14.7% Sewer 637$ 36.1%
Fire 765$ 24.2% 6.8% Water 395$ 22.4%
36th District Court 187$ 5.9% 1.7% DDOT 363$ 20.5%
Finance 106$ 3.3% 0.9% Waste 98$ 5.6%
General Services 103$ 3.2% 0.9% BSED 96$ 5.5%
Law 68$ 2.2% 0.6% Streets 84$ 4.7%
Recreation 38$ 1.2% 0.3% Planning & Development 61$ 3.5%
Human Resources 37$ 1.2% 0.3% All Other Depts. 31$ 1.8%
Planning & Development 31$ 1.0% 0.3% Total Other Funds 1,765$ 100.0%
Mayor 25$ 0.8% 0.2%
ITS 24$ 0.8% 0.2%
All Other GF Depts. 127$ 4.0% 1.1%
Total General Fund 3,165$ 100.0% 28.2%
Salaries and Wages - General Fund Salaries and Wages - All Other Funds

72
Milliman projected estimates for year over year percent changes in healthcare
costs per employee from FY2015 thru FY2019. After FY2019 the City projected
annual healthcare increases. The City estimated 4% a year in annual inflation in
healthcare costs for FY2020 through FY2023.
Health benefits in the General Fund include $142.830 million of OPEB
payments for current retirees including $123.8 million in FY2014 and $19 million
in FY2015. The City continued to pay healthcare costs for retirees after filing
bankruptcy in the form of a stipend. The total amount projected to be paid was
deducted when calculating total recovery for the OPEB claim via UTGO Note A.
30 Total payments to current retirees in the financial model is actually $162.8 million.
This amount includes $20 million considered recovered after negotiations and it is
paid in cash under the sources section in the 40 Yr model along with other unsecured
creditors.
Headcount Medical Dental Vision Total 2014 Total
Uniform 3,957 8,459$ 667$ 79$ 9,205$ 36$
General 2,532 7,378$ 667$ 79$ 8,124$ 21$
DOT 936 9,087$ 667$ 87$ 9,841$ 9$
Water/Sewer 1,815 7,675$ 667$ 79$ 8,421$ 15$
Library 384 6,695$ 667$ 79$ 7,441$ 3$
Total 9,624 84$
Milliman Per Employee Estimate
FY2014
2015 2016 2017 2018 2019 2020 2021 2022 2023
Uniform -2.1% 6.8% 7.0% 7.3% 6.0% 4.0% 4.0% 4.0% 4.0%
General -4.4% 6.8% 7.1% 7.3% 6.0% 4.0% 4.0% 4.0% 4.0%
DOT -11.3% 6.7% 7.0% 7.3% 6.0% 4.0% 4.0% 4.0% 4.0%
Water/Sewer -1.3% 6.8% 7.0% 7.3% 6.0% 4.0% 4.0% 4.0% 4.0%
Library -2.8% 6.5% 7.1% 7.3% 6.0% 4.0% 4.0% 4.0% 4.0%
36th DC -4.0% 6.7% 7.0% 7.3% 6.0% 4.0% 4.0% 4.0% 4.0%
City EstimatesMilliman Letter Estimates
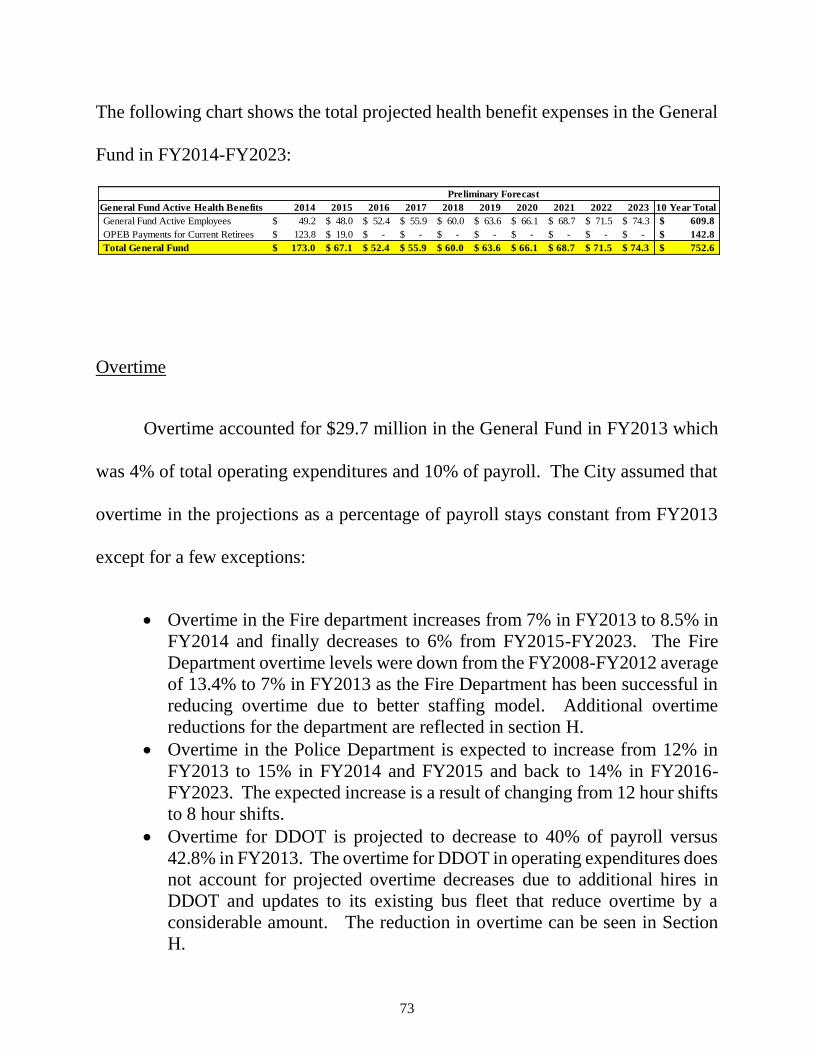
73
The following chart shows the total projected health benefit expenses in the General
Fund in FY2014-FY2023:
Overtime
Overtime accounted for $29.7 million in the General Fund in FY2013 which
was 4% of total operating expenditures and 10% of payroll. The City assumed that
overtime in the projections as a percentage of payroll stays constant from FY2013
except for a few exceptions:
Overtime in the Fire department increases from 7% in FY2013 to 8.5% in
FY2014 and finally decreases to 6% from FY2015-FY2023. The Fire
Department overtime levels were down from the FY2008-FY2012 average
of 13.4% to 7% in FY2013 as the Fire Department has been successful in
reducing overtime due to better staffing model. Additional overtime
reductions for the department are reflected in section H.
Overtime in the Police Department is expected to increase from 12% in
FY2013 to 15% in FY2014 and FY2015 and back to 14% in FY2016-
FY2023. The expected increase is a result of changing from 12 hour shifts
to 8 hour shifts.
Overtime for DDOT is projected to decrease to 40% of payroll versus
42.8% in FY2013. The overtime for DDOT in operating expenditures does
not account for projected overtime decreases due to additional hires in
DDOT and updates to its existing bus fleet that reduce overtime by a
considerable amount. The reduction in overtime can be seen in Section
H.
General Fund Active Health Benefits 2014 2015 2016 2017 2018 2019 2020 2021 2022 2023 10 Year Total
General Fund Active Employees 49.2$ 48.0$ 52.4$ 55.9$ 60.0$ 63.6$ 66.1$ 68.7$ 71.5$ 74.3$ 609.8$
OPEB Payments for Current Retirees 123.8$ 19.0$ -$ -$ -$ -$ -$ -$ -$ -$ 142.8$
Total General Fund 173.0$ 67.1$ 52.4$ 55.9$ 60.0$ 63.6$ 66.1$ 68.7$ 71.5$ 74.3$ 752.6$
Preliminary Forecast

74
The chart below highlights overtime across all departments as a percentage of
total department payroll:
The chart below highlights General Fund overtime paid over the ten year period:
The majority of overtime in the General Fund is driven by Police, Fire and
General Services. Overtime for DDOT is projected to be $145 million over the 10
Department 2013 2014 2015 2016 2017 2018 2019 2020 2021 2022 2023
Police 12.0% 15.0% 15.0% 14.0% 14.0% 14.0% 14.0% 14.0% 14.0% 14.0% 14.0%
Fire 7.0% 8.5% 6.0% 6.0% 6.0% 6.0% 6.0% 6.0% 6.0% 6.0% 6.0%
Transportation 42.8% 40.0% 40.0% 40.0% 40.0% 40.0% 40.0% 40.0% 40.0% 40.0% 40.0%
Sewer 19.9% 19.9% 19.9% 19.9% 19.9% 19.9% 19.9% 19.9% 19.9% 19.9% 19.9%
Water 18.5% 18.5% 18.5% 18.5% 18.5% 18.5% 18.5% 18.5% 18.5% 18.5% 18.5%
36th District Court 0.8% 0.8% 0.8% 0.8% 0.8% 0.8% 0.8% 0.8% 0.8% 0.8% 0.8%
General Services 22.9% 22.9% 22.9% 22.9% 22.9% 22.9% 22.9% 22.9% 22.9% 22.9% 22.9%
Waste 26.0% 26.0% 26.0% 26.0% 26.0% 26.0% 26.0% 26.0% 26.0% 26.0% 26.0%
Streets 8.6% 8.6% 8.6% 8.6% 8.6% 8.6% 8.6% 8.6% 8.6% 8.6% 8.6%
Finance 7.3% 7.3% 7.3% 7.3% 7.3% 7.3% 7.3% 7.3% 7.3% 7.3% 7.3%
Recreation 3.1% 3.1% 3.1% 3.1% 3.1% 3.1% 3.1% 3.1% 3.1% 3.1% 3.1%
BSED 3.9% 3.9% 3.9% 3.9% 3.9% 3.9% 3.9% 3.9% 3.9% 3.9% 3.9%
Planning & Development 1.9% 1.9% 1.9% 1.9% 1.9% 1.9% 1.9% 1.9% 1.9% 1.9% 1.9%
Parking 0.2% 0.2% 0.2% 0.2% 0.2% 0.2% 0.2% 0.2% 0.2% 0.2% 0.2%
Law 1.5% 1.5% 1.5% 1.5% 1.5% 1.5% 1.5% 1.5% 1.5% 1.5% 1.5%
Elections 20.8% 22.4% 10.6% 10.6% 10.6% 10.6% 10.6% 10.6% 10.6% 10.6% 10.6%
Human Resources 4.8% 4.8% 4.8% 4.8% 4.8% 4.8% 4.8% 4.8% 4.8% 4.8% 4.8%
ITS 4.3% 4.3% 4.3% 4.3% 4.3% 4.3% 4.3% 4.3% 4.3% 4.3% 4.3%
Mayor 0.0% 0.0% 0.0% 0.0% 0.0% 0.0% 0.0% 0.0% 0.0% 0.0% 0.0%
Public Works 7.3% 7.3% 7.3% 7.3% 7.3% 7.3% 7.3% 7.3% 7.3% 7.3% 7.3%
Non-Departmental 4.7% 4.7% 4.7% 4.7% 4.7% 4.7% 4.7% 4.7% 4.7% 4.7% 4.7%
Auditor General 2.4% 2.4% 2.4% 2.4% 2.4% 2.4% 2.4% 2.4% 2.4% 2.4% 2.4%
Budget 2.7% 2.7% 2.7% 2.7% 2.7% 2.7% 2.7% 2.7% 2.7% 2.7% 2.7%
City Clerk 0.1% 0.1% 0.1% 0.1% 0.1% 0.1% 0.1% 0.1% 0.1% 0.1% 0.1%
Zoning 0.0% 0.0% 0.0% 0.0% 0.0% 0.0% 0.0% 0.0% 0.0% 0.0% 0.0%
City Council 0.0% 0.0% 0.0% 0.0% 0.0% 0.0% 0.0% 0.0% 0.0% 0.0% 0.0%
Health & Wellness 0.6% 0.6% 0.6% 0.6% 0.6% 0.6% 0.6% 0.6% 0.6% 0.6% 0.6%
Ombudsperson 0.0% 0.0% 0.0% 0.0% 0.0% 0.0% 0.0% 0.0% 0.0% 0.0% 0.0%
Human Rights 0.0% 0.0% 0.0% 0.0% 0.0% 0.0% 0.0% 0.0% 0.0% 0.0% 0.0%
Airport 0.5% 0.5% 0.5% 0.5% 0.5% 0.5% 0.5% 0.5% 0.5% 0.5% 0.5%
Administrative Hearings 0.0% 0.0% 0.0% 0.0% 0.0% 0.0% 0.0% 0.0% 0.0% 0.0% 0.0%
PLD 49.8% 29.9% 10.0% 10.0% 10.0% 10.0% 10.0% 10.0% 10.0% 10.0% 10.0%
Preliminary Forecast
Department 10 Year Total % of Overtime
Police 235 72%
Fire 48 15%
General Services 24 7%
Finance 8 2%
All Other GF Depts. 12 4%
Total Overtime 326$ 100%
General Fund Overtime

75
year period. Although DDOT is not funded by the General Fund, the General Fund
does provide a subsidy to DDOT as it has historically operated at a deficit. Overtime
for the majority of departments has decreased from the FY2008-FY2012 average. If
the current assumptions are understated and actual overtime reverts back to FY2008-
FY2012 levels, the overtime costs could increase as shown below:
Other Benefits
Other benefits including social security, unemployment and life insurance
totaled $34 million in the General Fund in FY2013 representing 4.6% of operating
expenses and 11.4% of payroll. The City projected other benefits by calculating the
FY2013 cost per employee for each benefit and multiplying it by the number of
employees projected in FY2014. For the Fire and Police Departments, which have
both uniform and civilian employees, the City calculated the uniform employees at
the Police or Fire Department per employee cost and civilians at the General City
per employee cost. The analysis below highlights the calculations the City made
regarding fringe benefits:
Additional OT
Department 2008-2012 Avg 10 Yr Avg Var Over 10 Yrs at 08-12 Avg
Police 15.0% 14.2% 0.8% 14
Fire 13.4% 6.3% 7.1% 55
DDOT 44.6% 40.0% 4.6% 17
Total 85$
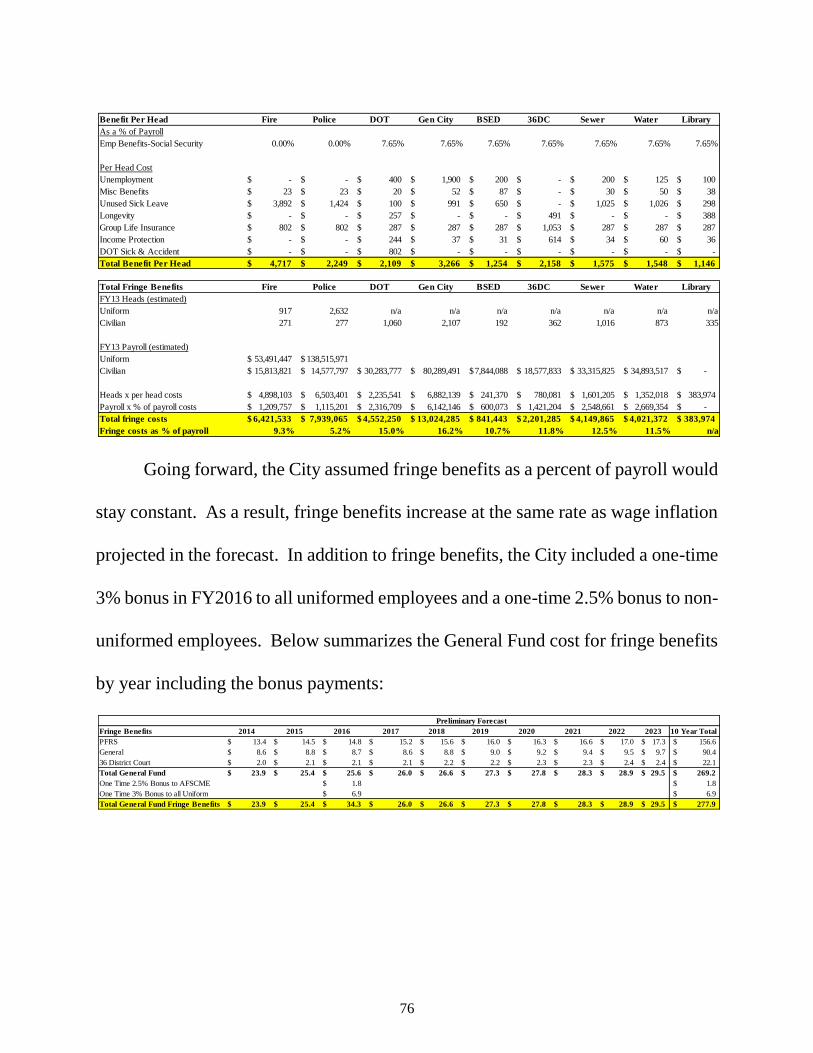
76
Going forward, the City assumed fringe benefits as a percent of payroll would
stay constant. As a result, fringe benefits increase at the same rate as wage inflation
projected in the forecast. In addition to fringe benefits, the City included a one-time
3% bonus in FY2016 to all uniformed employees and a one-time 2.5% bonus to non-
uniformed employees. Below summarizes the General Fund cost for fringe benefits
by year including the bonus payments:
Benefit Per Head Fire Police DOT Gen City BSED 36DC Sewer Water Library
As a % of Payroll
Emp Benefits-Social Security 0.00% 0.00% 7.65% 7.65% 7.65% 7.65% 7.65% 7.65% 7.65%
Per Head Cost
Unemployment -$ -$ 400$ 1,900$ 200$ -$ 200$ 125$ 100$
Misc Benefits 23$ 23$ 20$ 52$ 87$ -$ 30$ 50$ 38$
Unused Sick Leave 3,892$ 1,424$ 100$ 991$ 650$ -$ 1,025$ 1,026$ 298$
Longevity -$ -$ 257$ -$ -$ 491$ -$ -$ 388$
Group Life Insurance 802$ 802$ 287$ 287$ 287$ 1,053$ 287$ 287$ 287$
Income Protection -$ -$ 244$ 37$ 31$ 614$ 34$ 60$ 36$
DOT Sick & Accident -$ -$ 802$ -$ -$ -$ -$ -$ -$
Total Benefit Per Head 4,717$ 2,249$ 2,109$ 3,266$ 1,254$ 2,158$ 1,575$ 1,548$ 1,146$
Total Fringe Benefits Fire Police DOT Gen City BSED 36DC Sewer Water Library
FY13 Heads (estimated)
Uniform 917 2,632 n/a n/a n/a n/a n/a n/a n/a
Civilian 271 277 1,060 2,107 192 362 1,016 873 335
FY13 Payroll (estimated)
Uniform 53,491,447$ 138,515,971$
Civilian 15,813,821$ 14,577,797$ 30,283,777$ 80,289,491$ 7,844,088$ 18,577,833$ 33,315,825$ 34,893,517$ -$
Heads x per head costs 4,898,103$ 6,503,401$ 2,235,541$ 6,882,139$ 241,370$ 780,081$ 1,601,205$ 1,352,018$ 383,974$
Payroll x % of payroll costs 1,209,757$ 1,115,201$ 2,316,709$ 6,142,146$ 600,073$ 1,421,204$ 2,548,661$ 2,669,354$ -$
Total fringe costs 6,421,533$ 7,939,065$ 4,552,250$ 13,024,285$ 841,443$ 2,201,285$ 4,149,865$ 4,021,372$ 383,974$
Fringe costs as % of payroll 9.3% 5.2% 15.0% 16.2% 10.7% 11.8% 12.5% 11.5% n/a
Fringe Benefits 2014 2015 2016 2017 2018 2019 2020 2021 2022 2023 10 Year Total
PFRS 13.4$ 14.5$ 14.8$ 15.2$ 15.6$ 16.0$ 16.3$ 16.6$ 17.0$ 17.3$ 156.6$
General 8.6$ 8.8$ 8.7$ 8.6$ 8.8$ 9.0$ 9.2$ 9.4$ 9.5$ 9.7$ 90.4$
36 District Court 2.0$ 2.1$ 2.1$ 2.1$ 2.2$ 2.2$ 2.3$ 2.3$ 2.4$ 2.4$ 22.1$
Total General Fund 23.9$ 25.4$ 25.6$ 26.0$ 26.6$ 27.3$ 27.8$ 28.3$ 28.9$ 29.5$ 269.2$
One Time 2.5% Bonus to AFSCME 1.8$ 1.8$
One Time 3% Bonus to all Uniform 6.9$ 6.9$
Total General Fund Fringe Benefits 23.9$ 25.4$ 34.3$ 26.0$ 26.6$ 27.3$ 27.8$ 28.3$ 28.9$ 29.5$ 277.9$
Preliminary Forecast

77
Active Pension
The city is establishing a new hybrid pension plan for its active employees.
Details regarding the new pension plan are discussed in Section J. The City assumed
the following contributions per employee group as a percentage of payroll based on
the most recent negotiations:
The chart below summarizes the City’s yearly estimated contributions to the
pension plan:
Active OPEB
The city is establishing a Voluntary Employment Benefit Account (“VEBA”)
for its active employees' future healthcare costs. The City assumed a contribution
Contribution %
Non Public Safety 5.75%
Public Safety 12.25%
PLSA 12.25%
Active Pension 2014 2015 2016 2017 2018 2019 2020 2021 2022 2023 10 Year Total
Non Public Safety Payroll 69.8$ 71.9$ 69.8$ 71.3$ 72.9$ 74.7$ 76.2$ 77.7$ 79.1$ 80.6$ 744.1$
DDOT Payroll 30.1$ 33.9$ 34.4$ 35.3$ 36.1$ 37.1$ 37.8$ 38.5$ 39.3$ 40.1$ 362.6$
Total Non Uniform Payroll 99.9$ 105.8$ 104.2$ 106.6$ 109.1$ 111.8$ 114.0$ 116.2$ 118.4$ 120.7$ 1,106.7$
Non Public Safety Contribution 5.75% 5.75% 5.75% 5.75% 5.75% 5.75% 5.75% 5.75% 5.75% 5.75% 5.75%
Non Public Safety Active Pension 5.7$ 6.1$ 6.0$ 6.1$ 6.3$ 6.4$ 6.6$ 6.7$ 6.8$ 6.9$ 63.6$
Police Payroll (Excluding DPLSA) 102.0$ 110.4$ 117.7$ 121.4$ 124.4$ 127.5$ 130.1$ 132.7$ 135.3$ 138.0$ 1,239.4$
Police Contribution 12.25% 12.25% 12.25% 12.25% 12.25% 12.25% 12.25% 12.25% 12.25% 12.25% 12.25%
Police Active Pension 12.5$ 13.5$ 14.4$ 14.9$ 15.2$ 15.6$ 15.9$ 16.3$ 16.6$ 16.9$ 151.8$
Fire Payroll 66.2$ 72.7$ 72.1$ 73.9$ 75.8$ 77.7$ 79.2$ 80.8$ 82.4$ 84.1$ 765.1$
Fire Contribution 12.25% 12.25% 12.25% 12.25% 12.25% 12.25% 12.25% 12.25% 12.25% 12.25% 12.25%
Fire Active Pension 8.1$ 8.9$ 8.8$ 9.1$ 9.3$ 9.5$ 9.7$ 9.9$ 10.1$ 10.3$ 93.7$
DPLSA 37.1$ 39.0$ 39.0$ 39.9$ 40.9$ 42.0$ 42.8$ 43.6$ 44.5$ 45.4$ 414.2$
DPLSA Contribution 12.25% 12.25% 12.25% 12.25% 12.25% 12.25% 12.25% 12.25% 12.25% 12.25% 12.25%
DPLSA Active Pension 4.5$ 4.8$ 4.8$ 4.9$ 5.0$ 5.1$ 5.2$ 5.3$ 5.5$ 5.6$ 50.7$
Adjustment Year 1 (12.1)$ (12.1)$
Active Pension Contribution 18.8$ 33.3$ 34.0$ 34.9$ 35.8$ 36.7$ 37.4$ 38.2$ 38.9$ 39.7$ 347.8$
Preliminary Forecast
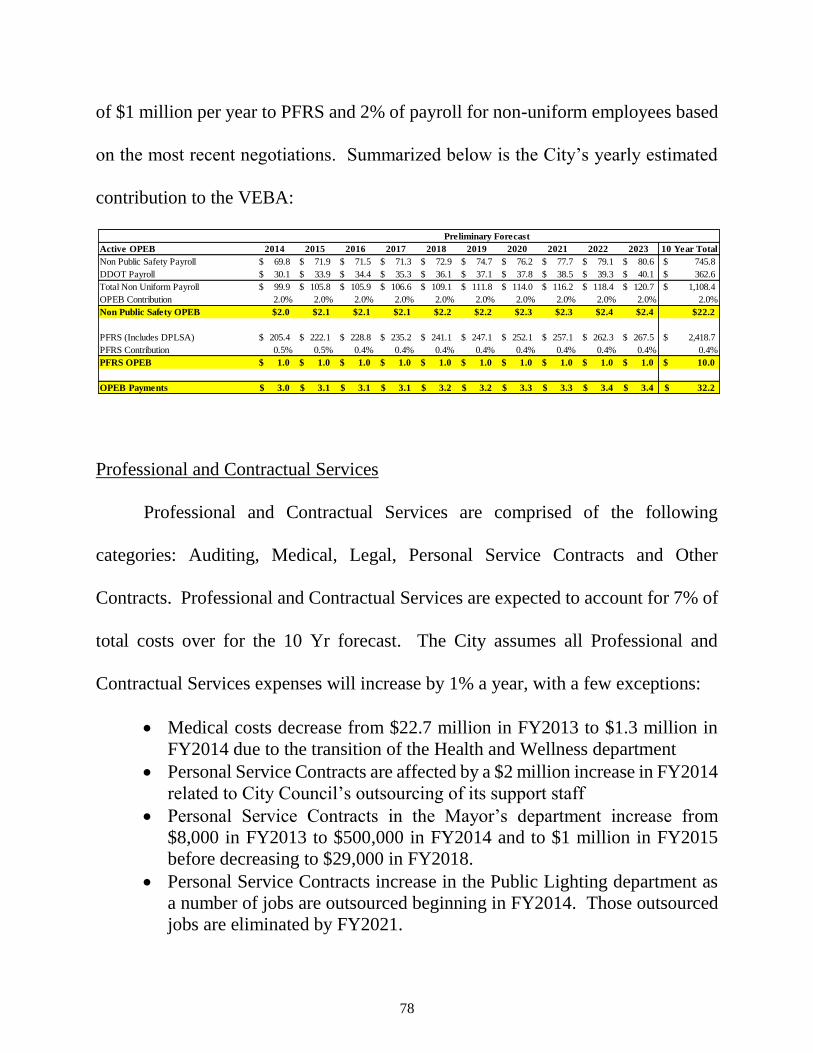
78
of $1 million per year to PFRS and 2% of payroll for non-uniform employees based
on the most recent negotiations. Summarized below is the City’s yearly estimated
contribution to the VEBA:
Professional and Contractual Services
Professional and Contractual Services are comprised of the following
categories: Auditing, Medical, Legal, Personal Service Contracts and Other
Contracts. Professional and Contractual Services are expected to account for 7% of
total costs over for the 10 Yr forecast. The City assumes all Professional and
Contractual Services expenses will increase by 1% a year, with a few exceptions:
Medical costs decrease from $22.7 million in FY2013 to $1.3 million in
FY2014 due to the transition of the Health and Wellness department
Personal Service Contracts are affected by a $2 million increase in FY2014
related to City Council’s outsourcing of its support staff
Personal Service Contracts in the Mayor’s department increase from
$8,000 in FY2013 to $500,000 in FY2014 and to $1 million in FY2015
before decreasing to $29,000 in FY2018.
Personal Service Contracts increase in the Public Lighting department as
a number of jobs are outsourced beginning in FY2014. Those outsourced
jobs are eliminated by FY2021.
Active OPEB 2014 2015 2016 2017 2018 2019 2020 2021 2022 2023 10 Year Total
Non Public Safety Payroll 69.8$ 71.9$ 71.5$ 71.3$ 72.9$ 74.7$ 76.2$ 77.7$ 79.1$ 80.6$ 745.8$
DDOT Payroll 30.1$ 33.9$ 34.4$ 35.3$ 36.1$ 37.1$ 37.8$ 38.5$ 39.3$ 40.1$ 362.6$
Total Non Uniform Payroll 99.9$ 105.8$ 105.9$ 106.6$ 109.1$ 111.8$ 114.0$ 116.2$ 118.4$ 120.7$ 1,108.4$
OPEB Contribution 2.0% 2.0% 2.0% 2.0% 2.0% 2.0% 2.0% 2.0% 2.0% 2.0% 2.0%
Non Public Safety OPEB $2.0 $2.1 $2.1 $2.1 $2.2 $2.2 $2.3 $2.3 $2.4 $2.4 $22.2
PFRS (Includes DPLSA) 205.4$ 222.1$ 228.8$ 235.2$ 241.1$ 247.1$ 252.1$ 257.1$ 262.3$ 267.5$ 2,418.7$
PFRS Contribution 0.5% 0.5% 0.4% 0.4% 0.4% 0.4% 0.4% 0.4% 0.4% 0.4% 0.4%
PFRS OPEB 1.0$ 1.0$ 1.0$ 1.0$ 1.0$ 1.0$ 1.0$ 1.0$ 1.0$ 1.0$ 10.0$
OPEB Payments 3.0$ 3.1$ 3.1$ 3.1$ 3.2$ 3.2$ 3.3$ 3.3$ 3.4$ 3.4$ 32.2$
Preliminary Forecast
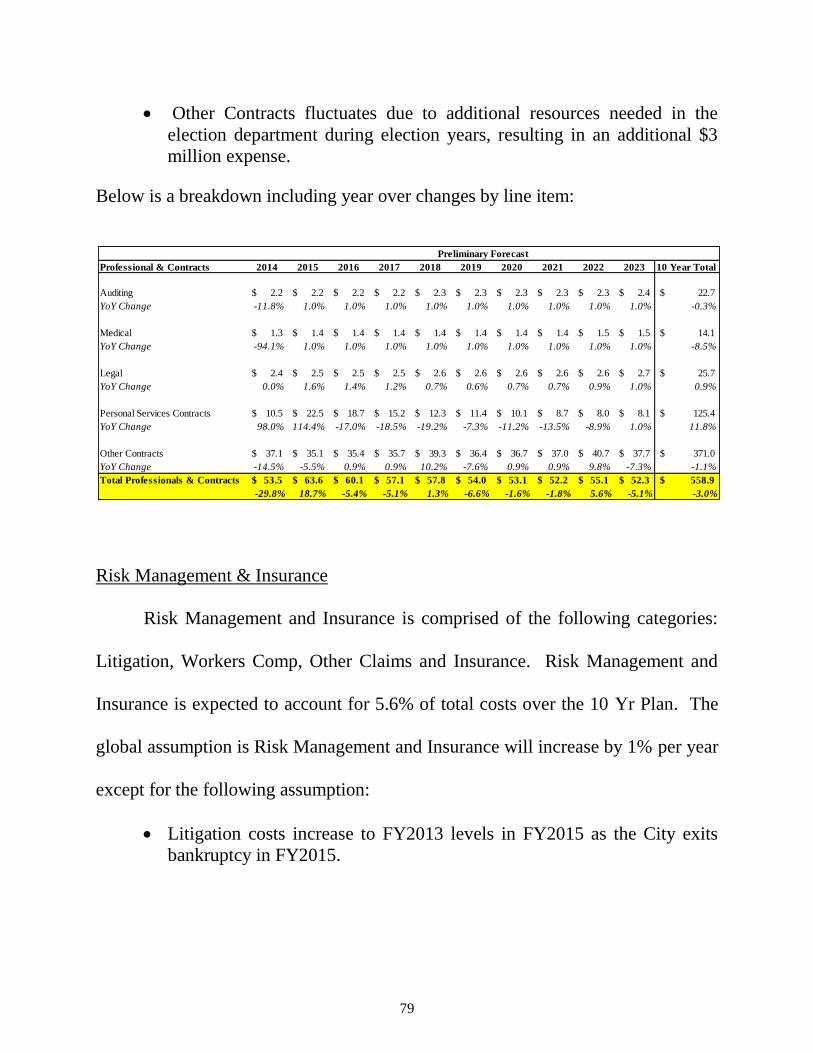
79
Other Contracts fluctuates due to additional resources needed in the
election department during election years, resulting in an additional $3
million expense.
Below is a breakdown including year over changes by line item:
Risk Management & Insurance
Risk Management and Insurance is comprised of the following categories:
Litigation, Workers Comp, Other Claims and Insurance. Risk Management and
Insurance is expected to account for 5.6% of total costs over the 10 Yr Plan. The
global assumption is Risk Management and Insurance will increase by 1% per year
except for the following assumption:
Litigation costs increase to FY2013 levels in FY2015 as the City exits
bankruptcy in FY2015.
Professional & Contracts 2014 2015 2016 2017 2018 2019 2020 2021 2022 2023 10 Year Total
Auditing 2.2$ 2.2$ 2.2$ 2.2$ 2.3$ 2.3$ 2.3$ 2.3$ 2.3$ 2.4$ 22.7$
YoY Change -11.8% 1.0% 1.0% 1.0% 1.0% 1.0% 1.0% 1.0% 1.0% 1.0% -0.3%
Medical 1.3$ 1.4$ 1.4$ 1.4$ 1.4$ 1.4$ 1.4$ 1.4$ 1.5$ 1.5$ 14.1$
YoY Change -94.1% 1.0% 1.0% 1.0% 1.0% 1.0% 1.0% 1.0% 1.0% 1.0% -8.5%
Legal 2.4$ 2.5$ 2.5$ 2.5$ 2.6$ 2.6$ 2.6$ 2.6$ 2.6$ 2.7$ 25.7$
YoY Change 0.0% 1.6% 1.4% 1.2% 0.7% 0.6% 0.7% 0.7% 0.9% 1.0% 0.9%
Personal Services Contracts 10.5$ 22.5$ 18.7$ 15.2$ 12.3$ 11.4$ 10.1$ 8.7$ 8.0$ 8.1$ 125.4$
YoY Change 98.0% 114.4% -17.0% -18.5% -19.2% -7.3% -11.2% -13.5% -8.9% 1.0% 11.8%
Other Contracts 37.1$ 35.1$ 35.4$ 35.7$ 39.3$ 36.4$ 36.7$ 37.0$ 40.7$ 37.7$ 371.0$
YoY Change -14.5% -5.5% 0.9% 0.9% 10.2% -7.6% 0.9% 0.9% 9.8% -7.3% -1.1%
Total Professionals & Contracts 53.5$ 63.6$ 60.1$ 57.1$ 57.8$ 54.0$ 53.1$ 52.2$ 55.1$ 52.3$ 558.9$
-29.8% 18.7% -5.4% -5.1% 1.3% -6.6% -1.6% -1.8% 5.6% -5.1% -3.0%
Preliminary Forecast

80
Below is a breakdown including year over changes by line item:
Materials and Supplies
Materials and Supplies are comprised of the following categories: Operating
Supplies, Fuel and Lubricants, Repairs and Maintenance and Other. Materials and
Supplies are expected to account for 4.7% of total costs over the ten year period.
The global assumption is all materials and supplies expenses will increase by 1% per
year.
Operating Supplies decrease from FY2016-2021 due to the transition of
the Public Lighting department.
Fuel and Lubricants decrease in FY2015 due to the transition of the Public
Lighting department.
Repairs and Maintenance decrease in FY2017 due to $1.9 million in
savings in the ITS department as a result of the new payroll system.
RM and Insurance 2014 2015 2016 2017 2018 2019 2020 2021 2022 2023 10 Year Total
Litigation 18.8$ 26.6$ 26.8$ 27.1$ 27.4$ 27.6$ 27.9$ 28.2$ 28.5$ 28.8$ 267.6$
YoY Change -28.5% 41.3% 1.0% 1.0% 1.0% 1.0% 1.0% 1.0% 1.0% 1.0% 2.1%
Workers Comp 4.8$ 4.9$ 4.9$ 4.9$ 5.0$ 5.0$ 5.1$ 5.1$ 5.2$ 5.3$ 50.2$
YoY Change 0.0% 1.0% 1.0% 1.0% 1.0% 1.0% 1.0% 1.0% 1.0% 1.0% 0.9%
Other Claims 11.6$ 11.7$ 11.8$ 11.9$ 12.0$ 12.1$ 12.3$ 12.4$ 12.5$ 12.6$ 120.9$
YoY Change 0.0% 1.0% 1.0% 1.0% 1.0% 1.0% 1.0% 1.0% 1.0% 1.0% 0.9%
Insurance 0.6$ 0.6$ 0.6$ 0.6$ 0.6$ 0.6$ 0.6$ 0.6$ 0.7$ 0.7$ 6.3$
YoY Change -24.4% 0.0% 0.0% 0.0% 0.0% 0.0% 0.0% 0.0% 0.0% 0.0% -2.4%
Total RM and Insurance 35.2$ 43.1$ 43.5$ 43.9$ 44.4$ 44.8$ 45.3$ 45.7$ 46.2$ 46.7$ 438.8$
YoY Change -17.6% 22.5% 1.0% 1.0% 1.0% 1.0% 1.0% 1.0% 1.0% 1.0% 1.3%
Preliminary Forecast

81
Below is a breakdown including year over changes by line item:
Utilities
Utilities are expected to account for 3.7% of total costs over the 10 Yr forecast.
All Utilities are expected to increase by 1% per year except for the following:
Water is projected to increase year over year by the following:
Sewage is projected to increase year over year by the following:
Materials & Supplies 2014 2015 2016 2017 2018 2019 2020 2021 2022 2023 10 Year Total
Operating supplies 5.1$ 5.6$ 5.9$ 5.6$ 5.3$ 4.9$ 4.6$ 4.2$ 4.1$ 4.2$ 49.4$
YoY Change 18.4% 9.1% 6.2% -5.1% -4.8% -8.3% -6.7% -7.6% -2.1% 1.0% 0.0%
Fuel & Lubricants 45.5$ 15.7$ 15.8$ 16.0$ 16.1$ 16.3$ 16.5$ 16.6$ 16.8$ 17.0$ 192.2$
YoY Change 0.8% -65.6% 1.0% 1.0% 1.0% 1.0% 1.0% 1.0% 1.0% 1.0% -5.7%
Repairs & Maint 11.9$ 11.0$ 11.4$ 9.8$ 9.6$ 9.3$ 9.1$ 8.8$ 8.8$ 8.9$ 98.5$
YoY Change 16.3% -7.5% 4.1% -14.3% -1.8% -3.4% -2.4% -2.7% -0.3% 1.0% -1.1%
Other - MS 3.6$ 3.6$ 3.6$ 3.6$ 3.6$ 3.6$ 3.6$ 3.6$ 3.6$ 3.6$ 35.8$
YoY Change -0.3% 0.9% 0.6% 0.3% -0.4% -0.6% -0.4% -0.5% -0.2% 0.0% -0.1%
Total Materials & Supplies 66.0$ 35.8$ 36.7$ 35.0$ 34.7$ 34.0$ 33.6$ 33.2$ 33.3$ 33.5$ 375.9$
YoY Change 4.5% -45.8% 2.7% -4.8% -0.8% -1.8% -1.2% -1.3% 0.1% 0.9% -4.8%
Preliminary Forecast
Year YoY Change
2015 1.5%
2016 5.7%
2017 5.7%
2018 2.8%
2019 3.5%
2020 3.5%
2021 3.5%
2022 3.9%
2023 3.9%

82
Outside purchases for electricity is expected to increase 25% in FY2015
as the City transitions to purchasing electricity from an outside vendor.
Year YoY Change
2015 1.4%
2016 3.7%
2017 2.9%
2018 3.1%
2019 3.7%
2020 3.6%
2021 3.7%
2022 4.0%
2023 4.0%
Utilities 2014 2015 2016 2017 2018 2019 2020 2021 2022 2023 10 Year Total
Telecommunications 9.3$ 9.4$ 9.5$ 9.6$ 9.6$ 9.7$ 9.8$ 9.9$ 10.0$ 10.1$ 97.0$
YoY Change 134.9% 1.0% 0.9% 0.9% 0.9% 0.9% 0.9% 0.9% 1.0% 1.0% 14.3%
Water 1.3$ 1.3$ 1.4$ 1.4$ 1.5$ 1.5$ 1.5$ 1.5$ 1.6$ 1.6$ 14.7$
YoY Change 12.2% 0.7% 3.5% 3.7% 1.1% 1.8% 1.9% 1.8% 3.0% 3.9% 3.4%
Natural Gas 2.3$ 1.9$ 1.9$ 1.8$ 1.8$ 1.8$ 1.8$ 1.8$ 1.9$ 1.9$ 18.9$
YoY Change -0.4% -16.4% -1.5% -7.1% 1.0% 1.0% 1.0% 1.0% 1.0% 1.0% -1.9%
Steam 0.7$ 0.7$ 0.7$ 0.7$ 0.8$ 0.8$ 0.8$ 0.8$ 0.8$ 0.8$ 7.6$
YoY Change 15.3% 1.0% 1.0% 1.0% 1.0% 1.0% 1.0% 1.0% 1.0% 1.0% 2.4%
Electricity 4.3$ 6.4$ 4.3$ 3.9$ 3.9$ 3.8$ 3.8$ 3.8$ 3.9$ 3.9$ 42.1$
YoY Change 1.1% 47.7% -33.4% -8.1% -1.3% -1.3% -0.4% 0.6% 0.8% 1.0% 0.7%
Sewage 7.2$ 7.2$ 7.2$ 7.2$ 7.3$ 7.3$ 7.4$ 7.5$ 7.7$ 8.0$ 74.0$
YoY Change 30.7% 0.2% 0.8% 0.2% 0.4% 1.0% 1.0% 1.0% 2.5% 4.0% 4.2%
Utilities IPO 3.3$ 4.1$ 4.1$ 4.1$ 4.2$ 4.2$ 4.3$ 4.3$ 4.4$ 4.4$ 41.4$
YoY Change -4.8% 21.5% 1.0% 1.0% 1.0% 1.0% 1.0% 1.0% 1.0% 1.0% 2.5%
Other - Utl 0.0$ 0.0$ 0.0$ 0.0$ 0.0$ 0.0$ 0.0$ 0.0$ 0.0$ 0.0$ 0.0$
YoY Change -2.2% -7.2% -5.3% -18.8% 0.0% 0.0% 0.0% 0.0% 0.0% 0.0% -3.3%
Total Utilities 28.5$ 31.0$ 29.1$ 28.8$ 29.0$ 29.2$ 29.4$ 29.7$ 30.2$ 30.7$ 295.7$
YoY Change 33.3% 8.9% -6.2% -1.0% 0.5% 0.7% 0.9% 1.0% 1.4% 1.9% 4.1%
Preliminary Forecast

83
Purchased Services
Purchased Services are expected to account for 2.9% of total costs over the
ten year period. All Purchased Services are expected to increase by 1% per year
except for the following:
17% increase in FY2016 driven by the implementation of the payroll
service.
Other Expenses and Capital Outlays
Other Expenses and Capital Outlays are expected to account for 5.3% of total
costs over the 10 Yr projections. The majority of expenses are expected to increase
approximately 1%. The chart below highlights all other operating expenses in the
General Fund:
2014 2015 2016 2017 2018 2019 2020 2021 2022 2023 10 Year Total
Purchased Services 18.4$ 19.3$ 22.6$ 24.8$ 24.6$ 24.3$ 24.2$ 24.0$ 24.0$ 24.2$ 230.4$
YoY Change 234.8% 4.9% 17.5% 9.4% -0.5% -1.2% -0.7% -0.8% 0.2% 0.8% 26.4%
Preliminary Forecast
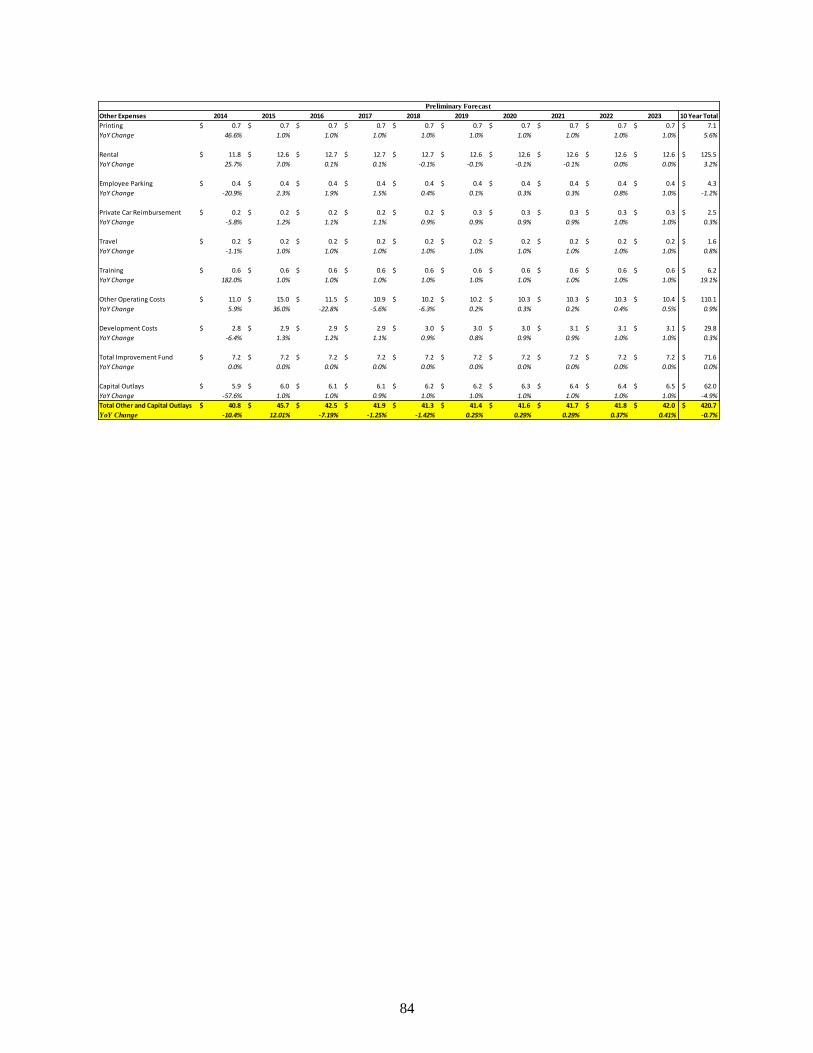
84
Other Expenses 2014 2015 2016 2017 2018 2019 2020 2021 2022 2023 10 Year Total
Printing 0.7$ 0.7$ 0.7$ 0.7$ 0.7$ 0.7$ 0.7$ 0.7$ 0.7$ 0.7$ 7.1$
YoY Change 46.6% 1.0% 1.0% 1.0% 1.0% 1.0% 1.0% 1.0% 1.0% 1.0% 5.6%
Rental 11.8$ 12.6$ 12.7$ 12.7$ 12.7$ 12.6$ 12.6$ 12.6$ 12.6$ 12.6$ 125.5$
YoY Change 25.7% 7.0% 0.1% 0.1% -0.1% -0.1% -0.1% -0.1% 0.0% 0.0% 3.2%
Employee Parking 0.4$ 0.4$ 0.4$ 0.4$ 0.4$ 0.4$ 0.4$ 0.4$ 0.4$ 0.4$ 4.3$
YoY Change -20.9% 2.3% 1.9% 1.5% 0.4% 0.1% 0.3% 0.3% 0.8% 1.0% -1.2%
Private Car Reimbursement 0.2$ 0.2$ 0.2$ 0.2$ 0.2$ 0.3$ 0.3$ 0.3$ 0.3$ 0.3$ 2.5$
YoY Change -5.8% 1.2% 1.1% 1.1% 0.9% 0.9% 0.9% 0.9% 1.0% 1.0% 0.3%
Travel 0.2$ 0.2$ 0.2$ 0.2$ 0.2$ 0.2$ 0.2$ 0.2$ 0.2$ 0.2$ 1.6$
YoY Change -1.1% 1.0% 1.0% 1.0% 1.0% 1.0% 1.0% 1.0% 1.0% 1.0% 0.8%
Training 0.6$ 0.6$ 0.6$ 0.6$ 0.6$ 0.6$ 0.6$ 0.6$ 0.6$ 0.6$ 6.2$
YoY Change 182.0% 1.0% 1.0% 1.0% 1.0% 1.0% 1.0% 1.0% 1.0% 1.0% 19.1%
Other Operating Costs 11.0$ 15.0$ 11.5$ 10.9$ 10.2$ 10.2$ 10.3$ 10.3$ 10.3$ 10.4$ 110.1$
YoY Change 5.9% 36.0% -22.8% -5.6% -6.3% 0.2% 0.3% 0.2% 0.4% 0.5% 0.9%
Development Costs 2.8$ 2.9$ 2.9$ 2.9$ 3.0$ 3.0$ 3.0$ 3.1$ 3.1$ 3.1$ 29.8$
YoY Change -6.4% 1.3% 1.2% 1.1% 0.9% 0.8% 0.9% 0.9% 1.0% 1.0% 0.3%
Total Improvement Fund 7.2$ 7.2$ 7.2$ 7.2$ 7.2$ 7.2$ 7.2$ 7.2$ 7.2$ 7.2$ 71.6$
YoY Change 0.0% 0.0% 0.0% 0.0% 0.0% 0.0% 0.0% 0.0% 0.0% 0.0% 0.0%
Capital Outlays 5.9$ 6.0$ 6.1$ 6.1$ 6.2$ 6.2$ 6.3$ 6.4$ 6.4$ 6.5$ 62.0$
YoY Change -57.6% 1.0% 1.0% 0.9% 1.0% 1.0% 1.0% 1.0% 1.0% 1.0% -4.9%
Total Other and Capital Outlays 40.8$ 45.7$ 42.5$ 41.9$ 41.3$ 41.4$ 41.6$ 41.7$ 41.8$ 42.0$ 420.7$
YoY Change -10.4% 12.01% -7.19% -1.25% -1.42% 0.25% 0.29% 0.29% 0.37% 0.41% -0.7%
Preliminary Forecast
85
Section H – RRIs and Non-Operating Expenditures
Summary31
The City identified restructuring and reinvestment initiatives by department
that are essential to the revitalization of Detroit and the provision of essential
municipal services. The City has identified $1.7 billion of reinvestment initiatives
to be undertaken during the next ten years, provided funding is available to do so.
This section focuses on the underlying assumptions in the RRIs and certain other
non-operating expenditures that are reflected in the POA projections. The total RRIs
and non-operating expenditures are summarized below:
31 Unless otherwise stated the financial projections referenced in section H are
sourced from bibliography: Conway Mackenzie Models: 28-54 and Ernst & Young
Models 10-11.

86
The RRIs were developed by department by CM, and identify capital
investments, additional labor and other operating expenses that are needed to ensure
that each City department is providing a basic level of service for Detroit residents.
In addition, the City identified revenue enhancing initiatives as part of its
departmental reviews. The chart below highlights the RRIs by category:
General Fund FY2014-2023 FY2014-2023 FY2014-2023 FY2014-2023
Operating Surplus Prior to Legacy, Non Operating Expenses and RRI's 2,781$ 2,054$ 1,788$ 1,434$
Reinvestment Initiatives
Department revenue initiatives 483$ 586$ 715$ 871$
Less:
Additional operating expenditures 357$ 359$ 438$ 534$
Capital investments 582$ 443$ 501$ 605$
Blight 420$ -$ -$ -$
Reinvestment Deferrals (30)$ (223)$ 11$ 242$
Total Reinvesment Expenditures 1,330$ 579$ 950$ 1,381$
Other Non Operating Expenses
Less:
PLD Decommission 75$ -$ -$ -$
Contributions to Income Stabilization Fund 18$ 2$ -$ -$
Professional Fees 130$ -$ -$ -$
Working Capital 25$ -$ -$ -$
Secured Debt 391$ 391$ 67$ -$
Swap Interest 104$ -$ -$ -$
QOL Exit Financing 336$ 110$ -$ -$
Contingency 101$ 121$ 144$ 173$
Total Non Operating Expenses 1,179$ 624$ 211$ 173$
Funds Available for Unsecured Claims 755$ 1,437$ 1,342$ 752$

87
Revenue Initiatives
The City identified $483 million in additional revenue over the 10 year period
that could be available to the City if it implements the RRIs effectively. The largest
sources of additional revenue include: increasing service and fares for DDOT,
increasing the volume and dollar amount of parking tickets and collecting income
taxes and various civil fines at a faster rate. The revenue initiatives also include $52
million from the Hardest Hit Fund and other grants that the City has identified that
were not in the baseline 10 Yr projections. The chart below highlights the revenue
initiatives:
Revenue 2014 2015 2016 2017 2018 2019 2020 2021 2022 2023 10 Year Total
Pricing/Fees 0.4$ 10.0$ 15.5$ 16.8$ 21.5$ 23.2$ 27.3$ 26.8$ 30.9$ 31.8$ 204.1$
Faster Collections 2.2$ 12.6$ 15.0$ 18.3$ 18.6$ 18.9$ 19.2$ 19.4$ 19.8$ 20.1$ 164.3$
Grant Revenue 3.1$ 40.6$ 9.0$ 12.2$ 12.9$ 0.5$ 0.5$ 0.6$ 0.6$ 0.6$ 80.6$
Other (0.1)$ 19.9$ (0.2)$ (0.1)$ (0.1)$ (0.1)$ (0.1)$ -$ (0.1)$ -$ 19.3$
Past Due Collections 1.5$ 4.9$ 5.7$ 2.5$ -$ -$ -$ -$ -$ -$ 14.7$
Total Revenue 7.2$ 88.0$ 45.1$ 49.7$ 52.9$ 42.5$ 46.9$ 46.8$ 51.3$ 52.5$ 482.9$
Operating Expenditures 2014 2015 2016 2017 2018 2019 2020 2021 2022 2023 10 Year Total
Permanent Labor 2.7$ 24.2$ 20.1$ 22.2$ 21.7$ 19.8$ 19.7$ 19.0$ 18.6$ 17.7$ 185.6$
Professional & Contract Services 0.4$ (1.0)$ (1.3)$ (1.3)$ (1.2)$ (1.2)$ (1.1)$ (1.1)$ (1.1)$ (1.0)$ (10.0)$
Active Benefits 1.3$ 10.2$ 10.2$ 12.7$ 12.6$ 11.8$ 11.9$ 11.6$ 11.5$ 11.3$ 105.1$
Training 0.3$ 7.3$ 9.2$ 6.3$ 5.4$ 5.2$ 5.1$ 5.2$ 5.3$ 5.0$ 54.4$
Materials and Supplies 2.0$ 6.6$ 11.5$ 10.2$ 8.3$ 8.8$ 9.4$ 9.6$ 10.1$ 10.6$ 87.1$
Utilities 0.2$ 0.3$ 0.3$ 0.3$ 0.3$ 0.3$ 0.3$ 0.3$ 0.3$ 0.3$ 2.6$
Purchased services 0.4$ 0.8$ (0.8)$ (0.5)$ (1.0)$ (0.5)$ (1.0)$ (0.5)$ (0.9)$ (0.4)$ (4.5)$
Risk management/insurance (0.0)$ (2.1)$ (6.1)$ (6.1)$ (6.1)$ (6.1)$ (6.1)$ (6.1)$ (6.1)$ (6.1)$ (50.7)$
Transfers In/(Out) (General Fund) (0.4)$ 4.4$ 0.5$ (2.3)$ (2.7)$ (3.5)$ (3.5)$ (3.1)$ (3.6)$ (3.6)$ (17.7)$
Grant related expenses 1.2$ 15.6$ 3.5$ -$ -$ -$ -$ -$ -$ -$ 20.3$
All Other (0.1)$ (1.7)$ (1.7)$ (1.6)$ (1.6)$ (1.6)$ (1.5)$ (1.6)$ (1.6)$ (1.6)$ (14.8)$
Total Operating Expenditures 8.0$ 64.6$ 45.3$ 39.9$ 35.6$ 33.0$ 33.0$ 33.3$ 32.5$ 32.1$ 357.4$
Reorganization/Investment 2014 2015 2016 2017 2018 2019 2020 2021 2022 2023 10 Year Total
Technology Infrastructure 3.1$ 41.3$ 34.4$ 19.6$ 10.1$ 7.4$ 10.7$ 8.8$ 8.8$ 7.5$ 151.7$
Capital Expenditures 5.9$ 33.5$ 41.7$ 26.1$ 22.4$ 19.5$ 22.7$ 20.0$ 16.7$ 16.8$ 225.4$
Other Infrastructure 8.3$ 25.8$ 24.0$ 19.1$ 16.4$ 15.7$ 15.8$ 15.2$ 13.7$ 13.4$ 167.4$
Reorganization Costs 3.2$ 18.2$ 6.3$ 0.9$ 1.2$ 1.0$ 2.7$ 2.0$ 1.2$ 1.0$ 37.7$
Total Reorganization/Investment 20.6$ 118.9$ 106.4$ 65.6$ 50.2$ 43.6$ 51.9$ 46.0$ 40.4$ 38.6$ 582.2$

88
DDOT is expecting to increase the number of buses in service from 282 in
FY2013 to 394 in FY2023. In addition, the City is projecting total miles to increase
from 12.1 million miles in FY2013 to 16.5 million miles in FY2023. The increase
in mileage is expected to increase revenue by $47 million over the ten year period
and is dependent on obtaining new buses, which are grant funded, and increasing the
number of routes.
The City is also projecting increased revenue as a result of fare price increases.
The City has not had a fare price increase in the last 8 years. The following table
shows the projected fare increases for DDOT:
The City took into account decreased ridership at each fare price increase,
assuming ridership would decrease 2% for every 10% increase in fares. The
Revenue Initiative 2014 2015 2016 2017 2018 2019 2020 2021 2022 2023 10 Year Total
DDOT Expansion 0.4$ 1.5$ 5.7$ 7.1$ 11.7$ 13.4$ 17.5$ 17.1$ 21.2$ 22.0$ 117.6$
Faster 36DC Collections -$ 3.9$ 5.5$ 8.5$ 8.7$ 9.0$ 9.2$ 9.5$ 9.8$ 10.1$ 74.1$
Increased Parking Tickets -$ 5.6$ 6.8$ 6.8$ 6.8$ 6.8$ 6.8$ 6.8$ 6.8$ 6.8$ 60.3$
Income Tax Collection Improvements 1.2$ 4.9$ 4.9$ 5.2$ 5.2$ 5.2$ 5.2$ 5.2$ 5.2$ 5.2$ 47.4$
Increased Collections for New Fire Department Hires 0.9$ 3.6$ 3.6$ 3.6$ 3.6$ 3.6$ 3.6$ 3.6$ 3.7$ 3.7$ 33.7$
New Billings for Services -$ 2.9$ 2.9$ 2.9$ 2.9$ 2.9$ 2.9$ 2.9$ 2.9$ 2.9$ 26.2$
All Other 4.7$ 65.6$ 15.6$ 15.6$ 13.9$ 1.5$ 1.6$ 1.6$ 1.7$ 1.8$ 123.6$
Total Revenue Initiatives 7.2$ 88.0$ 45.1$ 49.7$ 52.9$ 42.5$ 46.9$ 46.8$ 51.3$ 52.5$ 482.9$
Year Fare Price YoY Change
2013 1.50$ 0.0%
2014 1.50$ 0.0%
2015 1.50$ 0.0%
2016 1.75$ 16.7%
2017 1.75$ 0.0%
2018 2.00$ 14.3%
2019 2.00$ 0.0%
2020 2.25$ 12.5%
2021 2.25$ 0.0%
2022 2.50$ 11.1%
2023 2.50$ 0.0%

89
increased revenue associated with the fare increases, minus the reduced ridership,
results in a total revenue increase over the ten year period of $70 million.
The City is projecting it will be able to collect an additional $74 million as a
result of better collections of civil fines and infractions. The City currently collects
infractions at a 36% rate. The City is projecting it will increase collections from
36% in 2013 to 56.8% in 2023 leading to the additional $74 million in revenue over
the ten year period. The City believes this collection rate is achievable as the
regional average is currently 65% which includes Detroit’s low collection rate. The
City has identified a few initiatives that will help improve collections including
increased access to ATM’s at the Court and improved operating systems and
business processes.
The Emergency Manager implemented increases to parking ticket fines on
April 3, 201432. The City has long lagged comparable municipalities in this regard33.
The recent increase in the parking fines, in addition to additional parking officers, is
expected to increase revenue by $60 million over the ten year period.
The Finance department has identified a number of initiatives to improve the
collection of income taxes. These include additional staffing, targeting non-
32 See Emergency Manager City of Detroit Order Number 24
33 See PVB Revenue Enhancement White Paper dated December 9, 2013.
90
residents working in Detroit and using outside services. The initiatives are expected
to generate an additional $47 million over the ten year period.
The Fire department is expecting to collect additional revenue as a result of 9
new ambulances, additional Fire Marshalls and cross training fire fighters to do Fire
Marshall and EMS work. The initiatives are expected to generate $34 million in
revenue over the ten years. The Fire department, along with the Police department,
expects to increase revenues by billing services that have not been billed in the past.
These new billings represent $26 million in additional revenue over the ten year
period.
Operating Expenditures
The City is projecting it will incur an additional $357 million in operating
expenditures in the next 10 years related to the RRIs. This does not include $420
million estimated for Blight over the next ten years. Blight is discussed separately
in section L of this Report.

91
Labor
The largest component of additional operating expense over the ten year
period is permanent labor which totals $186 million and represents 52% of the
additional operating expenditures. Below is a summary of the labor increase:
Additional headcount by department projections can be seen below:
Labor 2014 2015 2016 2017 2018 2019 2020 2021 2022 2023 Ten Year Total
New Labor due to Incremental Headcount 5.5$ 27.6$ 31.7$ 35.6$ 34.4$ 32.2$ 32.2$ 31.1$ 31.2$ 30.7$ 292.2$
Overtime for New Employees -$ 0.0$ 0.2$ 0.3$ 0.3$ 0.3$ 0.3$ 0.3$ 0.4$ -$ 2.0$
Overtime Savings from New Employees -$ 0.7$ (2.5)$ (6.9)$ (7.0)$ (7.1)$ (7.3)$ (7.4)$ (7.5)$ (7.7)$ (52.7)$
Efficiency Savings -$ (0.0)$ (0.1)$ (0.1)$ (0.1)$ (0.4)$ (1.3)$ (1.4)$ (1.8)$ (2.0)$ (7.5)$
Add Back Overestimate Police and Fire Wages (2.9)$ (4.1)$ (9.1)$ (6.5)$ (5.8)$ (5.1)$ (4.2)$ (3.6)$ (3.6)$ (3.6)$ (48.5)$
Total Labor Expense 2.7$ 24.2$ 20.2$ 22.3$ 21.7$ 19.8$ 19.7$ 19.0$ 18.6$ 17.3$ 185.6$
Department 2014 2015 2016 2017 2018 2019 2020 2021 2022 2023
DDOT - Transportation - - 50 113 131 133 134 138 149 163
Police 125 250 250 210 175 162 149 149 149 149
Fire 161 97 84 182 193 165 153 135 129 117
Finance/Budget 28 120 121 121 112 112 112 112 112 112
General Services 112 112 112 112 112 112 112 112 112 112
Mayor's Office 31 31 31 31 31 31 31 31 31 31
Human Resources 4 19 22 22 22 22 22 22 22 22
Ombudsperson - - 20 20 20 20 20 20 20 20
Law - 9 17 17 17 17 17 17 17 17
Labor Relations - 3 11 11 11 11 11 11 11 11
Human Rights / Board of Ethics - 6 6 6 6 6 6 6 6 6
Auditor General / Inspector General - 4 4 4 4 4 4 4 4 4
Airport - 1 1 1 1 1 1 1 1 1
Buildings and Safety 2 (1) (1) (1) (1) (1) (1) (1) (1) (1)
City Clerk - (3) (3) (3) (3) (3) (3) (3) (3) (3)
Municipal Parking 1 7 (6) (6) (6) (6) (6) (6) (6) (6)
Non-Departmental (36D Initiatives) - (15) (25) (25) (25) (25) (25) (25) (25) (25)
Planning & Development 16 (32) (34) (34) (34) (34) (34) (34) (34) (34)
Total 480 609 660 781 766 727 704 690 694 696

92
The total consolidated number of employees34 for all departments by year
including the base 10 Yr Plan and RRIs is highlighted below:
The chart below shows total employees by department from both the 10 Yr
forecast and RRIs in FY2023 General Fund departments:
34 The FY2008-2012 average only includes departments that will still be operating
in FY2023
Total Employees 2013 2014 2015 2016 2017 2018 2019 2020 2021 2022 2023 2008-2012 Average Variance
Total Employees Reinvestment 480 609 660 781 766 727 704 690 694 696
Total Employees Base Model 10,043 9,578 9,634 9,770 9,747 9,745 9,745 9,745 9,744 9,742 9,742
Total Employees 10,043 10,058 10,242 10,431 10,529 10,512 10,472 10,449 10,434 10,436 10,439 12,395 -15.8%
New Hires by Year 2014 2015 2016 2017 2018 2019 2020 2021 2022 2023 Total
Incremental Employees - Reinvestment 480 129 52 121 (15) (40) (23) (14) 4 2 696
Incremental Employees - Base Model (465) 56 136 (23) (2) - - (1) (2) - (301)
Total Additional Head Count 15 185 188 98 (17) (40) (23) (15) 2 2 396

93
After accounting for the additional employees in the reinvestment initiatives,
the City is still operating with 19% fewer employees than the 5 year average from
FY2008-2012. The largest increases in employees occur in Transportation, Police,
Fire, Finance and the General Services departments:
The 163 additional employees at DDOT include 35 additional uniformed
employees to increase safety on buses, and additional bus drivers for
additional routes
The Police department is estimating 250 additional civilian personnel in
FY2015 which will allow the City to redeploy uniformed personnel to
police activities
The Fire department expects to hire new fire fighters to provide adequate
levels of service to the City. These fire fighters will be cross trained to
improve efficiency and reduce overtime in the department
General Fund Base Reinvestment Total 2008-2012 Avg Var % Variance
Police 2,895 149 3,044 3,322 (277) -9.1%
Fire 1,228 117 1,345 1,358 (14) -1.0%
36th District Court 362 (25) 337 301 36 10.5%
General Services 272 112 384 495 (111) -28.9%
Waste/Public Works 284 - 284 416 (132) -46.5%
Finance/Budget/ITS 260 112 372 373 (1) -0.3%
Recreation 202 - 202 436 (233) NM
Planning & Development 113 (34) 79 156 (77) -98.3%
Law 86 17 103 112 (10) -9.3%
Elections 60 - 60 72 (12) -19.5%
Human Resources 60 33 93 159 (66) -71.4%
Mayor 24 31 55 67 (12) -22.0%
Non-Departmental 17 - 17 26 (9) -54.6%
Auditor General 17 4 21 17 4 19.2%
City Clerk 15 (3) 12 22 (10) -82.3%
Zoning 11 - 11 15 (3) -30.9%
City Council 10 - 10 75 (65) NM
Health & Wellness 9 - 9 271 (262) NM
Ombudsperson 6 20 26 9 17 64.9%
Human Rights 5 6 11 10 2 14.4%
Administrative Hearings 4 - 4 6 (2) -55.0%
Total General Funds 5,940 539 6,479 7,718 (1,239) -19.1%
2023 Employees by Department 2023 vs. 2008-2012 Avg.
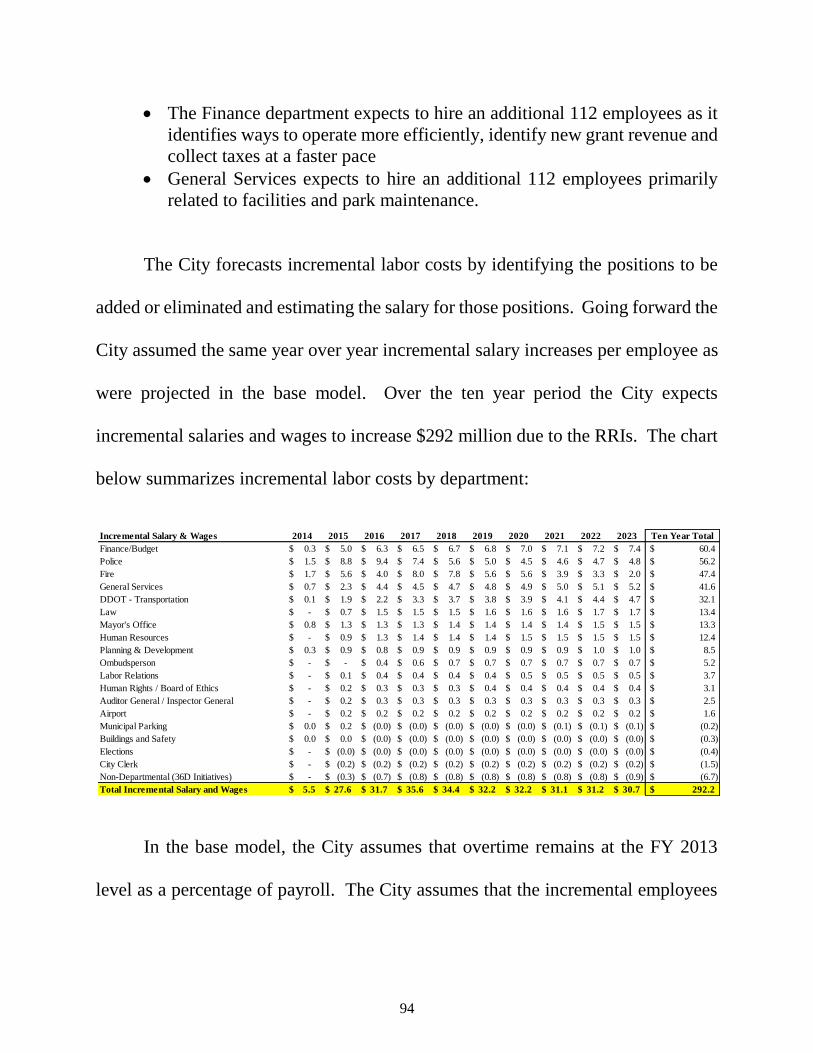
94
The Finance department expects to hire an additional 112 employees as it
identifies ways to operate more efficiently, identify new grant revenue and
collect taxes at a faster pace
General Services expects to hire an additional 112 employees primarily
related to facilities and park maintenance.
The City forecasts incremental labor costs by identifying the positions to be
added or eliminated and estimating the salary for those positions. Going forward the
City assumed the same year over year incremental salary increases per employee as
were projected in the base model. Over the ten year period the City expects
incremental salaries and wages to increase $292 million due to the RRIs. The chart
below summarizes incremental labor costs by department:
In the base model, the City assumes that overtime remains at the FY 2013
level as a percentage of payroll. The City assumes that the incremental employees
Incremental Salary & Wages 2014 2015 2016 2017 2018 2019 2020 2021 2022 2023 Ten Year Total
Finance/Budget 0.3$ 5.0$ 6.3$ 6.5$ 6.7$ 6.8$ 7.0$ 7.1$ 7.2$ 7.4$ 60.4$
Police 1.5$ 8.8$ 9.4$ 7.4$ 5.6$ 5.0$ 4.5$ 4.6$ 4.7$ 4.8$ 56.2$
Fire 1.7$ 5.6$ 4.0$ 8.0$ 7.8$ 5.6$ 5.6$ 3.9$ 3.3$ 2.0$ 47.4$
General Services 0.7$ 2.3$ 4.4$ 4.5$ 4.7$ 4.8$ 4.9$ 5.0$ 5.1$ 5.2$ 41.6$
DDOT - Transportation 0.1$ 1.9$ 2.2$ 3.3$ 3.7$ 3.8$ 3.9$ 4.1$ 4.4$ 4.7$ 32.1$
Law -$ 0.7$ 1.5$ 1.5$ 1.5$ 1.6$ 1.6$ 1.6$ 1.7$ 1.7$ 13.4$
Mayor's Office 0.8$ 1.3$ 1.3$ 1.3$ 1.4$ 1.4$ 1.4$ 1.4$ 1.5$ 1.5$ 13.3$
Human Resources -$ 0.9$ 1.3$ 1.4$ 1.4$ 1.4$ 1.5$ 1.5$ 1.5$ 1.5$ 12.4$
Planning & Development 0.3$ 0.9$ 0.8$ 0.9$ 0.9$ 0.9$ 0.9$ 0.9$ 1.0$ 1.0$ 8.5$
Ombudsperson -$ -$ 0.4$ 0.6$ 0.7$ 0.7$ 0.7$ 0.7$ 0.7$ 0.7$ 5.2$
Labor Relations -$ 0.1$ 0.4$ 0.4$ 0.4$ 0.4$ 0.5$ 0.5$ 0.5$ 0.5$ 3.7$
Human Rights / Board of Ethics -$ 0.2$ 0.3$ 0.3$ 0.3$ 0.4$ 0.4$ 0.4$ 0.4$ 0.4$ 3.1$
Auditor General / Inspector General -$ 0.2$ 0.3$ 0.3$ 0.3$ 0.3$ 0.3$ 0.3$ 0.3$ 0.3$ 2.5$
Airport -$ 0.2$ 0.2$ 0.2$ 0.2$ 0.2$ 0.2$ 0.2$ 0.2$ 0.2$ 1.6$
Municipal Parking 0.0$ 0.2$ (0.0)$ (0.0)$ (0.0)$ (0.0)$ (0.0)$ (0.1)$ (0.1)$ (0.1)$ (0.2)$
Buildings and Safety 0.0$ 0.0$ (0.0)$ (0.0)$ (0.0)$ (0.0)$ (0.0)$ (0.0)$ (0.0)$ (0.0)$ (0.3)$
Elections -$ (0.0)$ (0.0)$ (0.0)$ (0.0)$ (0.0)$ (0.0)$ (0.0)$ (0.0)$ (0.0)$ (0.4)$
City Clerk -$ (0.2)$ (0.2)$ (0.2)$ (0.2)$ (0.2)$ (0.2)$ (0.2)$ (0.2)$ (0.2)$ (1.5)$
Non-Departmental (36D Initiatives) -$ (0.3)$ (0.7)$ (0.8)$ (0.8)$ (0.8)$ (0.8)$ (0.8)$ (0.8)$ (0.9)$ (6.7)$
Total Incremental Salary and Wages 5.5$ 27.6$ 31.7$ 35.6$ 34.4$ 32.2$ 32.2$ 31.1$ 31.2$ 30.7$ 292.2$
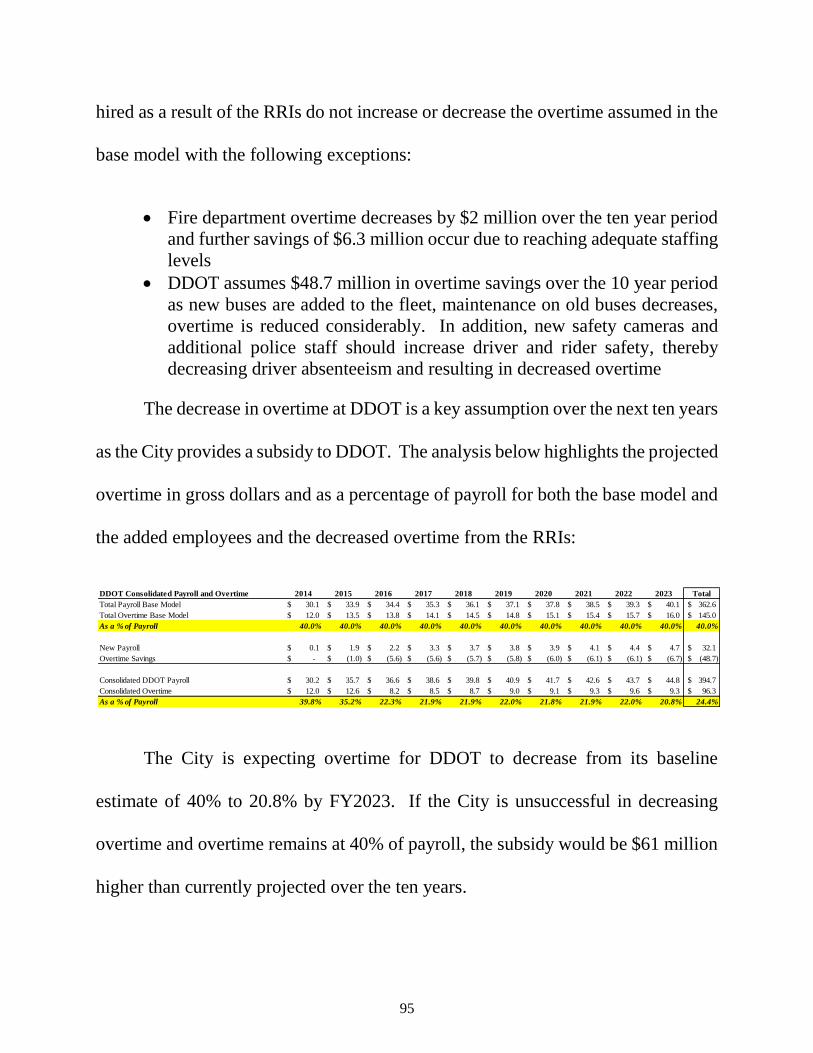
95
hired as a result of the RRIs do not increase or decrease the overtime assumed in the
base model with the following exceptions:
Fire department overtime decreases by $2 million over the ten year period
and further savings of $6.3 million occur due to reaching adequate staffing
levels
DDOT assumes $48.7 million in overtime savings over the 10 year period
as new buses are added to the fleet, maintenance on old buses decreases,
overtime is reduced considerably. In addition, new safety cameras and
additional police staff should increase driver and rider safety, thereby
decreasing driver absenteeism and resulting in decreased overtime
The decrease in overtime at DDOT is a key assumption over the next ten years
as the City provides a subsidy to DDOT. The analysis below highlights the projected
overtime in gross dollars and as a percentage of payroll for both the base model and
the added employees and the decreased overtime from the RRIs:
The City is expecting overtime for DDOT to decrease from its baseline
estimate of 40% to 20.8% by FY2023. If the City is unsuccessful in decreasing
overtime and overtime remains at 40% of payroll, the subsidy would be $61 million
higher than currently projected over the ten years.
DDOT Consolidated Payroll and Overtime 2014 2015 2016 2017 2018 2019 2020 2021 2022 2023 Total
Total Payroll Base Model 30.1$ 33.9$ 34.4$ 35.3$ 36.1$ 37.1$ 37.8$ 38.5$ 39.3$ 40.1$ 362.6$
Total Overtime Base Model 12.0$ 13.5$ 13.8$ 14.1$ 14.5$ 14.8$ 15.1$ 15.4$ 15.7$ 16.0$ 145.0$
As a % of Payroll 40.0% 40.0% 40.0% 40.0% 40.0% 40.0% 40.0% 40.0% 40.0% 40.0% 40.0%
New Payroll 0.1$ 1.9$ 2.2$ 3.3$ 3.7$ 3.8$ 3.9$ 4.1$ 4.4$ 4.7$ 32.1$
Overtime Savings -$ (1.0)$ (5.6)$ (5.6)$ (5.7)$ (5.8)$ (6.0)$ (6.1)$ (6.1)$ (6.7)$ (48.7)$
Consolidated DDOT Payroll 30.2$ 35.7$ 36.6$ 38.6$ 39.8$ 40.9$ 41.7$ 42.6$ 43.7$ 44.8$ 394.7$
Consolidated Overtime 12.0$ 12.6$ 8.2$ 8.5$ 8.7$ 9.0$ 9.1$ 9.3$ 9.6$ 9.3$ 96.3$
As a % of Payroll 39.8% 35.2% 22.3% 21.9% 21.9% 22.0% 21.8% 21.9% 22.0% 20.8% 24.4%
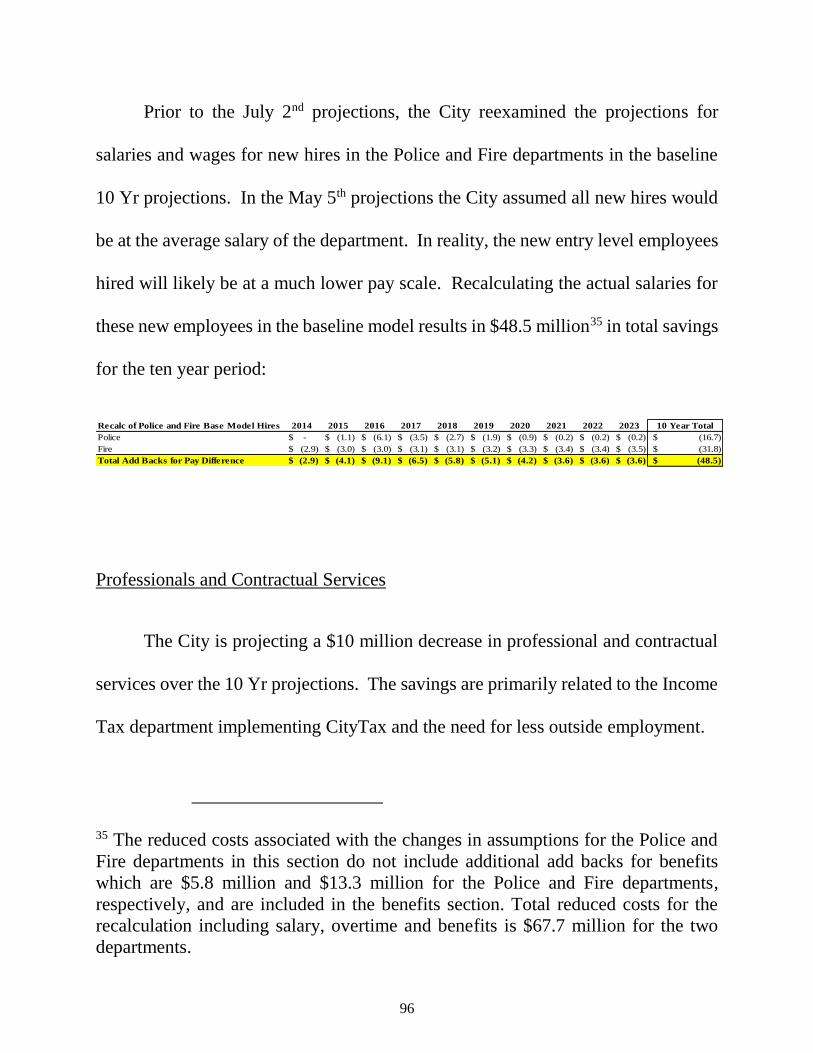
96
Prior to the July 2nd projections, the City reexamined the projections for
salaries and wages for new hires in the Police and Fire departments in the baseline
10 Yr projections. In the May 5th projections the City assumed all new hires would
be at the average salary of the department. In reality, the new entry level employees
hired will likely be at a much lower pay scale. Recalculating the actual salaries for
these new employees in the baseline model results in $48.5 million35 in total savings
for the ten year period:
Professionals and Contractual Services
The City is projecting a $10 million decrease in professional and contractual
services over the 10 Yr projections. The savings are primarily related to the Income
Tax department implementing CityTax and the need for less outside employment.
35 The reduced costs associated with the changes in assumptions for the Police and
Fire departments in this section do not include additional add backs for benefits
which are $5.8 million and $13.3 million for the Police and Fire departments,
respectively, and are included in the benefits section. Total reduced costs for the
recalculation including salary, overtime and benefits is $67.7 million for the two
departments.
Recalc of Police and Fire Base Model Hires 2014 2015 2016 2017 2018 2019 2020 2021 2022 2023 10 Year Total
Police -$ (1.1)$ (6.1)$ (3.5)$ (2.7)$ (1.9)$ (0.9)$ (0.2)$ (0.2)$ (0.2)$ (16.7)$
Fire (2.9)$ (3.0)$ (3.0)$ (3.1)$ (3.1)$ (3.2)$ (3.3)$ (3.4)$ (3.4)$ (3.5)$ (31.8)$
Total Add Backs for Pay Difference (2.9)$ (4.1)$ (9.1)$ (6.5)$ (5.8)$ (5.1)$ (4.2)$ (3.6)$ (3.6)$ (3.6)$ (48.5)$

97
Benefits
The City estimated benefits using the following percentage of payroll
projections:
Using the above rates, the City estimates an additional $105.1 million in
benefits for employees hired as part of the RRIs:
The City took a conservative approach to estimating benefits in its RRIs by
using higher percentages of payroll estimates than those used in the baseline
forecasts:
Incremental Benefits as a % of Payroll % of Payroll
Police 40.5%
Fire 42.0%
General Services 45.0%
DDOT - Transportation 49.2%
Incremental Benefits 2014 2015 2016 2017 2018 2019 2020 2021 2022 2023 Ten Year Total
Finance/Budget 0.2$ 2.2$ 2.8$ 2.9$ 3.0$ 3.1$ 3.1$ 3.2$ 3.3$ 3.3$ 27.2$
Police 0.6$ 3.1$ 1.3$ 1.6$ 1.2$ 1.3$ 1.4$ 1.8$ 1.8$ 1.9$ 16.0$
Fire (0.4)$ 1.3$ 0.7$ 1.9$ 1.8$ 0.7$ 0.4$ (0.4)$ (0.9)$ (1.6)$ 3.6$
General Services 0.3$ 1.1$ 2.0$ 2.0$ 2.1$ 2.2$ 2.2$ 2.2$ 2.3$ 2.3$ 18.7$
DDOT - Transportation 0.1$ 0.7$ 0.9$ 1.6$ 1.8$ 1.9$ 1.9$ 2.0$ 2.2$ 2.4$ 15.6$
Law -$ 0.3$ 0.7$ 0.7$ 0.7$ 0.7$ 0.7$ 0.7$ 0.7$ 0.8$ 6.0$
Mayor's Office 0.5$ 0.6$ 0.6$ 0.6$ 0.6$ 0.6$ 0.6$ 0.6$ 0.7$ 0.7$ 6.1$
Human Resources -$ 0.4$ 0.6$ 0.6$ 0.6$ 0.6$ 0.7$ 0.7$ 0.7$ 0.7$ 5.6$
Planning & Development 0.1$ 0.4$ 0.3$ 0.3$ 0.3$ 0.3$ 0.4$ 0.4$ 0.4$ 0.4$ 3.3$
Ombudsperson -$ -$ 0.2$ 0.3$ 0.3$ 0.3$ 0.3$ 0.3$ 0.3$ 0.3$ 2.4$
Labor Relations -$ 0.0$ 0.2$ 0.2$ 0.2$ 0.2$ 0.2$ 0.2$ 0.2$ 0.2$ 1.7$
Human Rights / Board of Ethics -$ 0.1$ 0.1$ 0.2$ 0.2$ 0.2$ 0.2$ 0.2$ 0.2$ 0.2$ 1.4$
Auditor General / Inspector General -$ 0.1$ 0.1$ 0.1$ 0.1$ 0.1$ 0.1$ 0.1$ 0.1$ 0.1$ 1.1$
Airport -$ 0.1$ 0.1$ 0.1$ 0.1$ 0.1$ 0.1$ 0.1$ 0.1$ 0.1$ 0.7$
Municipal Parking 0.0$ 0.1$ (0.0)$ (0.0)$ (0.0)$ (0.0)$ (0.0)$ (0.0)$ (0.0)$ (0.0)$ (0.1)$
Buildings and Safety 0.0$ 0.0$ (0.0)$ (0.0)$ (0.0)$ (0.0)$ (0.0)$ (0.0)$ (0.0)$ (0.0)$ (0.1)$
Elections -$ (0.0)$ (0.0)$ (0.0)$ (0.0)$ (0.0)$ (0.0)$ (0.0)$ (0.0)$ (0.0)$ (0.2)$
City Clerk -$ (0.1)$ (0.1)$ (0.1)$ (0.1)$ (0.1)$ (0.1)$ (0.1)$ (0.1)$ (0.1)$ (0.7)$
Non-Departmental (36D Initiatives) -$ (0.2)$ (0.3)$ (0.3)$ (0.3)$ (0.4)$ (0.4)$ (0.4)$ (0.4)$ (0.4)$ (3.0)$
Total Incremental Benefits 1.3$ 10.2$ 10.2$ 12.7$ 12.6$ 11.8$ 11.9$ 11.6$ 11.5$ 11.3$ 105.1$
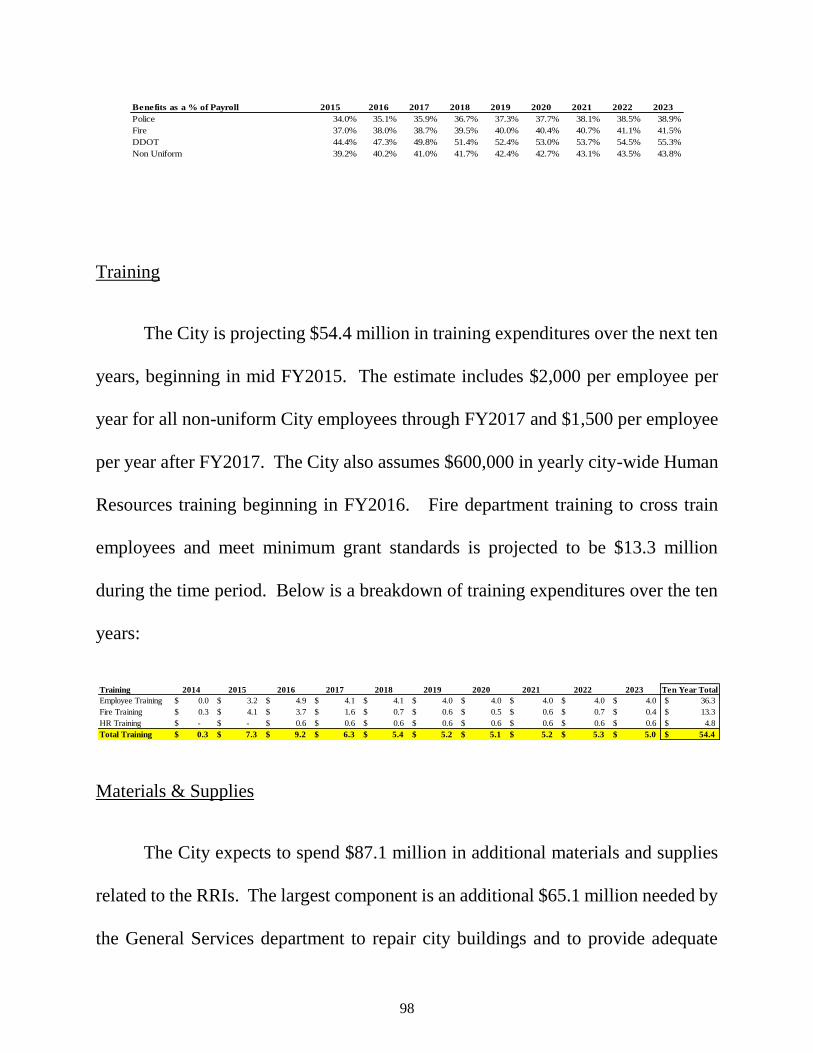
98
Training
The City is projecting $54.4 million in training expenditures over the next ten
years, beginning in mid FY2015. The estimate includes $2,000 per employee per
year for all non-uniform City employees through FY2017 and $1,500 per employee
per year after FY2017. The City also assumes $600,000 in yearly city-wide Human
Resources training beginning in FY2016. Fire department training to cross train
employees and meet minimum grant standards is projected to be $13.3 million
during the time period. Below is a breakdown of training expenditures over the ten
years:
Materials & Supplies
The City expects to spend $87.1 million in additional materials and supplies
related to the RRIs. The largest component is an additional $65.1 million needed by
the General Services department to repair city buildings and to provide adequate
Benefits as a % of Payroll 2015 2016 2017 2018 2019 2020 2021 2022 2023
Police 34.0% 35.1% 35.9% 36.7% 37.3% 37.7% 38.1% 38.5% 38.9%
Fire 37.0% 38.0% 38.7% 39.5% 40.0% 40.4% 40.7% 41.1% 41.5%
DDOT 44.4% 47.3% 49.8% 51.4% 52.4% 53.0% 53.7% 54.5% 55.3%
Non Uniform 39.2% 40.2% 41.0% 41.7% 42.4% 42.7% 43.1% 43.5% 43.8%
Training 2014 2015 2016 2017 2018 2019 2020 2021 2022 2023 Ten Year Total
Employee Training 0.0$ 3.2$ 4.9$ 4.1$ 4.1$ 4.0$ 4.0$ 4.0$ 4.0$ 4.0$ 36.3$
Fire Training 0.3$ 4.1$ 3.7$ 1.6$ 0.7$ 0.6$ 0.5$ 0.6$ 0.7$ 0.4$ 13.3$
HR Training -$ -$ 0.6$ 0.6$ 0.6$ 0.6$ 0.6$ 0.6$ 0.6$ 0.6$ 4.8$
Total Training 0.3$ 7.3$ 9.2$ 6.3$ 5.4$ 5.2$ 5.1$ 5.2$ 5.3$ 5.0$ 54.4$
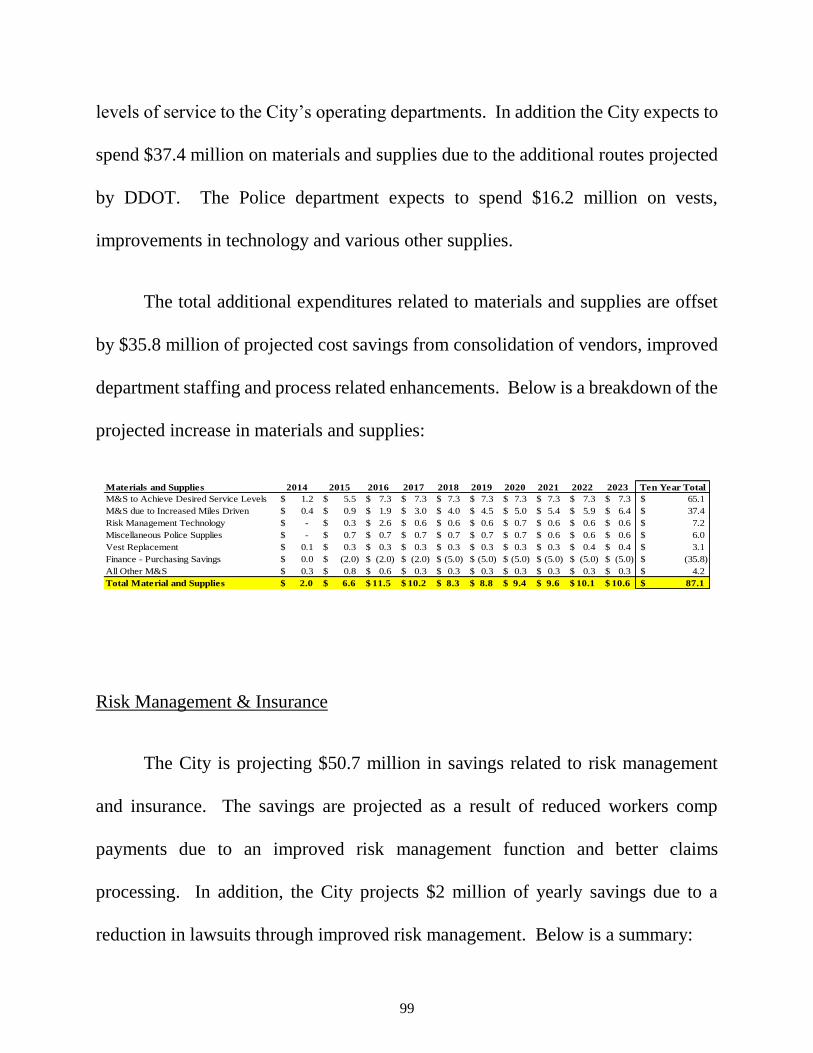
99
levels of service to the City’s operating departments. In addition the City expects to
spend $37.4 million on materials and supplies due to the additional routes projected
by DDOT. The Police department expects to spend $16.2 million on vests,
improvements in technology and various other supplies.
The total additional expenditures related to materials and supplies are offset
by $35.8 million of projected cost savings from consolidation of vendors, improved
department staffing and process related enhancements. Below is a breakdown of the
projected increase in materials and supplies:
Risk Management & Insurance
The City is projecting $50.7 million in savings related to risk management
and insurance. The savings are projected as a result of reduced workers comp
payments due to an improved risk management function and better claims
processing. In addition, the City projects $2 million of yearly savings due to a
reduction in lawsuits through improved risk management. Below is a summary:
Materials and Supplies 2014 2015 2016 2017 2018 2019 2020 2021 2022 2023 Ten Year Total
M&S to Achieve Desired Service Levels 1.2$ 5.5$ 7.3$ 7.3$ 7.3$ 7.3$ 7.3$ 7.3$ 7.3$ 7.3$ 65.1$
M&S due to Increased Miles Driven 0.4$ 0.9$ 1.9$ 3.0$ 4.0$ 4.5$ 5.0$ 5.4$ 5.9$ 6.4$ 37.4$
Risk Management Technology -$ 0.3$ 2.6$ 0.6$ 0.6$ 0.6$ 0.7$ 0.6$ 0.6$ 0.6$ 7.2$
Miscellaneous Police Supplies -$ 0.7$ 0.7$ 0.7$ 0.7$ 0.7$ 0.7$ 0.6$ 0.6$ 0.6$ 6.0$
Vest Replacement 0.1$ 0.3$ 0.3$ 0.3$ 0.3$ 0.3$ 0.3$ 0.3$ 0.4$ 0.4$ 3.1$
Finance - Purchasing Savings 0.0$ (2.0)$ (2.0)$ (2.0)$ (5.0)$ (5.0)$ (5.0)$ (5.0)$ (5.0)$ (5.0)$ (35.8)$
All Other M&S 0.3$ 0.8$ 0.6$ 0.3$ 0.3$ 0.3$ 0.3$ 0.3$ 0.3$ 0.3$ 4.2$
Total Material and Supplies 2.0$ 6.6$ 11.5$ 10.2$ 8.3$ 8.8$ 9.4$ 9.6$ 10.1$ 10.6$ 87.1$

100
Other Operating Expenditures
Other operating expenditures over the ten year period include:
Utilities: $2.6 million in additional costs projected by the General Services
department
Purchased Services:
o $4.5 million in savings related to $6.75 million less outside legal
costs due to additional labor in the Law department
o $5.7 million in savings due to less involvement from consultants in
the Finance department
o $1.1 million in additional expenditures related to additional DDOT
miles
o $1.9 million in additional outside services in the Police department
o $1.7 million for storage and maintenance of medical records due to
the outsourcing of the Health and Wellness department
o $1.3 million in additional actuarial and benefit consulting
o $1.2 million in security and planning related to the Airport
department.
Grants: $20.3 million in grant related costs associated with the Hardest Hit
Fund from FY2014-2016
Other Expenses:
o $17.4 million in other savings as a result of the Neighborhood and Lean
Process Improvement Program
o $7.1 million in costs in the Police department mostly related to new
facilities
Risk Management and Insurance 2014 2015 2016 2017 2018 2019 2020 2021 2022 2023 Ten Year Total
Workers Comp Savings -$ -$ (4.0)$ (4.0)$ (4.0)$ (4.0)$ (4.0)$ (4.0)$ (4.0)$ (4.0)$ (32.0)$
Reduction in Lawsuits -$ (2.0)$ (2.0)$ (2.0)$ (2.0)$ (2.0)$ (2.0)$ (2.0)$ (2.0)$ (2.0)$ (18.0)$
All Other -$ (0.1)$ (0.1)$ (0.1)$ (0.1)$ (0.1)$ (0.1)$ (0.1)$ (0.1)$ (0.1)$ (0.7)$
Total Risk Management & Insurance -$ (2.1)$ (6.1)$ (6.1)$ (6.1)$ (6.1)$ (6.1)$ (6.1)$ (6.1)$ (6.1)$ (50.7)$
101
Reorganization/Investment
The City is projecting it will incur an additional $582 million in capital
expenditures and infrastructure improvements in the next 10 years to improve the
City’s level of services. The City views these initiatives as critical components in
stabilizing the City and attracting and retaining quality employees for the City of
Detroit.
Technology & Infrastructure
The City’s IT department has been underfunded for many years and is in need
of a significant upgrade to its operating systems, software and hardware. The City
expects to undertake a number of initiatives to improve the current systems in place
including:
$29 million related to a new ERP System which includes both installation
and annual maintenance to improve the City’s financial processes and
reporting
$11.7 million related to City wide hardware upgrades
$10.9 million related to data backup centers
$10.4 million related to the City-wide installation of Microsoft 365
$5.2 million related to the implementation of CityTax

102
Other significant investments which will provide better services to the citizens
of the Detroit include the installation and implementation of a new 311 system,
implementation of an integrated public safety system and replacement of handheld
Police radios. Below is a breakdown of key IT and infrastructure investments over
the next ten years:
Capital Expenditures
The City has identified a number of facility-related capital expenditures
including current facility repairs and new or replacement facilities, some of which
are itemized below.
$40.3 million for repairs and space consolidation across all City buildings
$37 million for facility improvements and emergency repairs to the various
parks and recreation centers
IT and Infrastructure Department 2014 2015 2016 2017 2018 2019 2020 2021 2022 2023 Ten Year Total
ERP System Finance -$ 7.4$ 10.3$ 9.0$ 0.4$ 0.4$ 0.4$ 0.4$ 0.4$ 0.4$ 29.0$
Replacement of Radios Police -$ 7.5$ 7.5$ 1.0$ 1.0$ 1.0$ 1.0$ 1.0$ 1.0$ 1.0$ 22.0$
Implementation of Integrated Public Safety System Police -$ 4.5$ 2.5$ 1.0$ 1.0$ 1.0$ 1.0$ 1.0$ 1.0$ 1.0$ 13.8$
Hardware Upgrade Finance -$ 1.5$ 2.0$ 2.0$ 1.2$ 1.0$ 1.0$ 1.0$ 1.0$ 1.0$ 11.7$
Data Back Up Center Finance -$ -$ 4.9$ 2.4$ 0.2$ 0.2$ 2.7$ 0.2$ 0.2$ 0.2$ 10.9$
Microsoft Application Department - 365 Cloud (Net of Savings) Finance -$ 1.3$ 1.1$ 1.1$ 1.1$ 1.1$ 1.1$ 1.1$ 1.1$ 1.1$ 10.4$
311 System Ombudsperson -$ -$ 3.0$ 0.5$ 0.5$ 0.6$ 0.6$ 0.6$ 0.6$ 0.6$ 7.0$
Document Imaging and Management System Finance -$ 3.0$ 0.3$ 0.3$ 0.3$ 0.3$ 0.3$ 0.3$ 0.3$ 0.3$ 5.4$
Implementation of City Tax Finance 0.1$ 1.7$ 0.4$ 0.4$ 0.4$ 0.4$ 0.4$ 0.4$ 0.4$ 0.4$ 5.2$
Upgrades to 36th District Court Technology Non Departmental -$ 1.6$ 0.8$ 0.4$ 0.4$ 0.2$ 0.2$ 0.2$ 0.2$ 0.2$ 4.2$
Citywide Network Infrastructure Finance -$ 2.0$ -$ -$ 1.1$ -$ -$ 1.1$ -$ -$ 4.2$
Security Access System to Building Finance -$ 0.6$ 0.6$ 0.6$ 0.4$ 0.4$ 0.4$ 0.4$ 0.4$ 0.4$ 3.8$
Workbrain Upgrades Finance 1.1$ -$ -$ -$ 1.2$ -$ -$ -$ 1.3$ -$ 3.6$
Fire Vehicle Technology Upgrade Fire -$ 0.7$ 0.1$ 0.1$ 0.1$ 0.1$ 0.7$ 0.1$ 0.1$ 0.1$ 2.2$
Helpdesk Software Finance -$ 1.6$ 0.1$ 0.1$ 0.1$ 0.1$ 0.1$ 0.1$ 0.1$ 0.1$ 2.0$
Active Directory Service Migration Finance -$ 1.3$ 0.1$ 0.1$ 0.1$ 0.1$ 0.1$ 0.1$ 0.1$ 0.1$ 2.0$
Cashiering Controls Finance -$ 1.4$ -$ -$ -$ -$ -$ -$ -$ -$ 1.4$
HR Learning Center and Implementation HR -$ 0.5$ 0.1$ 0.1$ 0.1$ 0.1$ 0.1$ 0.1$ 0.1$ 0.1$ 1.3$
Operating System Upgrade Finance -$ 1.0$ -$ -$ -$ -$ -$ -$ -$ -$ 1.0$
SQL Server Update Finance -$ 0.2$ 0.1$ 0.1$ 0.1$ 0.1$ 0.1$ 0.1$ 0.1$ 0.1$ 0.7$
All Other Various 1.9$ 3.6$ 0.5$ 0.5$ 0.5$ 0.5$ 0.6$ 0.7$ 0.5$ 0.5$ 9.8$
Total IT and Infrastructure 3.1$ 41.3$ 34.4$ 19.6$ 10.1$ 7.4$ 10.7$ 8.8$ 8.8$ 7.5$ 151.7$

103
$34.2 million for a new Police training facility, new precincts and various
improvements to current buildings
$71.3 million for Fire department improvements including $31.2 million
in repairs and maintenance to current firehouses, $21 million for 7 new
firehouses and $19 million in new gear and equipment
$15.7 million in required airport upgrades by the Department of
Transportation
$10.3 million in system and equipment upgrades for DDOT that are not
grant funded.
The chart below details the capital expenditures the City is projecting over the ten
year period:
Fleet
The City reviewed the current condition of vehicles in the Police, Fire, GSD
and Parking departments. The City projected the number of vehicles needed by
department to supply adequate levels of service to the City. The City then projected
the cost per vehicle and projected life cycles for each vehicle to determine the yearly
number of vehicles to be purchased and the related cost.
Capital Expenditures Department 2014 2015 2016 2017 2018 2019 2020 2021 2022 2023 Ten Year Total
Department City Wide Projects and Space Consolidation GSD 1.2$ 5.1$ 7.2$ 4.8$ 3.8$ 3.6$ 3.6$ 3.8$ 3.7$ 3.7$ 40.3$
Facility Improvements/Upgrades and Emergency Repairs Recreation 0.9$ 4.8$ 4.1$ 4.8$ 4.0$ 4.5$ 3.9$ 3.3$ 3.3$ 3.3$ 37.0$
Department wide improvement projects, New Training Facility and New Precincts Police 0.7$ 13.7$ 6.5$ 0.1$ 0.5$ 0.2$ 3.3$ 3.1$ 3.0$ 3.0$ 34.2$
R&M of Fire Department Facilities Fire 1.1$ 3.0$ 5.5$ 2.4$ 1.1$ 2.0$ 5.1$ 4.1$ 3.0$ 4.0$ 31.2$
New Firehouses Fire -$ -$ 3.0$ 3.0$ 3.0$ 6.0$ 3.0$ 3.0$ -$ -$ 21.0$
Gear and equipment Fire 2.0$ 3.0$ 1.4$ 2.1$ 1.7$ 1.7$ 1.7$ 1.5$ 2.4$ 1.5$ 19.0$
Executive Bay Upgrades, New Jetway, Terminal Upgrades and Other Improvements Airport -$ 0.4$ 5.0$ 5.3$ 5.0$ -$ -$ -$ -$ -$ 15.7$
ERP, Security, Fleet Mgt, Radio, AVL & APC System Upgrades (All Non Grant Funded) DDOT -$ 1.6$ 2.0$ 2.3$ 2.5$ 1.0$ 1.0$ -$ -$ -$ 10.3$
Herman Keifer Demolition Costs Health and Wellness -$ -$ 5.1$ -$ -$ -$ -$ -$ -$ -$ 5.1$
R&M for buildings Non Departmental -$ 1.0$ 0.5$ 0.5$ 0.5$ 0.5$ 0.5$ 0.5$ 0.5$ 0.5$ 5.0$
Upgrades to Caniff Impound Lot Parking -$ 0.7$ 0.1$ 0.1$ 0.1$ 0.2$ 0.2$ 0.2$ 0.2$ 0.2$ 2.0$
Training Location HR -$ -$ 1.0$ -$ -$ -$ -$ -$ -$ -$ 1.0$
All Other Various -$ 0.4$ 0.3$ 0.6$ 0.3$ -$ 0.5$ 0.5$ 0.5$ 0.5$ 3.7$
Total CapEx 5.9$ 33.5$ 41.7$ 26.1$ 22.4$ 19.5$ 22.7$ 20.0$ 16.7$ 16.8$ 225.4$

104
The Police Department projects an average life cycle of 3.5 years resulting
in 270 new scout cars costing $91.3 million over the next ten years
Fleet purchases for the Fire Department include $40 million for new
purchases and $18.6 million for repairs of their current fleet
The General Services department projects spending $6.4 million over the
next ten years on purchases of new vehicles and equipment and $9.7
million on upgrades to City owned parks
The Parking Department expects to spend $1.4 million over the next ten
on vehicles
The chart below outlines fleet spending over the ten year period:
Reorganization
The City is expecting to incur various expenses related to implementing the
RRIs. These are generally one-time expenses and include:
$15.4 million in costs related to reassessing and revaluing all properties in
the City
$10.2 million related to outside services for strategic planning, facility
consolidation and zoning activities
$3.7 million for contract employees at the 36th District Court related to
restructuring initiatives.
Fleet Department 2014 2015 2016 2017 2018 2019 2020 2021 2022 2023 Ten Year Total
Fleet replacement - Police Police -$ 9.5$ 11.7$ 10.0$ 10.0$ 10.0$ 10.0$ 10.0$ 10.0$ 10.0$ 91.3$
Fleet Replacement Program and Preventive Maintenance Program Fire 6.2$ 11.7$ 9.0$ 5.9$ 5.7$ 4.9$ 5.1$ 4.5$ 3.0$ 2.7$ 58.6$
Upgrade Parks GSD 1.2$ 3.5$ 2.5$ 2.5$ -$ -$ -$ -$ -$ -$ 9.7$
Replacement of vehicles GSD 0.9$ 0.7$ 0.6$ 0.6$ 0.6$ 0.6$ 0.6$ 0.6$ 0.6$ 0.6$ 6.4$
Fleet replacement - Parking Parking -$ 0.4$ 0.1$ 0.1$ 0.1$ 0.1$ 0.1$ 0.1$ 0.1$ 0.1$ 1.4$
Total Fleet 8.3$ 25.8$ 24.0$ 19.1$ 16.4$ 15.7$ 15.8$ 15.2$ 13.7$ 13.4$ 167.4$
105
Reinvestment Deferrals
As the City negotiated settlements with creditors and stakeholders, proposed
POA payments have taken priority over RRI spending in the near term. As a result,
there has been a need to permanently or temporarily defer RRIs in order to maintain
adequate levels of liquidity to fund operations and meet the obligations proposed in
the POA. The updated July 2nd projections identify all but $29.8 million of the
deferrals as to the individual RRI and the timing. In general, the City sought to defer
RRIs that would have the least impact on future revenue and cost savings. If the
City enters into additional settlements with creditors, it is likely that additional RRI
deferrals will be necessary.
Non Operating Expenditures
The City projected a number of necessary non-operating expenditures in the
POA projections. These include one-time costs associated with the chapter 9,
decommission of the City’s power plants, payments required in the POA and a 1%
contingency, among other items. These expenses are detailed below:
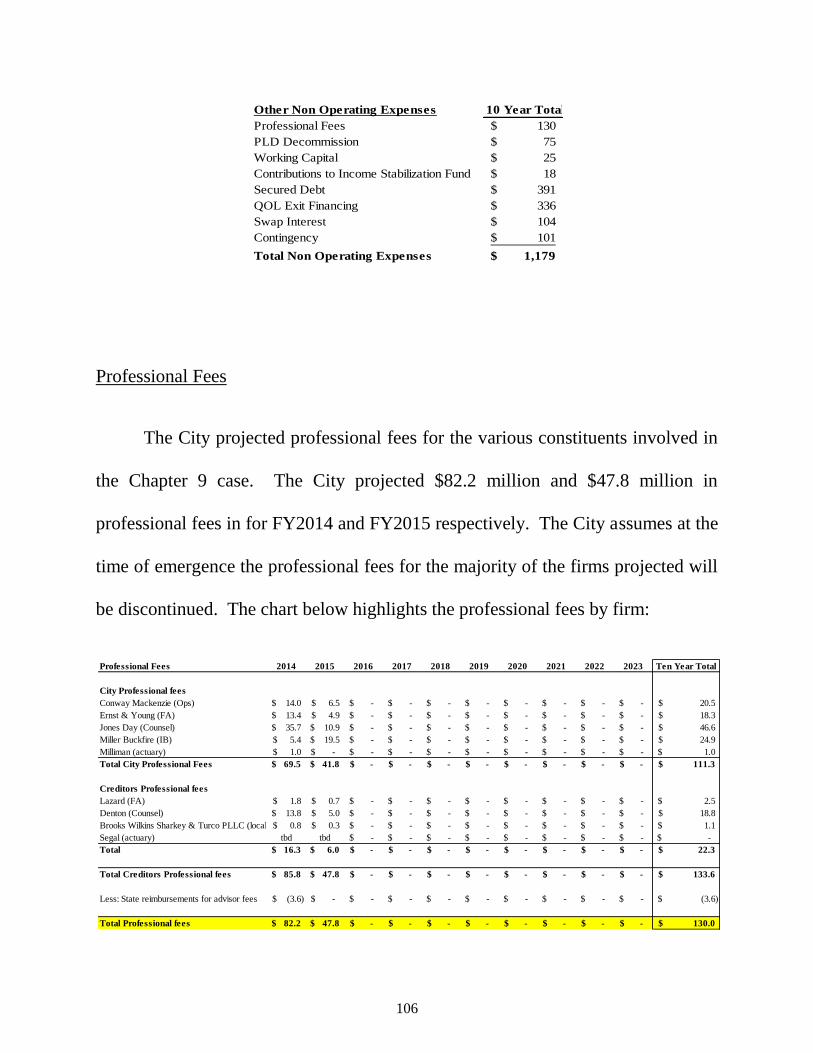
106
Professional Fees
The City projected professional fees for the various constituents involved in
the Chapter 9 case. The City projected $82.2 million and $47.8 million in
professional fees in for FY2014 and FY2015 respectively. The City assumes at the
time of emergence the professional fees for the majority of the firms projected will
be discontinued. The chart below highlights the professional fees by firm:
Other Non Operating Expenses 10 Year Total
Professional Fees 130$
PLD Decommission 75$
Working Capital 25$
Contributions to Income Stabilization Fund 18$
Secured Debt 391$
QOL Exit Financing 336$
Swap Interest 104$
Contingency 101$
Total Non Operating Expenses 1,179$
Professional Fees 2014 2015 2016 2017 2018 2019 2020 2021 2022 2023 Ten Year Total
City Professional fees
Conway Mackenzie (Ops) 14.0$ 6.5$ -$ -$ -$ -$ -$ -$ -$ -$ 20.5$
Ernst & Young (FA) 13.4$ 4.9$ -$ -$ -$ -$ -$ -$ -$ -$ 18.3$
Jones Day (Counsel) 35.7$ 10.9$ -$ -$ -$ -$ -$ -$ -$ -$ 46.6$
Miller Buckfire (IB) 5.4$ 19.5$ -$ -$ -$ -$ -$ -$ -$ -$ 24.9$
Milliman (actuary) 1.0$ -$ -$ -$ -$ -$ -$ -$ -$ -$ 1.0$
Total City Professional Fees 69.5$ 41.8$ -$ -$ -$ -$ -$ -$ -$ -$ 111.3$
Creditors Professional fees
Lazard (FA) 1.8$ 0.7$ -$ -$ -$ -$ -$ -$ -$ -$ 2.5$
Denton (Counsel) 13.8$ 5.0$ -$ -$ -$ -$ -$ -$ -$ -$ 18.8$
Brooks Wilkins Sharkey & Turco PLLC (local counsel)0.8$ 0.3$ -$ -$ -$ -$ -$ -$ -$ -$ 1.1$
Segal (actuary) tbd tbd -$ -$ -$ -$ -$ -$ -$ -$ -$
Total 16.3$ 6.0$ -$ -$ -$ -$ -$ -$ -$ -$ 22.3$
Total Creditors Professional fees 85.8$ 47.8$ -$ -$ -$ -$ -$ -$ -$ -$ 133.6$
Less: State reimbursements for advisor fees (3.6)$ -$ -$ -$ -$ -$ -$ -$ -$ -$ (3.6)$
Total Professional fees 82.2$ 47.8$ -$ -$ -$ -$ -$ -$ -$ -$ 130.0$
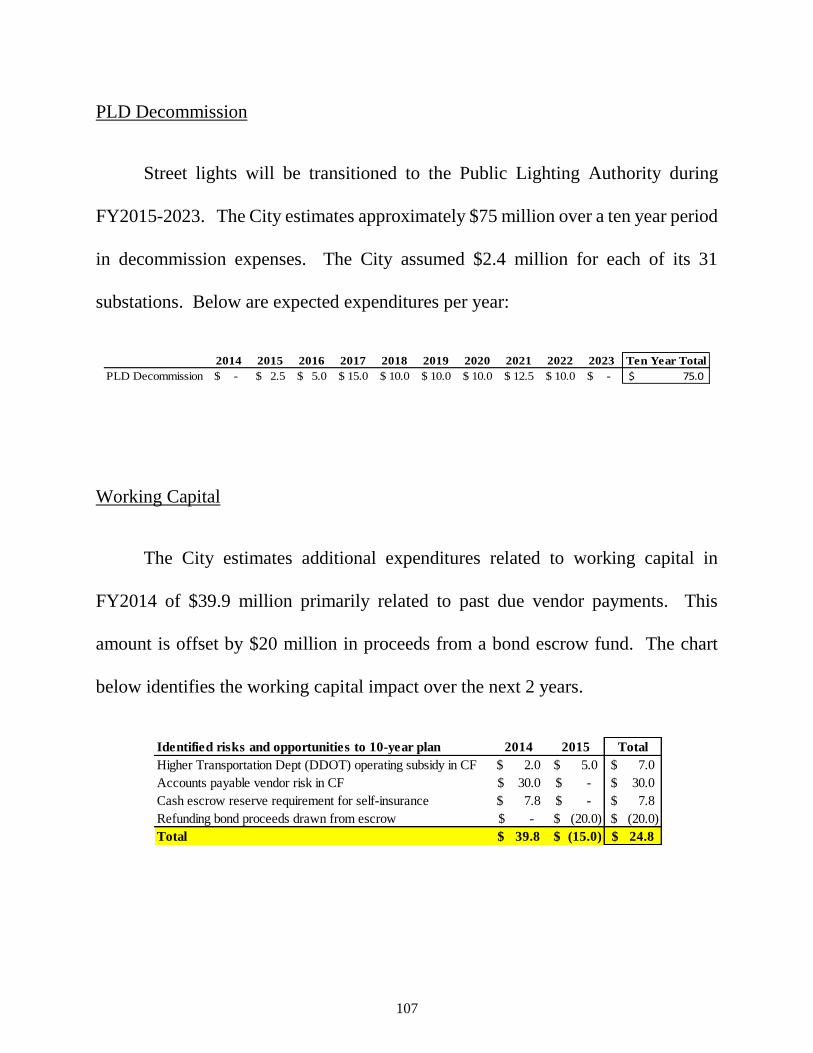
107
PLD Decommission
Street lights will be transitioned to the Public Lighting Authority during
FY2015-2023. The City estimates approximately $75 million over a ten year period
in decommission expenses. The City assumed $2.4 million for each of its 31
substations. Below are expected expenditures per year:
Working Capital
The City estimates additional expenditures related to working capital in
FY2014 of $39.9 million primarily related to past due vendor payments. This
amount is offset by $20 million in proceeds from a bond escrow fund. The chart
below identifies the working capital impact over the next 2 years.
2014 2015 2016 2017 2018 2019 2020 2021 2022 2023 Ten Year Total
PLD Decommission -$ 2.5$ 5.0$ 15.0$ 10.0$ 10.0$ 10.0$ 12.5$ 10.0$ -$ 75.0$
Identified risks and opportunities to 10-year plan 2014 2015 Total
Higher Transportation Dept (DDOT) operating subsidy in CF 2.0$ 5.0$ 7.0$
Accounts payable vendor risk in CF 30.0$ -$ 30.0$
Cash escrow reserve requirement for self-insurance 7.8$ -$ 7.8$
Refunding bond proceeds drawn from escrow -$ (20.0)$ (20.0)$
Total 39.8$ (15.0)$ 24.8$

108
Income Stabilization Fund
The Income Stabilization Fund is the result of negotiations between the City
and the PFRS and GRS. $20 million will be paid to pensioners that meet the
following criteria:
Eligible pensioner's total household income is equal to 130% of the federal
poverty Level in 2013 or:
The annual pension benefit payment payable to each eligible pensioner
equals 100% of the annual pension benefit payment actually received by
the eligible pensioner in 2013, whichever amount is lower.
The payments will be made over a 14 year period from excess funds from the
UTGO property Tax Millage after accounting for UTGO Secured debt payments and
Note A UTGO debt payments. Below highlights the projected payments over the
ten year period:
Secured Debt
The City projects debt payments for secured debt to continue to be paid via
the same amortization schedules used prior to filing Chapter 9. Below is the detailed
amortization schedule for each tranche of debt:
2015 2016 2017 2018 2019 2020 2021 2022 2023 Ten Year Total
Income Stabilization Fund 2.5$ 2.3$ 2.3$ 2.2$ 2.1$ 2.1$ 2.0$ 1.3$ 1.1$ 17.8$

109
Quality of Life/Exit Financing
The City plans to draw down $292.7 million on its $300 million Exit Facility
by the end of FY2016. The current quality of life loan is expected to be refinanced
as part of the exit facility at the emergence of bankruptcy. The Exit Facility bears
interest at 6% and matures in 2026. The City begins to make principal payments on
the loan starting in 2019.
Swap Interest
The City assumes the agreed upon settlement of the PFRS and GRS Swaps of
$85 million at emergence from bankruptcy. The City has continued to make
quarterly swap payments while in bankruptcy. The payments made to date will be
2014 2015 2016 2017 2018 2019 2020 2021 2022 2023 Ten Year Total
UTGO Secured Debt
Beginning Principal - UTGO DSA 100.0$ 98.4$ 96.5$ 94.4$ 92.2$ 89.8$ 87.2$ 84.5$ 81.6$ 78.4$ 100.0$
Principal 1.6$ 2.0$ 2.1$ 2.2$ 2.4$ 2.5$ 2.7$ 2.9$ 3.2$ 3.4$ 25.0$
Ending Balance 98.4$ 96.5$ 94.4$ 92.2$ 89.8$ 87.2$ 84.5$ 81.6$ 78.4$ 75.0$ 75.0$
Interest 8.0$ 7.9$ 7.8$ 7.7$ 7.5$ 7.4$ 7.2$ 7.0$ 6.8$ 6.6$ 73.8$
LTGO Secured
Beginning Principal - LTGO DSA 249.8$ 245.5$ 238.8$ 231.8$ 224.5$ 216.7$ 208.6$ 200.0$ 191.0$ 181.7$ 249.8$
Principal (Based on Set-Asides) 4.3$ 6.7$ 7.0$ 7.4$ 7.7$ 8.1$ 8.6$ 9.0$ 9.4$ 9.8$ 78.0$
Ending Balance 245.5$ 238.8$ 231.8$ 224.5$ 216.7$ 208.6$ 200.0$ 191.0$ 181.7$ 171.8$ 171.8$
Interest (Based on Set-Asides) 12.6$ 12.4$ 12.0$ 11.7$ 11.3$ 10.9$ 10.5$ 10.1$ 9.7$ 9.3$ 110.3$
LTGO Secured - 2012 Refinancing
Beginning Principal (For GF, actual Debt Service different) 129.5$ 126.6$ 122.2$ 117.6$ 112.7$ 107.6$ 102.3$ 96.7$ 90.9$ 84.7$ 129.5$
Principal 2.9$ 4.4$ 4.6$ 4.9$ 5.1$ 5.3$ 5.6$ 5.8$ 6.1$ 6.5$ 51.3$
Ending Balance 126.6$ 122.2$ 117.6$ 112.7$ 107.6$ 102.3$ 96.7$ 90.9$ 84.7$ 78.3$ 78.3$
Interest 6.1$ 6.0$ 5.8$ 5.6$ 5.4$ 5.1$ 4.9$ 4.7$ 4.4$ 4.1$ 52.2$
Yearly Secured Debt Payments 35.4$ 39.4$ 39.4$ 39.4$ 39.4$ 39.4$ 39.5$ 39.5$ 39.5$ 39.6$ 390.5$

110
deducted from the final payment made at settlement. Below are the projected
payments in FY2014 and FY2015 and reconciliation of the final payment assumed
to occur in October 2014:
Contingency
The City assumed a yearly contingency estimate of 1% of total revenue. Total
revenue includes revenue from the base plan, revenue from the RRIs and proceeds
from the Exit Facility. Total contingency is $101 million over the ten year period.
Public Acts 181 and 182 of 2014, part of the so called Grand Bargain legislation
requires a contingency of not less than 5% of projected expenses in each year. This
difference in the amount of contingency is approximately $40 million in FY2015.
2014 2015 Total
POC Swaps
PFRS Interest 29.6$ 10.2$ 39.8$
GRS Interest 16.3$ 5.5$ 21.9$
POC Swap Payment 45.9$ 15.7$ 61.6$
Swap Settlement 42.1$ 42.1$
Total Swap Payments 45.9$ 57.8$ 103.8$
Reconciliation of Final Payment Total
Settlement 85.0$
FY14 int. payments (Post Bankruptcy) 27.2$
FY15 Int. payments (Prior to Emergence from Bankruptcy) 15.7$
Bulk payment in Oct, 2014 42.1$
111
Section I - Systems, Controls and Reporting
Introduction
“The effective use of technology is an essential foundation of a modern,
efficient and effective government, and that absent a modernized IT
infrastructure, a city is unable to adequately deliver government
services for the public.”36
This quote is from Beth Niblock’s Report filed in connection with the Detroit
bankruptcy. Ms. Niblock, the City of Detroit’s Chief Information Officer, also
concludes in her report that: “The City’s information technology is deficient”.37 I
agree that a working technological platform allows the City to properly operate. I
also believe that the City’s IT infrastructure is so broken that, left unaddressed,
threatens the City’s ability to meet the commitments in the POA. The City’s current
technology infrastructure problems are the direct result of long term, systematic
underfunding and lack of leadership.
36 Report of Beth Niblock, Chief Information Officer for the City of Detroit; in re:
City of Detroit, para 6 page 3. 37 Report of Beth Niblock, Chief Information Officer for the City of Detroit; in re:
City of Detroit, para 4.A. page 3.

112
Nowhere is this failure as evident as it is in the City’s Finance departments.
The lack of accounting and financial information systems confounds virtually every
City operation and makes it difficult to perform even basic analysis or performance
monitoring. The Emergency Manager’s description below provides a realistic
picture of the City’s current systems:
“The City's core financial, accounting and budgeting systems similarly
suffer from the lack of modern IT. The City's financial reporting and
budget development systems: (a) are 10 to 15 years old; (b) require a
manual interface (70% of journal entries are booked manually); (c)
lack reliable fail-over and back-up systems; and (d) lack a formal,
documented IT governance structure, all of which impairs the
reporting, efficiency and accuracy of the data and the accountability of
the systems. The City's grant tracking systems are fragmented and
unstandardized to the extent that the City is unable to comprehensively
track citywide grant funds and status or prevent disallowed costs. Aged
IT infrastructure within the City's Buildings, Safety Engineering and
Environmental Department ("BSEED") and the DFD leads to
bottlenecks in permit invoicing and collections….” 38
These issues will not be addressed overnight, nor will they be easy. The
funding, implementation, and management of new information and reporting
systems are critical to adequately deliver government services to the public. The
City has accumulated dozens of non-integrated systems which make it impossible to
obtain the timely and reliable systemic information necessary for efficient operations
and informed decision making. The remainder of this section will discuss some
38 Declaration of Kevyn Orr in Support of City of Detroit, Michigan’s Statement of
Qualifications Pursuant to Section 109 (c) of the Bankruptcy Code. Page 30, para
41.

113
particular challenges with accounting and financial controls and reporting and
conclude with a discussion of the broader issues surrounding the investments the
City must make in IT.
Accounting Controls and Processes
Of all of the measurable impacts of the City’s IT, Accounting Control and
Reporting problems, perhaps the most visible is the impact on the City’s financial
reporting, which affects the ability of City leaders and department heads to make
real time, informed decisions. In the City’s 2012 Independent Auditors Report,
KMPG states:
“Although the City of Detroit (City) has made incremental
improvement in their financial closing and reporting processes,
deficiencies still exist in the processes to evaluate accounts, and timely
record entries into the general ledger in a complete and accurate
manner”39
Historically, the City has not performed monthly closings or published
monthly financial statements. The City’s accounting “closing” process is so
inefficient that recent attempts the City has made to implement a monthly General
Ledger (“G/L”) closing and financial statement preparation process have failed.
39 Independent Auditors’ Report on Internal Control over Financial Reporting and
on Compliance and Other Matters Based on an Audit of Financial Statements
Performed in Accordance with Government Auditing Standards, KPMG, 2012, Pg
3
114
Going forward, I believe the City needs to prioritize monthly financial reporting
against the City’s budget. A monthly closing process will enable the City’s leaders
to make the continuous large and small adjustments needed to promote directional
compliance with the Plan.
KPMG has determined the City’s system of internal accounting controls and
procedures are so weak that KPMG cannot rely on them when performing the year-
end audit. The ineffectiveness of the current financial systems does not allow the
City to internally perform essential daily tasks such as account reconciliations, bank
reconciliations, and account analysis, which are the cornerstones of good accounting
controls. Rather, these activities are performed once a year by outside consultants
as part of preparation for the annual audit process. To that end, KPMG performs
substantive testing of all accounts to its materiality threshold in order to render an
opinion on the City’s financial statements and explains why it takes the City about
twelve months to prepare fiscal year-end financial reports.
Financial Reporting
Perhaps the only standardized financial reporting that the City undertakes is
the development of the Comprehensive Annual Financial Report (“CAFR”) which
is promulgated by the Government Finance Officers Association. The CAFR is
115
essentially a comprehensive look at the City’s financial position and performance.
The City’s CAFR for the fiscal year ended June 30, 2013 has not been released as of
the date of this Report.
Another of the City’s major reporting tasks is performed by Ernst &
Young. E&Y prepares daily, weekly and monthly reports of cash, revenues,
and expenditures. These reports track the City’s available cash using bank
statements and numerous other City documents that report one or more cash
activities. These reports are independently generated and are not reconciled
to the City’s general ledger system through account reconciliations or bank
reconciliations. These E&Y reports are consolidated for multiple accounting
periods, as well as reported separately in other City reports including those of
the Emergency Manager. The current cash management and cash reporting
system has been managed by E&Y personnel since before the appointment of
the Emergency Manager. It is my understanding that the City has not
budgeted for E&Y continuing in this role after confirmation, nor has the City
made accommodations to take over this work from E&Y. This is an
unacceptable risk to the success of the POA and the City must identify and
fund a solution for both the near term and longer term.

116
Whenever contemporaneous financial information is required, the City has no
choice but to rely on the incomplete and unreliable financial data from the G/L
system. As such, external reports such as the Emergency Manager’s reports to
Financial Advisory Board contain necessary disclaimers such as:
“The revenues and expenditures report includes entries that have not
been posted in the general ledger and encumbrances. This manner of
presentation provides the most up to date data on revenues and
expenditures. Unposted entries are preliminary and subject to review
before they are finalized; therefore, actual results will likely be different
from the preliminary results presented herein, and those differences
may be material.”40
Potential Plan Implications
Beyond financial reporting, the efficient and controlled execution of the
accounting and finance functions are essential to achieving the financial initiatives
set forth in the Plan. Some of the most important assumptions in the POA depend
on improving the accounting and finance function within the City. For example:
Municipal Income Taxes: the City processes and audits income tax returns,
and collects income tax revenues which account for 25% of the City’s
revenue in FY2014-2023
Purchasing: the City’s purchasing function manages the City’s contracts
for all commodities and services which are forecasted to total $3 billion in
the next ten years
Property Taxes: The assessor’s office creates the tax rolls used to invoice
citizens and commercial customers for real estate taxes which are
estimated to account for 9% of the City’s revenue in FY2014-2023 and the
Treasury department is responsible for the billing and collection function
40 Emergency Manager’s report
117
Grants: Grant funding is expected to increase in the City going forward.
In fact, there are additional opportunities for the City to acquire grants if it
can responsibly manage and account for them. The City has failed to
properly account for and manage grants in the past which has led to
improperly spent funds. The City can benefit by tens of millions of dollars
if this process is improved
The diminished capacity of these finance departments to execute their basic
functions is a result of attrition and an historic failure to invest in people and systems.
If the City does not build internal capacity in its finance and accounting functions in
a timely fashion, it could threaten the execution of the POA.
Information Technology
The City, as detailed in the Plan, is addressing its system issues with a number
of major initiatives funded as part of the RRIs. These IT-related initiatives include:
$29 million related to a new Enterprise Resource Planning (“ERP”)
system, which includes both the installation and annual maintenance to
improve the City’s financial processes and reporting.
$11.7 million related to City-wide hardware upgrades.
$10.9 million related to Data Back Up centers.
$10.4 million related to the City-wide installation of Microsoft 365.
$5.2 million related to the implementation of City Tax.
While the IT department expects to spend almost $85 million on restructuring
initiatives over the next 10 years, the total investment in IT related expenses by the
City is upwards of $150 million. It should be noted that this figure does not include

118
a budget of $3 million for the implementation of a replacement payroll system,
which is included in E&Y’s base line financial projections. We believe the City
would benefit with a more centralized control over all IT related investments. The
following chart details the significant IT-related restructuring initiatives out of each
of the departmental RRIs:
These initiatives are a significant investment and present an opportunity for
the City to improve services and functionality throughout its operations. However,
to enhance the City’s ability to execute the proposals within the POA, the City will
need to manage the execution of the IT initiatives at the most senior level in the City
and make sure that it reacts to any material deviations - from cost or timeline - in the
implementations.
According to CFO John Hill, the City’s strategy to correct this catastrophic
decline in essential finance, accounting and IT services has three major components:
IT and Infrastructure Department 2014 2015 2016 2017 2018 2019 2020 2021 2022 2023 Ten Year Total
ERP System Finance -$ 7.4$ 10.3$ 9.0$ 0.4$ 0.4$ 0.4$ 0.4$ 0.4$ 0.4$ 29.0$
Replacement of Radios Police -$ 7.5$ 7.5$ 1.0$ 1.0$ 1.0$ 1.0$ 1.0$ 1.0$ 1.0$ 22.0$
Implementation of Integrated Public Safety System Police -$ 4.5$ 2.5$ 1.0$ 1.0$ 1.0$ 1.0$ 1.0$ 1.0$ 1.0$ 13.8$
Hardware Upgrade Finance -$ 1.5$ 2.0$ 2.0$ 1.2$ 1.0$ 1.0$ 1.0$ 1.0$ 1.0$ 11.7$
Data Back Up Center Finance -$ -$ 4.9$ 2.4$ 0.2$ 0.2$ 2.7$ 0.2$ 0.2$ 0.2$ 10.9$
Microsoft Application Department - 365 Cloud (Net of Savings) Finance -$ 1.3$ 1.1$ 1.1$ 1.1$ 1.1$ 1.1$ 1.1$ 1.1$ 1.1$ 10.4$
311 System Ombudsperson -$ -$ 3.0$ 0.5$ 0.5$ 0.6$ 0.6$ 0.6$ 0.6$ 0.6$ 7.0$
Document Imaging and Management System Finance -$ 3.0$ 0.3$ 0.3$ 0.3$ 0.3$ 0.3$ 0.3$ 0.3$ 0.3$ 5.4$
Implementation of City Tax Finance 0.1$ 1.7$ 0.4$ 0.4$ 0.4$ 0.4$ 0.4$ 0.4$ 0.4$ 0.4$ 5.2$
Upgrades to 36th District Court Technology Non Departmental -$ 1.6$ 0.8$ 0.4$ 0.4$ 0.2$ 0.2$ 0.2$ 0.2$ 0.2$ 4.2$
Citywide Network Infrastructure Finance -$ 2.0$ -$ -$ 1.1$ -$ -$ 1.1$ -$ -$ 4.2$
Security Access System to Building Finance -$ 0.6$ 0.6$ 0.6$ 0.4$ 0.4$ 0.4$ 0.4$ 0.4$ 0.4$ 3.8$
Workbrain Upgrades Finance 1.1$ -$ -$ -$ 1.2$ -$ -$ -$ 1.3$ -$ 3.6$
Fire Vehicle Technology Upgrade Fire -$ 0.7$ 0.1$ 0.1$ 0.1$ 0.1$ 0.7$ 0.1$ 0.1$ 0.1$ 2.2$
Helpdesk Software Finance -$ 1.6$ 0.1$ 0.1$ 0.1$ 0.1$ 0.1$ 0.1$ 0.1$ 0.1$ 2.0$
Active Directory Service Migration Finance -$ 1.3$ 0.1$ 0.1$ 0.1$ 0.1$ 0.1$ 0.1$ 0.1$ 0.1$ 2.0$
Cashiering Controls Finance -$ 1.4$ -$ -$ -$ -$ -$ -$ -$ -$ 1.4$
HR Learning Center and Implementation HR -$ 0.5$ 0.1$ 0.1$ 0.1$ 0.1$ 0.1$ 0.1$ 0.1$ 0.1$ 1.3$
Operating System Upgrade Finance -$ 1.0$ -$ -$ -$ -$ -$ -$ -$ -$ 1.0$
SQL Server Update Finance -$ 0.2$ 0.1$ 0.1$ 0.1$ 0.1$ 0.1$ 0.1$ 0.1$ 0.1$ 0.7$
All Other Various 1.9$ 3.6$ 0.5$ 0.5$ 0.5$ 0.5$ 0.6$ 0.7$ 0.5$ 0.5$ 9.8$
Total IT and Infrastructure 3.1$ 41.3$ 34.4$ 19.6$ 10.1$ 7.4$ 10.7$ 8.8$ 8.8$ 7.5$ 151.7$
119
Implement a new payroll system and restructure the existing payroll
reporting structure
Implement a new integrated ERP system without customization
accompanied by the implementation of the ERP’s “best practices” polices
and business processing procedures
Restructure the existing organization structure, processes and controls.
Replacing the payroll system is considered to be of the highest priority by
everyone we spoke with. Under the existing organization structure, payroll
processing reports operationally to the Human Resources department. The Payroll
system technology is under the jurisdiction of the City’s IT department. Under the
envisioned Finance and Accounting reorganization, payroll processing would report
to the CFO, as it should.
The second part of this major undertaking is to implement a new, integrated
ERP system along with established “Best Practices” for policies, procedures and
business processes. The City’s IT department will have overall responsibility for the
implementation forecasted to take approximately 2-3 years and cost approximately
$29 million.41 The objective will be to replace the existing Oracle ERP system with
an updated, integrated ERP system that will:
Replace various standalone Finance and Accounting systems
Eliminate the manual loading of data coming from other stand-alone
systems as is done with the current Oracle ERP system
Improve efficiencies and implement strong systematic internal controls
41 Per the Conway McKenzie IT restructuring budget.
120
Ensure an interim closing process and preparation of interim financial
statements and other reporting necessary for the City to manage its
financial affairs
The City believes that it will take several years to implement a new ERP
system and, in the interim, the City will have to rely on the existing systems.
Although many of the inefficiencies and control weaknesses cannot be eliminated,
the City believes the main ERP weaknesses can be mitigated by strengthening the
organizational structure and hiring employees with enhanced skill sets at all levels
and functions, but primarily mid-tier management. John Hill described the City’s
strategy as:
Restructure the Organization to establish better functionality
o Implement a flatter, functionally-orientated organization chart
o Strengthen mid-tier managers to provide better supervision and
accountability
o Establish centralized governance of City-wide Finance and
Accounting functions with the CFO or alternative centralized
governing body
o Establish centralized governance of City-wide IT functions with the
CIO or alternative centralized governing body.
Revise and upgrade job descriptions and applicant skill set requirements
and qualifications
Update the City’s outdated and uncompetitive compensation structure to
enable the City to attract and retain qualified employees
Implement new recruiting processes
Implement initiatives aimed at correcting major deficiencies in each
department’s existing systems and procedures
Risk of Failure

121
The above strategy was created to help ensure the successful implementation of the
IT system initiatives. Large IT systems initiatives have historically contained an
inherent risk. McKinsey & Co. notes that:
As IT systems become an important competitive element in many
industries, technology projects are getting larger, touching more parts
of the organization, and posing a risk to the company if something goes
wrong. Unfortunately, things often do go wrong. Our research,
conducted in collaboration with the University of Oxford, suggests that
half of all large IT projects—defined as those with initial price tags
exceeding $15 million—massively blow their budgets. On average,
large IT projects run 45 percent over budget and 7 percent over time,
while delivering 56 percent less value than predicted. Software projects run the highest risk of cost and schedule overruns
The root causes of cost overruns in IT systems implementations for projects
over $15 million include: unclear objectives and lack of business focus, shifting

122
requirements and technical complexity, unaligned teams, lack of skills, unrealistic
schedule and reactive planning.42
Impact on Feasibility
The risks associated with the IT initiatives alone, warrant additional financial
contingency beyond the general 1% assumption in the POA projections. Systems,
controls and reporting concerns are high on the list of long term threats to feasibility.
It is critical that the City effectively implements the IT initiatives which lay the
foundation of many of the other benefits associated with the RRIs. Detroit will need
strong leadership and exceptional tenacity to accomplish the initiatives on time and
on budget.
I am encouraged by the City’s recent decision to terminate its efforts to
outsource payroll due to a poor design for the implementation. Current City
leadership appropriately abandoned this project, despite having previously spent
several million dollars in the pre-implementation phase, when they realized the
vendor was trying to automate the City’s antiquated payroll system rather than
implement a new system that would meet the needs of the City going forward. This
exemplifies why the most senior levels of City leadership, including the Mayor, CFO
42 McKinsey Report on the City of Detroit, May 2011

123
and CIO, must be actively involved in the strategy and implementation plans to
ensure success and progress with clear measurement metrics.

124
Section J - Pensions
Introduction
Detroit’s legacy retirement obligations, combining both pensions and OPEB,
are the City’s largest liability when combining the funded and unfunded liabilities.
Additionally, these liabilities are arguably the most visible to the City’s retirees,
current employees, and to its citizens, generally. Despite the relative importance,
the magnitude of the City’s retirement obligations and the methods for calculating
them are largely unknown. Assessing the City’s future pension and OPEB
responsibilities involves, among other factors, forecasted health care costs, complex
actuarial models43, and assumptions for the anticipated rate of returns on the
pensions’ assets and the rate used to discount the plans’ future liabilities. Critical
decisions made today will have a substantial impact on the City’s liquidity in future
43 Traditional actuarial forecasts imbed assumptions related to pensioners’ mortality,
rates of retirement, salary increases, overtime, disability rates, interest earned on
assets, and pension plan administrative expenses.

125
years. The magnitude and importance of these decisions will be critical to Detroit’s
viability in the decades to come.
Background
The City of Detroit has historically maintained two separate defined benefit
plans, one for uniformed personnel and one for all other City employees. The City’s
existing pension plans are administered by the respective Retirement Systems, the
Police & Fire Retirement System of the City of Detroit (“PFRS”) and the General
Retirement System of the City of Detroit (“GRS”). The bankruptcy claims related
to PFRS claims are classified as Class 10, while the GRS claims are designated as
Class 11 in the POA. These plans provided for a calculated amount of retirement
income based on earnings and longevity of each individual employee. As typical
with defined benefit plans, the benefits are fixed and are not dependent on
investment returns or other outside factors.
Detroit’s Plan, in an effort to mitigate the City’s expanding legacy pension
issues, proposes to fundamentally restructure the City’s pension obligations for both
its current retirees and its active employees, effective June 30, 2014. The Plan
provides that, on the Effective Date, the City will assume the obligations related to
already accrued benefits under the GRS and the PFRS pension plans as those
benefits will have been modified in the POA. The POA pension proposal modifies

126
each plan under revised structures that impose reduced monthly pension amounts
and/or reduced or eliminated COLA adjustments. The POA also proposes to
restructure the accrual of pension benefits of active employees beginning on July 1,
2014, the parameters of which are detailed below.
City of Detroit Retirees Demographics
As of June 30, 2013, the Retirement Systems for the City of Detroit had
approximately 32,247 members. The demographics of the each Retirement System
are detailed below:
Of the City’s estimated 21,172 retirees, roughly 7,200 (or 34%) are over the age of
75, with another 35% between the ages of 65 and 75. The average PFRS pension in
FY2013 was $30,607 as compared to the average FY2013 GRS pension of $19,213.
Pension Funding Level
Active 3,272 26% 5,658 28% 8,930 28%
Retirees 9,054 73% 12,118 61% 21,172 65%
Other 111 1% 2,214 11% 2,325 7%
12,437 19,990 32,427
PFRS GRS RS Total

127
The accounting for defined benefit plans can be very complex. The
calculations used to determine the appropriate funding levels required each year are
dependent upon macro-economic factors, actuarial assumptions, and other variables
that can be difficult to understand and can be manipulated to bias the required
funding levels.44
Historically, a number of different practices have contributed to a significant
funding shortfall in the two pension plans. The Retirement Systems utilized
unrealistic rate of return assumptions and managed the pension plans in accordance
with questionable investment strategies that resulted in considerable underfunding
of the respective Plans. The Retirement Systems assumed aggressive annual rates
of return on investment (PFRS: 8.0%; GRS: 7.9%), allocated asset gains and losses
over a seven-year period which masked potential funding shortfalls, and utilized
renewing 29- (PFRS) and 30- (GRS) year amortization periods for funding the
unfunded pension obligations.
The calculation of this funding shortfall, or the Unfunded Actuarial Accrued
Liability (“UAAL”), is dependent upon the use of assumptions as noted above.
44 Declaration of Charles M. Moore in Support of Detroit, Michigan’s Statement of
Qualifications Pursuant to Section 109(c) of the Bankruptcy Code; Docket No. 13;
Page 5

128
Based on the assumption methodologies used by the retirement systems previously,
the UAAL was projected, at the end of FY2012, to have been approximately $977
million.45 At June 30, 2013, that UAAL estimate was $1.5 billion as PFRS reported
it was 89% funded with a UAAL of $415 million. At that same time, GRS reported
it was 70% funded with a UAAL of $1.1 billion. Using what the City now believes
are more accurate assumptions, the City’s actuary - Milliman, Inc. - has estimated
that the combined systems’ UAAL, at June 30, 2013, was approximately $3.5
billion. 46
In addition to issues involving the aggressiveness of the rate of return
assumption used to determine funding levels, also contributing to the increase of the
UAAL were a number of questionable activities engaged in by the retirement
systems, which included:
Utilizing GRS fund assets to pay the promised returns on the Annuity
Savings Program which, upon members of GRS allocating 3%, 5% or 7%
of their after-tax salaries into a discreet defined contribution plan,
effectively guaranteed a minimum 7.9% annual investment return
45 Declaration of Charles M. Moore in Support of Detroit, Michigan’s Statement of
Qualifications Pursuant to Section 109(c) of the Bankruptcy Code; Docket No. 13;
Page 5
46 Declaration of Charles M. Moore in Support of Detroit, Michigan’s Statement of
Qualifications Pursuant to Section 109(c) of the Bankruptcy Code; Docket No. 13;
Page 7

129
regardless of the actual investment performance of the pension plans’
assets;
o Using actual market returns for crediting purposes rather than the
guarantee, the City believes that over $387 million of excess
investment earnings were credited to Annuity Savings Funds from
2003-2013
GRS trustees, when the plan’s actual returns were higher than the assumed
rate of return, paid a portion of the positive variance between the actual
investment return and the assumed rate of return in an additional pension
check to already retired pensioners in what is commonly referred to as the
“13th check” program
The City periodically deferred its required year-end PFRS contributions,
and then borrowed to pay those deferrals with debt priced at a rate of 8%;
Retirement System officials have been accused and/or indicted of material
fiduciary misconduct, allegedly draining the pension of necessary liquidity
and contributing to the underfunding of the Retirement Systems.47
Pension Treatment
The City’s Plan of Adjustment proposes to “freeze” the accruing of pension
benefits under the terms of the City’s legacy pension plans and, effective June 30,
2014, institute restructured, distinct pension plans for the City’s active employees.
For the current employees, their future pensions will be a combination of that which
was accrued under the legacy plan through June 30, 2014, and after that date, what
will be accrued under the new revised plan as detailed below. For the City’s retirees,
47 Declaration of Charles M. Moore in Support of Detroit, Michigan’s Statement of
Qualifications Pursuant to Section 109(c) of the Bankruptcy Code; Docket No. 13;
Page 10

130
depending on whether they are members of PFRS or GRS, the POA proposes to
modify their accrued benefits under the legacy pension plans via reductions in gross
pensions, cost of living adjustments, or reductions in investment earnings in the
Annuity Savings Program.
Active City Employees
The Plan of Adjustment proposes a “hybrid” pension plan for the City’s active
employees for their accrued employment time after June 30, 2014. The adjusted
pension plan – for both PFRS and GRS – endeavors to combine the features of a
fixed contribution plan with the estimated investment performance of a fixed benefit
plan. The City and its actuaries constructed this hybrid plan to generate accrued
pension payments to its active employees upon retirement commensurate with a
6.75% estimated annual investment return.
For active PFRS employees, the updated pension formula will be equivalent
to their Final Average Compensation (“FAC”) – defined as the average base
compensation (excluding overtime, sick leave, longevity, etc. over the last ten
consecutive years) times years of service times 2.0%. For example, a theoretical
PFRS employee whose FAC was $40,000 with 25 years of experience would accrue
an annual pension of $20,000 ($40,000 x 25 x 2.0%). This calculation represents

131
the defined benefit portion of the new hybrid plan. The defined contribution portion
of the new plan incorporates an annual 12.25% contribution from the City of
employees’ base compensation and requires an employee contribution of 6%, if the
employee was hired before July 1, 2014, or 8% if hired after that date. In addition,
PFRS employees will be eligible for retirement at ages 50-52, depending on their
rank, with twenty-five years of service.
The revised GRS pension plan for active employees is similar to the PFRS
plan, albeit adjusted for Social Security (GRS pensioners are eligible for Social
Security in contrast to PFRS pensioners). The updated pension formula will be
equivalent to FAC over the last ten consecutive years times years of service times
1.5%. For example, a theoretical GRS employee whose FAC was $40,000 with 30
years of experience would accrue an annual pension of $18,000 ($40,000 x 30 x
1.5%). The City will contribute 5.75% of the employee’s base compensation
annually, while the employee will contribute 4%. In addition, GRS employees will
be eligible for retirement at age 55 with thirty years of service.

132
Proposed POA Restructured Terms
The fundamental amendments to the future pension plans lend themselves
favorably to the POA’s feasibility. Redefining base compensation as an average of
the last ten years’ pay as opposed to last three, eliminating non-base compensation
such as overtime and sick leave from the calculation, reducing the estimated rate of
return, and incorporating a defined employee contribution all contribute to the
increased likelihood that the City can meet the requirements of the new pension plan.
A concern remains, though, that embedded within the “hybrid” nature of this pension
plan, is the concept that a fixed contribution will, over time, produce the required,
fixed benefit. Pension plans with fixed contributions are generally just that --
defined contribution plans, not defined benefit plans. To the degree that the actual
investment return underperforms the targeted levels or the employee population
exhibits life expectancies in excess of the actuarial assumptions, the City has the
potential to again be saddled with an underfunded pension plan.
PFRS GRS
Pension Formula FAC x # of years x 2.0% FAC x # of years x 1.5%
Investment Return 6.75% 6.75%
ER Contribution 11-12% of base compensation 5% of base compensation
EE Contribution Hired before 7/1/14: 6%; after 7/1/14: 8% 4% of base compensation
Retirement Age Age 50-52 with 25 years experience Age 55 with 30 years experience
COLA Eligibility 0-1% compounded, variable Variable after 4 years and 100% funded
Annuity Savings Fund n/a Interested credit at actual return (0-5%)
Theoretical Annual Pension
($40k FAC with 25/30 years experience) $20,000 = $40,000 x 25 x 2.0% $18,000 = $40,000 x 30 x 1.5%

133
Current Retirees
The combined UAAL for both Retirement Systems was approximately $3.5
billion as of June 30, 2013. The City’s Plan of Adjustment, for the current retirees’
pension plan, establishes targeted funding rates by the end of fiscal year 2023 for
each Retirement System, specifically 75% for PFRS and 70% for GRS, based upon
a heavily-negotiated 6.75% assumed investment rate of return. While I assume this
investment rate of return as a “given” in all pension analyses to follow, further
discussion with regards to the appropriateness of this assumed investment rate of
return, and more particularly, its use as the assumed liability discount rate, is detailed
below. These targeted funding levels, combined with the proposed benefit
reductions for each pension plan, dictate the required cash contributions to the
Retirement Systems during the period ending June 30, 2023. The POA proposes
that the City will amortize the remaining UAAL for each Retirement System – as of
June 30, 2023 – over the following thirty-year timeframe.
The following graph illustrates, per the City’s actuary – Milliman, Inc. – the
estimated funding levels for PFRS and GRS at ten-year intervals during the period
FY2014-205348. Based on the City’s actuarial tables, the POA projections assume
48 Both PFRS and GRS plans are forecasted to initially have decreasing funding
levels; PFRS is forecasted to decrease from 87% in FY2015 to 78% in 2023; GRS
is estimated to decrease from 74% in FY2015 to 65% in FY2043
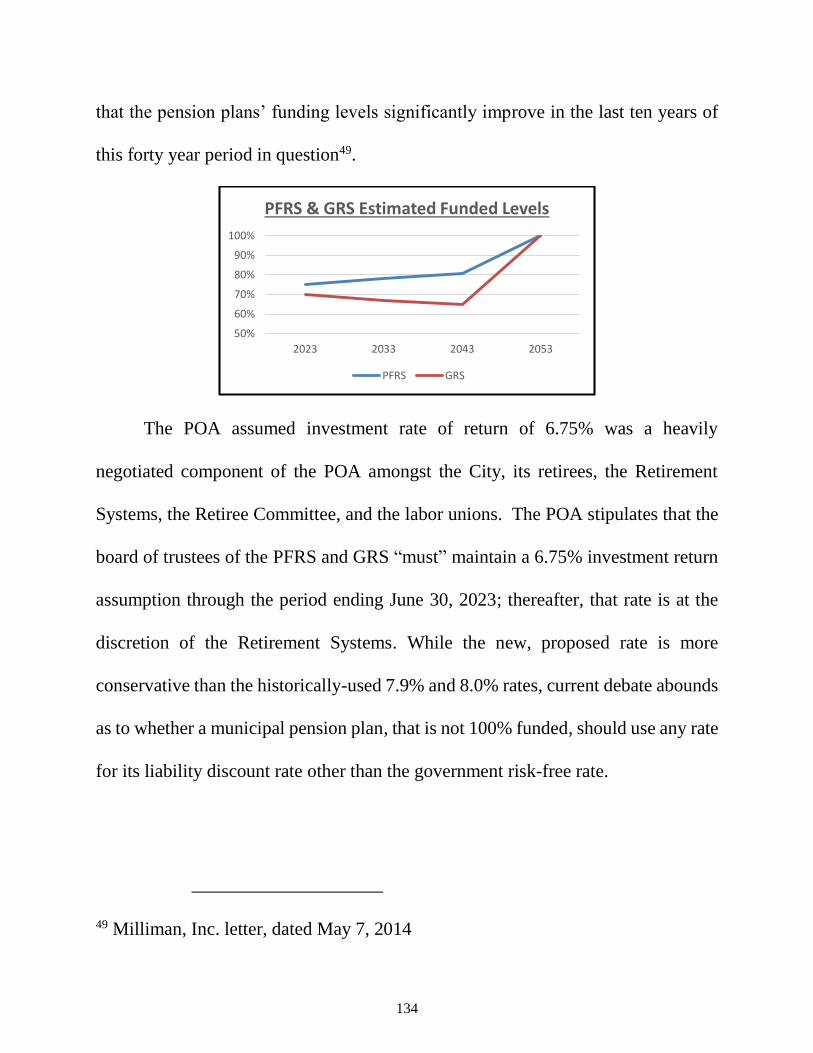
134
that the pension plans’ funding levels significantly improve in the last ten years of
this forty year period in question49.
The POA assumed investment rate of return of 6.75% was a heavily
negotiated component of the POA amongst the City, its retirees, the Retirement
Systems, the Retiree Committee, and the labor unions. The POA stipulates that the
board of trustees of the PFRS and GRS “must” maintain a 6.75% investment return
assumption through the period ending June 30, 2023; thereafter, that rate is at the
discretion of the Retirement Systems. While the new, proposed rate is more
conservative than the historically-used 7.9% and 8.0% rates, current debate abounds
as to whether a municipal pension plan, that is not 100% funded, should use any rate
for its liability discount rate other than the government risk-free rate.
49 Milliman, Inc. letter, dated May 7, 2014
50%
60%
70%
80%
90%
100%
2023 2033 2043 2053
PFRS & GRS Estimated Funded Levels
PFRS GRS

135
The following table illustrates where the City’s proposed 6.75% investment
rate compares to other comparable municipal pension plan assumptions50:
Pension Funding
In an effort to partially alleviate the City of Detroit’s liquidity concerns and
to fund some portion of the proposed RRIs in the first ten years, the Plan of
Adjustment incorporates dedicated external funding for the Retirement Systems
aimed at reducing the respective UAALs, portions of which the receipt is predicated
upon Classes 10 (PFRS) and 11 (GRS) voting to accept the Plan. The following
analyses illustrate the POA’s proposed funding sources for the respective Retirement
Systems over the 2014-2053 timeframe encompassed in the POA’s 40 Yr Plan.
Plan of Adjustment – Proposed PFRS Contributions – FY2014-2053
50 NASRA Issue Brief: “Public Pension Plan Investment Return Assumptions”;
April 2014
City of Detroit 6.75%
Connecticut Teachers 8.50%
Houston Firefighters 8.50%
Ohio Police & Fire 8.25%
Ohio PERS 8.00%
Michigan Municipal/SERS/Public Schools 8.00%
U.S. National Average 7.72%
CALPERS 7.50%
Indiana PERF/Teachers 6.75%
DC Police & Fire/Teachers 6.50%
Public Pensions - Assumed Investment Returns - Dec 2013

136
Plan of Adjustment – Proposed GRS Contributions – FY2014-2053
In order of magnitude, the City-specified contributions in the 2nd, 3rd, and 4th
decades reflect the estimated 30-year amortization payments on the respective plans’
UAALs at June 2023. The DWSD is expected to contribute to GRS roughly $428
million from FY2015-2023, constituting DWSD’s allocable share of the remaining
GRS UAAL, after considering the pension modifications proposed in the POA. The
State of Michigan has committed to contribute the present value of $350 million,
approximately $194 million51, for the benefit of pensioners. The State’s
contribution, signed into law by Governor Snyder on June 20, 2014, requires the
approval of Classes 10 and 11, requires support from the Retirement Systems,
51 The $350 million contribution is discounted at the 6.75% rate.
($ Millions) 2014 - 2024 - 2034 - 2044 -
2023 2033 2043 2053
City-specified Contributions
State of Michigan 96$ -$ -$ -$
Foundations (DIA Settlement) 165$ 201$ -$ -$
Other/City GF -$ 416$ 465$ 311$
Total 261$ 618$ 465$ 311$
($ Millions) 2014 - 2024 - 2034 - 2044 -
2023 2033 2043 2053
City-specified Contributions
DWSD 429$ -$ -$ -$
UTGO 32$ -$ -$ -$
State of Michigan 99$ -$ -$ -$
DIA (DIA Settlement) 45$ 55$ -$ -$
Other/City GF 115$ 575$ 474$ 318$
Total 719$ 630$ 474$ 318$

137
cessation of all bankruptcy-related litigation, and the full commitment of other
external financing sources dedicated to the pension plans.
In addition to the identified pension funding sources highlighted above, the
POA assumes implementation of the DIA Settlement, in which the City, DIA, and
certain charitable foundations agree to irrevocably transfer the DIA art collection to
the DIA Corporation. The art will be held in perpetual charitable trust within
Detroit’s city limits, in exchange for future payments of $366 million, pledged by
the charitable foundations, and a commitment from the DIA Corporation to raise
$100 million. Both DIA Settlement commitments are designated to be paid into the
pension plans over the next twenty years.
The following tables illustrate the proposed funding contributions into PFRS
and GRS for the fiscal years 2014-2023:
Plan of Adjustment – Proposed PFRS Contributions – FY2014-2023
Plan of Adjustment – Proposed GRS Contributions – FY2014-2023
10 Year
Fiscal Year 2014 2015 2016 2017 2018 2019 2020 2021 2022 2023 Total
City-specified Contributions
State -$ 96.0$ -$ -$ -$ -$ -$ -$ -$ -$ 96.0$
Foundations -$ 18.3$ 18.3$ 18.3$ 18.3$ 18.3$ 18.3$ 18.3$ 18.3$ 18.3$ 164.7$
Other -$ -$ -$ -$ -$ -$ -$ -$ -$ -$ -$
Total -$ 114.3$ 18.3$ 18.3$ 18.3$ 18.3$ 18.3$ 18.3$ 18.3$ 18.3$ 260.7$
10 Year
Fiscal Year 2014 2015 2016 2017 2018 2019 2020 2021 2022 2023 Total
City-specified Contributions
DWSD -$ 65.4$ 45.4$ 45.4$ 45.4$ 45.4$ 45.4$ 45.4$ 45.4$ 45.4$ 428.6$
UTGO -$ 4.4$ 4.0$ 4.0$ 3.9$ 3.7$ 3.7$ 3.6$ 2.3$ 2.0$ 31.6$
State -$ 98.8$ -$ -$ -$ -$ -$ -$ -$ -$ 98.8$
DIA -$ 5.0$ 5.0$ 5.0$ 5.0$ 5.0$ 5.0$ 5.0$ 5.0$ 5.0$ 45.0$
Other/City GF -$ 14.6$ 22.5$ 22.5$ 22.5$ 22.5$ 2.5$ 2.5$ 2.5$ 2.5$ 114.6$
Total -$ 188.2$ 76.9$ 76.9$ 76.8$ 76.6$ 56.6$ 56.5$ 55.2$ 54.9$ 718.6$
138
Plan of Adjustment – PFRS (Class 10)
The POA proposes two alternative restructuring scenarios of the PFRS
pension, with the respective depth of the assumed pension cuts being dependent on
whether both Classes 10 and 11 approve the Plan of Adjustment.
PFRS – Scenario A
In the event that both Classes 10 and 11 vote for the POA, with an assumed
investment return of 6.75% and a targeted funding rate of 75% in 2023, the POA
proposes that PFRS pensioners will receive 100% of their current/accrued pension,
but will have their lifetime Cost of Living Adjustments (“COLAs”) reduced by 55%.
With COLAs estimated to represent approximately 18% of the total PFRS liabilities,
the proposed 55% COLA elimination translates into a 9.9% reduction in estimated
PFRS liabilities.
PFRS – Scenario B

139
If either Classes 10 or 11 vote against the POA, and maintaining the assumed
investment return of 6.75% and a targeted funding rate of 75% in 2023, PFRS
pensioners will still receive 100% of their current/accrued pension, but their lifetime
COLAs will be completely eliminated.
Police and Fire Retirement Systems of the City of Detroit
Projection of Liabilities and Assets
Scenario A
Assuming 55% COLA Reduction, 75% Targeted Funded Status,
and 6.75% Investment Return52
52 Milliman, Inc. letter, dated April 23, 2014
10 Year
Fiscal Year 2014 2015 2016 2017 2018 2019 2020 2021 2022 2023 Total
City-specified Contributions -$ 114.3$ 18.3$ 18.3$ 18.3$ 18.3$ 18.3$ 18.3$ 18.3$ 18.3$ 260.7$
Market Value of Assets 3,071$ 3,096$ 3,024$ 2,946$ 2,863$ 2,775$ 2,681$ 2,579$ 2,470$ 2,354$
Actuarial Accrued Liability 3,624$ 3,573$ 3,521$ 3,464$ 3,404$ 3,340$ 3,271$ 3,198$ 3,118$ 3,035$
Unfunded Liability (553)$ (477)$ (497)$ (518)$ (541)$ (565)$ (590)$ (619)$ (648)$ (681)$
Funded Ratio - BOY 86.6% 85.9% 85.0% 84.1% 83.1% 82.0% 80.6% 79.2% 77.6%
Expected FY Benefit Payments (285)$ (283)$ (284)$ (284)$ (283)$ (283)$ (284)$ (285)$ (283)$ (2,554)$
Expected FY Admin Expenses (7)$ (7)$ (7)$ (7)$ (7)$ (7)$ (8)$ (8)$ (8)$ (66)$
Expected FY Net Investment Return 201$ 200$ 195$ 190$ 184$ 178$ 172$ 165$ 157$ 1,642$

140
Plan of Adjustment – GRS (Class 11)
Similar to Class 10, the POA proposes two alternative restructuring scenarios
of the GRS pension, with the respective depth of the assumed pension cuts being
dependent on whether both Classes 10 and 11 approve the Plan of Adjustment.
GRS – Scenario A
In the event that both Classes 10 and 11 vote for the POA, with an assumed
investment return of 6.75% and a targeted funding rate of 70% in 2023, GRS
pensioners will receive 95.5% of their current/accrued pension, will have their
lifetime COLAs eliminated, and pensions will be subjected to a maximum of a
15.5% recoupment of their Annuity Savings Fund excess return53. The combined
impact of these proposed changes represents an approximate 27% reduction in
53 Not all GRS retirees will be subject to ASF recoupment; only those retirees who
ASF annual return, for FY2004-2013, was greater than the plan assets’ actual return
up to a maximum recoupment of 15.5% of the pensioner’s peak ASF balance
10 Year
Fiscal Year 2014 2015 2016 2017 2018 2019 2020 2021 2022 2023 Total
Market Value of Assets - Roll Forward
Market Value of Assets - BOY 3,071$ 3,094$ 3,023$ 2,945$ 2,862$ 2,775$ 2,681$ 2,579$ 2,469$ 3,071$
City-specified Contributions 114$ 18$ 18$ 18$ 18$ 18$ 18$ 18$ 18$ 261$
Expected FY Net Investment Return 201$ 200$ 195$ 190$ 184$ 178$ 172$ 165$ 157$ 1,642$
Expected FY Benefit Payments (285)$ (283)$ (284)$ (284)$ (283)$ (283)$ (284)$ (285)$ (283)$ (2,554)$
Expected FY Admin Expenses (7)$ (7)$ (7)$ (7)$ (7)$ (7)$ (8)$ (8)$ (8)$ (66)$
Market Value of Assets - EOY 3,071$ 3,094$ 3,023$ 2,945$ 2,862$ 2,775$ 2,681$ 2,579$ 2,469$ 2,354$ 2,354$
Actuarial Accrued Liability - Roll Forward
Actuarial Accrued Liability - BOY 3,624$ 3,573$ 3,521$ 3,464$ 3,404$ 3,340$ 3,271$ 3,198$ 3,118$ 3,624$
Expected FY Benefit Payments (285)$ (283)$ (284)$ (284)$ (283)$ (283)$ (284)$ (285)$ (283)$ (2,554)$
Add'l Accrued Liability 234$ 231$ 227$ 224$ 219$ 214$ 211$ 205$ 200$ 1,965$
Actuarial Accrued Liability - EOY 3,624$ 3,573$ 3,521$ 3,464$ 3,404$ 3,340$ 3,271$ 3,198$ 3,118$ 3,035$ 3,035$

141
GRS’s estimated liabilities comprised of 4.5% from reduced pensions, roughly 9%
from the Annuity Savings Fund recoupment, and 14% from the eliminated COLAs.
GRS – Scenario B
If either Classes 10 or 11 vote against the POA, and maintaining the assumed
investment return of 6.75% and a targeted funding rate of 70% in 2023, GRS
pensioners will receive 73% of their current/accrued pension, will have their lifetime
COLAs eliminated, and the ASF recoupment will vary from 0.01% to 100% of a
retiree’s pension, based upon the excess amount of the pension. The combined
impact of these proposed changes represents an approximate 50% in GRS’s
estimated liabilities comprised of 27% from reduced pensions, roughly 9% from the
Annuity Savings Fund recoupment, and 14% from the eliminated COLAs.
General Retirement Systems of the City of Detroit
Projection of Liabilities and Assets
Scenario A
Assuming 4.5% Benefit Reduction, 100% COLA Reduction, 70% Funded
Status, Annuity Savings Fund Recoupment, and 6.75% Investment Return54
54 Milliman, Inc. letter, dated April 25, 2014

142
Pension Restoration
The Plan of Adjustment incorporates, for both PFRS and GRS, the potential
for previously-reduced pension benefits to be restored if the funding levels of the
respective Retirement Systems improve to agreed-upon restoration levels at
designated timeframes, the fiscal years ending 2023, 2033, and 2043. These pension
restoration payments are designed to be variable, in that, they are only distributed to
10 Year
Fiscal Year 2014 2015 2016 2017 2018 2019 2020 2021 2022 2023 Total
City-specified Contributions -$ 196.2$ 65.3$ 65.3$ 65.3$ 65.3$ 65.3$ 65.3$ 65.3$ 65.3$ 718.6$
Market Value of Assets 2,027$ 2,106$ 2,057$ 2,005$ 1,951$ 1,893$ 1,831$ 1,764$ 1,695$ 1,622$
Actuarial Accrued Liability 2,921$ 2,866$ 2,809$ 2,751$ 2,688$ 2,622$ 2,552$ 2,477$ 2,399$ 2,317$
Unfunded Liability (894)$ (760)$ (752)$ (746)$ (737)$ (729)$ (721)$ (713)$ (704)$ (695)$
Funded Ratio 73.5% 73.2% 72.9% 72.6% 72.2% 71.7% 71.2% 70.7% 70.0%
Expected FY Benefit Payments (243)$ (241)$ (239)$ (239)$ (239)$ (238)$ (238)$ (237)$ (235)$ (2,149)$
Expected FY Admin Expenses (9)$ (9)$ (10)$ (10)$ (10)$ (10)$ (11)$ (11)$ (11)$ (91)$
Expected FY Net Investment Return 135$ 136$ 133$ 129$ 125$ 122$ 117$ 113$ 108$ 1,118$
10 Year
Fiscal Year 2014 2015 2016 2017 2018 2019 2020 2021 2022 2023 Total
Market Value of Assets - Roll Forward
Market Value of Assets - BOY 2,027$ 2,106$ 2,058$ 2,007$ 1,952$ 1,893$ 1,833$ 1,766$ 1,696$ 2,027$
City-specified Contributions 196$ 65$ 65$ 65$ 65$ 65$ 65$ 65$ 65$ 719$
Expected FY Net Investment Return 135$ 136$ 133$ 129$ 125$ 122$ 117$ 113$ 108$ 1,118$
Expected FY Benefit Payments (243)$ (241)$ (239)$ (239)$ (239)$ (238)$ (238)$ (237)$ (235)$ (2,149)$
Expected FY Admin Expenses (9)$ (9)$ (10)$ (10)$ (10)$ (10)$ (11)$ (11)$ (11)$ (91)$
Market Value of Assets - EOY 2,027$ 2,106$ 2,058$ 2,007$ 1,952$ 1,893$ 1,833$ 1,766$ 1,696$ 1,624$ 1,624$
Actuarial Accrued Liability - Roll Forward
Actuarial Accrued Liability - BOY 2,921$ 2,866$ 2,809$ 2,751$ 2,688$ 2,622$ 2,552$ 2,477$ 2,399$ 2,921$
Expected FY Benefit Payments (243)$ (241)$ (239)$ (239)$ (239)$ (238)$ (238)$ (237)$ (235)$ (2,149)$
Add'l Accrued Liability 188$ 184$ 181$ 176$ 173$ 168$ 163$ 159$ 153$ 1,545$
Actuarial Accrued Liability - EOY 2,921$ 2,866$ 2,809$ 2,751$ 2,688$ 2,622$ 2,552$ 2,477$ 2,399$ 2,317$ 2,317$
143
the pensioners if the investment performance of the pension plans is at least three
percentage points above the targeted funding levels.
The pension restoration thresholds, for both PFRS and GRS, are perpetually
three percentage points above each pension plan’s targeted funding level throughout
the FY2014-2053 time period. If the funding levels exceeds the plan’s restoration
targeted funding level, i.e. are more than 3 percentage points above the targeted
funding level, monies will be allocated to a “restoration reserve account”. Once the
restoration reserve account equals at least 10% of the lifetime value of the
previously-reduced COLA payments, restoration payments will commence in the
following year. According to the POA, restoration payments for PFRS will be
conditional until 2023, and until 2028 for GRS. If, as a result of the funds’ assets
subsequently underperforming the targeted investment levels, which would mean
that the returns fall below the 3 percentage point threshold for restoration payments,
COLA restoration payments are immediately suspended. Beginning in FY2023 for
PFRS and FY2028 for GRS, to the degree the plans’ funding levels are in excess of
the restoration targeted levels, those specific restoration payments become fixed, or
“guaranteed”, going forward.
It should be clearly understood, in FY2023 (FY2028 for GRS), FY2033 and
FY2043, the maximum funded level of the GRS and PFRS is the amount shown in
the table below. As a result of the negotiations with the parties, the provisions of the

144
POA relative to the pension settlements ensure that the pension plans at these
benchmark dates will never be funded above the restoration funding rate for either
the PFRS or GRS plans. If the funding level is above this targeted amount at the
benchmark dates, the excess will be swept to a permanent restoration fund such that
the funding level will be reduced to the amount shown. In the event that the funding
levels at these benchmark dates are below these levels, the City is responsible for
this unfunded amount and must fund it in the future. Therefore, as the City considers
the average rate of return, it must keep in mind it is “giving away” some of the
upside, yet retaining all of the downside.
The following table summarizes both PFRS and GRS’s targeted and pension
restoration funding levels for the 2014-2043 timeframe (pension restoration
payments cease in 2043)55.
Impact on Feasibility
55 Multiple Milliman, Inc. Pension reports; multiple Phoenix discussions with Jones
Day attorneys re: Pension plans
Funding Restoration Funding Restoration
Target Target Target Target
2014-2023 75% 78% 70% 73%
2024-2033 81% 84% 70% 73%
2034-2043 84% 87% 70% 73%
GRSPFRS

145
There is considerable debate regarding the selection of the discount rate for
calculating liabilities in government sponsored defined benefit (DB) plans. At one
end of the debate is the thought that the discount rate of liabilities should equal the
expected return on pension assets; at the other end is the thought the liabilities have
a very strong contractual and legal requirement and therefore represent a certainty
of payment and therefore should be discounted at, or near, the risk free rate. This
seemingly academic question has real world consequences when viewing Detroit’s
POA and its perceived feasibility.
The Nelson A. Rockefeller Institute of Government’s recent analysis on this
issues - The Blinken Report - dated January 2014, notes56:
The problem begins with mismeasurement of liabilities and the cost of
funding them securely, for financial reporting purposes. The proper way
to value future cash flows such as pension benefit payments is with
discount rates that reflect the risk of the payments. This is separate from
the question of the rate pension funds will earn on their investments.
This bears repeating: The proper rate for valuing pension liabilities
on financial statements is separate from the question of what pension
funds will earn on their investments. Different rates may be
appropriate for valuing liabilities than for assumed investment returns
— and we recommend, later, that different rates be used. The major
56 The Blinken Report- Strengthening the Security of Public Sector Defined Benefit
Plans, dated January 2014. Donald J Boyd and Peter J Kiernan. Expert’s Note: In
the preface of this Report special note is made of the contribution to the analysis and
work by Dick Ravitch. Mr. Ravitch is Judge Rhodes’ non-testifying consultant in
this chapter 9.

146
significance of valuing liabilities incorrectly is that it leads to
inadequate funding policies, and encourages the mistaken belief that
benefits can be greater, services can be greater, or taxes lower while
still funding benefits securely. (Blinken Report Emphasis)
Because pensions are promises that should be kept, and have strong
legal protections, they should be valued using discount rates that reflect
the riskiness of expected benefit payments. Unfortunately, the
longstanding practice for public pension plans in the United States,
developed before modern financial theory, is to use the expected return
on pension fund assets to value liabilities, even though there is no
logical connection between how much is owed to workers and what
assets will earn. This practice is not used by public pension plans in
other countries, or by private plans in the United States, or by
economists or financial analysts valuing other cash flows. Our nation’s
public pension plans stand virtually alone, and recent accounting rule
changes by the Governmental Accounting Standards Board (GASB)
have not addressed this properly. Rates that reflect the expected risk of
benefit payments ordinarily are much lower than the rates public
pension funds use to value liabilities, and as a result, public pension
liabilities are underestimated by at least $1-2 trillion, and the annual
costs of funding them securely are underestimated by at least $100-200
billion.
The City of Detroit, in its POA, has used a rate of 6.75% to discount the
liabilities of the pension plans. This rate is lower than the historical rates that PFRS
and GRS have previously used and lower than recent investment returns, although
recent market returns are heavily impacted by the recovery from the Great
Recession. It is also low relative to peers (see previous chart on comparison of
Assumed Investment Returns of comparable public plans). In fact, there are few
other major government sponsored plans that use a lower rate to discount the
liabilities in their pension plans. On the surface, this appears to be a conservative

147
assumption. However, I am not convinced that the City appreciates the opportunity
it has to provide stewardship in this area. Highlighting that the City’s assumptions
are low relative to history, a history that got them to this place, and low relative to
their peers - peers who collectively may be underfunded by $2 trillion or more, is
not much consolation.57
We believe that the selection of a discount rate has relevance as to the
feasibility of the Detroit POA, in that, in the future without the benefit to change
pension obligations, pension funding requirements become a de facto first priority
on cash flows. This results in crowding out other cash flow priorities. The City must
be continually be mindful that a root cause of the financial troubles it now
experiences is the failure to properly address future pension obligations. Below we
address two main concerns regarding the selection of the discount rate for valuing
future liabilities in the Plan.
The investment return at 6.75% appears to be based on future investment
returns. This rate clearly reflects a rate above the current risk free rate of return and
therefore indicates a level of assumed volatility and risk. The argument for using a
discount rate that is related to investment returns typically states that using a rate
57 Blinken Executive Summary pg. vii.

148
that is higher than the risk free rate is acceptable due to the long “runway” of a
municipal pension. The argument goes: a municipal entity differs from an
individual in that, as an individual ages, they typically must moderate their
investment behavior towards lower risk investments due to shortening time horizons
and, therefore, often lock in losses in down markets. The argument continues: the
long time horizon of a municipal pension plan allows it to avoid this phenomenon.
Of course, pension plans are not able to defer plan payments during down markets,
and therefore, in significant down markets, the loss of principal as a result of making
payments to pensioners, without offsetting investment returns, can result in a plan
that “locks in” losses. These “locked in” losses create underfunding.
Further, the current POA contemplates Pension Restoration provisions. These
provisions essentially allow pension plan beneficiaries to have some opportunity for
restoration of lost pension benefits. Post confirmation, until June 2023 for PFRS
and June 2028 for GRS, if the pension plans exceed 78% for PFRS or 73% for GRS,
despite still being underfunded nearly 22% and 27%, respectively, additional funds
can be set aside into a pension restoration fund. The funding levels and the ability
of beneficiaries to receive restoration benefits are limited to actuarial and investment
return adjustments and not to additional city contributions. However, under this
plan, the City can be underfunded in FY2043 and still be in the mode of restoring
pension benefits to then existing retirees. Based on the settlement terms and the

149
assumptions made, there does not appear to be recognition that a pension plan,
someday, will need to be 100% funded. The City appears to adopt an institutional
philosophy of underfunding.
On top of the conceptual argument that funding targets should be set at no less
than 100%, before additional commitments are made to increase benefits, a larger
concern exists. The City’s assumption of a 6.75% rate of return implicitly requires
the City to accept risk and volatility. Volatility is, of course, a positive and a negative
force. At times, the City should be expected to achieve returns above 6.75% and, at
times, the City should expect returns below this level. Over the past 10 years, the
Retirement Systems have seen significant variations in their investment returns both
above and below the average return. Again, this is the argument for municipal
pensions to use investment returns because over the long term, there should be
smoothing. Because the City’s defined benefit plans are essentially in runoff, they
will inevitably experience declining asset levels. In this environment of declining
assets and volatility, returns over time are not equally weighted.
Thus, order matters when returns are volatile. It is much better to receive high
returns early and low returns later, even though both streams provide the same
simple average growth rate. Examples of the impact of timing on returns in a given
10-year period are detailed in the Sensitivity section below. This is not a trivial

150
issue, even though it is quite technical. As pension funds mature and net outflows
increase, asset values will be more volatile and more susceptible to the order in
which returns occur. In an environment in which expected returns are low in the
short term — as the current low-interest-rate, low-inflation environment may be —
funds cannot simply balance low returns in the short term with high returns later;
they will need much higher returns later because investible assets will be lower than
they otherwise would have been.58
As example from the Blinken report: Blinken Report Footnote #96
Consider a pension fund that has net outflows equal to 4.5 percent of
assets, with benefits and contributions both growing 7 percent annually
(roughly consistent with recent experience). If it earns 4 percent on
investments for five years, followed by 12 percent for five years, its
assets at the end of ten years will be nearly 13 percent lower than if the
returns come in the opposite order, even though annual average return
is 7.9 percent either way. [(1.04^10 x 1.12^10)-1 = (1.12^10 x
1.04^10)-1 = 7.93%.] If the fund earns 4 percent for ten years followed
by ten years of 12 percent, its assets after twenty years would be 90
percent less than if returns had come in the opposite order. These
calculations assume no change in contributions to amortize asset
shortfalls in the early years. Amortization would narrow the difference
between the two sequences of returns.
58 Blinken pg 25.

151
Further exacerbating this issue, the City is agreeing to give up part, or maybe
all, of its upside investment returns by virtue of the pension restoration benefits, but
it is retaining all of the downside risk. If the funds’ assets participate in a bull market
in the first ten years of the POA, and the pension plans move to a funded level of
88%, the City would provide significant restoration benefits. If this bull market was
then followed by a five year bear market, all of the restoration benefits paid during
the bull market would serve to exacerbate the unfunded level of the pension plans
and the City could be responsible for considerable funding risk.
It appears that the combination of a need to continue to invest in assets with
risk and volatility in order to achieve investment returns and the restoration benefit
to the pensioners, even at a level of low plan funding, acts as a one sided collar.
That is, the City gives away much of the upside in investment earnings, while
retaining all of the downside investment risk.
Legality of POA’s Proposed Pension Cuts
Numerous parties in this bankruptcy, namely employees, retirees, Retirement
Systems, and certain labor unions, have argued that the City is not legally able to
152
impair accrued pension benefits as they are protected under Article IX, Section 24
of the Michigan State Constitution of 1963. These same groups were granted
permission to appeal the Bankruptcy Court’s eligibility ruling to the U.S. Court of
Appeals for the Sixth Circuit. To the degree that these parties are successful in their
appeal of the Bankruptcy Court’s eligibility ruling, the City’s chapter 9 could be
dismissed or may be unable to effectuate reductions in accrued vested pension
benefits.
Sensitivity Analysis
The Society of Actuaries issued a Report of the Blue Ribbon Panel on Public
Pension Funding in February 2014. The Blue Ribbon Panel recommended stress
tests measuring the effect of investment returns over a 20-year period that are three
percentage points above and below those used in calculating standardized plan
contributions59. The panel believes that +/- 3% points represents “plausible stresses”
based on its review of prior market returns60.
59 The Society of Actuaries “Report of the Blue Ribbon Panel on Public Pension Plan
Funding”; February 2014
60 The Society of Actuaries “Report of the Blue Ribbon Panel on Public Pension Plan
Funding”; February 2014

153
In response to my request for a sensitivity analysis for the pension plans
assuming various average rates of return for the FY2014-2023 period and the
aforementioned scenarios of 1) a bear market 5-year period followed by a bull
market 5-year period and 2) a bull market 5-year period followed by a bear market
5-year period, the City’s actuary has analyzed the PFRS plan.
As illustrated below, if the PFRS plan averages a 6% rate of return (75 basis
points lower than the assumed rate of return) over the nine years ending June 2023,
the plan is forecasted to be only 70% funded in June 2023, resulting in an additional
$236 million of unfunded liability versus the POA projections. That unfunded
variance expands to $527 million if the PFRS plan averages a 5% rate of return
during this time period. Finally, if PFRS is negatively impacted by a bear
market/bull market cycle (as opposed to the inverse) with five years averaging 0%
followed by five years averaging 10%, the pension plan would have $342 million
more in unfunded liabilities during the 10-year period in question.
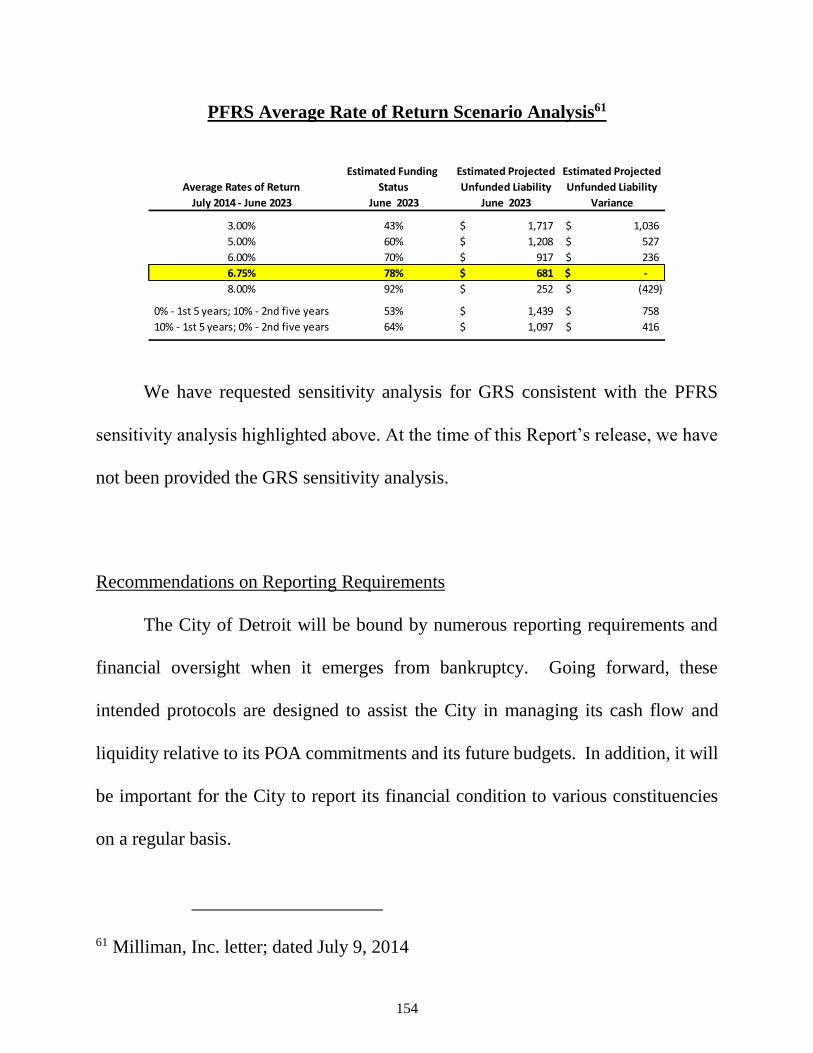
154
PFRS Average Rate of Return Scenario Analysis61
We have requested sensitivity analysis for GRS consistent with the PFRS
sensitivity analysis highlighted above. At the time of this Report’s release, we have
not been provided the GRS sensitivity analysis.
Recommendations on Reporting Requirements
The City of Detroit will be bound by numerous reporting requirements and
financial oversight when it emerges from bankruptcy. Going forward, these
intended protocols are designed to assist the City in managing its cash flow and
liquidity relative to its POA commitments and its future budgets. In addition, it will
be important for the City to report its financial condition to various constituencies
on a regular basis.
61 Milliman, Inc. letter; dated July 9, 2014
Estimated Funding Estimated Projected Estimated Projected
Average Rates of Return Status Unfunded Liability Unfunded Liability
July 2014 - June 2023 June 2023 June 2023 Variance
3.00% 43% 1,717$ 1,036$
5.00% 60% 1,208$ 527$
6.00% 70% 917$ 236$
6.75% 78% 681$ -$
8.00% 92% 252$ (429)$
0% - 1st 5 years; 10% - 2nd five years 53% 1,439$ 758$
10% - 1st 5 years; 0% - 2nd five years 64% 1,097$ 416$
155
Timely, accurate financial reporting relating to the City’s pension plans will
be an essential tool as the retirement systems manage the plans’ assets and liabilities
and make critical decisions regarding future estimated rates of returns and annual
funding requirements. At the end of June 2012, the Governmental Accounting
Standards Board (“GASB”) issued standards intended to reform how state and local
governments report the financial status of their pension funds and how they finance
them. GASB 67 defines how government pension funds must report finances related
to pension activities. GASB 68 pertains to state and local government reporting of
activities associated with pension finances.62 Both GASB standards are effective in
FY2015 and will enhance the City’s financial disclosures relating to its pension
plans.
As the asset features and credit quality of the pension plans’ investments
evolve over time, so, too, will the reporting corresponding to those investments. The
City’s pension plans should establish a baseline level of financial reporting that will
be accurate and illustrative of the condition of the pension plans at any point in time.
The Society of Actuaries’ report recommended that actuarial funding reports should
contain, for at least the previous ten years, information presenting the relationship
of benefit payments, funding liabilities, and assets to payroll; the relationship
62 Governmental Accounting Standards Board
156
between the recommended contribution to payroll and to the sponsor’s budget or
revenue source; and the ratio of contributions made to the total recommended
contribution.63
Additionally, to understand current risk levels, three benchmarks should be
disclosed:
1) The expected standard deviation of investment returns of the asset portfolio
on the report date;
2) The plan liability and normal cost calculated at the risk-free rate, which
estimates the investment risk being taken in the investment earnings
assumption; and
3) A standardized plan contribution for assessing the aggregate risks to the
adequacy of the recommended contribution.64
Further, we recommend that the City disclose the gross liability and the UAAL
by year on an undiscounted basis. This will allow third parties a better understanding
of the changes in the liabilities from year to year.
63 The Society of Actuaries “Report of the Blue Ribbon Panel on Public Pension Plan
Funding”; February 2014
64 The Society of Actuaries “Report of the Blue Ribbon Panel on Public Pension Plan
Funding”; February 2014

157
Section K - Human Capital and Leadership
Detroit’s fifty year decline was caused by changing demographics, economics
and the failure of elected officials to respond effectively. The downward spiral
finally resulted in the City filing for Bankruptcy. Beyond the financial crises, the
City has suffered from a deterioration of the efficiency and effectiveness of its City’s
workforce, as measured by the cost of service delivery versus the benefit the citizens
received from those services.65 Inadequate investment in human capital and poor
leadership during the decline served to exacerbate the situation.
At its core, this chapter 9 is a fundamental change project. The City, through
the guidance of its bankruptcy advisors, has fundamentally changed the City’s
balance sheet and reduced its long term obligations. The Emergency Manager has
begun the even harder task of reshaping the operations of the City for the benefit of
the taxpayers. The Mayor, and other elected and appointed officials, will need to
continue this part of the change project. Human capital and leadership are two of
65 Docket # 14, page 29 of 106, Memorandum in Support of Statement of
Qualifications Pursuant to Section 109 (c) of the Bankruptcy Code
158
the most important components to any successful restructuring66. I believe the
success, or failure, of Detroit’s revitalization will hinge on the people employed by
the City and the officials elected by the residents in the coming years. The skill
level, on average, of City workers is low and outdated. Civil service requirements
and historical collective bargaining agreements work against a merit or performance
based employment culture in most municipalities and Detroit is no exception. Lack
of even modest technology and up-to-date systems, as is the case with the City,
ensure that employees will not perform at competitive levels to their peers in the
private sector or even in municipalities that are efficient.
Impact on Feasibility
As I noted in my definition of feasibility, the second assessment prong of
feasibility is “will and skill”. Leadership, political and intestinal fortitude define
“will” and talent and training equate to “skill”.
For example, in order to arrest the downward trend of revenue, City
employees must do a better job of collecting the taxes and fees that are currently due
– that is skill. Better systems and more experienced management will be required
66 I have written on this topic previously. See American Bankruptcy Journal, March
2014, “The Missing Link to Successful Company Turnarounds – Balance Sheet
Management is Only Part of the Story”
159
to accomplish that goal. It was evident to me and my team that there are City
employees who are knowledgeable, have good ideas about improving the operations
and want to learn and advance. There are also employees who don’t grasp that their
job is to provide a service to the taxpayers versus the taxpayers owing them a job.
This is a cultural malady that will have to change if Detroit is to be successful.
Leadership that is focused on outcomes of service delivery and operating efficiency
will be required, as will standards for personal and departmental performance.
Current Workforce Issues
The City employs more than 9,000 people and as a result of the RRIs expects
add to almost 700 net new positions. After accounting for attrition, this is a
significant mobilization. Further, my discussions with the leaders in the City
indicate a universal understanding that increasing the average talent base of the
employees is a cornerstone for success of the Plan and the City. This topic was
acknowledged at the outset of the case and continues to present challenges to the
City’s management team. Throughout my team’s discussions with City leaders and
department managers, the issue of human resources has been a regular topic of
discussion.
Throughout our discussion in the finance and accounting functions it has been
noted:

160
“Many qualified and experienced employees have left their jobs over
concerns about the long term prospects of their positions; Difficulty in
replacing employees with qualified personnel because salary structure
is no longer reasonable and competitive. This weakness has been
partially mitigated by hiring employees outside the official system using
Professional Service Contracts (PSC’s), consultants and contractors.”
Exacerbating the problem of historic skill level are the changes made to
compensation prior to, and as a result of, the bankruptcy. Prior to the Bankruptcy,
“the City has also implemented a 10% reduction in the wages to majority
of the workforce in the addition to furlough days of 10% to a majority
of the non-uniform employees. Medical and prescription drug plan
designs have been changed to reduce the costs associated with
healthcare and increase the percentage of contributions from active
employees.” 67
The POA eliminates future accrual of the defined benefit retirement plan and
replaces with what is arguably a less generous hybrid pension plan. The Plan
eliminates certain OPEB benefits, specifically, post-retirement healthcare and
replaces with what is arguably a less generous VEBA plan.
Beth Niblock, the City’s CIO, noted this concern in her Expert Report,
“(a)ttracting and maintaining a highly skilled workforce is a challenging task,
67 Declaration of Gaurav Malhotra in Support of the City of Detroit, Michigan’s
Statement of Qualifications Pursuant to Section 109 (c) of the Bankruptcy Code

161
particularly given the current and proposed compensation rates set forth in the
Projections.”68
There is little doubt that total compensation includes not only direct pay, but
the benefits conferred to employees in the current time frame plus those that are
expected to be conferred to the employee in the future. Individuals may possess
differing views as to relative value of each category of pay; however, they do place
some value on the deferred benefits.69 With all of these changes to compensation, it
is unclear what the impact will be on retention and recruitment. While there are
studies to suggest, and perhaps some experience in Detroit to confirm, that the
elimination of post-retirement healthcare may offset the impact of the pension
changes as a retention tool. Current employees, when they retire, will not have the
benefit of receiving healthcare benefits prior to Medicare eligibility. Therefore,
employees may be more likely to stay in their positions with the City.
While the specific impact of the compensation changes on retention is
unknown at this time, the impact on current employees and future employees may
be different. For current City employees, the City has necessarily lowered the
68 Report of Beth Niblock, Chief Information Officer for the City of Detroit-Expert
report submitted in support of the City’s POA – page 15.
69Are Public Pensions Keeping up with the Times? Richard W. Johnson, Mathew
Chingos and Grover Whitehurst page 47.”

162
overall economic value of City employment and changed the perception of the long
term value in having worked for the City, once an employee leaves or retires. For
future employees the economic and long term value analysis will be based on the
individual’s perception of alternative employment opportunities. The City is
currently working with the consulting firm of Fox Lawson to complete a
compensation review so that the City may have more than anecdotal evidence as it
proceeds with the recruitment and staffing. We understand that the results of this
study are not available and therefore were not considered when the City developed
the POA projections.
In addition, the City has acknowledged the issue of skill development by
including in the RRIs significant funding for employee training. The City has
included an annual employee training budget of $2,000 for each non-uniformed
employee through 2017 and $1,500 per year thereafter. The total RRI allocation to
training over a 10 year period is $54.4 million. While no actual allocation of training
dollars has been made, I believe that this is a strong indicator of the City’s
commitment to helping its current employees develop the skills they need to
contribute to the success of the City and to maintain competitive skills within its
employee base.
Throughout our meetings with City leaders and the advisors to the City, it has
been noted that if compensation is a barrier to hiring the skilled talent required, the

163
City will likely adapt to this by hiring fewer but more skilled employees. I believe
this approach can partially mitigate feasibility concerns regarding the City’s ability
to implement the Plan. Presently, the City is squeezed from both sides of the labor
market: in order to do even the simplest routine task, the City has hired consultants
yet maintains full time employees who should be able to manage those tasks but are
not sufficiently trained to do so.
A significant challenge to acquiring the talent the City so desperately needs is
the state of the Human Resources department. The Human Resources department
is in need of an overhaul – recently, it has taken over six months to hire a new
employee for an approved opening. As a result, department heads “work around”
the department and find ways to recruit and hire employees more efficiently. The
Mayor is well aware of the need for leadership in this key area.
Given the large number of recruits envisioned in the POA, a new approach to
talent acquisition is needed. Consultants are in place to assess the skills needed to
revamp key departments such as accounting and IT and the current leadership of
those departments is experienced and capable. In fact, many of the Mayor’s direct
reports are experienced operational managers with successful employment histories.
Overhauling the human resource function will be critical to a successful
restructuring.
164
Leadership and Cultural Change
If the City is to counteract the vortex of underachievement that has defined
Detroit, City leadership must make a long term, concerted effort to maintain the
momentum needed to ensure effective City services. The Emergency Manager has
made progress on the macro changes required and I believe the Mayor is developing
a culture based on performance metrics and accountability and some of the status
quo is going by the wayside.
I have confidence in Mayor Duggan. My opinion of feasibility is favorably
influenced by my view of Mayor Duggan as a leader and an operational executive.
I am encouraged by the manner in which he leads many of the City’s departments
given the real power is still held by the Emergency Manager. The Mayor has created
simple metrics around which he can measure the performance of his department
heads daily and/or weekly. This is a commendable workaround as the accounting
and information systems, as noted elsewhere, are abysmal. While ultimately the
City will need to address the core reporting system, the use of this simplistic metrics
based approached is effective and understandable. When one is at the vortex of
underachievement, having a few very simple and actionable goals can make a huge
difference in the overall performance of the organizations. Having periodically
attended the Mayor’s Cabinet meetings, I know that if ambulance response times do
165
not decrease more rapidly, it will be evident to all and managers will be held
accountable; this level of accountability can change the City for the better.
In the long term, the City’s leadership is subject to the democratic process.
There is clearly risk that future elected leaders stray from principals in the POA, but
I am choosing to rely upon the combination of the electoral process and the oversight
function implemented as part of the Grand Bargain legislation to keep future City
leaders focused on strong stewardship.
Collective Bargaining Agreements
My team has not been privy to the negotiations between the City and its
unions, or the resulting term sheets. The City’s financial advisors have indicated
that the economic issues addressed in the collective bargaining agreements
(“CBAs”) negotiated during the bankruptcy have been appropriately included in the
POA projections. Based on discussions with long standing and former City officials
and employees, I believe the more significant workforce issues are centered on the
restrictive work rule provisions that have caused labor inefficiency, higher costs and
inability to change outdated processes. I do not know if, or to what extent, any of
these issues have been addressed in the recently negotiated CBAs. While I believe
that the Emergency Manager’s desire to negotiate 5 year contracts has been
beneficial in mitigating the risk associated with adverse arbitration awards in the

166
future, I remain concerned that the City has missed an opportunity to make long term
changes in its business processes and ability to manage through unforeseen events.
167
Section L - Blight
Detroit’s Blight History
The City of Detroit, due to its shrinking population70, depressed economy, and
sagging property values, has experienced a metastasizing urban blight condition over
the past several decades. Depending on which statistics are referenced, this City of
approximately 139 square miles contains roughly 380,000 land parcels, of which
84,000 parcels (or 22%) have been identified as currently exhibiting blight
characteristics or having indicators of future blight.71 These blighted parcels are
geographically disbursed throughout the City, resulting in a ripple effect throughout
most neighborhoods which further stretch the City’s limited resources. An
expanding blight crisis within Detroit is not just a land and property issue; rather,
this epidemic has an exponential impact on the City’s efforts with regards to public
70From roughly 1.8 million residents in the 1950’s to the current estimate of under
700,000
71 Every Neighborhood Has A Future… And it Doesn’t Include Blight, Detroit
Blight Removal Task Force Plan May 2014. Page 15

168
safety, education, job growth, property tax revenue, and the City’s efforts to attract
new residents and businesses.
As recently as 2010, under Mayor Bing’s administration, the City of Detroit
began a coordinated effort to tackle the City’s growing urban blight, with an initial
goal of razing 10,000 vacant structures, roughly 13% of the vacant structures within
the City, at that time. The City reached approximately 50% of its stated blight
removal goal by 2013, but lacked the necessary funding to continue its targeted
efforts. Demolition expense estimates for blighted residential structures have ranged
between $8,500 - $12,000 per structure, depending on the size of the building and
the degree of blight and neglect. In addition to the incremental costs, the City’s
protracted payments to the demolition contractors have resulted in reducing the
number of contractors willing to provide demolition services.
Current Blight Initiatives
Mayor Duggan has made blight eradication a top priority and has attempted
to coordinate Detroit’s multiple public and private organizations in an effort to
streamline funding and execute a strategy toward this critical effort. To that end,
the Duggan administration has created the Department of Neighborhoods and

169
empowered the Detroit Land Bank Authority (“DLBA”) to aggressively move
forward with multiple blight initiatives, including:
Nuisance Abatement
o Legal process of the City taking proactive legal remedies to seize
abandoned properties within Detroit via the transfer of title to the
DLBA (after the owner has been given the opportunity to bring the
property “up to code”)
Enhanced Intake Process
o DLBA performs a cost-benefit analysis to assess the estimated costs to
restore a property as compared the assumed demolition expense
Disposition
o DLBA has been initially successful in selling viable houses via open
houses and online auctions
In addition to the City’s blight efforts, the Detroit Blight Removal Task Force
(“Task Force”) recently released its Blight Removal Task Force Plan that articulated
the Task Force’s efforts since it was founded in September 2013 and its view on the
City’s blight efforts. The Task Force, in partnership with Data Driven Detroit and
Michigan Nonprofit Association, created the Motor City Mapping (“MCM”) project
that created a database cataloging the physical condition, tax status, and other
pertinent information of all 380,000 parcels of land in Detroit. Also, these partners
developed the Maximizing Community Impact (“MCI”) software tool designed to
identify neighborhoods where targeted funding could stem blight expansion. Going
forward, the Task Force’s mission – as it pertains to the City’s blight – is to focus
on removing blighted structures and cleaning vacant parcels. The Task Force

170
estimates it will cost the City approximately $850 million to execute the Task
Force’s demolition strategy72.
While the City’s blight action plan and the Task Force’s recommendation
appear to be directionally aligned, the City’s overall mission to stabilize
neighborhoods may result in the DLBA pursuing deconstruction efforts in lieu of
demolition, where it makes more sense. If the DLBA is able to resell or recycle
some of the building components of the blighted structures and create valuable job
opportunities in the process, that approach may make better fiscal sense than an
across-the-board demolition strategy.
Plan of Adjustment – Blight Proposals
The City’s POA includes a Blight Reinvestment Initiative that proposes to
allocate $420 million of funding towards blight removal over the course of the next
nine years. The projected funds dedicated for blight removal have changed in each
iteration of the City’s POA projections and funding has been allocated to other POA
obligations. The forecasted annual blight RRI is as follows:
72 Every Neighborhood Has A Future… And it Doesn’t Include Blight, Detroit
Blight Removal Task Force Plan May 2014.
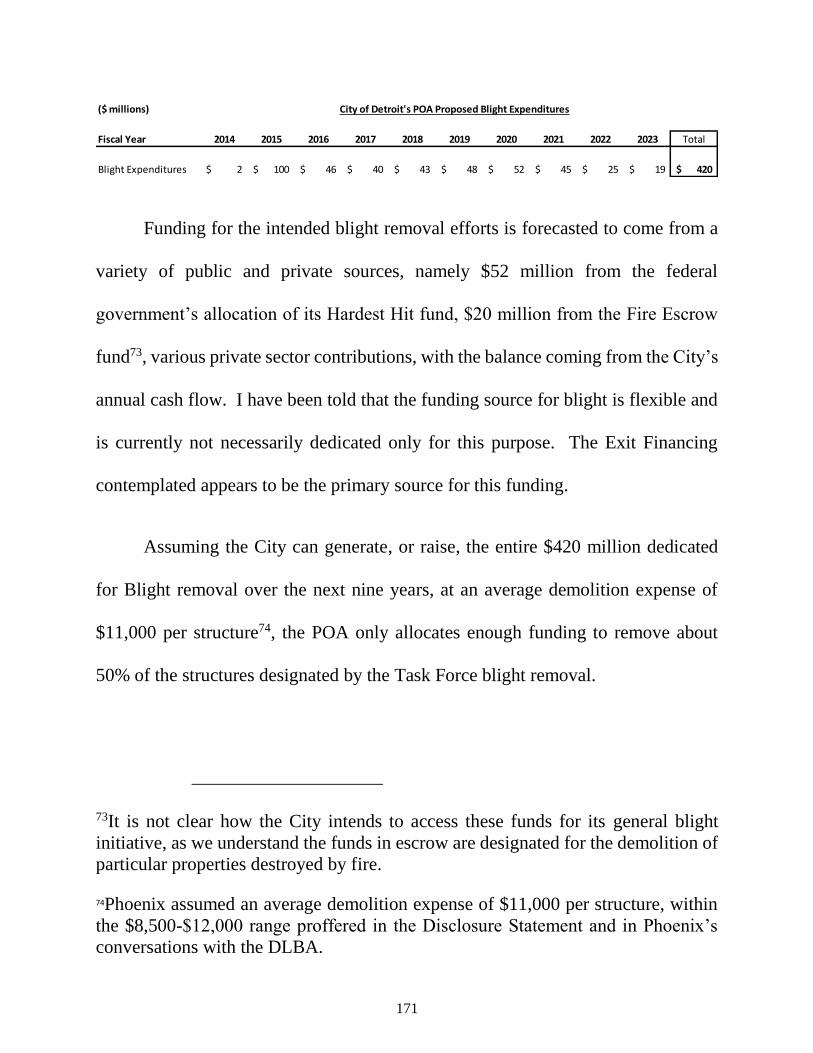
171
Funding for the intended blight removal efforts is forecasted to come from a
variety of public and private sources, namely $52 million from the federal
government’s allocation of its Hardest Hit fund, $20 million from the Fire Escrow
fund73, various private sector contributions, with the balance coming from the City’s
annual cash flow. I have been told that the funding source for blight is flexible and
is currently not necessarily dedicated only for this purpose. The Exit Financing
contemplated appears to be the primary source for this funding.
Assuming the City can generate, or raise, the entire $420 million dedicated
for Blight removal over the next nine years, at an average demolition expense of
$11,000 per structure74, the POA only allocates enough funding to remove about
50% of the structures designated by the Task Force blight removal.
73It is not clear how the City intends to access these funds for its general blight
initiative, as we understand the funds in escrow are designated for the demolition of
particular properties destroyed by fire.
74Phoenix assumed an average demolition expense of $11,000 per structure, within
the $8,500-$12,000 range proffered in the Disclosure Statement and in Phoenix’s
conversations with the DLBA.
($ millions)
Fiscal Year 2014 2015 2016 2017 2018 2019 2020 2021 2022 2023 Total
Blight Expenditures 2$ 100$ 46$ 40$ 43$ 48$ 52$ 45$ 25$ 19$ 420$
City of Detroit's POA Proposed Blight Expenditures
172
I am not troubled by this apparent discrepancy between what the Task Force
believes is required to eradicate blight and what the City is proposing. At some point
during the next ten year period, assuming the City can dedicate sufficient funding to
the blight initiative in the next few years, I believe that blight removal can become
more self-sustaining by incorporating private capital or cost neutral solutions. If the
City is initially successful in its blight remediation efforts, private owners and
investors will see an economic opportunity to allocate private capital to take
advantage of the revitalization efforts. It should be noted that, of the 79,000
structures (excluding lots) that are included as blighted or indicating blight, almost
half have the lesser designation of ‘structures with indicators of future blight’.75 It
is likely that some portion of these structures might create realistic opportunity for
private investors.76
75Every Neighborhood Has A Future… And it Doesn’t Include Blight, Detroit Blight
Removal Task Force Plan May 2014. Page 15
76Every Neighborhood Has A Future… And it Doesn’t Include Blight, Detroit Blight
Removal Task Force Plan May 2014. Page 224- the Blight task force estimates that
80-90% of the properties with blight indicators marked for ‘further analysis’ will
eventually require demolition.

173
Blight Summary
Quantifying the near- and long-term economic impact of a successful City of
Detroit blight removal initiative is difficult due to the absence of a calculable
immediate return on the City’s investment. The City’s POA forecast, embedding
the positive cash flow impact of the proposed RRIs, assumes increased income tax
revenues of $204 million and property tax revenues of $110 million in the ten year
period ending June 2023. While other RRIs impact the reasonableness of these
incremental revenue assumptions, the relative impact of the blight removal initiative
cannot be overstated.
In order to maximize the benefits of the blight removal program, the City must
ensure that the funding is committed and supported in the longer term. For better
or worse, blight has an emotional impact on the perception of what Detroit is and
can be. I believe that the blight initiatives are immensely important to creating and
sustaining a positive trajectory for the City’s revitalization efforts. With substantive,
long term commitments to address blight, I believe that many of the external factors,
including home ownership and job creation required to abate the City’s decline, can
be addressed. Conversely, a start and stop approach, will likely result in ineffective
investment and do little to reverse the spread of blight throughout Detroit. This trend
would ultimately constrict the City’s liquidity and make Detroit a less desirous
174
location for new residents and employers. To effectively address blight, the City
needs to achieve economies of scale. The Task Force estimates that through
economies of scale, the average cost per structure may be reduced by 17%. Put
differently, with proper planning and investment, the City’s blight investment can
produce 17% greater impact for the same money.77
Finally, continued coordination between the City, the State of Michigan, the
Federal government, DLBA, and various private constituencies will be critical to the
long-term success of the blight initiative. Perpetual updating of MCM, and effective
utilization of the MCI software tool to identify the neighborhoods that will benefit
the most from allocation of the limited blight funding, will be important to the
success of this most critical City initiative.
77 Every Neighborhood Has A Future… And it Doesn’t Include Blight, Detroit
Blight Removal Task Force Plan May 2014. Page 224

175
Section M – Post Confirmation Oversight
As noted in my definition of feasibility, I believe that the determination of
feasibility stretches far into the future, although to impact feasibility, issues that
extend further into time must be more significant. Beyond the strictly financial
issues, one of the most significant issues impacting feasibility involves post
confirmation oversight and governance. Ultimately, the City of Detroit will be
largely run by an elected mayor and an elected city council. There are obvious
inherent limitations to understanding how the City will be run without knowing who
will occupy these critical positions. In the end, the success of the POA will largely
rest on the will of these elected officials and whether the will to make the
fundamental change is inherited by future leaders.
While the democratic process necessarily creates this limitation, the State of
Michigan has created a framework that will provide a level of consistent oversight
for the City. If implemented correctly, this oversight will institute financial
accountability in the City’s operations and greatly improve the ability to address
small problems before they become significant factors to long term viability.
176
Public Act 181 of 2014 establishes a 9 member commission, the Financial
Review Commission (FRC), with fairly broad oversight power over the City.
Powers to be granted to the FRC include:
Ensure the City is complying with the POA
Review and approve the City’s consensus revenue
Require the City to submit 4 year financial plans
Review, approve and modify proposed and amended operational budgets
of the City
Require relevant information from the City
Review and approve requests by the City to issue debt
Approve the appointment and termination of the City’s CFO
Approve collective bargaining agreements
Approve all contracts that exceed $750,000
I strongly believe that the appointment of the FRC improves the prospect of the
City continuing to improve its fiscal health and therefore, provides some level of
assurance to me regarding feasibility. I do note, that the FRC is populated by 9 non-
compensated members. What we have learned about the City’s finances, reporting
and operations compels me to caution that the task the FRC is undertaking is not
only challenging, but will require substantial time. Therefore, I believe that the
positive prospects associated with the implementation of the FRC would be
improved if the FRC hires permanent staff. My belief is that an executive director
level professional with qualifications similar to a CFO would significantly improve
the oversight functions associated with the FRC. I understand that the State has

177
appropriated funds for the operation of the FRC and these funds may in fact already
be allocated to the above noted purpose.
As noted elsewhere in this Report, the pension plans are very complex. The
accounting and actuarial assumptions are difficult to understand; it is even harder to
understand how changes in assumptions may changes the City’s future financial
prospects. Therefore, I believe that it is important for the FRC to require annualized
reporting from the City regarding each of the GRS and PFRS systems:
The undiscounted liability of each of its pension plans.
A sensitivity analysis consistent with those recommended by the Society
of Actuaries Blue Ribbon Panel that provide a discount of the liability
based on +/- 3% from the investment return discount rate used in the plan.
This reporting will allow outside observers to truly understand the nature of
the City’s continuing legacy pension obligations and insure that the City has
foresight to deal with and significant deterioration of the pension UAAL during the
time in which the City will not be making any direct cash payments to the pension
funds, but the liability could nonetheless grow.
Public Act 182 of 2014 provides for the appointment of the City CFO, the
identification of reporting requirements to the FRC and others, among other
provisions. We do note that Public Act 181 and 182 requires the following:

178
That the City’s financial plan include a general reserve fund for each
fiscal year to cover potential reductions in revenues or increases in
projected expenditures equal to not less than 5% of the project
expenditures for the fiscal year.
I do not believe that the City’s POA, as currently presented, complies with
this requirement. The City has not identified how it intends to come into compliance
with this provision.
As noted elsewhere in my Report, the City is unable to produce any reliable
reporting in a timely manner. This will impact the FRC in their duties. At present,
the City does not conduct monthly financial closes. That is, the City does not
produce financial statements during the year. Further, it does not have a system to
properly account for encumbrances. At present, the City relies on cash based
information for what little information it does use to manage its operations. This
cash based system is woefully inadequate for the purpose of running a major city
long term. This will be compounded as the City begins to make large scale
investments, such as blight remediation, which require the allocation of funding well
in advance of the actual cash expenditure. The City has targeted an ERP system as
one of its highest priorities in the RRIs. We fully support this initiative. However,
it typically requires between 2-3 years, and sometimes even longer, for a full ERP
implementation. During this time, the City will be required to continue to rely on
ad hoc reporting. It is my observation that Mayor Duggan is using ad hoc operational

179
metrics to gain visibility. Given the lack of alternative options, I applaud this and
believe that this can be a reasonable proxy for the immediate term, but it cannot
replace the need for quick, integrated, systematic reporting over a longer period.
I have a significant concern regarding the City’s intention with regard to the
ad hoc reporting currently performed. It is my belief, the City is relying heavily on
the cash team on site from E&Y. I understand that 3 full time E&Y personnel are
allocated exclusively to cash management and reporting. I further understand that
the POA does not have any direct funding allocated to retaining E&Y for this
function. Further, I do not believe the City has recruited and trained personnel for
this fairly complex and critical role. Failure to address this issue prior to
confirmation could have a significant impact on the City’s ability to manage cash
and provide any level of reporting.

180
Section N - City of Detroit Unresolved Issues
In the event that the Plan of Adjustment is confirmed, the City of Detroit will
continue to be challenged with operational, legal and financial issues critical to the
City’s long-term viability and its ability to execute the proposed restructuring
initiatives, including:
Bankruptcy Eligibility
2005-2006 Certificates of Participation
Potential Swap litigation
Impact of Collective Bargaining Agreements negotiations
Potential City of Detroit Asset Sales
Exit Financing
Professional Fees post-bankruptcy
The immediate and long-term impacts to the City if it ultimately receives
negative outcomes from any of these key issues cannot be quantified at this time. It
is likely, though, that these (and possibly other) issues, both individually and
collectively, will consume significant City resources, with regards to both human
capital and financial reserves, in the period immediately following the conclusion of
these chapter 9 proceedings.

181
Chapter 9 Eligibility
The central issue before the Court since the beginning of this municipal
bankruptcy has been the ultimate determination as to whether the City of Detroit was
eligible to be a debtor under chapter 9 of the Bankruptcy Code. At the petition date,
the City filed its Statement of Qualifications and supporting memorandum
demonstrating its compliance with the chapter 9 debtor requirements.
Approximately 110 objections to the City’s eligibility were filed, along with the
Attorney General for the State of Michigan’s argument that the Pension Clause of
the Michigan Constitution prohibited the City from impairing its obligations to the
City’s pensioners.
After three months of multiple hearings and bench trial, on December 5, 2013,
the Court entered the Eligibility Order stipulating that the City was eligible to be a
debtor under chapter 9 and that its bankruptcy petition was filed in good faith. The
objecting parties immediately requested an Order of Relief to the Sixth Circuit Court
of Appeals. The Bankruptcy Court subsequently issued a memorandum
recommending that the Sixth Circuit deny the appeal request entirely, and, if the
Sixth Circuit did grant the appeal, that the appeal should not be expedited and
therefore ruled upon prior to the City’s Confirmation hearing. On February 21,

182
2014, the Sixth Circuit Court of Appeals granted the appeal petitions, but stated that
the appeals would not be expedited.
At this juncture, the City’s bankruptcy confirmation hearing and ultimate
resolution is scheduled to occur prior to the Sixth Circuit’s appellate hearing and
decision. The potential impact of a reversal or modification of the Court’s Eligibility
Order is unknown at this time. It is conceivable that a reversal of the Bankruptcy
Court’s Eligibility ruling would completely negate the negotiated advances the City
has made to date, specifically relating to employee compensation and
pension/benefits reform.
Certificates of Participation
In 2005 and 2006, the City of Detroit, via its Retirement Systems and their
related service corporations, issued multiple debt instruments known as certificates
of participation (“COPs”) totaling $1.47 billion in an effort to reduce the pension
plans’ combined unfunded liability. At the petition date, three series of COPs were
outstanding totaling $1.473 billion:

183
Material legal debate currently exists as to whether the City of Detroit was
legally able to issue the COP debt instruments. The City is bound by both the Home
Rule City Act, which details the level of indebtedness a city may incur, and the
Municipal Finance Act, which prohibits a city from issuing a municipal security
except in accordance with provisions of the Municipal Finance Act. The 2005-2006
COP debt instruments may have been in violation of either or both of these legal
statutes.
On January 31, 2014, the City filed a complaint against the Service
Corporations and the Funding Trusts – the non-profit entities established to effect
the COP debt issuances – stating the 2005-2006 debt issuances were in violation of
state law and that the related COP claims should be disallowed in the chapter 9
proceedings. Contradictory complaints were subsequently filed by the Funding
Trusts, COP holders, and the COP insurers citing multiple affirmative defenses to
the City’s complaint. At this time, hearings on the respective motions have been
adjourned indefinitely. To the degree that such legal proceedings result in the COP
($ million) Amount Interest
COP Series Outstanding Rate
2005-A 517.6$ 4.5-4.95%
2006-A 153.7$ 5.989%
2006-B 801.6$ Floating
1,472.9$

184
claims being fully or partially allowed, the City’s POA could be materially
weakened, and may result in incremental liquidity being required from future tax
revenue to satisfy future obligations.
Potential Swap Litigation
As highlighted above, the City previously issued multiple COP debt
issuances, the 2006-B series of which contained variable interest rates, thereby
exposing the City to a rising interest rate environment. To hedge against this risk,
the City entered into variable interest rate swap transactions in a notional amount of
$800 million, equivalent to the 2006-B COPs series. The swap contracts were
insured by FGIC and Syncora to guarantee the quarterly payments defined in the
swap agreements.
In 2009, due to the downgrade of the 2006-B series credit rating, the swap
counterparties had the right to declare an early swap termination event which, at the
time, would have required the City to make a lump sum payment of $300-400 million
to the swap counterparties. In an effort to avoid making such payment, the City
pledged certain casino revenues and developer payments as collateral to the swap

185
counterparties. Approximately $0.5 million per day is held in a lockbox until the
City makes its $4 million monthly swap payment.
The City’s UTGO bond ratings were downgraded in 2012, exposing the City
to a subsequent termination event and additional, costly termination payments due
to the swap counterparties. In efforts to protect its interest in the collateralized
Casino revenues, the City of Detroit entered into multiple mediations and litigation
with both the swap counterparties and the swap insurers. The mediation with the
swap counterparties resulted in reaching the Forbearance and Optional Termination
Agreement that, after significant prodding from the Court, resulted in an agreement
for a reduced Optional Termination Payment of $85 million, payable when the City
raises the required Exit Financing or in installments within 180 days of the case’s
Effective Date.
The Court entered a Swap Settlement order on April 15, 2014, which was
subsequently appealed by multiple swap insurers contesting the swap counterparties
ability to exercise any optional right of termination of the swap contracts without the
insurers’ written consent (Syncora Guarantee Inc. v. UBS AG, et al., Adv. Proc. No.
13-05395)78. The litigation appears to essentially hinge on two primary issues: 1)
78 Quarterly Report with Respect to the Financial Condition of the City of Detroit;
Office of the Emergency Manager; dated April 15, 2014.

186
whether the swap insurers have the right to prevent the City from gaining access to
its wagering tax revenues (City of Detroit, Michigan v. Syncora Guarantee Inc. et
al., Adv. Proc. No. 13-04942)79, and 2) whether the swap counterparties had the
“standing” to enter into the FOTA without the swap insurers’ consent. On the first
issue, the District Court – in a July 14, 2014 decision - ruled the swap insurers did
not have the right to trap the City’s wagering tax revenues. That decision, as well
as the ruling on the swap counterparties authority to execute the FOTA without the
swap insurers’ consent, will thus be decided by the Sixth Circuit Court of Appeals.
To the degree the insurers’ appeal is successful, any clarity of the City’s financial
exposure to a potential swap termination payment would be lost and would possibly
result in the future restricted access to some portion of the vital Casino revenues.
Collective Bargaining Agreements
The City of Detroit, throughout this bankruptcy process, has been negotiating
to reach CBAs with its various labor unions representing the City employees. A
total of 47 labor unions represent the City’s employees, all of which had their CBAs
79 Quarterly Report with Respect to the Financial Condition of the City of Detroit;
Office of the Emergency Manager; dated April 15, 2014.

187
expire as of June 30, 2013. The City’s employees have been subject to City
Employment Terms (“CETs”) since the expiration of the respective CBAs. The City
estimates that the CETs have resulted in more than $200 million of annualized labor
savings.
The City has negotiated many new CBAs with the goal of having them mirror
the effective terms of the CETs. Phoenix has recently received the majority of
negotiated CBAs, some of which have been fully approved by the State of Michigan,
and some of which have been ratified but await the State’s approval. Due to the
timing of when Phoenix received these CBAs relative to our Report deadline, we
have not fully reviewed each of these CBAs. To the degree that the final, agreed-
upon terms of the respective CBAs contain aspects that are costlier to the City than
the current CETs or contemplated in the projections, the City’s liquidity could be
negatively impacted. I am further concerned that the newly negotiated CBAs may
not have sufficiently addressed the City’s historic work rule issues.80
80 I have received assurance from City advisors that all agreed-upon CBAs are
included in the projections.

188
Potential Asset Sales
Concurrent with the City’s bankruptcy process, the City and its
representatives have been in discussions with multiple constituencies in efforts to
ascertain the optimal utilization of certain assets of the City of Detroit, whether that
may be the outright sale of certain assets or the proposed leasing and/or partnership
of non-core City assets.
The City has been engaged in longstanding discussions pertaining to the
Detroit Water and Sewerage Department (“DWSD”) with the surrounding counties
with regards to the potential formation of a regional water authority. It is
conceivable that a new authority could assume operating control of the majority of
DWSD assets. To date, the City has not able to reach an agreement on any
disposition of the DWSD assets and, as such, the discussions have migrated to
bankruptcy-ordered mediation.
In addition to a possible disposition of the DWSD assets, the City has also
inquired with interested parties about the possibility of a public-private partnership.
Such partnership would entail the operation and management of the DWSD by
qualified candidates who have demonstrated the financial and operational
capabilities required to execute the DWSD’s operations.

189
The City, via its Auto Parking System (“APS”), owns and manages seven
parking garages containing 6,793 spaces and controls roughly 3,400 on-street
metered parking spaces. At the request of the City, Miller Buckfire & Co. has been
tasked with exploring the potential monetization of the City’s parking assets. At this
time, no definitive decisions have been made by the City regarding these assets.
Lastly, options related to the City’s Coleman A. Young Airport are currently
being considered, specifically a possible sale or lease transaction. As the airport is
currently a cash drain on the City’s budget, the transfer of this asset could be
beneficial to the City’s overall liquidity.
Exit Financing
The City of Detroit is seeking to enter into a $300 million financing facility
(“Exit Facility”), commensurate with the City’s anticipated emergence from
bankruptcy. Per the POA, an estimated $120 million of the Exit Facility will be used
to refinance the City’s existing, previously-funded Quality of Life loan. The balance
of the Exit Facility is intended to provide the City with liquidity and begin to fund
the POA’s restructuring initiatives.
190
Miller Buckfire & Co. has been engaged to solicit respective parties’ interest
in the proposed $300 million financing. To date, an Exit Financing introductory
letter and an Exit Financing Indicative Term Sheet have been released to prospective
lenders. Phoenix has no visibility into the receptiveness of the financing sources to
the proposed debt offering. To the degree the City is not able to procure the
anticipated Exit Financing in the amount or at a reasonable interest rate will
materially impact the City’s cash flow liquidity at its emergence from bankruptcy.
As of the date of this Report, it appears that the assumed interest rate of 6% could
be low for a high yield instrument like the proposed Exit Financing.
Professional Fees
According to the Plan, the City intends to establish and fund the Professional
Fee Reserve, effectively allocating funds for the accrued expenses of professionals
during the Chapter 9 bankruptcy. Those funds have been identified in the City’s
financial forecast.
The services provided by these professional advisors – both legal and financial
– are likely to be required by the City after the bankruptcy is confirmed, whenever
that occurs. In addition to various litigation matters referenced above, the City’s

191
treasury function, as well as multiple, other financial and departmental functions, are
largely performed by outside professionals at this time. This results in two primary
concerns: first, many of the everyday functions performed by these outside
professionals need to be transitioned to City employees, some of whom may not be
hired yet; and, second, the interim, post-bankruptcy costs associated with these
outside professionals is not in the City’s budget at this time. While the City may be
able to transition the Finance-related roles to its employees in the short or mid term,
the various ongoing litigations will require a significant near-term financial
commitment by the City to its retained legal counsel. The estimated, post-
bankruptcy professional fees should be included in the City’s near-term financial
forecasts as they have the potential to be an immediate use of funds.
192
Section O - Other Risks and Opportunities
The POA and the projections that support the POA have been developed by
the City to provide a reasonable forecast and represent a realistic picture of the City’s
General Fund.81 Based upon my team’s analysis and numerous discussions with the
City’s advisors, I understand these projections were not developed either to: 1)
account for every opportunity the City may have to generate cash flow in the future,
or 2) account for every possible downside risk associated with a loss of revenue or
an increase to expenses. While I do not disagree with the City’s exclusion of certain
items, I believe it appropriate to briefly summarize certain risks and opportunities
not fully explored elsewhere in this Report.
81 Report of Gaurav Malhotra in re City of Detroit, Michigan 13-53846, page 3,
“These projected revenues and expenditures are reasonable forecasts and represent
a realistic picture of the City’s General Fund’s ability to afford its expenditures and
satisfy its obligations under the plan while maintaining an adequate level of
municipal services.”

193
Macro-Economic Issues
I believe the City’s economic forecasts that informed the projections
considered normalized economic conditions. I do not believe the City’s projections
accounted for any significant economic disruptions similar to those experienced
recently during the Great Recession. Depending on the severity, longevity and the
direct impact on urban centers, a long term and negative economic condition could
cause serious concerns with meeting the Plan requirements.
State and Federal Funding
The POA relies on a number of external funding sources including the State
of Michigan and to a lesser extent the Federal government. The State contributes
through annual revenue sharing totaling almost $2 billion over the first 10 years of
the Plan as well as $194 million as part of the Grand Bargain. Any additional support
for Detroit at the State level is not committed and, in fact, revenue sharing could
decrease over the life of the Plan.
There is obvious interest by the Mayor in identifying new and recurring
support from the Federal government and other grant making bodies. The Plan
projections have tended to apply conservative assumptions to the current grants and
the availability of additional grants in the future, although it is clear that not all grants

194
assumed in the projections are committed at this time. Any increase in direct Federal
support or grants will help to make the projections more achievable.
Impact of Private Parties
Third party funders have made significant commitments to the City. In fact,
the Grand Bargain represents a huge commitment by these City benefactors and is
already accounted for in the projections. However, there are a lot of small ways that
third party benefactors may directly and indirectly impact the future of the City. The
work of the Blight Task Force and the Future Cities Initiative are an example of this
and cannot be measured in dollars. There would also be an improvement in the
feasibility of the POA if a surge in private investment favorably impacts real estate
values, employment and other factors that could contribute favorably to the
initiatives in the Plan.
There is a downside to third party involvement as well. It can be fickle; a
change in priorities or fortune could reduce the level of funding or delay it. The
POA calls for $366 million from charities and foundations plus an additional $100
million to be raised by the DIA Corporation as part of the Grand Bargain which will
be paid over a 20 year period. Failure of these foundations or benefactors to execute

195
on their commitments will result in further funding requirements from the City of
Detroit.
Exit Financing and Access to Capital Markets
The POA contemplates the closing of an Exit Financing that will support the
City’s investment and liquidity needs. The projections assume Exit Financing will
be a $300 million facility with an 11 year term, funded on October 31, 2014, with
interest only payments in the first 4 years and equal principal payments made in
years 5-11. The interest rate is assumed to by 6%.82 We understand the City,
through its advisors Miller Buckfire & Co., have commenced a process to solicit
bids for this financing package. As of the date of this Report, the process is still
underway. Mr. Buckfire believes that the Exit Financing process is likely to be
successful on the terms outlined.83 In the event that this financing is unavailable to
the City on reasonable terms, is significantly lower in terms of facility amount, or is
otherwise different than the assumptions in the POA, it is unlikely the City will have
sufficient liquidity to operate and satisfy its obligations.
82 Report of Gaurav Malhotra in re City of Detroit, Michigan 13-53846, page 14.
83 Expert Report of Kenneth Buckfire in Support of the City of Detroit’s Plan of
Adjustment in re City of Detroit, Michigan 13-53846 page 3 Section 2.

196
In addition, I believe it is likely that the City will desire or require access to
the capital markets in the future for potentially many different reasons. Mr. Buckfire
believes the significant changes as a result of the POA and the State of Michigan’s
steps to remedy governance will allow the City to again access the capital markets.
84 The City’s inability to access the capital markets beyond the Exit Financing may
limit the City’s working capital flexibility and its ability to respond to future,
necessary changes in delivery of essential services or capital investments.
DWSD
Detroit Water and Sewerage Department is a significant portion of the City’s
operations, however, it has very little impact on the General Fund. DWSD largely
operates independently from other City business units. While DSWD’s debt is
impacted by the POA, the DWSD operations are not included in the Plan. DWSD
does play a significant role in funding the City’s pension obligations during the
forecast period85. In the event of a significant disruption to the DWSD operations,
significant loss of customers impairing its financial prospects, or in the event that
84 Expert Report of Kenneth Buckfire in Support of the City of Detroit’s Plan of
Adjustment in re City of Detroit, Michigan 13-53846 pages 3-5 Sections 3-6.
85 DWSD is expected to contribute a total of $428 million from FY2015-
FY2023.

197
the DWSD contributions are not made according the POA, this could negatively
impact on the outcome of the POA.
Sale of Assets
The POA largely excludes the sale of assets. While the sale of certain assets
will have established treatment in the POA, there are significant asset sales that are
not contemplated in the POA that could positively impact the projections. These
assets might include parking related assets and other real estate. I have no visibility
into the value of potential asset sales, but I believe they could produce cash which
could improve the City’s liquidity or revitalization prospects.
Tipping Point
The concept of the Tipping Point was made popular by author Malcolm
Gladwell. He characterizes the tipping point as a moment of critical mass or boiling
point where a group of small actions hit a threshold point and create an outsized
impact. 86 A tipping point can be either positive or negative. Presently, the City has
86 The Tipping Point by Malcolm Gladwell, 2000 published by Little Brown.

198
momentum and emotional optimism that it can build upon to energize its
revitalization. There is no way to stochastically identify this impact and I do not
believe the City has included this optimism in its projections. But there is no doubt
that it is real.
I believe the City may be experiencing a tipping point that could be either
positive or negative. There is a lot of press about support for the City from external
parties making significant investment in Detroit. Press accounts suggest percolating
interest in real estate and low availability of market rate apartments in small sections
of the City. The City is addressing in small ways the quality of life issues, including
street lights and blight.
It is beginning to feel like it could be an exciting time to be in Detroit. Tipping
points also work in the opposite direction. If the momentum starts to slow in lots of
small ways, or if the headlines change from investors buying, to investors selling, or
if blight remediation reverses direction, the City could tip backwards. It is a critical
point in time for the City of Detroit. My opinion is that it is more likely to tip forward
than to tip backwards.

199
Section P - Conclusions
As noted in the Feasibility Section of this Report, I, along with the Phoenix
team, have proffered the following Feasibility Standard for use in determining
whether the City of Detroit’s Plan of Adjustment is feasible:
‘Is it likely that the City of Detroit, after the confirmation of
the Plan of Adjustment, will be able to sustainably provide
basic municipal services to the citizens of Detroit and to
meet the obligations contemplated in the Plan without the significant probability of a default?’
We have further qualified the Standard into two components:
Quantitative
Are the projections contained in the POA mathematically correct and
materially reasonable?
Are the assumptions that the City has used to develop its projections
individually, and when taken as a group, reasonable?
Is there an adequate contingency included in the projections?
Qualitative
Does the City have the human resources, or can it likely recruit the human
resources, required to meet its obligations under the POA?

200
Does the City have the appropriate systems and procedures to monitor its
financial performance and to provide early warning signs of variances in
performance that might cause the City to fall short of the projections and
be unable to meet its obligations under the POA?
Are there appropriate structures to ensure the City’s compliance with the
POA and with reasonable government standards of operation?
Will the City be able to reasonably deliver a minimum level of municipal
services?
Is the City’s trajectory sustainable?
The Quantitative Issues
It is my opinion that, except where otherwise noted in my Report, the
projections are generally mathematically correct and materially reasonably and
therefore fall within the Feasibility Standard I have defined.
It is my opinion that, except where otherwise noted in my Report, the
individual assumptions used to build the projections fall into a reasonable range and,
that when taken as a group, these assumptions are also reasonable and fall within the
Feasibility Standard.
While I have noted issues with the level of contingency in the projections, and
feel this must be addressed both as a practical matter and in response to Public Acts
181 and 182 of 2014 controlling law, I believe that there are enough conservative
assumptions in the projections to offset what I view as an aggressive assumption

201
concerning the level of contingencies, particularly in the early years. While I do not
believe a 1% contingency is adequate, I believe that the POA projections, taken as a
whole, fall within the range of reasonableness and within my definition of the
Feasibility Standard.
The Qualitative Issues
As noted in this Report, I believe that human capital and the City’s leadership
ability are immensely important for the success of this Plan. Current human
resources are lacking and senior leadership, while generally capable is not plentiful.
To meet the projections in the POA, the City will need to recruit a significant number
of employees with improved skill level and continue to change the culture of
performance and accountability, I believe that the City has identified human capital
as an issue and is addressing this both formally and informally. I am relying on
Mayor Duggan, CFO John Hill, and the other capable executives I have met at the
City to execute effectively on the human capital strategy.
As noted in this Report, the City’s IT systems and procedures are broken and
insufficient. I believe that the City’s Mayor, CFO and CIO recognize the critical
importance of effective technology and systems to the City’s revitalization. Each

202
of these executives has convinced me that correcting the City’s IT systems issues is
a very high priority. I believe the City has recognized these issues, has identified
the magnitude of funding required, and has begun to address both the process and
technology issues necessary to bring the systems up to a reasonable standard over
the next few years. I do not believe that there is a reasonable alternative that would
produce a better, or quicker, result for the City.
I have noted my concern and my personal preference that the CFO report to
the Financial Review Commission. I believe this would have provided a greater
level of confidence in the City’s performance by outsiders, including the capital
markets. However, I believe that the existence of the Financial Review Commission
provides a reasonable level of oversight to the City and that the CFO is eminently
capable and appropriately professional and independent.
The POA and the projections that support the POA are designed to allow the
City to continue to improve its level of service to the citizens of Detroit. I believe
that the RRIs are reasonable and well considered. If executed, they will allow the
City to deliver essential services. It is my opinion that the City is beginning to
emerge from the “service delivery insolvency” referenced in Judge Rhodes’ opinion
concerning eligibility.
203
By most accounts, there is forward progress being made in the City. I believe
the combined efforts of the Emergency Manager and Mayor are addressing service
shortfalls. Further, I believe that the expanding efforts of the private sector are also
indicative of a City with a positive trajectory. The POA lays out a plan to continue
to improve the City services and I believe some of the work done by the Blight Task
Force and the Future Cities Initiative will continue to add additional support to the
City’s positive trajectory.
After extensive interviews with parties knowledgeable about the City and the
POA, the review of hundreds of relevant documents and models, and significant
independent research and analysis by my team and me, it is my opinion that:
It is likely that the City of Detroit, after the confirmation of
the Plan of Adjustment, will be able to sustainably provide
basic municipal services to the citizens of Detroit and to
meet the obligations contemplated in the Plan without the
significant probability of a default.
As noted in Section C of this Report, I believe that the Feasibility Standard
exist on a reasonable continuum, therefore, there are actions that can make the POA
“more feasible.” Throughout my Report I have noted issues that caused me some
level of concern. These are issues that, if addressed, would make the POA ‘more
feasible.’ Without any expectation that my concerns will influence the City or the
Court, I will briefly summarize my larger concerns.

204
It should be noted that this opinion is rendered in an environment where there
are many factors that will have influence on the City’s conditions post confirmation
that are unknown and unknowable. Throughout this Report, I have noted some of
these factors, while other factors may not even be recognized today as potentially
having an impact. My opinion is necessarily limited by these unknown factors. It
should be recognized, that these factors, when known, could have a material impact
on my view of feasibility.
Integrated Plan
As noted throughout this Report, there is not one controlling set of
projections that will provide a financial road map to the City, its constituents and the
Financial Review Commission. I recommend that the City immediately produce an
integrated plan, which includes the expected initiatives, deferrals and other items,
by department and fund. This will provide a longer term roadmap and assist the
Mayor, the Financial Review Commission and other interested parties in
understanding how the City is making progress towards the forecast detailed in the
Plan. This business plan would also meet the requirements established in Public
Acts 181 and 182 of 2014.

205
Oversight
As noted, I would have preferred an oversight model that included a CFO
that did not report directly to the Mayor. This is not a statement about the quality of
the current Mayor or CFO but rather my view that an oversight structure should be
independent of who is the elected official. Given that the structure included in the
Grand Bargain legislation does not include this independent CFO, I believe it is
imperative that the Financial Review Commission have some permanent staff. My
experience in other similar situations allows me to understand the complexity and
sheer volume of information that must be analyzed and evaluated to properly execute
the oversight function. The legislation provides for the Commission to hire
professionals, which it will no doubt need to do, but it will be less costly and better
for the long term effectiveness of the Commission, if it has a least a small permanent
staff to support the part time, unpaid oversight board.
Pension Plan
One of the driving forces of the City financial problems was the City’s, and the
pension plans’ trustees, failure to appropriately address the growing, unfunded
pension liability. With finite resources, competing needs for dollars and the

206
willingness to push the problem to tomorrow, the pension UAAL continued to grow.
This is not only a Detroit problem, but a general municipal finance problem
throughout the United States. However, just because it is not just a Detroit problem
does not mean that Detroit should not make some progress in addressing the macro
problems. While the Plan makes progress in addressing this liability, the liability is
not fixed. As noted in the Pension section of the Report, there is still risk that the
liability could grow significantly. I recognize the difficulty and pain associated with
the pension negotiations; and further, I understand the practical nature of the
resulting settlements and the City’s desire to manage its cash requirements related
to pension contributions over the next 10 years. However, this does not fix the
liability. The City cannot look away for 10 years and return in FY2023 to find the
liability has again become an unmanageable burden. Therefore, I believe it is
appropriate that the City be required to annually release the undiscounted liability of
each of its pension plans. This will allow outside interested parties to independently
evaluate the strength of the plans. Further, I believe that the City should provide a
sensitivity analysis consistent with those recommended by the Society of Actuaries
Blue Ribbon Panel on an annual basis and provide a discount of the liability based
on +/- 3% from the investment return discount rate used in the plan. This level of
reporting is not overly burdensome and will provide some level of sunshine into
what is otherwise a very opaque process.

207
RRIs
The RRIs are one of the positive outcomes of the bankruptcy process. The
RRIs provide the backbone of improved services to the citizens of Detroit. I believe
that the development of a scorecard to track the implementation of the RRIs is an
important tracking mechanism that will enable the City and the Financial Review
Commission to understand the RRIs’ implementation progress.
Respectfully submitted,
Dated: July 18, 2014
/s/__Martha E. M. Kopacz
Martha E.M. Kopacz

Exhibit 1

Martha�(Marti)�E.�M.�KopaczSenior�Managing�Director�
Phoenix�Management�Services�LLC�Ten�Post�Office�Square,�Suite�605N�
Boston,�MA��02110Mobile���(617)�840�9155
[email protected]�Ms.�Kopacz�has�over�25�years’�experience�assisting�stakeholders�in�analyzing�business�operations�and�reorganization�possibilities.�She�has�led�or�participated�in�over�100�consulting�and�restructuring�engagements�representing�companies,�debtors,�investors,�creditor�committees,�banks�and�Chapter�11�Trustees.�Ms.�Kopacz�has�advised�in�a�broad�range�of�industries�including�not�for�profit�and�public�sector,�retail,�leisure�and�entertainment,�technology�and�professional�services.���She�was�one�of�the�first�financial�advisors�to�apply�turnaround�principles�to�public�sector�and�not�for�profit�organizations.�She�has�served�as�an�Interim�President,�Chief�Restructuring�Officer,�Chapter�11�Trustee,�Collateral�Trustee,�and�Examiner.��� �General�Experience�� �Ms.�Kopacz�has�prepared�dozens�of�financial�projections�for�clients�and�reviewed�and�critiqued�dozens�more,�prepared�by�others.��She�has�previously�testified�as�to�the�appropriateness�of�forecasting�methodology,�the�assumptions�upon�which�forecasts�are�based�and�the�likelihood�of�an�organization�to�meet�its�forecast.��She�has�a�deep�understanding�of�the�importance�of�developing�assumptions�based�upon�a�thorough�analysis�of�relevant�data,�including�historical�and�prospective�information�as�well�as�third�party,�independent�data.�Ms.�Kopacz�understands�the�nuanced�area�of�municipal�budgeting.��Because�municipal�entities�lack�a�“standard”�in�budgeting,�forecasting�and�accounting,�great�variations�occur�in�the�manner�in�which�public�entities�report�financial�results�and�develop�forecasts.��As�such,�preparing�and�evaluating�projections�for�municipalities�requires�strong�business�acumen�and�deep�appreciation�for�the�challenges�inherent�in�the�forecasting�methodology�and�approach�available�to�the�entities.���� �Relevant�Engagements��Ms.�Kopacz�advised�the�Nassau�County�Interim�Finance�Authority�(NIFA),�a�New�York�state�control�board,�in�their�oversight�role.��In�early�2011,�NIFA�imposed�a�control�period�for�Nassau�County�based�on�a�substantial�budget�deficit.��Nassau�County�has�experienced�financial�difficulties�for�over�a�decade�despite�an�annual�budget�that�approaches�$3�billion.��The�structural�deficit�for�2012�was�estimated�at�$300�million.���Ms.�Kopacz�advised�NIFA�on�the�financial�requirements�underpinning�the�control�period,�the�nature�and�size�of�the�likely�budget�deficit�and�the�reasonableness�of�the�County’s�forecasts.��In�addition,�Ms.�Kopacz�and�her�team�conducted�and�in�depth�review�of�the�business�operations�of�the�County�and�developed�over�$300�million�of�cost�reductions�and�operational�improvements,�which�if�implemented�would�restore�Nassau�County�to�a�balanced�budget�in�the�next�few�years.��
��Serving�in�the�capacity�of�the�Chief�Restructuring�Officer�and�Interim�President,�Ms.�Kopacz�designed,�led�and�executed�the�out�of�court�restructuring�of�the�Legal�Aid�Society,�a�135�year�old�charity�with�approximately�$150�million�in�revenue�serving�the�legal�needs�of�the�needy�in�New�York�City.���

Accomplishments�included:��reducing�a�$20�million�operating�deficit�to�better�than�break�even;�negotiating�workforce�reductions,�compensation�and�benefit�modifications�with�the�UAW�(lawyers’�union)�and�the�SEIU�1199�(social�workers�and�paralegals’�union)�representing�approximately�three�fourths�of�the�Society’s�1400�employees;�restructuring�pension�obligations;�consolidating�real�estate,�third�party�suppliers�and�infrastructure;�and�restructuring�over�$65�million�of�balance�sheet�and�long�term�obligations�with�dozens�of�creditors�and�stakeholders,�all�of�which�returned�the�organization�to�solvency.��In�addition,�Ms.�Kopacz�led�the�Society’s�first�ever�Strategic�Business�Planning�effort,�managed�day�to�day�operations�in�conjunction�with�the�Attorney�in�Chief,�and�received�the�Society’s�Pro�Bono�service�awards�for�2004�and�2005.����Ms.�Kopacz�represented�The�Educational�Resources�Institute,�Inc.�(TERI),�a�large�not�for�profit�organization�providing�college�access�to�underprivileged�and�underserved�populations.�TERI’s�for�profit�subsidiary�was�the�largest�guarantor�of�private�student�loans�in�the�country�when�the�securitization�market�for�student�loans�evaporated.��The�extensively�negotiated�plan�of�reorganization�preserved�the�not�for�profit�mission�and�return�collateral�to�the�original�lenders.����Ms.�Kopacz�worked�extensively�with�the�Archdiocese�of�Boston�during�some�of�its�darkest�days.��In�addition�to�preparing�this�socially�significant�non�profit�institution�for�a�contingent�bankruptcy�filing,�she�worked�with�stakeholders�to�develop�a�crisis�communication�plan,�arranged�interim�financing�and�designed�a�claims�facility�to�adjudicate�tort�claims.��Prior�Experience��Prior�to�joining�Phoenix�Management,�Ms.�Kopacz�founded�Brant�Point�Advisors,�a�boutique�advisory�firm.�Previously,�Ms.�Kopacz�co�founded�and�co�lead�the�U.S.�Corporate�Advisory�and�Restructuring�Services�practice�at�Grant�Thornton�LLP�and�lead�the�group’s�public�sector�initiatives.�Earlier�in�her�career�she�was�a�Managing�Director�with�Alvarez�&�Marsal,� focused�on�public� sector�and�not� for�profit� clients,�and�a�Principal�with�PricewaterhouseCoopers�LLP�until�the�practice�was�sold�to�FTI�Consulting,�as�which�time�she�was�a�Senior�Managing�Director.��Education�&�Certifications��Masters�of�Business�Administration�in�Finance�and�Investments�–�Kelley�School�of�Business�–�Indiana�University�Bachelor�of�Science�degree�in�Marketing�–�Kelley�School�of�Business���Indiana�University��Certified�Management�Accountant�Certified�Insolvency�and�Restructuring�Advisor��Affiliations��American�College�of�Bankruptcy�–�Fellow�–�Twelfth�Class�Turnaround�Management�Association��American�Bankruptcy�Institute�International�Women's�Insolvency�and�Restructuring�Confederation,�Association�of�Insolvency�and�Restructuring�Advisors��Institute�of�Management�Accountants.�

�Civic�Engagement��Boston�2024�Organizing�Committee�–�Board�Member�Legal�Aid�Society�of�New�York�–�Board�of�Advisors�Kelley�School�of�Business���Indiana�University�–�Dean’s�Council�Graduate�School�of�Business,�Sunkyunkwan�University�–�Dean’s�Council�Inly�School�–�former�Board�of�Trustees��Speaking�Engagements�and�Publications��“Municipal�Insolvency�and�Bankruptcy�Part�1:��Introduction,�Overview�and�Key�Issues”�–�Rhode�Island�Bar�Association�Annual�Meeting,�June�2012���“Municipal�Bankruptcy”�–�Association�of�Insolvency�and�Restructuring�Advisors�Webinar,�February�2012���“The�Municipal�Restructuring�under�Chapter�9:��Legitimate�Option�or�Scare�Tactic?”�–�American�Bankruptcy�Institute�Winter�Leadership�Conference,�La�Quinta,�CA,�December�2011���“Municipal�Insolvencies:��Is�This�the�Next�Wave?”�–�Turnaround�Management�Association�Northeast�Chapter,�Boston,�MA,�November�2011���“Leadership�and�Political�Will�–�Fixing�States’�and�Cities’�Fiscal�Woes”�–�Heyman�Center�Series:��America’s�Fiscal�Crisis�–�Depression,�Recession�or�Recovery,�Cardozo�School�of�Law,�New�York,�New�York,�October�2011��“Today’s�Problems�in�Municipal�Finance�–�Should�Chapter�9�be�Extended�to�States?”�–�Commercial�Finance�Association�Advocacy�Conference,�Washington,�DC,�September�2011�
��“Turnaround�“Apps”�for�the�Public�Sector”�–�Grant�Thornton�white�paper,�July�2011�
��“Chapter�9�Update”�–�American�Bankruptcy�Institute�Northeast�Conference,�Newport,�RI,�July�2011�
��“Turnarounds�in�the�Public�Sector”�–�Kellogg�Turnaround�Management�Conference,�Chicago,�IL,�May�2011�
��“Too�Big�to�Fail�or�Too�Big�to�Bail�(Out):��a�Discussion�of�the�Pros�and�Cons�of�Bankruptcy�for�States”�–�Grant�Thornton�white�paper,�March�2011�
�“That�was�Then,�This�is�Now:��Financing�Your�Business�in�the�Current�Environment”�–�Proskauer��Grant�Thornton�Seminar,�New�York,�New�York,�October�2010���
“Navigating�Your�Portfolio�Through�Turbulent�Waters���Facing�The�Reality�of�Being�Over�Leveraged���And�Practical�Strategies�for�Restructuring�in�Zero�Gravity”�–�Association�for�Corporate�Growth�Intergrowth�Conference,�Miami,�May�2010�
��“Who�Has�$$�and�What�Are�They�Buying?”�–�Caribbean�Insolvency�Symposium,�Grand�Cayman,�CI,�February�2009���

“Gaining�Support�from�All�of�Your�Constituencies”�–�American�Bankruptcy�Institute�Northeast�Conference,�Brewster,�MA,�July�2008���Previous�Dates�–�Guest�Lecturer�at�Harvard�Business�School,�Massachusetts�Institute�of�Technology,�Bentley�College,�Northeastern�University,�Pennsylvania�State�University�and�Indiana�University�concerning�various�corporate�recovery�topics.�Panelist�or�Moderator�at�industry�conferences�hosted�by�Turnaround�Management�Association,�American�Bankruptcy�Institute,�Massachusetts�Continuing�Legal�Education,�National�Credit�Managers�Association,�Food�Manufacturers�Association,�Barclays�Bank�among�others.�������
�

Exhibit 2

# Document/Source
1 All documents referenced in this report2 All dockets located within KCC (Kurtzman Carson Consultants) data room in re: City of Detroit, Michigan
3 All documents located within the RR Donnelley Venue data room, located at http://www.kccllc.net/detroit/document/list/3666
4All documents located within the data room constructed for Phoenix Management to catalog the Jones Day data productions, serviced by AlphaLit data room, located at www.go2edirect.com
5 All information located within the City of Detroit website, located http://www.detroitmi.gov/6 All communications with City of Detroit personnel7 All communications with Advisors of the City of Detroit8 All communications with personnel responsible for the City's pension funds9 All communications with the advisors of the City's pension funds10 Emergency Manager Orders11 Emergency Manager Announcement12 Emergency Manager Reports13 All documents released from the state of Michigan in regards to the City of Detroit Bankruptcy
14American Bankruptcy Journal article titled “The Missing Link to Successful Company Turnarounds – Balance Sheet Management is Only Part of the Story”(March 2014)
15Detroit Blight Removal Task Force publication titled "Every Neighborhood Has A Future… And it Doesn’t Include Blight, Detroit Blight Removal Task Force Plan"(May 2014)
16 Daily Bankruptcy News article titled "$4 Trillion In Hidden Muni Liabilities: SEC Commissioner Gallagher" (May 2014)
17 Journal of Corporate Renewal article titled "Chapter 9 May Be Tough to Swallow for Unions, Retirees" (June 2014)
18 The Society of Actuaries panel titled “Report of the Blue Ribbon Panel on Public Pension Plan Funding”(February 2014)
19 The Brookings Institution publication titled "Are Public Pensions Keeping Up With The Times?"(June 2013)
20The Rockefeller Institute of Government publication titled "The Blinken Report: Strengthening the Security of Public Sector Defined Benefit Plans(January 2014)
21 BenefitsPro article titled "Public Pensions Hiding Trillions in Liabilities, SEC Commissioner Says"(June 2014)
22Goodwin Proctor article titled "Visionary Schemes Need Not Apply: The Chapter 9 Plan Feasibility Requirement" (June 2013)
23 WSJ article titled "Detroit’s Bankruptcy Revival " (April 2014)
24Elizabeth Warren, U.S. Senator for Massachusetts press release titled "Rockefeller, Warren Introduce Legislation to Protect Employees and Retirees from Unfair Benefit Cuts"(June 2014)
25 Unionwatch Article titled "GASB Loopholes Created Illusions of Insolvency"(March 2013)26 New York Times article titled "Panel Seeks Greater Disclosures on Pension Health"(February 2014)
27 The Detroit Free Press article titled "Judge Rhodes spars with Detroit fire union over bankruptcy objection"(July 2016)
28Dow Jones Financial Information Services publication titled "Balancing Best Interests and Feasibility in Chapter 9"(March 2011)
29 The Detroit Free Press article titled "Monitor finds Detroit's 36th District Court much improved since May 2013"(May 2014)
30 The Detroit Free Press article titled "An energized Detroit Land Bank leads Duggan's blight effort"(May 2014)31 Detroit News article titled "Clearing neighborhood blight to cost $850M, Detroit group finds"(May 2014)
32California Policy Center article titled "How New Rules from Moody's and GASB Affect the Financial Reporting of Pensions in Seven California Countries"(March 2013)
33Journal of Public Economics article titled "Financial incentives and retirement: evidence from federal civil service workers"(March 2008)
34 Boston College Law Review article titled "Some Confirmed Chapter 11 Plans Fail. So What?" (Vol.47)(December 2005)
35American Education Finance Association publication titled Teacher Pension Incentives, Retirement Behavior, and Potential for Reform in Arkansas"-2010
36National Association of State Retirement Administrators publication titled "The 80-percent threshold: Its source as a healthy or minimum funding level for public pension plans)(January 2012)
37 C. Scott Pryor publication titled "Who Bears The Cost? The Necessity of Taxpayer Participation in Chapter 9" (June 2013)
38 C. Scott Pryor publication titled "Municipal Bankruptcy: When Doing Less Is Doing Best" (April 2014)39 A Collier Monograph titled "Debt Adjustments for Municipalities Under Chapter 9 of the Bankruptcy Code"-201240 Bankruptcy of Mount Carbon Metropolitan Dist. Bankruptcy No. 91-20215 MSK(November 1999)
41Bankruptcy of the City of Colorado Springs Spring Creek General Improvement District. Bankruptcy No. 94-15333.(January 1995)
Exhibit 2

# Document/SourceExhibit 2
42Detroit Blight Removal Task Force Plan titled, "Every Neighborhood Has a Future . . . And It Doesn't Include Blight," (May 2014)
43 McKinsey & Company Publication titled "Delivering large-scale IT projects on time, on budget, and on value"(October 2012)
44 City of Detroit Triennial Executive Budget 2015-201745 Detroit Future City - Detroit Strategic Framework Plan(December 2012)
46 Report of Beth Niblock, Chief Information Officer for the City of Detroit; in re: City of Detroit, Michigan Case No. 13-53846
47 Report of John Hill, Chief Financial Officer for the City of Detroit; in re: City of Detroit, Michigan Case No. 13-53846
48 Report of Kenneth Buckfire, of Miller Buckfire & Co; in re: City of Detroit, Michigan Case No. 13-5384649 Report of Gaurav Malhorta, of Ernst & Young LLP; in re: City of Detroit, Michigan Case No. 13-53846
50 Declaration of Gaurav Malhorta, of Ernst & Young LLP; in re: City of Detroit, Michigan Case No. 13-53846(July 2913)
51 Report of Robert Cline, of Ernst & Young LLP; in re: City of Detroit, Michigan Case No. 13-5384652 Report of Alan Perry, of Milliman; in re: City of Detroit, Michigan Case No. 13-5384653 Report of Caroline Sallee, of Ernst & Young LLP; in re: City of Detroit, Michigan Case No. 13-5384654 Report of Suzanne Taranto, of Milliman; in re: City of Detroit, Michigan Case No. 13-5384655 Report of Charles Moore, of Conway MacKenzie, Inc.; in re: City of Detroit, Michigan Case No. 13-53846
56Third Amended Plan for the Adjustment of Debts of the City of Detroit; in re: City of Detroit, Michigan Case No. 13-53846.. Doc 4271(April 2014)
57Fourth Amended Disclosure Statement with Respect to Fourth Amended Plan for the Adjustment of Debts of the City of Detroit; in re: City of Detroit, Michigan Case No. 13-53846. Doc 4391
58 Opinion Regarding Eligibility; in re: City of Detroit, Michigan Case No. 13-53846. Doc 1945. (December 2013)
59Order to Show Cause Why Expert Witness Should Not Be Appointed; in re: City of Detroit, Michigan Case No. 13-53846. Doc 3170. (March 2014)
60Declaration of Kevyn Orr in Support of City of Detroit, Michigan’s Statement of Qualifications Pursuant to Section 109 “C” of the Bankruptcy Code. Doc 11(July 2013)
61 City of Detroit: Proposal for Creditors. Prepared by Miller Buckfire & Co., LLC, Jones Day. (June 2013)
62City of Detroit: Operational Restructuring Summary. Prepared by Office of the Emergency Manager. Conway MacKenzie, Inc. (November 2013)
63 Independent Auditors’ Report on Internal Control. Prepared by KPMG LLP. (December 2012)
64Quarterly Report of the Emergency Manager for the quarterly period of January 1, 2014 through March 31, 2014. (April 2014)
65Letter from Robert Childree of AGA Financial Management Standards Board. Addressed to David Bean, Director of Research and Technical Activities of Governmental Accounting Standards Board (GASB). Comments on Pension Accounting and Financial Reporting. (July 2009)
66 Email from Mike Duggan of the City of Detroit. Plan of Adjustment Due Diligence. (May 13, 2014)
67 David Whitaker, Director of Legislative Policy Division Staff for the City of Detroit. 2013-2015 Budget Analysis.(May 2014)
68Treasurers Report for 12/2011 Via: City of Detroit, Michigan Notice of Preliminary Financial Review Findings and Appointment of a Financial Review Team. Doc 11-3.(January 2012)
69 2012 Financial Review Team Report, prepared by the Detroit Financial Review Team. Doc 11-4. (March 2012)70 Treasury Report. Prepared by Andrew Dillon, Michigan State Treasurer. Doc 11-6(December 2012)
71 2013 Financial Review Team Report, prepared by the Detroit Financial Review Team. Doc 11-7.(February 2013)
72Kevyn Orr, Emergency Manager for the City of Detroit. Recommendation Pursuant to Section 18(1) of PA 436. Doc 11-10(July 2013)
73 Governor Rick Snyder. Authorization to Commence Chapter 8 Bankruptcy Proceedings. Doc 11-11(July 2013)74 City of Detroit: Alternative Plan of Adjustment Proposal. Prepared by Houlihan Lokey. (September 2013)75 City of Detroit – Restructuring Plan; Mayor’s Implementation Progress Report. (March 2013)76 McKinsey Repot on City of Detroit. As posted on the City of Detroit website (May 2011)
77Report prepared by: Sekely, C.(Conway MacKenzie, Inc.), Redmond, C.(Pierce Monroe & Assoc., LLC), Hutchings, C. (Municipal Parking Department). Titled "Revenue Enhancement Actions For Parking Violations Bureau"(December 2013)
78 0%
79Kevyn Orr, Emergency Manager, City of Detroit. "Order No. 24: Order to Amend Chapter 55 of the 1984 Detroit City Code"(April 2014)
80 Memorandum in Support of Statement of Qualifications Pursuant to Section 109 (81 Order Appointing Expert Witness. Docket #421582 Notice Regarding Interviews of Expert Witness Applicants, Docket #4068

# Document/SourceExhibit 2
83 Docket # 4216, Order Appointing Non-Testifying Consultant84 Transcript of Hearing, April 18, 2014(April 18, 2014)85 Milliman Letter Re: City of Detroit Active Health Plan Projections (November 2014)
86NASRA Issue Brief: “Public Pension Plan Investment Return Assumptions”; April 2014; original source: U.S. Census Bureau
87 Milliman, Inc. letter(April 17, 2014)88 Milliman, Inc. letter(April 20, 2014)89 Milliman, Inc. letter(April 23, 2014)90 Milliman, Inc. letter(April 25, 2014)91 Milliman, Inc. letter(May 7, 2014)92 Milliman, Inc. letter(July 2014)93 Milliman, Inc. letter(November 2, 2013)94 Milliman, Inc. letter(November 3, 2013)95 Milliman, Inc. letter(July 9, 2014)
96The Blinken Report- Strengthening the Security of Public Sector Defined Benefit Plans, dated January 2014. Donald J Boyd and Peter J Kiernan
97 The Society of Actuaries “Report of the Blue Ribbon Panel on Public Pension Plan Funding”; February 201498 Governmental Accounting Standards Board
99Memorandum in Support of Statement of Qualifications Pursuant to Section 109 (c) of the Bankruptcy Code. Docket No 14(July 2013)
100 State of Michigan Enrolled House Bill No. 5566 (June 2014)101 State of Michigan Enrolled House Bill No. 5567(June 2014)102 State of Michigan Enrolled House Bill No. 5568(June 2014)103 State of Michigan Enrolled House Bill No. 5569(June 2014)104 State of Michigan Enrolled House Bill No. 5570(June 2014)105 State of Michigan Enrolled House Bill No. 5573(June 2014)106 State of Michigan Enrolled House Bill No. 5574(June 2014)107 State of Michigan Enrolled House Bill No. 5575(June 2014)108 State of Michigan Enrolled House Bill No. 5576(June 2014)109 State of Michigan Enrolled House Bill No. 5600(June 2014)
110Deposition of Gaurav Malhorta, of Ernst & Young LLP; in re: City of Detroit, Michigan Case No. 13-53846(September 9, 2013)
111Deposition of Gaurav Malhorta, of Ernst & Young LLP; in re: City of Detroit, Michigan Case No. 13-53846(September 20, 2013)
112Deposition of Gaurav Malhorta, of Ernst & Young LLP; in re: City of Detroit, Michigan Case No. 13-53846(December 11, 2013)
113 Deposition of Gaurav Malhorta, of Ernst & Young LLP; in re: City of Detroit, Michigan Case No. 13-53846(March 31, 2014)
114 Comprehensive Annual Financial Report, City of Detroit FYE June 30, 2012115 City of Detroit, IT Optimization Discussion Document (August, 2013)116 FAB Financial Subcommittee Meeting (January 2014)117 ERP Needs Assessment: City of Detroit. Prepared by Plante Moran118 ERP Cost Analysis119 HR Technology Assessment, City of Detroit (December 2013)120 Plan of Adjustment (May 2014)121 Plan of Adjustment (July 2014)122 PVB Revenue Enhancement White Paper (December 2013)123 NASRA Issue Brief titled "Public Pension Plan Investment Return Assumptions" (April 2014)124 "The Tipping Point" by Malcom Gladwell (2000)125 Yale Law Journal Publication titled "The New Minimal Cities" (March 2013)

Exhibit 3
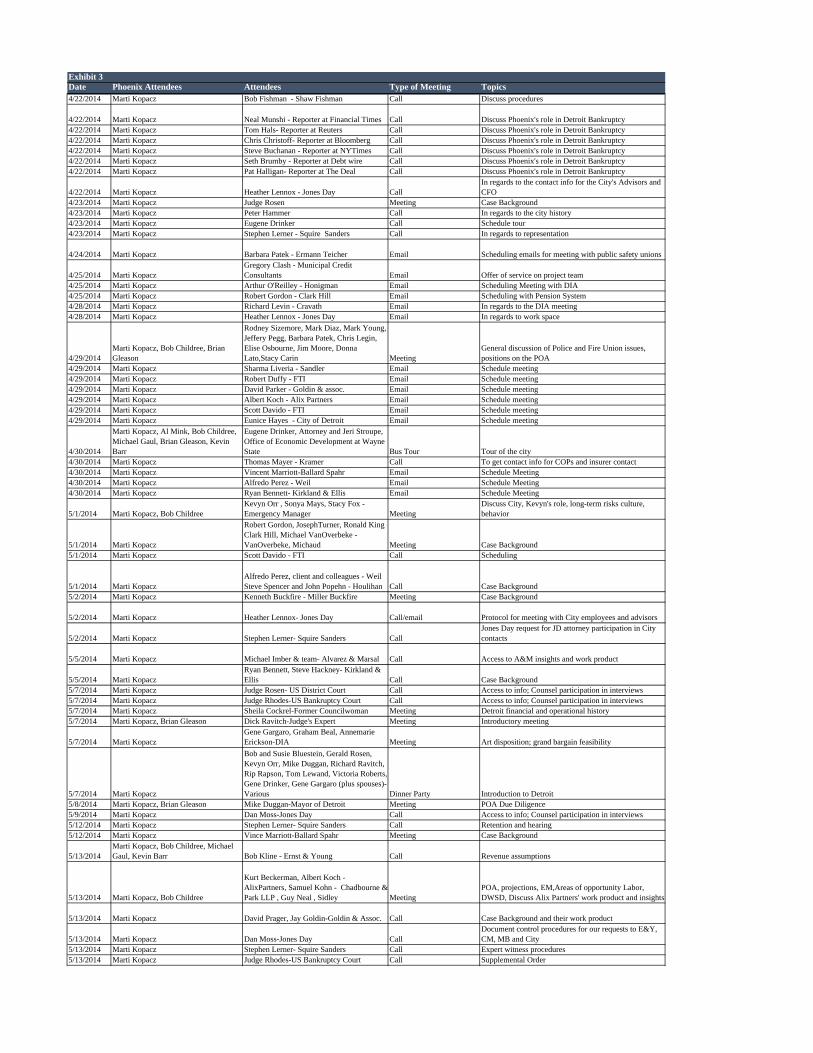
Exhibit 3Date Phoenix Attendees Attendees Type of Meeting Topics4/22/2014 Marti Kopacz Bob Fishman - Shaw Fishman Call Discuss procedures
4/22/2014 Marti Kopacz Neal Munshi - Reporter at Financial Times Call Discuss Phoenix's role in Detroit Bankruptcy4/22/2014 Marti Kopacz Tom Hals- Reporter at Reuters Call Discuss Phoenix's role in Detroit Bankruptcy4/22/2014 Marti Kopacz Chris Christoff- Reporter at Bloomberg Call Discuss Phoenix's role in Detroit Bankruptcy4/22/2014 Marti Kopacz Steve Buchanan - Reporter at NYTimes Call Discuss Phoenix's role in Detroit Bankruptcy4/22/2014 Marti Kopacz Seth Brumby - Reporter at Debt wire Call Discuss Phoenix's role in Detroit Bankruptcy4/22/2014 Marti Kopacz Pat Halligan- Reporter at The Deal Call Discuss Phoenix's role in Detroit Bankruptcy
4/22/2014 Marti Kopacz Heather Lennox - Jones Day CallIn regards to the contact info for the City's Advisors and CFO
4/23/2014 Marti Kopacz Judge Rosen Meeting Case Background4/23/2014 Marti Kopacz Peter Hammer Call In regards to the city history4/23/2014 Marti Kopacz Eugene Drinker Call Schedule tour4/23/2014 Marti Kopacz Stephen Lerner - Squire Sanders Call In regards to representation
4/24/2014 Marti Kopacz Barbara Patek - Ermann Teicher Email Scheduling emails for meeting with public safety unions
4/25/2014 Marti KopaczGregory Clash - Municipal Credit Consultants Email Offer of service on project team
4/25/2014 Marti Kopacz Arthur O'Reilley - Honigman Email Scheduling Meeting with DIA4/25/2014 Marti Kopacz Robert Gordon - Clark Hill Email Scheduling with Pension System4/28/2014 Marti Kopacz Richard Levin - Cravath Email In regards to the DIA meeting4/28/2014 Marti Kopacz Heather Lennox - Jones Day Email In regards to work space
4/29/2014Marti Kopacz, Bob Childree, Brian Gleason
Rodney Sizemore, Mark Diaz, Mark Young, Jeffery Pegg, Barbara Patek, Chris Legin, Elise Osbourne, Jim Moore, Donna Lato,Stacy Carin Meeting
General discussion of Police and Fire Union issues, positions on the POA
4/29/2014 Marti Kopacz Sharma Liveria - Sandler Email Schedule meeting4/29/2014 Marti Kopacz Robert Duffy - FTI Email Schedule meeting4/29/2014 Marti Kopacz David Parker - Goldin & assoc. Email Schedule meeting4/29/2014 Marti Kopacz Albert Koch - Alix Partners Email Schedule meeting4/29/2014 Marti Kopacz Scott Davido - FTI Email Schedule meeting4/29/2014 Marti Kopacz Eunice Hayes - City of Detroit Email Schedule meeting
4/30/2014
Marti Kopacz, Al Mink, Bob Childree, Michael Gaul, Brian Gleason, Kevin Barr
Eugene Drinker, Attorney and Jeri Stroupe, Office of Economic Development at Wayne State Bus Tour Tour of the city
4/30/2014 Marti Kopacz Thomas Mayer - Kramer Call To get contact info for COPs and insurer contact4/30/2014 Marti Kopacz Vincent Marriott-Ballard Spahr Email Schedule Meeting4/30/2014 Marti Kopacz Alfredo Perez - Weil Email Schedule Meeting4/30/2014 Marti Kopacz Ryan Bennett- Kirkland & Ellis Email Schedule Meeting
5/1/2014 Marti Kopacz, Bob ChildreeKevyn Orr , Sonya Mays, Stacy Fox - Emergency Manager Meeting
Discuss City, Kevyn's role, long-term risks culture, behavior
5/1/2014 Marti Kopacz
Robert Gordon, JosephTurner, Ronald King -Clark Hill, Michael VanOverbeke - VanOverbeke, Michaud Meeting Case Background
5/1/2014 Marti Kopacz Scott Davido - FTI Call Scheduling
5/1/2014 Marti KopaczAlfredo Perez, client and colleagues - Weil Steve Spencer and John Popehn - Houlihan Call Case Background
5/2/2014 Marti Kopacz Kenneth Buckfire - Miller Buckfire Meeting Case Background
5/2/2014 Marti Kopacz Heather Lennox- Jones Day Call/email Protocol for meeting with City employees and advisors
5/2/2014 Marti Kopacz Stephen Lerner- Squire Sanders CallJones Day request for JD attorney participation in City contacts
5/5/2014 Marti Kopacz Michael Imber & team- Alvarez & Marsal Call Access to A&M insights and work product
5/5/2014 Marti KopaczRyan Bennett, Steve Hackney- Kirkland & Ellis Call Case Background
5/7/2014 Marti Kopacz Judge Rosen- US District Court Call Access to info; Counsel participation in interviews5/7/2014 Marti Kopacz Judge Rhodes-US Bankruptcy Court Call Access to info; Counsel participation in interviews5/7/2014 Marti Kopacz Sheila Cockrel-Former Councilwoman Meeting Detroit financial and operational history5/7/2014 Marti Kopacz, Brian Gleason Dick Ravitch-Judge's Expert Meeting Introductory meeting
5/7/2014 Marti KopaczGene Gargaro, Graham Beal, Annemarie Erickson-DIA Meeting Art disposition; grand bargain feasibility
5/7/2014 Marti Kopacz
Bob and Susie Bluestein, Gerald Rosen, Kevyn Orr, Mike Duggan, Richard Ravitch, Rip Rapson, Tom Lewand, Victoria Roberts, Gene Drinker, Gene Gargaro (plus spouses)-Various Dinner Party Introduction to Detroit
5/8/2014 Marti Kopacz, Brian Gleason Mike Duggan-Mayor of Detroit Meeting POA Due Diligence5/9/2014 Marti Kopacz Dan Moss-Jones Day Call Access to info; Counsel participation in interviews5/12/2014 Marti Kopacz Stephen Lerner- Squire Sanders Call Retention and hearing5/12/2014 Marti Kopacz Vince Marriott-Ballard Spahr Meeting Case Background
5/13/2014Marti Kopacz, Bob Childree, Michael Gaul, Kevin Barr Bob Kline - Ernst & Young Call Revenue assumptions
5/13/2014 Marti Kopacz, Bob Childree
Kurt Beckerman, Albert Koch - AlixPartners, Samuel Kohn - Chadbourne &Park LLP , Guy Neal , Sidley Meeting
POA, projections, EM,Areas of opportunity Labor, DWSD, Discuss Alix Partners' work product and insights
5/13/2014 Marti Kopacz David Prager, Jay Goldin-Goldin & Assoc. Call Case Background and their work product
5/13/2014 Marti Kopacz Dan Moss-Jones Day CallDocument control procedures for our requests to E&Y, CM, MB and City
5/13/2014 Marti Kopacz Stephen Lerner- Squire Sanders Call Expert witness procedures5/13/2014 Marti Kopacz Judge Rhodes-US Bankruptcy Court Call Supplemental Order

Exhibit 3Date Phoenix Attendees Attendees Type of Meeting Topics
5/14/2014Marti Kopacz, Michael Gaul, Brian Gleason, Kevin Barr
Juan Santambrogio and Gaurav Malhotra - Ernst & Young Call 10 year - 40 Year plan
5/14/2014Marti Kopacz, Bob Childree, Michael Gaul, Brian Gleason, Kevin Barr
Stephen Lerner and Scott King - Squire Sanders Call
Instructions re: document control; access to E&Y working model
5/14/2014 Marti Kopacz, Brian Gleason Mike Duggan & staff-City of Detroit Meeting Attend Cabinet meeting
5/14/2014 Marti Kopacz, Brian GleasonRip Rapson, Laura Trudeau-Kresge Foundation Meeting Detroit Future Cities, Grand Bargain due diligence
5/15/2014 Marti Kopacz Richard Ravitch-Judge's Expert Call Engagement Update
5/19/2014 Marti KopaczJames Craig and Lesley Warmuth -Chief of Police and Pepper Hamilton Meeting Background interview re: Police Department
5/19/2014 Marti Kopacz Richard Ravitch-Judge's Expert Meeting Pensions
5/20/2014 Marti Kopacz Dan Dirks and team-DDOT Director Meeting Background interview re: Transportation Department5/20/2014 Marti Kopacz Stacy Fox-Deputy EM Meeting Information Requests Outstanding
5/20/2014 Marti KopaczChuck Moore and Glenn Kushiner-Conway Mackenzie Meeting Pensions
5/20/2014 Marti Kopacz, Brian Gleason Stephen Lerner- Squire Sanders Call Information Requests Outstanding
5/21/2014Marti Kopacz, Michael Gaul, Brian Gleason Mayor Duggan and Cabinet-City of Detroit Meeting General POA discussion
5/22/2014 Marti Kopacz, Brian Gleason Stephen Lerner- Squire Sanders Call Information Requests Outstanding; Letter to Judge
5/22/2014 Marti Kopacz Gaurav Malhotra -Ernst & Young CallReturning my emails re: Information Request Outstanding and letter to the Judge
5/23/2014 Marti Kopacz Stephen Lerner- Squire Sanders CallFollow up on his conversations with Jones Day re: info requests
5/27/2014 Marti Kopacz Stephen Lerner- Squire Sanders Call Prep for hearing on Wednesday5/28/2014 Marti Kopacz, Brian Gleason Richard Ravitch-Judge's Expert Meeting Report development discussion
5/29/2014Marti Kopacz, Brian Gleason, Kevin Barr
Mike Imber, Nancy Zielke, Bill Roberti - Alvarez & Marsal, Marianna Marysheva - Martinez, Joe Nichols, David Lawrence - FTI Consulting, Ryan Bennett, Noah Ornstein - Kirkland & Ellis, Jennifer Rothschild - Rothschild, Steven Spencer, John Popehn, Michael Lin, John Pepehn, Daniel Mn - Houlihan Lokey, Alfredo Perez, Kelly DiBlasi, Dana Kaufman - Weil Meeting Review other financial advisors' inquiries and learnings
5/29/2014 Marti Kopacz Erica Ward-Land Bank Authority Call Blight5/30/2014 Marti Kopacz Melissa Smiley-City of Detroit Call Blight
6/2/2014Marti Kopacz, Michael Gaul, Brian Gleason
Judge Rhodes, Jones Day, and Squire Sanders Call Bankruptcy discovery transmission issues
6/2/2014Marti Kopacz, Michael Gaul, Brian Gleason Stephen Lerner - Squire Sanders Call Bankruptcy discovery transmission issues
6/3/2014 Marti Kopacz Richard Ravitch - Judge's Expert Call Catch up on case developments6/3/2014 Marti Kopacz Stephen Lerner - Squire Patton Boggs Call Update on document requests
6/3/2014 Marti Kopacz Erica Ward - Detroit Land Bank Authority Call Blight
6/3/2014Marti Kopacz, Michael Gaul, Brian Gleason
Kevin Hand & Glenn Kushiner - Conway Mackenzie, Gaurav Malhotra, Juan Santambrogia & Dan Jerneycic - Ernst & Young, Melissa Smiley - City of Detroit, & Jones Day Meeting 10 yr and 40 yr projections and reinvestment initiatives
6/3/2014 Marti Kopacz Barbara Patek - Ermann Teicher Call Schedule meeting with firefighters and police unions6/3/2014 Marti Kopacz Chris Leggio - Counsel to Firefighters Call Schedule meeting with firefighters6/3/2014 Marti Kopacz Sharon Levine - Lowenstein Sandler Email Schedule meeting with AFSCME
6/3/2014Marti Kopacz, Michael Gaul, Brian Gleason Jones Day, E&Y, CM Call Open Information Request list
6/4/2014 Marti Kopacz, Brian Gleason John Hill - City of Detroit/EM MeetingFollow up on conversation from Mayor's Cabinet meeting
6/5/2014 Marti Kopacz, Brian Gleason Mary Martin - City of Detroit Meeting Discuss Lean initiatives
6/5/2014 Marti Kopacz, Brian GleasonGaurav Malhotra - Ernst & Young, Chuck Moore - Conway Mackenzie Meeting POA Issues re: Feasibility
6/5/2014Marti Kopacz, Michael Gaul, Brian Gleason
Representatives of Detroit Land Bank Authority, CM, and Sonya Mays Meeting Blight remediation
6/5/2014Marti Kopacz, Michael Gaul, Brian Gleason Mayor Duggan & Staff Meeting Reconciliation of POA and Triennial Budget
6/6/2014 Marti Kopacz
Mayor Duggan, Melissa Smiley, Trish Stein, Tom Lewand - City of Detroit, Michelle - Consultant to Planning and Development Department Meeting
Budget review meeting for planning department and economic development
6/6/2014 Marti Kopacz Mike Imber - Alvarez & Marsal Call Inquired about report deadline extension6/6/2014 Marti Kopacz Chris Gannon - Conway Mackenzie Meeting BSEED restructuring initiatives
6/7/2014 Marti Kopacz
Mayor Duggan, Gary Brown, Melissa Smiley, Pam Scales - City of Detroit, Dan Dirks and team - DDOT - City of Detroit, Beth Niblock - ITS - City of Detroit, Ron Brundidge and team - DPW - City of Detroit, Beau Taylor and team - DLP - City of Detroit, Norman White and team - Parking - City of Detroit Meeting Budget reviews and POA reconciliation
6/9/2014 Marti Kopacz, Brian GleasonJudge Rhodes - US Bankruptcy Court, Stephen Lerner - Squire Patton Boggs Call Scheduling status
6/9/2014Marti Kopacz, Michael Gaul, Brian Gleason
Judge Rhodes, Jones Day, E&Y, CM, and Squire Sanders Call Bankruptcy discovery transmission issues

Exhibit 3Date Phoenix Attendees Attendees Type of Meeting Topics
6/10/2014 Marti Kopacz
Mayor Duggan, Melissa Smiley, Pam Scales,Law Department team - City of Detroit, Representatives of E&Y and CM Meeting Budget Review
6/10/2014 Marti Kopacz Brenda Jones, Stephen Grady - City Council Meeting Plan of Adjustment
6/11/2014 Marti Kopacz
Mayor, Melissa Smiley, Pam Scales, Chief Craig and team - City of Detroit, Representatives of E&Y and CM Meeting Budget Review
6/11/2014 Marti Kopacz, Brian Gleason
Judge Rosen - US District Court, Mediators -Various, Jones Day, E&Y, CM - Advisors to the City, Richard Ravitch - Judge Rhodes' Consultant, Stephen Lerner - Squire Patton Boggs (via phone) Meeting Feasibility for the POA
6/11/2014Marti Kopacz, Michael Gaul, Brian Gleason Mayor Duggan & Staff Meeting Departmental meetings - DPD and DFD
6/12/2014 Marti Kopacz
Mark Diaz and team - DPOA, Barbara Patek - Counsel to DPOA, Richard Ravitch - Judge Rhodes' Consultant Meeting Police Department
6/12/2014 Marti Kopacz, Brian Gleason
Kevyn Orr - Emergency Manager, Stacy Fox- Office of the EM, Richard Ravitch - Judge Rhodes' Consultant Meeting Status of Assignment
6/12/2014 Marti Kopacz
John Hill - City of Detroit, Representatives of E&Y and CM, Leslie Warmuth - Pepper Hamilton, Richard Ravitch - Judge Rhodes' Consultant Meeting Review Finance, Accounting and IT issues
6/14/2014 Marti KopaczHeather Lennox - Jones Day, Gaurav Malhotra - Ernst & Young Call New POA date and projections update
6/14/2014 Marti KopaczJudge Rhodes - US Bankruptcy Court, Stephen Lerner - Squire Patton Boggs Call Status on Report completion
6/16/2014 Marti Kopacz, Brian Gleason Richard Ravitch - Judge Rhodes' Consultant MeetingWork on Report sections - Pensions and Post Confirmation Issues
6/17/2014 Marti Kopacz
Sharon Levine - Lowenstein Sandler, Stephen Kreiser - AFSCME, Richard Ravitch - Judge Rhodes' consultant Meeting Union issues
6/17/2014 Marti Kopacz, Brian GleasonKenneth Buckfire, Jim Doak and team - Miller Buckfire Meeting Update on Asset Dispositions and Exit Financing
6/18/2014 Marti KopaczStephen Lerner - Squire Patton Boggs, Geoff Stewart and others - Jones Day Call/email
Document production; "Big Issues" Meeting; projections v.11
6/19/2014
Marti Kopacz, Al Mink, Bob Childree, Michael Gaul, Brian Gleason, Kevin Barr
John Naglick, Glenn Kushiner, Dan Jerneycic, E&Y, Rick Drum, Accounting, Renee Shorts, budgets Call
Round table conference call to discuss state of the monthly reporting that the City is generating, and ability to do post emergence reporting against budget. Post call with Bob Childree
6/19/2014Marti Kopacz, Michael Gaul, Brian Gleason, Kevin Barr, Stephen Lerner
Juan Santambrogio and Gaurav Malhotra - Ernst & Young, Chuck Moore and Glenn Kushiner - Conway Mackenzie, Jones Day Team Meeting "Big Issues" Meeting and feasibility assessment
6/19/2014 Marti Kopacz Noah Ornstein - Kirkland & Ellis Call Inquiry re: confirmation issues for creditors
6/20/2014 Marti Kopacz, Brian Gleason Melissa Smiley - City of Detroit Call New projections and impact on Mayor's Budget Reviews
6/24/2014 Marti Kopacz
Mayor, Melissa Smiley, Pam Scales, Brad Dick and team - City of Detroit, Representatives of E&Y and CM Meeting Budget Review Meeting for GSD
6/24/2014 Marti Kopacz Mike Imber - Alvarez & Marsal Call Inquiry re: contingency provisions in HB 5567
6/24/2014 Marti Kopacz Melissa Smiley - City of Detroit CallDiscuss financial requirements in Grand Bargain legislation
6/25/2014 Marti KopaczMelissa Smiley - City of Detroit, Dan Jerneycic - Ernst & Young Call Utility cost estimates in POA projections
6/25/2014 Marti Kopacz Stephen Lerner - Squire Patton Boggs Call Information Requests6/26/2014 Marti Kopacz, Brian Gleason Prof. Scott Pryor - Regent University Call Ch. 9 feasibility article6/27/2014 Marti Kopacz Melissa Smiley - City of Detroit Call Future utility costs
6/30/2014 Marti Kopacz
Mayor, Melissa Smiley, Pam Scales, Dan Dirks and team - City of Detroit, Representatives of E&Y and CM Meeting Budget Review for DDOT
7/1/2014Marti Kopacz, Michael Gaul, Kevin Barr
Daniel Jerneycic - Ernst & Young, Chris Gannon - Conway Mackenzie Call 40 year revised draft projections discussion
7/2/2014 Marti Kopacz, Michael Gaul Melissa Smiley - City of Detroit Call New Projections Pending
7/2/2014Marti Kopacz, Michael Gaul, Brian Gleason Mayor Duggan & Staff Call Departmental meeting - DFD
7/3/2014 Marti Kopacz Mayor Cabinet Members - City of Detroit Meeting Mayor's weekly status meeting
7/9/2014 Marti Kopacz, Brian GleasonRichard Ravitch - Judge Rhodes' Consultant, Peter Kiernan - Shiff Hardin Meeting Revised projections and impact on feasibility
7/9/2014 Marti Kopacz Steven Hackney - Kirkland & Ellis Call District Court decision on wagering revenues
7/10/2014 Marti KopaczStephen Lerner - Squire Patton Boggs, Geoff Stewart - Jones Day Call/email Outstanding information requests
7/10/2014 Marti Kopacz Heather Lennox - Jones Day Call DWSD
7/14/2014 Marti Kopacz, Brian Gleason
Judge Rhodes - US Bankruptcy Court, Stephen Lerner - Squire Patton Boggs, Geoff Stewart - Jones Day Call Status call re: scheduling and report due date
7/16/2014Marti Kopacz, Michael Gaul, Brian Gleason, Kevin Barr Richard Ravitch - Judge Rhodes' Consultant Meeting Report development discussion
7/17/214 Marti Kopacz Stacy Fox-Deputy EM Call Requesting draft of report7/17/214 Marti Kopacz Melissa Smiley - City of Detroit Call Requesting draft of report

Exhibit 3
Date Phoenix Attendees Attendees Type of Meeting Topics
4/29/2014Al Mink, Bob Childree, Michael Gaul, Brian Gleason, Kevin Barr Barbara Patek Meeting Debrief on meeting with Fire and Police Unions
4/30/2014 Al Mink, Bob Childree John Hill CFO Meeting
Discussed John Hills vision for the Finance and Accounting function and the major issues he believes the Department faces
4/30/2014 Michael Gaul, Kevin BarrJuan Santambrogio and Daniel Jerneycic - Ernst & Young Meeting 10 Year Plan Development
5/1/2014 Al Mink, Bob Childree John Naglick, Finance Director Meeting
Issues facing the Finance department, specifically those departments reporting to John Hill. John walked us through his view of the status of each of the departments reporting to him.
5/2/2014 Michael Gaul, Kevin BarrKevin Hand, Chris Gannon and Glenn Kushiner - Conway Mackenzie Meeting
General Restructuring and Reinvestment discussion/development
5/5/2014 Al Mink Michael Jameson, Deputy Finance Director MeetingMeeting to discuss his views of the issues facing the departments reporting to John Hill.
5/5/2014 Al MinkGlenn Kushiner, Conway, Chris Gannon, Conway Meeting
Discussed finance department and begin to get into details. Discussed more specifics on each of the departments
5/5/2014 Al MinkGlenn Kushiner, Conway, Chris Gannon, Conway Meeting
Discussed their views of finance department and begin to get into details. Discussed more specifics on each of the departments
5/5/2014 Michael GaulKevin Hand, Chris Gannon and Glenn Kushiner - Conway Mackenzie Meeting
General Restructuring and Reinvestment discussion/development
5/6/2014 Al Mink, Bob ChildreeDonald Settles, Risk Manager, Glenn Kushiner, Conway Meeting
Overview and details of the Risk Management department. Discussed the existing structure, and restructuring alternatives being investigated including potentially outsourcing the Third party administration of Workers Comp and engaging a third party insurance policy to cover auto
5/6/2014 Al Mink, Bob Childree Gary Evanko, Glenn Kushiner Meeting
p ,Accepted reassessment plan, impact on forecasted revenues, and restructuring of the Assessors department
5/6/2014 Al Mink, Bob Childree Gary Evanko, Chief Assessor Meeting Property tax process, organization, issues, problems
5/6/2014 Al Mink, Bob ChildreeGlenn Kushiner and Chris Gannon - Conway Mackenzie Meeting DWSD, CFO restructuring, Plante Moran's role
5/7/2014 Michael Gaul, Kevin BarrKevin Hand and Emily Petrovski - Conway Mackenzie Meeting Fire and Rec Departments
5/7/2014 Kevin BarrChris Gannon and Emily Petrovski - ConwayMackenzie Meeting Ombudsperson and Mayors Office
5/7/2014 Al Mink, Bob ChildreeBoysie Jackson, Director Purchasing and Glenn Kushiner - Conway Mackenzie Meeting
Procurement processes, issues, contracts, personal services contracts, RFP process, people, POA,risks
5/7/2014 Al Mink, Bob ChildreePam Scales, Budget Director and Glenn Kushiner Meeting
Budget process, Staffing, organization, POA staffing, and issues
5/8/2014 Al Mink, Bob ChildreeBoise Jackson purchase director, Glenn Kushiner Meeting
Over view of the Purchasing department including restructuring initiatives, processing of contracts, approvals for expenditures
5/8/2014 Al Mink, Bob ChildreeGlenn Kushner, Pam Scales, Budget Director Meeting
the development of 2015 Budget submission to Council using the Budget in the plan of adjustment. Also discussed challenges in reporting against budget.
5/8/2014 Kevin BarrChris Gannon and Danielle Iafrate - Conway Mackenzie Meeting Police Department
5/8/2014 Kevin BarrKevin Hand and Emily Petrovski - Conway Mackenzie Meeting Blight
5/8/2014 Kevin Barr Todd Eddy - Conway Mackenzie Meeting General Services Department5/8/2014 Kevin Barr Todd Eddy - Conway Mackenzie Meeting 36th District Court and DDOT5/8/2014 Al Mink, Bob Childree Glenn Kushiner - Conway Mackenzie Meeting Conway's role, scope of work, issues
5/8/2014 Al Mink, Bob Childree Eric Higgs MeetingFinancial reporting, CAFR, Reporting post bankruptcy reconciliations , staffing issues
5/8/2014 Al Mink, Bob Childree Leighton Duncan and Glenn Kushiner MeetingTreasury functions, revenue collections outsourcing, organization, retention,
5/8/2014 Al Mink, Bob Childree Mark Lockridge, Auditor General Meetingaudits, internal controls, findings, organization , functions, issues
5/8/2014 Michael Gaul Juan Santambrogio - Ernst & Young Call 10 year - 40 Year plan
5/9/2014 Al Mink, Bob ChildreeLeighton Duncan, Project Manager, Treasury, and Glenn Kushner. Meeting
Discussed status of Treasury department functions and restructuring.
5/9/2014 Al Mink, Bob Childree Glenn Kushner MeetingDiscussed Conway activities; restructuring activities in departments and helping to implement changes.
5/9/2014 Al Mink, Bob ChildreeEric Higgs, Chief accounting officer, Glen Kushner. Meeting
Discuss the current activities of the Accounting department and the issues.
5/9/2014 Al Mink, Bob ChildreeMark Lockridge, Auditor General, Glenn Kushiner Meeting
Mark is going to provide us with audit reports on the Accounting and finance functions he has conducted in recent years.
5/9/2014 Kevin Barr Chris Gannon - Conway Mackenzie CallPlanning & Development, City Council and Building & License
5/9/2014 Kevin Barr Kevin Hand - Conway Mackenzie Call Airport5/9/2014 Kevin Barr Danielle Iafrate - Conway Mackenzie Call Law
5/9/2014 Al Mink, Bob ChildreeSonya Mays, Dan Sutton, Nakia Johnson, Chris Gannon - Conway Mackenzie Meeting Grants Management…projects, plans, timeframes,
5/12/2014 Al Mink Glenn Kushiner Meeting
Review global 10 year forecast spread sheets and then focused on the restructuring spreadsheets for each of the finance and accounting functions

Exhibit 3
Date Phoenix Attendees Attendees Type of Meeting Topics
5/12/2014 Al Mink
Michael Swartz, Plante Moran, Adam Rujan, Plante Moran, Laurie Zyla, Plant Moran, Glenn Kushiner, Chris Gannon, Sonya Mays,Nakia Johnson Meeting
Discuss status of new ERP proposal. Discuss with Michael Swartz, Plante Moran’s contribution to the Year End Closing process. Discuss issues with doing monthly financial statements.
5/12/2014 Al MinkGlenn Kushiner, Beth Niblock, CIO and Charles Dodd. Meeting
Overview of current status of Department and the vision for implementation of an integrated ERP System.
5/13/2014 Al Mink Glenn Kushiner Meeting10 year reorganization budget spreadsheets for the finance and accounting departments.
5/13/2014 Al Mink, Bob Childree Chris Gannon, Sonya Mays, Nakia Johnson MeetingDevelopment of the new Grants administration department.
5/13/2014 Al Mink Glenn Kushiner Meeting Review organization Chart.
5/14/2014 Al Mink Glenn Kushiner MeetingReview of Finance and Accounting pre-reorganization organization charts
5/14/2014Bob Childree, Michael Gaul, Brian Gleason, Kevin Barr
Juan Santambrogio, Gaurav Malhotra and Daniel Jerneycic - Ernst & Young Call Pension and OPEB Conversation
5/19/2014 Al Mink Glenn Kushiner MeetingMeeting to discuss centralization of Accounting and Finance
5/19/2014 Al Mink Dan Jerneycic, an Juan Santambrogio E&Y Meeting
Discuss E&Y Cash Flows and Cash flow procedures. Also discuss EM reports and discuss post emergence monthly reporting
5/19/2014 Al Mink, Kevin BarrJuan Santambrogio, Daniel Jerneycic and Nick Bugden - Ernst & Young Meeting Cash Forecasting
5/20/2014 Al Mink Glenn Kushiner Meeting Review Data Requests
5/21/2014 Al Mink, Bob ChildreeTanya Stoudemire, Income Tax Manager and Glenn Kushiner Meeting
Over view of the Income Tax Department, initiatives and plans for Restructuring
5/21/2014 Al Mink Niki Timmons MeetingReview process for submitting and following up on past due real real-estate submissions to Wayne County
5/21/2014 Al Mink, Bob Childree, Kevin BarrJuan Santambrogio and Daniel Jerneycic - Ernst & Young Meeting Cash Forecast vs. 10 Year Plan variance
5/21/2014 Bob Childree, Michael Gaul
Executive Director of GRS/PFRS, RS legal counsel, RS actuary, and RS financial advisor Meeting POA treatment re: Retirement Systems
5/27/2014 Al Mink Glenn Kushiner Call Conference call to discuss Payroll and Governance
5/28/2014 Al Mink Joel Kowalski MeetingCAFR audit. Review with him the 2012 management letter from KPMG
5/28/2014 Michael Gaul, Kevin BarrJuan Santambrogio and Nick Bugden - Ernst & Young Call Detailed 10 Year-40 Year Working Model Review
5/28/2014 Kevin BarrKevin Hand and Glenn Kushiner - Conway Mackenzie Call Deferred Reinvestments
5/29/2014 Al Mink Glenn Kushiner Call Conference call to discuss payroll5/30/2014 Michael Gaul Jones Day personnel Call Bankruptcy discovery transmission issues5/31/2014 Michael Gaul Brian Leatherman - Jones Day Call Bankruptcy discovery transmission issues
6/2/2014 Al Mink, Bob ChildreeNiki Timmons, Leighton Duncan, Glenn Kushiner Meeting Discuss Wayne County payments
6/2/2014 Al Mink, Bob Childree
Kyle Herman, Miller BuckfireKarl Sankey (not present), Leighton Duncan, Niki, Jeff Addison- Conway Mackenzie, Peter Baywold-Conway Mackenzie Meeting Wayne County Property tax issues, process
6/3/2014 Al Mink, Bob ChildreeUrsula Holland, Michael Hall, GlennKushiner Meeting Payroll systems and procedures
6/3/2014 Al Mink
Devin Patel, Jeffrey Addison from Conway, Geoffrey Stewart, Chris DiPompeo, Jones Day, Sheshian Swamnathan, E&Y Meeting Discuss Cash Reporting
6/3/2014 Al Mink, Bob ChildreeMike Hall, Ursula Holland , Glenn Kushiner Conway Mackenzie Meeting Payroll
6/3/2014 Al Mink, Bob Childree
Jeff Addison, Devin Patel - Conway Mackenzie, Jeff Stewart, Dan Jerneycic - E&Y Meeting
Cash flows, reconciliations, disburesements, A/P , encumbrances
6/3/2014 Michael GaulRepresentatives of Detroit Land Bank Authority Call Required funding for Blight remediation
6/4/2014 Al Mink, Bob Childree John Hill, John Naglick and Glenn Kushiner MeetingFinance Reorganization, CFO position, ERP, Payroll, monthly reporting
6/4/2014 Al Mink, Bob Childree Lena Willis, Boysie's deputy Meeting Encumbrances, A/P6/4/2014 Michael Gaul Derrick Puliam - Alpha Lit Call Bankruptcy discovery transmission issues
6/5/2014 Al Mink John Naglick, Glenn Kushiner Meeting Continue discussion on finance and accounting issues6/5/2014 Al Mink Larry King, Kevin Hand Meeting Work being performed on Accounting Organization
6/5/2014 Al Mink, Bob ChildreeLarry King and Chris Gannon - Conway Mackenzie Meeting Finance reorganization, Job descriptions, Hr
6/5/2014 Al Mink, Bob Childree John Naglick and Glenn Kushiner Meeting Financial reporting, 6/6/2014 Michael Gaul, Kevin Barr Derrick Puliam - Alpha Lit Call Bankruptcy discovery transmission issues
6/10/2014Bob Childree, Michael Gaul, Brian Gleason
Robert Gordon, Joe Turner, Michael , Ron King Call Retirement systems
6/10/2014Bob Childree, Michael Gaul, Brian Gleason, Kevin Barr
Evan Miller, Alexander Blanchard - Jones Day Call Pensions and OPEB
6/10/2014 Michael Gaul RS legal counsel Call Pension governance
6/11/2014 Kevin BarrKevin Hand and Emily Petrovski - Conway Mackenzie Meeting Fire Dept. Review
6/12/2014 Michael Gaul Tina Tolliver - DPD Meeting DPD RRI's
6/13/2014 Kevin BarrNick Bugden and Juan Santambrogio - Ernst & Young Call 10 Year model
6/13/2014 Michael Gaul Erica Raleigh - Data Driven Detroit Meeting Data gathering re: Detroit

Exhibit 3
Date Phoenix Attendees Attendees Type of Meeting Topics
6/17/2014 Kevin BarrKevin Hand and Emily Petrovski - Conway Mackenzie Call Fire Dept. Review
6/26/2014 Kevin BarrDaniel Jerneycic and Shavi Sarna - Ernst & Young Call Utilities

Exhibit 4

Phoenix Management Services, Inc.
In re: City of Detroit, Michigan, Debtor Case No. 13-53846
Open Information Requests as of July 18, 2014
REQUESTED PARTY
DATE REQUESTED
DATA REQUESTED STATUS
OUTSTANDING REQUESTS Jones Day 6/10/14 Any stochastic or sensitivity
analyses undertaken by City advisors or advisors to the Retirement Systems relevant to use of a 6.75% investment return assumption for GRS.
Ernst & Young 5/21/14 Comparison of the Revenue and
Expenditures as reported on E&Y’s Actual Cash Flow reports for the fiscal years 2012 and 2013 against the completed CAFR
Ernst & Young 5/29/14 Pension: All pension plan
sensitivity analyses; including, those that look at how changes in investment returns impact unfunded level
Received for PFRS; not received for GRS
Ernst & Young 5/29/14 Pension: Sensitivities on how
different pension return rates impact the pension restoration provisions in the plan If none exist, please run Pensions UAAL calculation at 3%, 5%, 6%, and 8% assumed rate of return
Received for PFRS; not received for GRS
Ernst & Young 5/30/14 Actuary reports/analysis that
provide detailed support behind yearly contributions to pensions for active employees in the 40 Year Plan
Ernst & Young 5/29/14 Modified version of 10 Year Plan
that fully integrates CM’s Restructuring Initiatives within the departmental budgets – including the department-level detail of Restructuring deferrals

REQUESTED PARTY
DATE REQUESTED
DATA REQUESTED
STATUS
Ernst & Young
6/6/14 Detail of estimated post-BK professional fees (Jones Day, E&Y, AND CM) in POA forecasts
Conway MacKenzie 5/22/14 Reconciliation of 10 Year Plan and
City’s Triennial Budget
Conway MacKenzie 5/27/14 Status of Fox Lawson review of
White Book; anticipated changes to pay grades and classification post-petition; estimated Plan impact of said changes
Conway MacKenzie 5/27/14 Total budget - by line item - for
each department in Finance, Accounting and IT if Centralized Governance was approved. How much City wide the ten year plan envisions spending on IT, Accounting and Finance?
Conway MacKenzie 6/6/14 Detail of estimated post-BK
professional fees (Jones Day, E&Y, AND CM) in POA forecasts
Ernst & Young/CM 7/9/14 City employee headcount by
department– as of 6/30/14; gross payroll cost (excluding OT) for FYE 6/30/14; annualized gross payroll run rate (excl. OT) as of 6/30/14