expert panel process 2016 update - bureau of reclamation · the limiting factor weight by the look...
TRANSCRIPT

EXPERT PANEL PROCESS
2016 UPDATE
Presentation to Expert Panel Members Convened by the Upper Columbia Salmon Recovery Board and Regional Technical Team June 10th, 2015
Expert Panel Evaluation 2016 Overview
Updates: Roles of watershed groups and liaisons
Challenges to “Incorporating latest science
findings”
Contract for Coordination and PM support
Schedules
2008 FCRPS BiOp Collaboration Habitat Work Group
The Remand Collaboration Habitat Work Group (CHW), convened by NOAA (2006) included the Action Agencies and Pacific Northwest Sovereign states and tribes. The CHW recommended Expert Panels be convened for areas where salmon and steelhead were determined to be the most imperiled. The CHW recommended a process that would be administered by the Action Agencies and executed by the Expert Panels, which acknowledges a cause-and-effect linkage of habitat improvement actions to changes in habitat condition; and changes in habitat condition to changes in survival.

CHW Method
Expert Panels identify limiting factors for populations; estimate the current condition of each limiting factor; estimate the potential condition of each limiting factor; and estimate change in limiting factors as a result of implementing habitat improvement actions.
Action Agencies combine limiting factors into a single habitat condition score; combine habitat condition scores into a single habitat quality score for the population; translate habitat quality changes into survival; calculate survival using a formula developed by the CHW.
CHW Assumptions
Limiting factors are known for each population
Habitat actions directly affect habitat variables that limit the population
Habitat variables can be combined to describe local habitat conditions
Local habitat conditions can be combined to describe overall habitat quality for the entire population
Changes in overall habitat quality are directly linked to changes in freshwater survival
5
2009, 2012, 2016 Panels
The Expert Panels were formally convened in 2009 and again in 2012.
The timing of the 2016 workshop is consequent of the 2014 FCRPS BiOp.
The 2016, process will not change. However, we will convene the panels in two sessions, one each focused on the look back and the look forward.
The Action Agencies have conducted meetings like this one to discuss what will happen during those sessions and the work we need to do in advance.
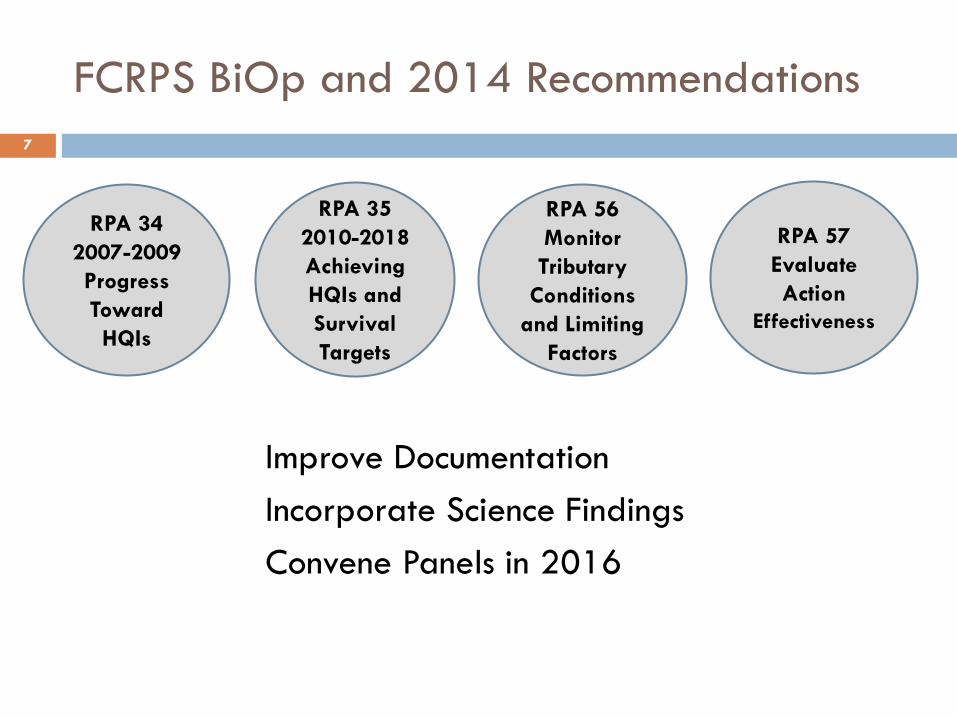
FCRPS BiOp and 2014 Recommendations
Improve Documentation Incorporate Science Findings Convene Panels in 2016
7
RPA 34 2007-2009 Progress Toward HQIs
RPA 35 2010-2018 Achieving HQIs and Survival Targets
RPA 56 Monitor Tributary
Conditions and Limiting
Factors
RPA 57 Evaluate Action
Effectiveness

Detailed Schedule
•
•
•
January – October 2015: Planning – Assemble Action Lists – Inventory of RME Data for Expert Panel Process – Compile RME Data Sources into Usable/Accessible Format
October – December 2015: Look Back Workshops – Evaluate Look Back List of Constructed Actions 2012-2015
January – May 2016: Look Forward Workshops – Changes to AU, Limiting Factors, and Bookend Values – Estimate Habitat Changes of 2016-2018 Look Forward Action Lists
“Look Back” and 2015 Work Session
Before the Expert Panels convene, participants determine whether planned actions were a) completed as planned, b) completed with additions or subtractions, c) not completed, or d) completed although they were not planned at the earlier workshop. The Expert Panel “look back” examines projects that were planned and completed and determines what was gained in terms of metric benefits for each limiting factor in an assessment unit. For the 2016 workshop we are building the look back lists now. We need your help. For the 2016 workshop we would like to develop project summary sheets for the look back projects to illustrate the suite of implemented actions and the metric benefits delivered for each limiting factor.
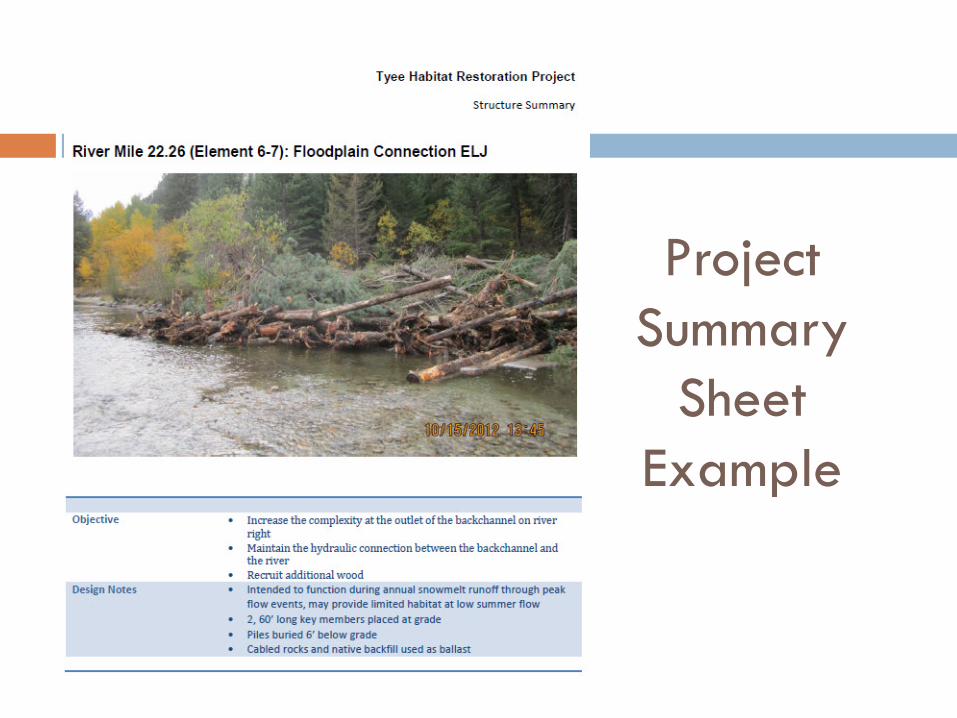
Project Summary
Sheet Example
“Look Forward” and 2016 Work Session
The “look forward” examines habitat improvement actions and associated metric benefits for the next implementation cycle (2016 to 2018).
Projects are evaluated for each limiting factor in each assessment unit and for each population.
For the 2016 workshops the look forward could involve modifying assessment units and weights and limiting factors and weights depending on their status or updated data and information.
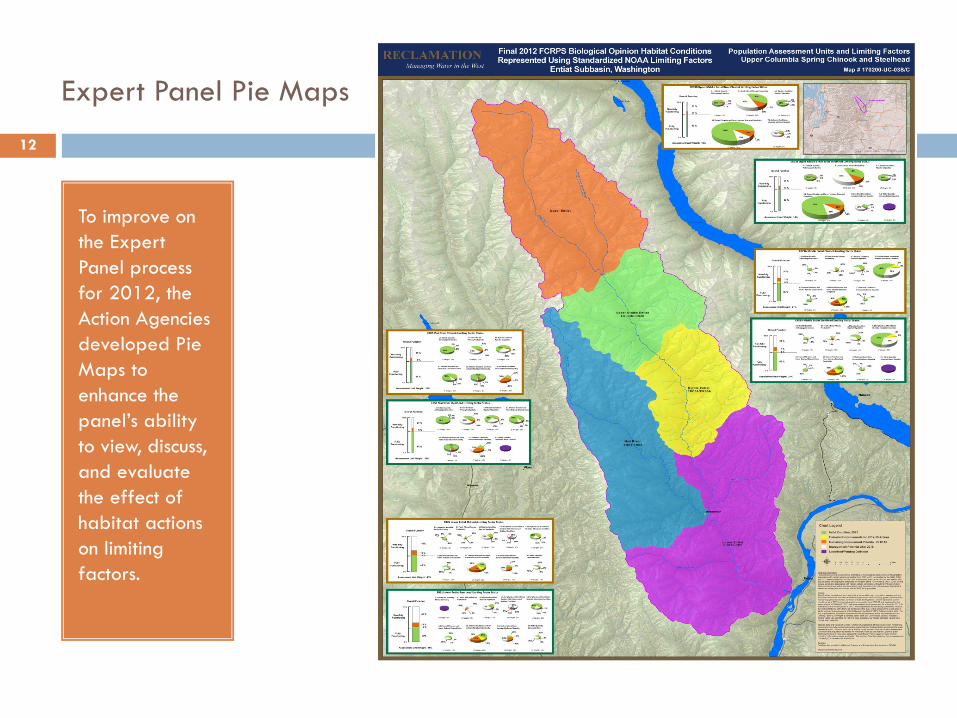
Expert Panel Pie Maps
To improve on the Expert Panel process for 2012, the Action Agencies developed Pie Maps to enhance the panel’s ability to view, discuss, and evaluate the effect of habitat actions on limiting factors.
12
13
Process and Framework for Incorporating Science
Responding to Recommendations in the 2014 BiOp Supplement the Action Agencies are working on a process and framework for identifying where data and information could be of value if available for the Expert Panel process.
Research, Monitoring and Evaluation (RM&E)
Habitat Information Resources for
Upper Columbia Spring Chinook
Presented for The FCRPS 2015 Expert Panel
Review Process
By Bonneville Power Administration
& United States Bureau of Reclamation
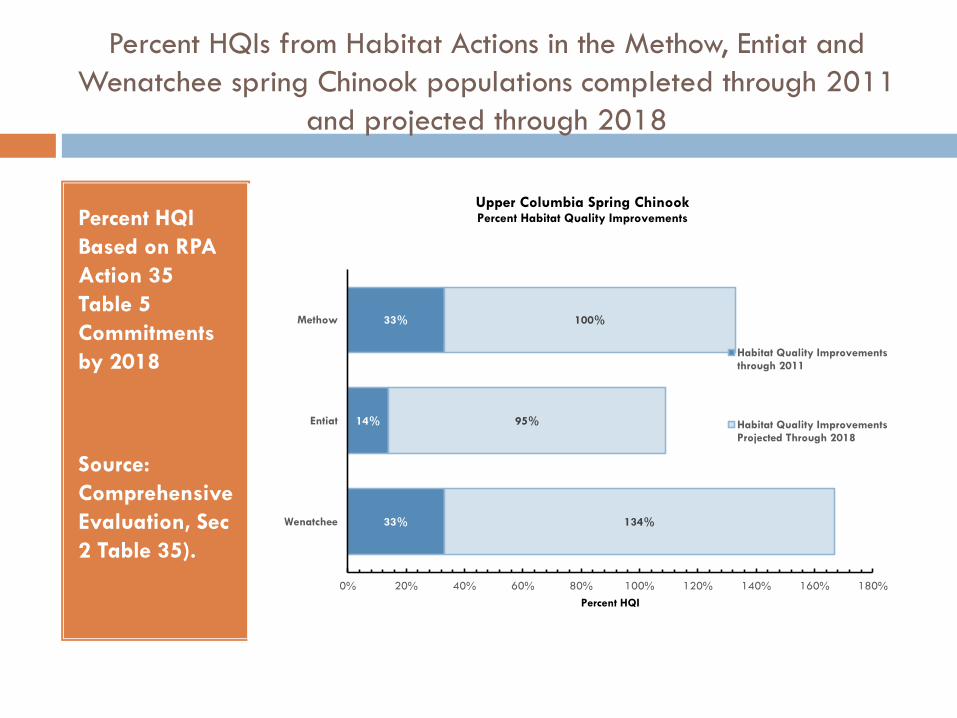
Percent HQIs from Habitat Actions in the Methow, Entiat and Wenatchee spring Chinook populations completed through 2011
and projected through 2018
Percent HQI Based on RPA Action 35 Table 5 Commitments by 2018
Source: Comprehensive Evaluation, Sec 2 Table 35).
33%
14%
33%
134%
95%
100%
0% 20% 40% 60% 80% 100% 120% 140% 160% 180%
Wenatchee
Entiat
Methow
Percent HQI
Upper Columbia Spring Chinook Percent Habitat Quality Improvements
Habitat Quality Improvementsthrough 2011
Habitat Quality ImprovementsProjected Through 2018

Methow MPG
AU Code Assessment Unit Assessment Unit Weight
(%) 2013-2018
Planned Restoration Actions MEC1 Beaver / Bear Creek 1.6 34 MEC2 Early Winters Creek 1.6 1
MEC4A Gold Creek 1.7 3 MEC4B Libby Creek 0.8 4 MEC5 Lower Chewuch 20.8 27
MEC6A Lower Methow 9.0 5 MEC6B Black Canyon 0.1 2 MEC7 Lower Twisp 8.5 47
MEC8A Middle Methow 15.9 76 MEC8B Upper-Middle Methow 4.9 12 MEC9 Upper Chewuch 7.9 4
MEC10A Upper Methow 15.5 9 MEC10B Lost River 3.2 0 MEC11 Upper Twisp 7.3 4 MEC12 Wolf Creek 1.2 5
Total 100.0 233
The Methow spring Chinook MPG contains 15 assessment units with 233 planned restoration actions within 14 of those units. The priority for assembling existing RM&E resource needs for the expert panel follows the intersection of planned actions with limiting factors that will be addressed in 14 assessment units.
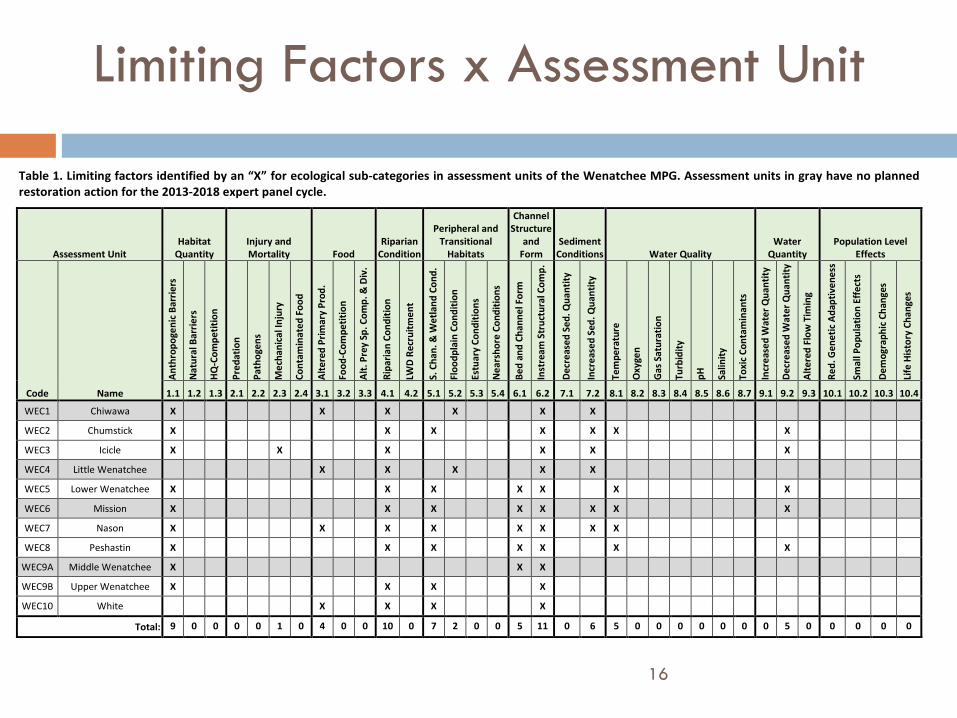
Limiting Factors x Assessment Unit
16
: 9 0
Table 1. Limiting factors identified by an “X” for ecological sub-categories restoration action for the 2013-2018 expert panel cycle.
in assessment units of the Wenatchee MPG. Assessment units in gray have no planned
Assessment Unit Habitat
Quantity Injury and Mortality Food
Riparian Condition
Peripheral and Transitional
Habitats
Channel Structure
and Form
Sediment Conditions Water Quality
Water Quantity
Population Level Effects
Code Name
Anth
ropo
geni
c Bar
riers
Nat
ural
Bar
riers
HQ-C
ompe
titio
n
Pred
atio
n
Path
ogen
s
Mec
hani
cal I
njur
y
Cont
amin
ated
Foo
d
Alte
red
Prim
ary
Prod
.
Food
-Com
petit
ion
Alt.
Prey
Sp.
Com
p. &
Div
.
Ripa
rian
Cond
ition
LWD
Recr
uitm
ent
S. C
han.
& W
etla
nd C
ond.
Floo
dpla
in C
ondi
tion
Estu
ary
Cond
ition
s
Nea
rsho
re C
ondi
tions
Bed
and
Chan
nel F
orm
Inst
ream
Str
uctu
ral C
omp.
Decr
ease
d Se
d. Q
uant
ity
Incr
ease
d Se
d. Q
uant
ity
Tem
pera
ture
Oxy
gen
Gas S
atur
atio
n
Turb
idity
pH
Salin
ity
Toxi
c Con
tam
inan
ts
Incr
ease
d W
ater
Qua
ntity
Decr
ease
d W
ater
Qua
ntity
Alte
red
Flow
Tim
ing
Red.
Gen
etic
Ada
ptiv
enes
s
Smal
l Pop
ulat
ion
Effe
cts
Dem
ogra
phic
Cha
nges
Life
Hist
ory
Chan
ges
1.1 1.2 1.3 2.1 2.2 2.3 2.4 3.1 3.2 3.3 4.1 4.2 5.1 5.2 5.3 5.4 6.1 6.2 7.1 7.2 8.1 8.2 8.3 8.4 8.5 8.6 8.7 9.1 9.2 9.3 10.1 10.2 10.3 10.4
WEC1 Chiwawa X X X X X X WEC2 Chumstick X X X X X X X WEC3 Icicle X X X X X X WEC4 Little Wenatchee X X X X X WEC5 Lower Wenatchee X X X X X X X WEC6 Mission X X X X X X X X WEC7 Nason X X X X X X X X WEC8 Peshastin X X X X X X X
WEC9A Middle Wenatchee X X X WEC9B Upper Wenatchee X X X X WEC10 White X X X X
Total 0 0 0 1 0 4 0 0 10 0 7 2 0 0 5 11 0 6 5 0 0 0 0 0 0 0 5 0 0 0 0 0
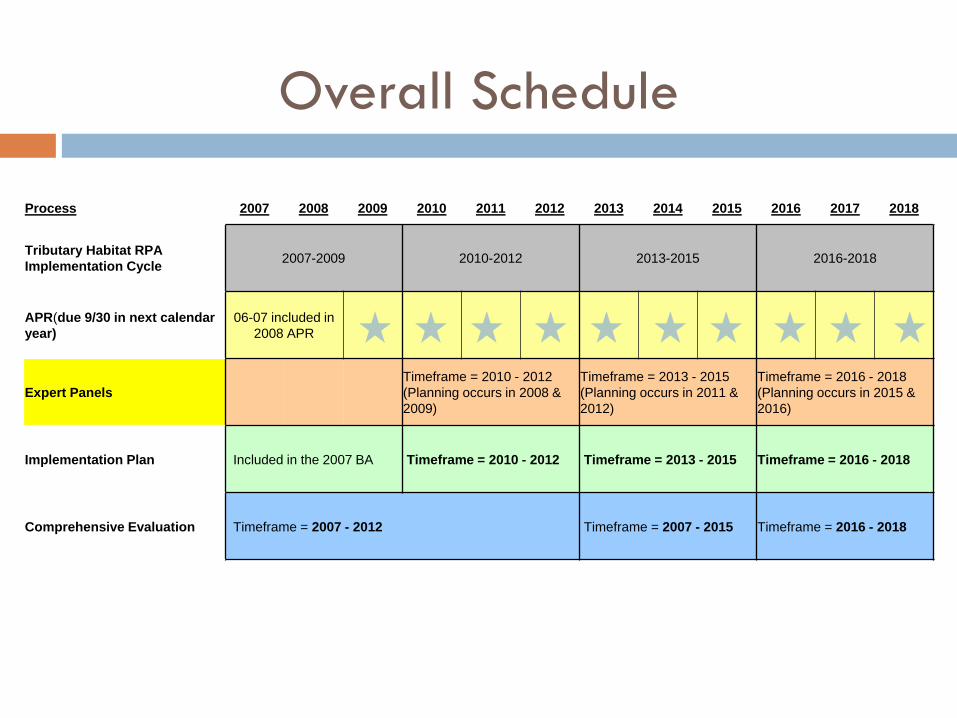
Overall Schedule
Process 2007 2008 2009 2010 2011 2012 2013 2014 2015 2016 2017 2018
Tributary Habitat RPA Implementation Cycle
APR(due 9/30 in next calendar year)
Expert Panels
Implementation Plan
Comprehensive Evaluation
2007-2009 2010-2012 2013-2015 2016-2018
06-07 included 2008 APR
in
Timeframe = 2010 -(Planning occurs in 2009)
2012 2008 &
Timeframe = 2013 -(Planning occurs in 2012)
2015 2011 &
Timeframe = 2016 -(Planning occurs in 2016)
2018 2015 &
Included in the 2007 BA Timeframe = 2010 - 2012 Timeframe = 2013 - 2015 Timeframe = 2016 - 2018
Timeframe = 2007 - 2012 Timeframe = 2007 - 2015 Timeframe
= 2016 - 2018
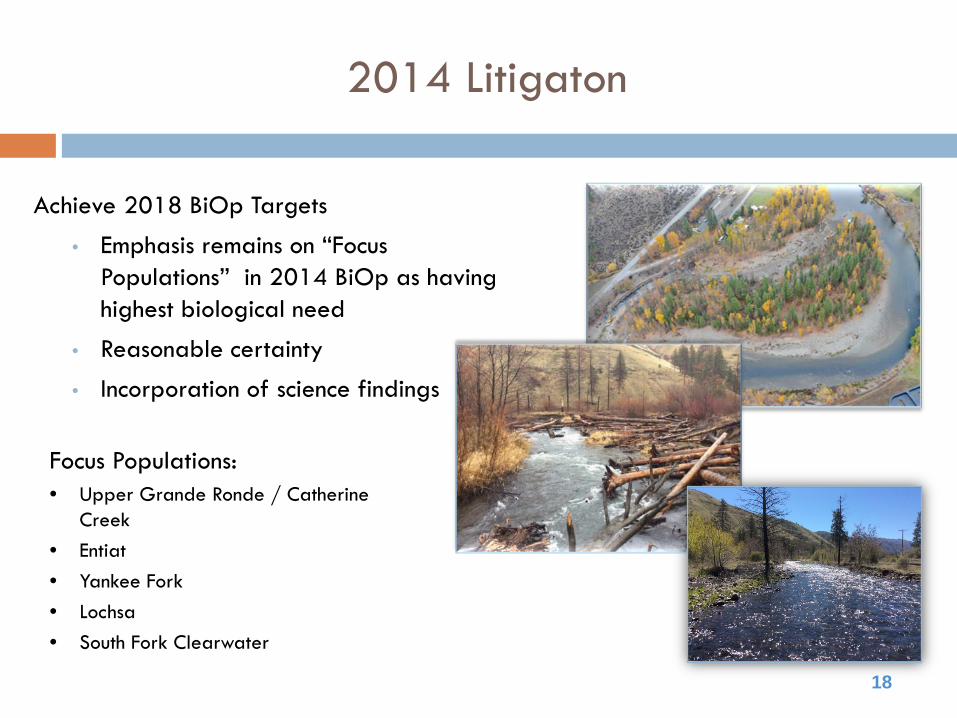
2014 Litigaton
Achieve 2018 BiOp Targets
• Emphasis remains on “Focus Populations” in 2014 BiOp as having highest biological need
• Reasonable certainty
• Incorporation of science findings
18
Focus Populations: • Upper Grande Ronde / Catherine
Creek • Entiat • Yankee Fork • Lochsa • South Fork Clearwater
Derivation of HQIs for Analysis of Effects
2007 Federal Columbia River Power System
Comprehensive Analysis
Appendix C: Analysis of Effects of Tributary Habitat Actions Understanding the Habitat Workgroup Approach to Estimating Habitat Quality
and Freshwater Survival

Appendix C: Comprehensive Analysis
Calculate “weighted current limiting factor condition”— by multiplying the limiting factor weight by the current limiting factor condition (low bookend) for each limiting factor. This calculation results in the overall current status of all limiting factors in an assessment unit without additional habitat improvement actions.
Calculate “weighted look back limiting factor condition”— by multiplying the limiting factor weight by the look back limiting factor condition associated with completed habitat improvement actions for each limiting factor. This calculation results in the overall status of all limiting factors in each assessment unit accounting for the habitat improvement actions evaluated by the Expert Panel.
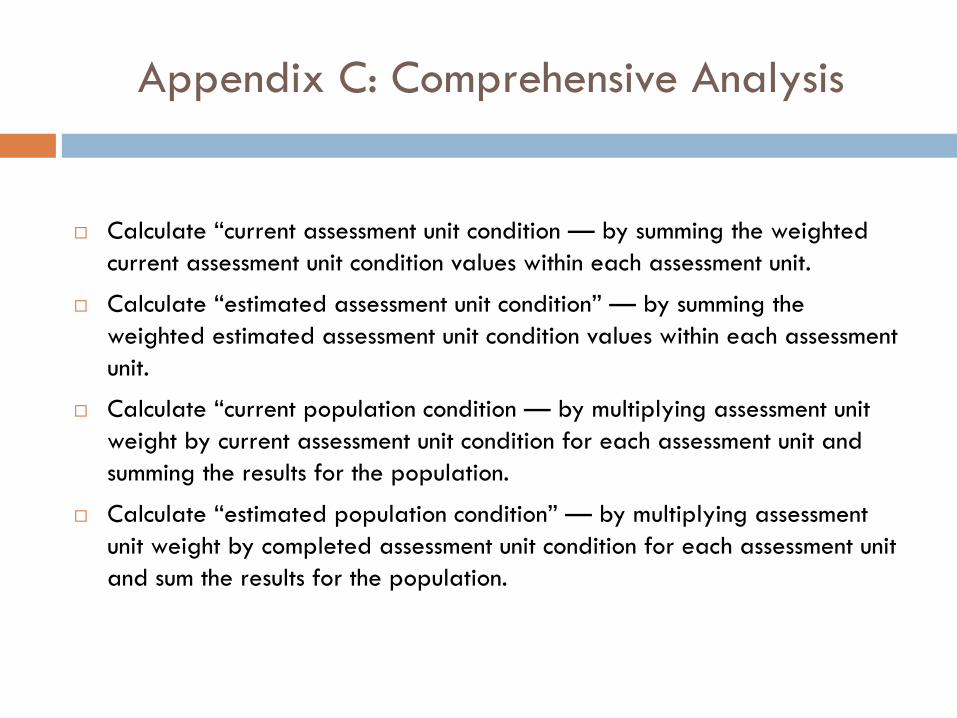
Appendix C: Comprehensive Analysis
Calculate “current assessment unit condition — by summing the weighted current assessment unit condition values within each assessment unit.
Calculate “estimated assessment unit condition” — by summing the weighted estimated assessment unit condition values within each assessment unit.
Calculate “current population condition — by multiplying assessment unit weight by current assessment unit condition for each assessment unit and summing the results for the population.
Calculate “estimated population condition” — by multiplying assessment unit weight by completed assessment unit condition for each assessment unit and sum the results for the population.

Appendix C: Comprehensive Analysis
Calculate “current habitat quality” — by multiplying the current population condition by the appropriate Chinook (0.0018) factor that converts condition to habitat quality.
Calculate “estimated habitat quality” — by multiplying the completed population condition by the appropriate Chinook (0.0018) factor that converts condition to habitat quality.
Calculate “percent change in habitat quality” — by dividing completed habitat quality by current habitat quality, subtract 1, and multiply by 100. The resulting HQI represents the benefits expected from implemented actions. The resulting HQI is added to the HQI projected during the prior Expert Panel and reflects the total HQI improvement from habitat improvement actions implemented to date.
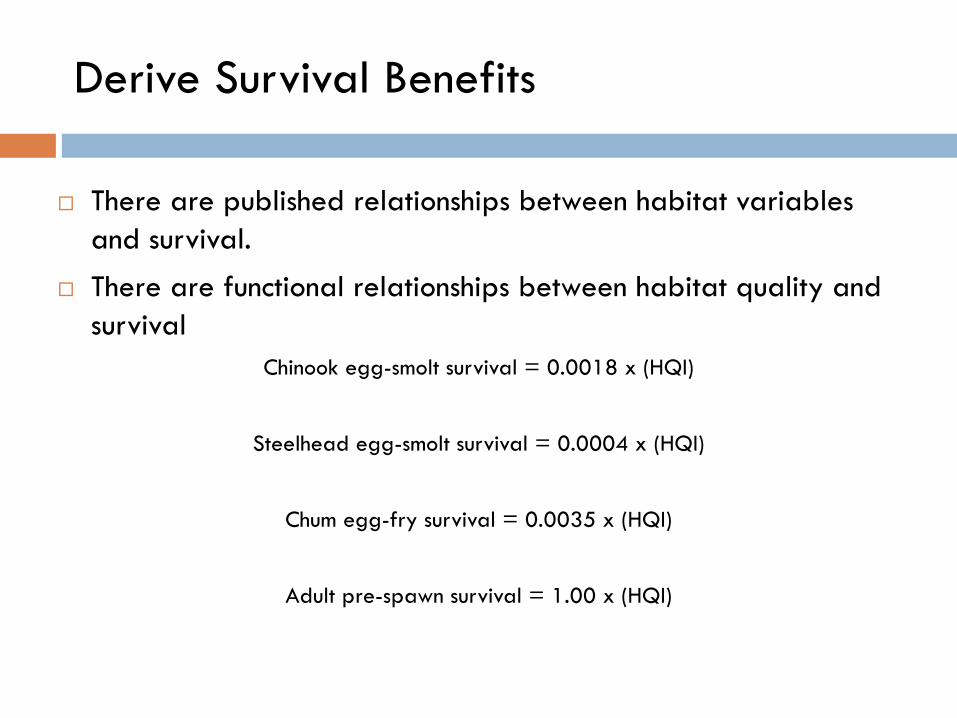
Derive Survival Benefits
There are published relationships between habitat variables and survival.
There are functional relationships between habitat quality and survival
Chinook egg-smolt survival = 0.0018 x (HQI)
Steelhead egg-smolt survival = 0.0004 x (HQI)
Chum egg-fry survival = 0.0035 x (HQI)
Adult pre-spawn survival = 1.00 x (HQI)
23