experimental study on rock deformation and …
TRANSCRIPT

EXPERIMENTAL STUDY ON ROCK DEFORMATION AND PERMEABILITY
VARIATION
A Thesis
by
JIHUI DING
Submitted to the Office of Graduate Studies of Texas A&M University
in partial fulfillment of the requirements for the degree of
MASTER OF SCIENCE
Chair of Committee, Ahmad Ghassemi Committee Members, Eduardo Gildin Stefan Hurlebaus Head of Department, A. Daniel Hill
August 2013
Major Subject: Petroleum Engineering
Copyright 2013 Jihui Ding

ii
ABSTRACT
The development of a petroleum reservoir would inevitably induce a
rearrangement of the in-situ stress field. The rearrangement of the stress field would then
bring about a deformation of the reservoir rock and a change of the permeability. This
experimental study was carried out to investigate rock deformation and its impact on
axial permeability. Triaxial compression tests were conducted on Berea sandstone,
Indiana limestone, Westerly granite and tuff specimens. Axial permeability was
continuously measured for Berea sandstone and Indiana limestone during triaxial
compression tests. The axial permeability of fractured Westerly granite specimens was
also measured during hydrostatic compression tests. Acoustic emission (AE) monitoring
was performed to help improve the understanding of rock deformation. Results showed
that Berea sandstone and Westerly granite were relatively brittle, while Indiana
limestone and tuff were relatively ductile. Rock deformation altered pore structures and
the change of pore structures considerably impacted fluid flow through rock. For porous
Berea sandstone and Indiana limestone, the destruction of the pore structure by rock
deformation led to a decrease in axial permeability. For tight Westerly granite, fractures
created by rock deformation significantly improved the ease of fluid flow. Acoustic
emission response was found to be strongly dependent on rock type. Brittle Berea
sandstone and Westerly granite produced high AE rates during compression tests, while
ductile Indiana limestone and tuff generated very low AE rates.

iii
DEDICATION
To my parents and my wife

iv
ACKNOWLEDGEMENTS
I would like to thank my committee chair, Dr. Ghassemi, and my committee
members, Dr. Gildin and Dr. Hurlebaus, for their guidance and support throughout the
course of this research. Special thanks to Dr. Ghassemi, who gave me generous support
in my graduate study.
I also want to thank Gary Stowe and Bruce R. Spears, who provided tremendous
help and expertise to my experimental setup. It was my great pleasure to work with them.
Special thanks to Dr. Sondergeld, who provided me with the opportunity to work in his
wonderful lab.
Thanks also go to my friends and colleagues and faculty and staff of petroleum
department for making my time at Texas A&M University a great experience.
Finally, thanks to my mother and father for their encouragement and to my wife
for her patience and love.

v
NOMENCLATURE
AE Acoustic Emission
DAQ Data Acquisition
LVDT Linear Variable Differential Transformer
Pc Confining Pressure
mD Millidarcy
nD Nanodarcy
𝜎1 Maximum Principal Stress
𝜎2 Intermediate Principal Stress
𝜎3 Minimum Principal Stress
𝜏 Shear Stress
𝜎 Normal Stress
vi
TABLE OF CONTENTS
Page
ABSTRACT .......................................................................................................................ii
DEDICATION ................................................................................................................. iii
ACKNOWLEDGEMENTS .............................................................................................. iv
NOMENCLATURE ........................................................................................................... v
TABLE OF CONTENTS .................................................................................................. vi
LIST OF FIGURES ........................................................................................................ viii
1. INTRODUCTION .......................................................................................................... 1
1.1 Problem statement .................................................................................................... 1 1.2 Literature review ...................................................................................................... 1 1.3 Objectives of this study .......................................................................................... 11
2. EXPERIMENTAL SETUP .......................................................................................... 12
2.1 General description of experimental setup ............................................................. 12 2.2 Triaxial rock testing system ................................................................................... 12
2.2.1 General description .......................................................................................... 12 2.2.2 Data acquisition ............................................................................................... 14
2.3 Permeability measurement system ......................................................................... 15 2.3.1 General description .......................................................................................... 15 2.3.2 Data acquisition ............................................................................................... 17
2.4 Acoustic emission monitoring system.................................................................... 18 2.4.1 General description .......................................................................................... 18 2.4.2 Data acquisition ............................................................................................... 19
3. EXPERIMENTAL PROCEDURE .............................................................................. 20
3.1 Specimen preparation ............................................................................................. 20 3.2 Triaxial compression test ....................................................................................... 20
3.2.1 Installation of loading platens and LVDT transducers .................................... 20 3.2.3 System leak check ........................................................................................... 22 3.2.3 Preloading of rock specimen ........................................................................... 23

vii
Page
3.3 Permeability measurement ..................................................................................... 23 3.3.1 System leak check ........................................................................................... 23 3.3.2 Air elimination ................................................................................................ 24 3.3.3 Rock specimen saturation ................................................................................ 24
3.4 Acoustic emission monitoring ................................................................................ 25 3.4.1 Threshold amplitude determination ................................................................. 25 3.4.2 Pencil lead break test ....................................................................................... 25
4. RESULTS & DISCUSSION ........................................................................................ 27
4.1 Sample description ................................................................................................. 27 4.2 Triaxial compression test ....................................................................................... 29
4.2.1 Berea sandstone ............................................................................................... 29 4.2.2 Indiana limestone ............................................................................................ 32 4.2.3 Westerly granite .............................................................................................. 36 4.2.4 Tuff .................................................................................................................. 38 4.2.5 Summary ......................................................................................................... 41
4.3 Permeability measurement ..................................................................................... 41 4.3.1 Berea sandstone ............................................................................................... 44 4.3.2 Indiana limestone ............................................................................................ 50 4.3.3 Westerly granite .............................................................................................. 55 4.3.4 Summary ......................................................................................................... 57
4.4 Acoustic emission monitoring ................................................................................ 57 4.4.1 Berea sandstone ............................................................................................... 58 4.4.2 Indiana limestone ............................................................................................ 61 4.4.3 Westerly granite .............................................................................................. 64 4.4.4 Tuff .................................................................................................................. 66 4.4.5 Summary ......................................................................................................... 68
5. CONCLUSION & RECOMMENDATION ................................................................. 69
REFERENCES ................................................................................................................. 71

viii
LIST OF FIGURES
Page
Fig. 1.1 Brittle-ductile transition of Wombeyan marble (a) Axial splitting under uniaixial compression, (b) single shear fracture under Pc = 3.5 MPa, (c) conjugate shear fracture under Pc = 35 MPa, (d) bulging under Pc = 100 MPa (Paterson, 1958)........................................................................................... 3
Fig. 1.2 Stress & AE activity versus strain for two rocks in uniaxial compression (a) Westerly granite; (b) Colorado rhyolite tuff (Scholz, 1968)................................ 7
Fig. 2.1 Photo of the experimental setup .......................................................................... 12
Fig. 2.2 Schematic diagram of GCTS triaxial rock testing system .................................. 13
Fig. 2.3 LVDT transducer calibrator ................................................................................ 14
Fig. 2.4 DAQ Software screen layout of triaxial rock testing system (GCTS) ................ 15
Fig. 2.5 Schematic diagram of permeability measurement system .................................. 16
Fig. 2.6 Loading platens with carved fluid diffusion channels ........................................ 17
Fig. 2.7 DAQ program screen layout of permeability measurement ............................... 17
Fig. 2.8 Schematic diagram of acoustic emission monitoring system ............................. 18
Fig. 2.9 DAQ Software screen layout of AE monitoring ................................................. 19
Fig. 3.1 Photo of rock specimen installed with loading platens and LVDT transducers . 21
Fig. 3.2 Detection of AE background noise ..................................................................... 26
Fig. 3.3 Pencil lead break test (five times) ....................................................................... 26
Fig. 4.1 Photos of rock specimens (from top left to bottom right: Berea sandstone, Indiana limestone, Westerly granite and tuff).................................................... 27
Fig. 4.2 Stress-strain curves at different confining pressures (Berea sandstone) ............. 30
Fig. 4.3 Combined differential stress-axial strain curves at different confining pressures (Berea sandstone) ............................................................................... 31
Fig. 4.4 Mohr circles and failure envelop (Berea sandstone) ........................................... 31

ix
Page
Fig. 4.5 Rock specimens after test (Berea sandstone) ...................................................... 32
Fig. 4.6 Stress-strain curves at different confining pressures (Indiana limestone) .......... 34
Fig. 4.7 Combined differential stress-axial strain curves at different confining pressures (Indiana limestone) ............................................................................ 35
Fig. 4.8 Mohr circles and failure envelop (Indiana limestone) ........................................ 35
Fig. 4.9 Rock specimens after test (Indiana limestone) ................................................... 36
Fig. 4.10 Stress-strain curves at different confining pressures (Westerly granite) .......... 37
Fig. 4.11 Combined differential stress-axial strain curves at different confining pressures (Westerly granite) ............................................................................. 38
Fig. 4.12 Rock specimens after test (Westerly granite) ................................................... 38
Fig. 4.13 Stress-strain curves at same confining pressures (tuff) ..................................... 39
Fig. 4.14 Combined differential stress-axial strain curves at same confining pressures (tuff) .................................................................................................................. 40
Fig. 4.15 Rock specimens after test (tuff) ........................................................................ 41
Fig. 4.16 Instantaneous stress rate during triaxial compression test ................................ 43
Fig. 4.17 Verification of axial permeability measurement with increasing stress ........... 44
Fig. 4.18 Differential stress and axial permeability versus strain (Berea sandstone Pc = 8.2 MPa) ........................................................................................................ 46
Fig. 4.19 Differential stress and axial permeability versus strain (Berea sandstone Pc = 18.5 MPa) ...................................................................................................... 47
Fig. 4.20 Differential stress and axial permeability versus strain (Berea sandstone Pc = 32.2 MPa) ...................................................................................................... 48
Fig. 4.21 Differential stress and axial permeability versus strain (Berea sandstone Pc = 45.9 MPa) ...................................................................................................... 49
Fig. 4.22 SEM images of Berea sandstone: Left, intact rock surface; Right, fracture rock surface (200x magnification) .................................................................... 50
x
Page
Fig. 4.23 Differential stress and axial permeability versus strain (Indiana limestone Pc = 10.9 MPa) ...................................................................................................... 52
Fig. 4.24 Differential stress and axial permeability versus strain (Indiana limestone Pc = 17.4 MPa) ...................................................................................................... 52
Fig. 4.25 Differential stress and axial permeability versus strain (Indiana limestone Pc = 30.2 MPa) ...................................................................................................... 53
Fig. 4.26 SEM images of Indiana limestone: Left, intact rock surface; Right, fracture rock surface (200x magnification) .................................................................... 54
Fig. 4.27 Hydrostatic pressure and axial permeability versus volumetric strain (Uniaxially fractured Westerly granite) ............................................................ 56
Fig. 4.28 Differential stress and AE rate versus axial strain (Berea sandstone Pc = 8.2 MPa) ................................................................................................................. 59
Fig. 4.29 Differential stress and AE rate versus axial strain (Berea sandstone Pc = 18.5 MPa) ......................................................................................................... 59
Fig. 4.30 Differential stress and AE rate versus axial strain (Berea sandstone Pc = 32.2 MPa) ......................................................................................................... 60
Fig. 4.31 Differential stress and AE rate versus axial strain (Berea sandstone Pc = 45.9 MPa) ......................................................................................................... 61
Fig. 4.32 Differential stress and AE rate versus axial strain (Indiana limestone Pc = 10.9 MPa) ......................................................................................................... 62
Fig. 4.33 Differential stress and AE rate versus axial strain (Indiana limestone Pc = 17.4 MPa) ......................................................................................................... 63
Fig. 4.34 Differential stress and AE rate versus axial strain (Indiana limestone Pc = 30.2 MPa) ......................................................................................................... 63
Fig. 4.35 Differential stress and AE rate versus axial strain (Westerly granite uniaxial compression) ..................................................................................................... 64
Fig. 4.36 Differential stress and AE rate versus axial strain (Westerly granite Pc = 6.9 MPa) ................................................................................................................. 65

xi
Page
Fig. 4.37 Differential stress and AE rate versus axial strain (Westerly granite Pc = 20.7 MPa) ......................................................................................................... 66
Fig. 4.38 Differential stress and AE rate versus axial strain (Tuff-3V Pc = 20.7 MPa) .. 67
Fig. 4.39 Differential stress and AE rate versus axial strain (Tuff-4V Pc = 20.7 MPa) .. 67
Fig. 4.40 Differential stress and AE rate versus axial strain (Tuff-1H Pc = 20.7 MPa) .. 68

1
1. INTRODUCTION
1.1 Problem statement
In petroleum engineering, the ultimate goal is to produce hydrocarbon from
subsurface in a systematic and economical way. Therefore the determination of the
permeability of reservoir rock is of great interest for petroleum engineers. Permeability
is an important parameter that is used to quantify the quality of reservoir during
exploration stage. Permeability is also a key input parameter for reservoir simulation,
which has significant impact on reservoir development strategy. As oil and gas is
extracted from underground, the rearrangement of in-situ stress field would inevitably
induce permeability variation. However, to determine rock permeability accurately is not
an easy job. Permeability not only depends on rock and fluid type, but also is a function
of stress state of reservoir rock. More studies are required to obtain a better
understanding of stress dependent permeability, which would be very beneficial to
reservoir development.
1.2 Literature review
Experimental study has been considered as an effective way to understand rock
behaviors in rock mechanics. In the early twentieth century, von Kármán (1911)
conducted the classic triaxial compression test on Carrara marble. In the so-called
“triaxial test”, a cylindrical rock specimen was confined by a constant fluid pressure and
compressed in the axial direction until rock failure occurs. It is not truly triaxial loading
since the intermediate and minimum principal stresses are both equal to confining

2
pressure (𝜎2 = 𝜎3 = 𝑃𝑐). However, the design of apparatus and operating procedure can
be relatively easily achieved in the laboratory. After later improvement and
modification, the triaxial test has become a standard rock testing technique in rock
mechanics. Several years later, Bӧker (1915) performed a different triaxial test on
Carrara marble. In his test, axial stress on cylindrical rock specimen was applied first
and kept constant, and then confining pressure was increased until rock failure occurs. In
this configuration, the maximum and intermediate stresses are equal to confining
pressure (𝜎1 = 𝜎2 = 𝑃𝑐).
Since then, extensive experimental studies have been carried out on different
types of rocks at various loading conditions to improve our understanding on rock
deformation. Handin and Hager Jr (1957) performed triaxial compression tests on 23 dry
sedimentary rocks of various types, including anhydrite, dolomite, limestone, sandstone,
shale and siltstone. These rocks were tested at room temperature at various confining
pressures. Despite each rock type exhibits some of unique deformational behaviors, all
the tested rocks show small increase in elasticity and yield stress, large increase in
ultimate strength with increasing confining pressure. For some rock types like anhydrite
and limestone, ductility is also enhanced by increasing confining pressure, while for
other rock types like silica-cemented sandstone; they still demonstrate considerable
brittle behavior at high confining pressure.
Numerous interests have been directed to the experimental study of brittle-ductile
transition of rock. Paterson (1958) conducted triaxial compression tests on coarse-
grained Wombeyan marble at various confining pressure up to about 100 MPa. As can

3
be seen in Fig. 1.1, uniaxial compression creates axial splitting fractures. Localized
shear fracture, such as single shear fracture and conjugate shear fractures, would be
developed as confining pressure increases. At very high confining pressure, deformation
would fairly uniformly distribute throughout rock specimen.
Fig. 1.1 Brittle-ductile transition of Wombeyan marble (a) Axial splitting under uniaixial compression, (b) single shear fracture under Pc = 3.5 MPa, (c) conjugate shear
fracture under Pc = 35 MPa, (d) bulging under Pc = 100 MPa (Paterson, 1958) Since fluid is often present in rock formations, numerous efforts have been made
on the study of the effect of fluid pressure on rock deformation. The most commonly
referred effective stress law is developed by Terzaghi (1923) which states that the
effective stress responsible for the mechanical behavior of rock is equal to the total stress
subtracted by fluid pressure. A number of rock properties are dependent on the effective
stress, including permeability, fracture strength, elastic modulus and wave velocity etc.
Brace and Martin (1968) conducted triaxial experiments on two types of crystalline
rocks of low porosity at various confining pressures, pore pressures and strain rates.

4
Comparison of fracture strengths at different experimental configurations allowed them
to test the validity of the effective stress law. They found that a critical loading rate
exists which is a function of rock type, fluid type and geometrical factors. Below this
critical loading rate, the law of effective stress holds true even for low porosity rocks.
Rock deformation would inevitably impact rock properties. One of these
properties that have attracted great interest is the transport property of rock formation, as
it is an important aspect of rock mining such petroleum exploration. The key parameter
for transport property of rock is permeability, which is observed to depend on stress
subjected on rock. Numerous experimental studies have been conducted to investigate
the effect of stress state on rock permeability. Brace et al. (1968) developed an
experimental setup for measuring permeability of Westerly granite using pulse decay
method. Water and argon were used as fluid medium. Various combinations of confining
and pore pressures were selected to yield an effective confining pressure up to 400 MPa.
It was found that Darcy’s law still holds for fluid flow in nanodarcy scale. The
permeability of Westerly granite varied markedly under different effective confining
pressure, ranging from 350 nD at 10 MPa effective confining pressure to about 4 nD at
400 MPa pressure. The strong dependence of permeability on effective confining
pressure implies that high pore pressure would make rock relatively more permeable.
Brace (1978) compiled fluid permeability data of different rock types from
literature and showed pronounced variation in stress dependent permeability for different
rock types. For low porosity rock such as Westerly granite, permeability first decreases
slightly with increasing stress in confined compression test, then it increases

5
dramatically as the sample is approaching failure. An increase of several-fold was
observed at around 80 percent of the fracture stress. For high porosity rock such as
Darley Dale sandstone, the permeability variation with increasing stress is similar to
granite, except that permeability prior to failure increases only 20 percent and for some
cases even drops a few percent. For granular aggregates, however, permeability
decreases dramatically with increasing confining pressure. It was found by Zoback and
Byerlee (1975); Zoback and Byerlee (1976) that the law of effective stress breaks down
for sand and sandstone based on the observations of hydrostatic and triaxial compression
tests. Experimental results also show that permeability of rocks containing joints or
fractures is highly sensitive to changes of effective stress.
Walsh (1981) theoretically analyzed the effect of confining and pore pressures on
fracture permeability. The fluid flow rate through fracture can be viewed as the product
of two factors: one describes the effect of aperture and the other one describes the effect
of tortuosity. The effect of aperture on flow rate is much more pronounced than that of
tortuosity. The effect of pore pressure and confining pressure on fluid flow through
fractures can be described by effective stress law 𝑃𝑒 = 𝑃𝑐 − 𝜕𝑃𝑝. The coefficient 𝜕 is not
always equal to one as indicated in many literatures. It was found that 𝜕 depends on the
topography of fracture surfaces and rock type. If the fracture is created by tensile failure,
𝜕 is very close to unity. But for polished smooth fracture surfaces, 𝜕 could be as low as
0.56. If a joint is filled with clay, 𝜕 is more likely to be greater than unity.
Wang and Park (2002) performed triaxial compression tests on sedimentary
rocks and permeability was measured for a complete stress-strain process. Experimental

6
results show that rock permeability changes with rock deformation. Permeability
decreases at initial loading and starts to increase as specimen is approaching failure. At
strain softening stage in the stress-strain curve, permeability reaches its peak value. After
that permeability drops a little but still maintain at a level higher than initial value. It is
obvious that permeability is significantly enhanced after rock failure.
Another frequently used experimental technique in rock mechanics is acoustic
emission (AE) monitoring. During rock deformation, some processes such as
microcracking, pore collapse and frictional sliding can generate acoustic waves.
Detection and analysis of AE signal provide useful information to help us better
understand deformational behavior of rock. Lockner (1993) reviewed the successes and
limitations of acoustic emission monitoring in the study of rock fracture. He divided the
laboratory studies of AE test into four categories 1) the study of damage development in
rock during loading through the counting of AE events; 2) the study of fracture
nucleation and growth through the determination of AE source locations; 3) the study of
source mechanism through the analysis of AE full waveform data; 4) the study of rock
properties through detecting AE wave velocities and attenuation.
The most commonly used AE technique is the counting of AE events. Scholz
(1968) developed an AE testing system of high sensitivity. With this system, he tested
several types of rocks at confining pressure up to 500 MPa to investigate the
microcracking processes during rock deformation. A typical stress-strain curve with AE
activity is shown in Fig. 1.2. For brittle rocks, such as Westerly granite, the inelastic
deformation was found to be directly proportional to AE activity. It was concluded that

7
the phenomenon of dilatancy in brittle rocks can be completely accounted for by the
microcracking processes. For ductile rocks and frictional sliding, AE activity behaved
quite differently from that of brittle rocks. Since Griffith’s criterion is not applicable to
rock, a simple statistical model based on the inhomogeous nature of rock was introduced
to describe the microcracking processes during rock deformation.
Fig. 1.2 Stress & AE activity versus strain for two rocks in uniaxial compression (a) Westerly granite; (b) Colorado rhyolite tuff (Scholz, 1968)
Lockner and Byerlee (1977) conducted creep tests on Weber sandstone and
Westerly granite samples with AE monitoring. Two samples for each type were tested
by stepping differential stresses up to rock strength at constant confining pressure of 100
MPa. At each stress level, the acoustic emission rate ν was found to decay exponentially
with the total number of events N. Mathematically it takes the form logν = β − αN,
where α and β are constants. Experimental results also show that α decreases

8
systematically with increasing differential stress and becomes negative as sample
approaches failure. Among many empirical creep laws, Lomnitz’s relation was found to
best fit the experimental data.
The Kaiser effect is a well-known phenomenon of acoustic emission in
metallurgy. It was found that a material under loading would emit acoustic waves only
after the previous load level is exceeded. Kaiser (1950) first observed this phenomenon
in tensile tests of metals. In rock mechanics, the Kaiser effect has been used to determine
in-situ stress through testing oriented cores from underground with AE monitoring.
Holcomb (1993) interpreted the Kaiser effect based on a micromechanical model
developed by Costin (1983). Using the concept of damage surface, it was shown that the
prediction from the theory agrees well with experimental observation. The
micromechanical model also helps explain why the commonly-used uniaxial loading
method (ULM) for determining in-situ stress is not valid. An alternative method, the
extensional loading method (ELM), was developed to determine general stress histories.
Hirata (1987) conducted uniaxial compression test on basalt with AE monitoring.
The sample was loaded to about 85% of its fracture strength. Then the axial stress was
held constant until fracturing occurs. Individual bursts of AE events were identified from
the creep stage and treated as mainshock-aftershock sequences. Two models, the
Omori’s power law model and the exponential decay model, were used to describe the
time series characteristics of the shock sequences. It was found that the AE bursts
changed from exponential decay to power law decay as the sample approaches failure.
Analysis of p-value in the Omori’s law for different AE burst sequences shows it

9
decreases with stress. It is believed that the decrease of p-value during the evolution of
the fracture process may serve as precursor of earthquake and the estimation of the
degree of fracture of the local crust.
To study fluid pressure diffusion in rock, Kranz et al. (1990) conducted fluid
injection tests with AE monitoring. Three experiments with different loading
configurations were presented. AE Source locations and focal mechanisms were
determined for each experiment. Results showed that it is very difficult to monitor fluid
migration by simply analyzing AE signals induced solely by fluid pressure diffusion.
The reason is that only with sufficient differential stress can diffusing fluid produce
useful AE signals, both the differential stress and fluid diffusion (deceases effective
confining pressure) can result in damage in rock and it is very difficult to distinguish
between the two AE generation mechanisms. A model was also established to explain
the difficulty.
In order to investigate the role of pre-existing cracks in rock fracture, Lei et al.
(2000) performed triaxial tests on two types of crystalline rock. With most other
properties being the same, the only difference between the two rocks is that one contains
main large pre-existing cracks, whereas the other one is almost crack-free. Experimental
results showed significant different responses in AE activities under triaxial compression.
The sample with large pre-existing cracks showed low AE activity and increasing b-
value before fault nucleation. On the contrary, the crack-free sample showed strong AE
activity and short-term b-value anomalies. These results confirmed that the faulting
process, especially the nucleation, is predominantly governed by pre-existing cracks.

10
The dominant role of pre-existing crack can be explained by the fact that stress
concentration at a crack tip is generally much severer than that caused by other types of
heterogeneity.
Stanchits et al. (2006) measured compressional (P), shear (S) wave velocities,
AE activity of basalt and granite samples in both triaxial and hydrostatic compression
tests. While hydrostatic pressure was increased to 120 MPa, P-wave velocity increased
more than 50% and 20% for basalt and granite, respectively. AE source mechanism
analysis showed that pore collapse was dominant during compaction. In triaxial loading,
evolution of velocity field demonstrated that anisotropy in basalt was more pronounced
than in granite. In the early loading stage, tensile failure was the dominant source
mechanism. As the sample approached failure, more double couple (shear) events were
identified, which revealed that shear cracks interconnected previously formed tensile
cracks and eventually leaded to faulting.
Fortin et al. (2009) applied AE technique in the test of porous sandstone samples.
Three experiments are reported which exhibits three different modes of deformation,
namely shear localization, compaction localization and cataclastic compaction. It was
shown that critical stress states at which pore collapse and grain crushing occur are well
corresponded to a surge in both cumulative AE events and AE rate. Spatial and temporal
distribution of AE source location revealed that preexisting cracks and high porosity
regions control the nucleation process in the early stage of loading. As loading
progresses, AE events tend to uniformly distribute across the sample in hydrostatic
loading (cataclastic compaction), while in triaxial loading AE events nucleate either

11
around the faulting plane (shear localization) or several compaction bands (compaction
localization). Source locations are in good agreement with microstructural observation of
the samples using SEM. Source mechanism analysis demonstrated that pore collapse and
shear type events dominate in all three experiments and only a small number of tensile
type events are identified.
1.3 Objectives of this study
This study will be mainly based on experimental investigation and the objectives
of this study include the following.
1. Prepare experimental setup and measure permeability of different rock types under
various stress states.
2. Analyze the effect of rock type and stress state on permeability.
3. Characterize the acoustic response during rock deformation.

12
2. EXPERIMENTAL SETUP
2.1 General description of experimental setup
The experimental setup for this study consists of three sub-systems: triaxial rock
testing system, permeability measurement system and acoustic emission monitoring
system. All the equipment is shown Fig. 2.1. Detailed description of each sub-system
will be given in the following sections.
Fig. 2.1 Photo of the experimental setup 2.2 Triaxial rock testing system
2.2.1 General description
The triaxial rock testing system used in this work was manufactured by
Geotechnical Consulting & Testing Systems (GCTS). The major components of the

13
triaxial rock testing system include load frame, high pressure triaxial cell, hydraulic
pump, confining and pore pressure cabinets, data acquisition cabinet and software. The
schematic diagram of GCTS triaxial rock testing system is shown in Fig. 2.2.
Fig. 2.2 Schematic diagram of GCTS triaxial rock testing system The loading system has 1,500 kN load capacity and 1,750 kN/mm stiffness. The
high pressure cell (Model HTRX-200) can accommodate rock specimens with a
diameter ranging from 25 mm to 100 mm and with the ratio of height to diameter of 2.
The cell is capable of applying up to 210 MPa confining pressure and 3,500 kN axial
load. Forty-eight high pressure electrical feedthroughs allow connections for LVDT
transducer, acoustic emission sensor and other gauges. Both confining pressure and pore
pressure cabinets are installed with HPVC-210 pressure intensifier which can generate
up to 210 MPa fluid pressure. The load cell, confining and pore pressure transducers
14
were well calibrated by the manufacturer and calibration files were stored in the data
acquisition software.
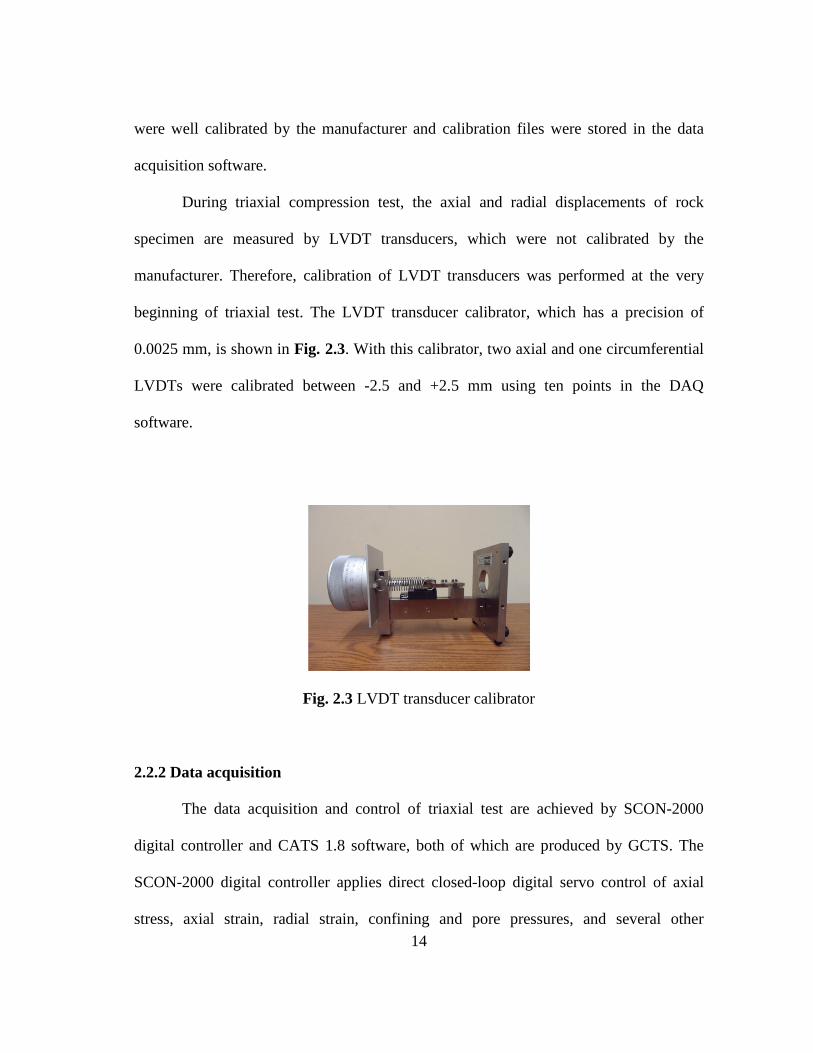
During triaxial compression test, the axial and radial displacements of rock
specimen are measured by LVDT transducers, which were not calibrated by the
manufacturer. Therefore, calibration of LVDT transducers was performed at the very
beginning of triaxial test. The LVDT transducer calibrator, which has a precision of
0.0025 mm, is shown in Fig. 2.3. With this calibrator, two axial and one circumferential
LVDTs were calibrated between -2.5 and +2.5 mm using ten points in the DAQ
software.
Fig. 2.3 LVDT transducer calibrator 2.2.2 Data acquisition
The data acquisition and control of triaxial test are achieved by SCON-2000
digital controller and CATS 1.8 software, both of which are produced by GCTS. The
SCON-2000 digital controller applies direct closed-loop digital servo control of axial
stress, axial strain, radial strain, confining and pore pressures, and several other

15
variables. The CATS 1.8 is a Graphical User Interface (GUI) software that allows easy
and rapid control and record of triaxial test. Fig. 2.4 shows typical software screen
layout for triaxial test.
Fig. 2.4 DAQ Software screen layout of triaxial rock testing system (GCTS) 2.3 Permeability measurement system
2.3.1 General description
The permeability measurement system is incorporated in triaxial rock testing
system, as is shown in Fig. 2.5.

16
Fig. 2.5 Schematic diagram of permeability measurement system
The permeability measurement system was built based on steady state method,
which requires the measurements of fluid flow rate, upstream and downstream pressures.
TeledyeIsco D-series pump was used to provide accurate and continuous flow. Two
HEISE DXD series digital pressure transducers were used for pressure measurement.
These pressure transducers have an accuracy of ±0.02% of full scale, including the
effects of nonlinearity, hysteresis, non-repeatability and temperature. In order to obtain
more accurate measurement of differential pressure across rock specimen, the
downstream pressure was elevated to around 2.1 MPa. In the triaxial cell, flow lines
were connected to top and bottom loading platens, which has been carved with multiple
flow channels (Fig. 2.6) and allow uniform fluid diffusion across end surfaces of rock
specimen.

17
Fig. 2.6 Loading platens with carved fluid diffusion channels 2.3.2 Data acquisition
Microsoft Visual BASIC program was created to record flow rate and pressure
readings from syringe pump and pressure transducers, respectively. The start time of
permeability measurement was also recorded and used to correlate permeability with
triaxial compression test. The screen layout of the DAQ program is shown in Fig. 2.7.
Fig. 2.7 DAQ program screen layout of permeability measurement

18
2.4 Acoustic emission monitoring system
2.4.1 General description
In order to monitor acoustic emission response of rock specimen during triaxial
test, P-wave AE sensor was coupled inside loading platen. Besides, the AE system also
includes preamplifier, filter, amplifier and signal conditioning board. The schematic
diagram of acoustic emission monitoring system is shown in Fig. 2.8.
Fig. 2.8 Schematic diagram of acoustic emission monitoring system
AE signal generated during rock deformation propagates through loading platen
and is detected by AE sensor bonded with the platen. AE sensor converts acoustic
vibration into electric voltage. Since AE signal is usually very weak and always
accompanied by lasting background noise, preamplifier is used to amplify small

19
electrical signals for further processing, as well as to reduce the effects of noise and
interference. Then the signal is filtered by band-pass frequency filter to eliminate low
and high frequency noise. After further amplification and conditioning, AE signal is
displayed and analyzed with the aid of DAQ software.
2.4.2 Data acquisition
The data acquisition of AE signal is achieved using a single channel AE digital
signal processor (USB AE Node) and AEwin software, both of which were produced by
Physical Acoustics Corporation. USB AE Node can be easily interfaced to a computer
and allows rapid acquisition of time-based AE features, such as count, event and
waveform. AEwin DAQ software is capable of real-time AE feature and waveform
processing, as well as 2-D & 3-D graphing. Fig. 2.9 shows typical screen layout of AE
DAQ software.
Fig. 2.9 DAQ Software screen layout of AE monitoring

20
3. EXPERIMENTAL PROCEDURE
3.1 Specimen preparation
Rock specimens were first cored from rock block in one-inch diameter. Then
they were cut into approximately two inch in length with an electrical saw. End surfaces
of rock specimens were then polished in Buehler polishing machine. Rock specimens
were further polished in Brown and Sharp 818 micromaster hydraulic surface grinder to
obtain a parallelness of end surfaces within 0.025 mm. All the specimens of the same
rock type were cored from the same rock block, therefore uniformity in properties were
maintained.
3.2 Triaxial compression test
3.2.1 Installation of loading platens and LVDT transducers
The first step of triaxial compression test is to install loading platens and LVDT
transducers on specimen. The procedure is as follows.
1. Measure and record the diameter and length of rock specimen to be tested.
2. Slide rock specimen into heat-shrinkable jacket and install top and bottom
loading platens, heat the jacket with a heat gun until jacket wrap around rock
specimen tightly.
3. Tighten jacket with both top and bottom platens by applying two-round wires.
This will make an initial sealing between rock specimen and confining fluid.
4. Install two axial LVDT ring holders and make sure they are horizontal and on the
specimen.

21
5. Install two axial LVDTs and one circumferential LVDT and fix them in place.
6. Measure and record axial gauge length which is the distance between the centers
of top and bottom LVDT ring holders. This parameter will be used to calculate
axial strain.
Fig. 3.1 Photo of rock specimen installed with loading platens and LVDT transducers
After finishing the above procedure, the rock specimen is ready to be installed
into triaxial cell. Fig. 3.1 shows an example of a well prepared rock specimen installed
with platens and transducers.
The next step is to install rock specimen into triaxial cell by screwing bottom
platen into triaxial cell base. The rock specimen should be handled with care and make
sure every part is still tight when screwing bottom platen. Then connect gauge cables
with feedthroughs in the triaxial cell base and hook up flow lines to top and bottom

22
platens. Before closing triaxial cell, all three LVDTs should be adjusted and make sure
they are in the appropriate range. The total measuring range of LVDTs is between -2.5
and +2.5 mm. For axial LVDTs, it is usually placed around -1.3 mm before test, which
gives enough stroke when rock is compressed. For circumferential LVDT, it is usually
set up to be around zero since rock specimen can either shrink in hydrostatic
compression test or expand in triaxial compression test.
After appropriate configuration of LVDT transducers, triaxial cell is closed and
placed under loading actuator. Then triaxial cell is filled with confining oil through
confining pressure cabinet. At this stage, it is import to check readings of LVDTs from
DAQ software and make sure they are still in the pre-configurated position. If not,
triaxial cell should be opened and LVDT transducers should be set up again until they
work properly. Otherwise, it makes no sense to run a test as strain measurement is not
accurate.
3.2.3 System leak check
As triaxial cell is full of confining oil, it is necessary to check if there is any
leaking throughout the system. The method to check is to apply a small confining
pressure and watch the cell pressure intensifier LVDT versus time curve. The system is
well sealed if the curve first increases and then stays constant once the target confining
pressure is reached. If the curve keeps increasing and the desired confining pressure
cannot be achieved, it is an indication of leaking. If this happens, stop applying
confining pressure and drain confining oil out of triaxial cell, check all the fitting
connections and rock specimen setup to identify the location of leak.

23
3.2.3 Preloading of rock specimen
If the system passes leak check, it is now ready to preload rock specimen before
running a test. In preloading, a small differential stress is first applied on rock specimen
as seating stress, which allows rock specimen and loading platens to be in good contact.
Then confining pressure is slowly increased to the target value. At this stage, it is also
important to keep an eye on cell pressure intensifier LVDT versus time curve and make
sure good seal is maintained throughout the test. Confining pressure and seating stress
are held until the readings from LVDT transducers stop changing, which indicates both
the rock specimen and system is stable and ready for testing. Before starting a test, make
sure to zero LVDT transducers through DAQ software.
3.3 Permeability measurement
In this work, axial permeability was measured continuously during triaxial test.
The measurement of axial permeability includes system leak check, air elimination and
rock specimen saturation.
3.3.1 System leak check
Before conducting permeability measurement, the flow lines are checked for leak
section by section. First, upstream valve is closed, and then syringe pump is set up with a
constant pressure. If the target pressure can be reached in a short time and flow rate
varies between -0.001 and +0.001 ml/min, this section passes leak check. If not, change
fitting and tubing and redo leak check until a good seal along flow line is guaranteed.
After checking upstream section, open upstream valve and connect upstream and
downstream lines without installing rock specimen, close downstream valve and start

24
pumping at constant pressure. The criterion for leak test is same as before. After
checking downstream flow lines, open downstream valve and set up pressure constraint
in the backpressure regulator, and start pumping at constant flow rate. If the downstream
pressure can be kept at the desired pressure, the system is free of leaking. By performing
leak check in this way, it is easy to identify the location of leaking and change fitting or
tubing accordingly.
3.3.2 Air elimination
During the preparation of rock specimen, air is often trapped in the flow lines due
to pump fill and connection/disconnection of fittings. Air is much more compressible
than water and hence brings about errors in the measurement of pressure and flow rate. It
is necessary to eliminate air from the system before every test. To get rid of air from
pump, pump is always filled up at slow flow rate. Then immerse discharge line into
water and start pumping. If no bubble was observed from discharge line for about three
minutes, the pump is free of air and can be connected to permeability measurement
system. During the saturation of rock specimen in the triaxial cell, the discharge line is
also immersed into water. Usually it is expected to see bubbles come out of water
intermittently at the beginning of saturation. The saturation process is always kept long
enough to make sure all the air has been removed from the system.
3.3.3 Rock specimen saturation
Before starting triaxial test, rock specimens are fully saturated. The saturation
process is long enough so that not only air is removed from the system, but also a
constant initial differential pressure across rock specimen is obtained.

25
3.4 Acoustic emission monitoring
3.4.1 Threshold amplitude determination
Acoustic emission test is always accompanied by lasting background noise.
Sources of acoustic noise include fluid flow in pumps and valves, vibration of structures
and any friction processes etc. In our lab, the hydraulic pump for triaxial machine is a
major source of noise. One way to deal with noise is to set up threshold amplitude for
AE wave signal in the DAQ software. Only the signal with higher amplitude than the
threshold can be recorded by the DAQ software. This is an effective way to eliminate the
lasting low amplitude noise. However, the threshold value should be determined with
caution. High threshold value is helpful in filtering noise, but it would also reject true
signal as well, which negatively affects the integrity of real data. Therefore, before
loading rock specimen, the AE testing system would keep running until steady response
is achieved, as is shown in Fig. 3.2. Then the threshold amplitude is determined
accordingly. Take Fig. 3.2 as an example, the main background noise is below 55dB. As
a result, the threshold amplitude should be set as 55 dB during test. This process should
be performed before each test, since environmental noise may vary with time.
3.4.2 Pencil lead break test
Once threshold amplitude is set up in the DAQ software, it is also advisable to
perform pencil lead break test to check AE system. As the name implies, the lead of a
mechanical pencil is broken around AE sensor, which is a perfect imitation of rock
fracturing process. Then AE response is checked through software. By doing this, the
sensitivity of AE system is verified. Fig. 3.3 presents typical AE response during pencil

26
lead break test. Pencil lead was broken five times which were all well responded in the
AE monitoring system. This indicates the system is ready for real test.
Fig. 3.2 Detection of AE background noise
Fig. 3.3 Pencil lead break test (five times)

27
4. RESULTS & DISCUSSION
4.1 Sample description
In this study, four different types of rocks are selected for testing, including
Berea sandstone, Indiana limestone, Westerly granite and tuff. It is intended to test
different rock type with various permeability levels. For each rock type (except tuff),
specimens used in the test are cored from the same block so that uniform properties can
be maintained between specimens. Fig. 4.1 shows photos of specimens of different rock
type used in the test. A brief description of these rocks will be given in the following
paragraphs.
Fig. 4.1 Photos of rock specimens (from top left to bottom right: Berea sandstone, Indiana limestone, Westerly granite and tuff)
28
Berea sandstone has been widely used in the laboratory for mechanical and
petrophysical experiments. It is a sedimentary rock which is predominantly composed of
quartz. Berea sandstone has relatively high porosity and permeability which makes it a
good reservoir rock. The AP-608 Automated Permeameter-Porosimeter was used to
measure gas permeability and porosity of several Berea sandstone specimens. The
average gas permeability and porosity are 364 mD and 20.1%, respectively, at confining
pressure of 5.7 MPa.
Indiana limestone has also been widely tested in the laboratory. It is also a type
of sedimentary rock which is predominantly composed of calcium carbonate. Comparing
to Berea sandstone, Indiana limestone has lower porosity and permeability. The
measured gas permeability and porosity are 3.36 mD and 12.67%, respectively, at
confining pressure of 5.7 MPa.
Westerly granite is a type of igneous rock which is granular in texture. It has low
permeability which is in nanodarcy scale. Brace et al. (1968) reported the permeability
of Westerly granite of 350 nD at 10 MPa confining pressure.
Tuff is a type of rock that is composed of consolidated volcanic ash or dust
ejected during volcanic eruption. It is our interest to study this type of rock. However,
unlike the other three rocks, we have very limited tuff specimens. In this study, three tuff
specimens were tested, which were labeled as Tuff-3V, Tuff-4V and Tuff-1H. Visual
inspection shows certain heterogeneity between these specimens.

29
4.2 Triaxial compression test
Triaxial compression tests were performed on all four types of rock to study their
deformational behaviors. Except for tuff, various confining pressures were used in
triaxial compression tests. For tuff, since only three specimens were available to us, we
decided to test them in the formation pressure.
4.2.1 Berea sandstone
Triaxial compression tests were performed at four different confining pressure
levels. Fig. 4.2 shows the stress-strain curves of four triaxial compression tests, while
Fig. 4.3 shows combined differential stress-axial stress curves. At relatively low
confining pressures (8.2 MPa, 18.5 MPa), Berea sandstone exhibits brittle fracturing,
which is marked by a drastic stress drop at the time of failure. A single shear-induced
fracture can be observed on specimen after test. As confining pressure increases to
higher levels (32.2 MPa, 45.9 MPa), Berea sandstone becomes ductile, without showing
drastic decrease in differential stress at the time of failure. According to Wong et al.
(1997), Berea sandstone is experiencing a transition from brittle faulting to cataclastic
flow.

30
Fig. 4.2 Stress-strain curves at different confining pressures (Berea sandstone)
0
20
40
60
80
100
-1.5 -0.5 0.5 1.5
Diff
eren
tial S
tress
(MPa
)
Strain (%)
Berea Sandstone Pc=8.2MPa
Axial Strain
Radial Strain
VolumetricStrain
0
20
40
60
80
100
120
-1.5 -1 -0.5 0 0.5 1 1.5
Diff
eren
tial S
tress
(MPa
)
Strain (%)
Berea Sandstone Pc=18.5 MPa
Axial Strain
Radial Strain
VolumetricStrain
0
40
80
120
160
-1 -0.5 0 0.5 1 1.5 2
Diff
eren
tial S
tress
(MPa
)
Strain (%)
Berea Sanstone Pc=32.2MPa
Axial Strain
Radial Strain
VolumetricStrain
0
40
80
120
160
200
-1 0 1 2 3
Diff
eren
tial S
tress
(MPa
)
Strain (%)
Berea Sandstone Pc=45.9MPa
Axial Strain
Radial Strain
VolumetricStrain

31
Fig. 4.3 Combined differential stress-axial strain curves at different confining pressures (Berea sandstone)
Fig. 4.4 Mohr circles and failure envelop (Berea sandstone)
Failure envelope was established based on triaxial test data (peak stress) and is
shown in Fig. 4.4. Clearly, the failure envelope cannot be fit by Mohr-Coulomb failure
criterion, which states a linear relationship between shear stress and normal stress.
0
40
80
120
160
200
0 0.5 1 1.5 2 2.5
Diff
eren
tial S
tress
(MPa
)
Axial Strain (%)
Pc=8.2MPa
Pc=18.5MPa
Pc=32.2MPa
Pc=45.9MPa
0
20
40
60
80
100
0 50 100 150 200 250
Shea
r Stre
ss (M
Pa)
Normal Stress (MPa)
Pc=8.2MPa
Pc=18.5MPa
Pc=32.2MPa
Pc=45.9MPa
Failure envelope

32
Instead, the failure envelop is better fit by curved line, which has the following
expression.
567.13867.00022.0 2 ++−= σστ
Where 𝜏 is shear stress in MPa, 𝜎 is normal stress in MPa.
Fig. 4.5 shows a photo of rock specimens after test. At lower confining pressures
(8.2 MPa, 18.5 MPa), one though-going fracture extended to about two thirds of the
length of each rock specimen. At higher confining pressures (32.2 MPa, 45.9 MPa), two
short fractures developed at one end of each rock specimen.
Fig. 4.5 Rock specimens after test (Berea sandstone) 4.2.2 Indiana limestone
Triaxial compression tests were performed at three different confining pressure
levels. Fig. 4.6 shows the stress-strain curves of three triaxial compression tests, while
Fig. 4.7 shows combined differential stress-axial stress curves. It can be clearly seen
33
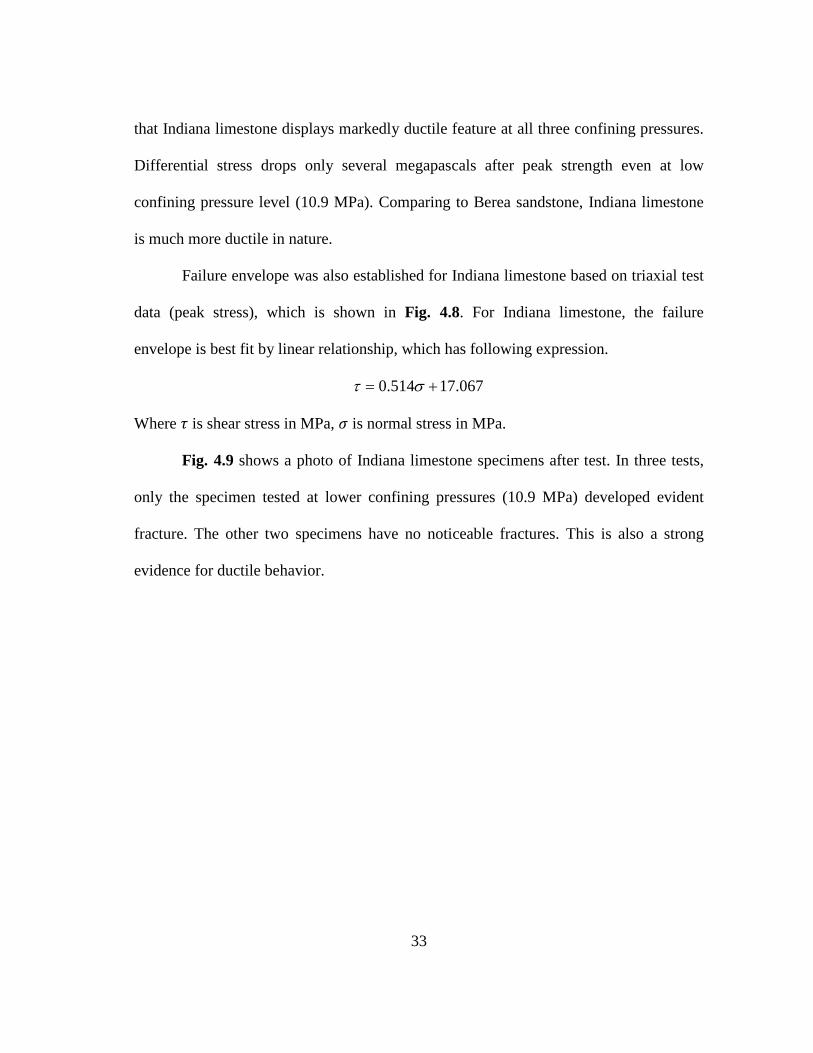
that Indiana limestone displays markedly ductile feature at all three confining pressures.
Differential stress drops only several megapascals after peak strength even at low
confining pressure level (10.9 MPa). Comparing to Berea sandstone, Indiana limestone
is much more ductile in nature.
Failure envelope was also established for Indiana limestone based on triaxial test
data (peak stress), which is shown in Fig. 4.8. For Indiana limestone, the failure
envelope is best fit by linear relationship, which has following expression.
067.17514.0 += στ
Where 𝜏 is shear stress in MPa, 𝜎 is normal stress in MPa.
Fig. 4.9 shows a photo of Indiana limestone specimens after test. In three tests,
only the specimen tested at lower confining pressures (10.9 MPa) developed evident
fracture. The other two specimens have no noticeable fractures. This is also a strong
evidence for ductile behavior.

34
Fig. 4.6 Stress-strain curves at different confining pressures (Indiana limestone)
0
20
40
60
80
-2 -1 0 1 2
Diff
eren
tial S
tress
(MPa
)
Strain (%)
Indiana Limestone Pc=10.9MPa
Axial Strain
Radial Strain
VolumetricStrain
0
20
40
60
80
100
-1.5 -1 -0.5 0 0.5 1 1.5
Diff
eren
tial S
tress
(MPa
)
Strain (%)
Indiana Limestone Pc=17.4MPa
Axial Strain
Radial Strain
VolumetricStrain
0
20
40
60
80
100
120
-1 -0.5 0 0.5 1 1.5
Dev
iato
ric S
tress
(MPa
)
Strain (%)
Indiana Limestone Pc=30.2MPa
Axial Strain
Radial Strain
VolumetricStrain
35
Fig. 4.7 Combined differential stress-axial strain curves at different confining pressures (Indiana limestone)
Fig. 4.8 Mohr circles and failure envelop (Indiana limestone)
0
20
40
60
80
100
120
0 0.2 0.4 0.6 0.8 1 1.2
Diff
eren
tial S
tress
(MPa
)
Axial Strain (%)
Pc=10.9MPa
Pc=17.4MPa
Pc=30.2MPa
0
10
20
30
40
50
60
70
80
0 20 40 60 80 100 120 140 160
Shea
r Stre
ss (M
Pa)
Normal Stress (MPa)
Pc=10.9MPa
Pc=17.4MPa
Pc=30.2MPa
Failure Envelope

36
Fig. 4.9 Rock specimens after test (Indiana limestone) 4.2.3 Westerly granite
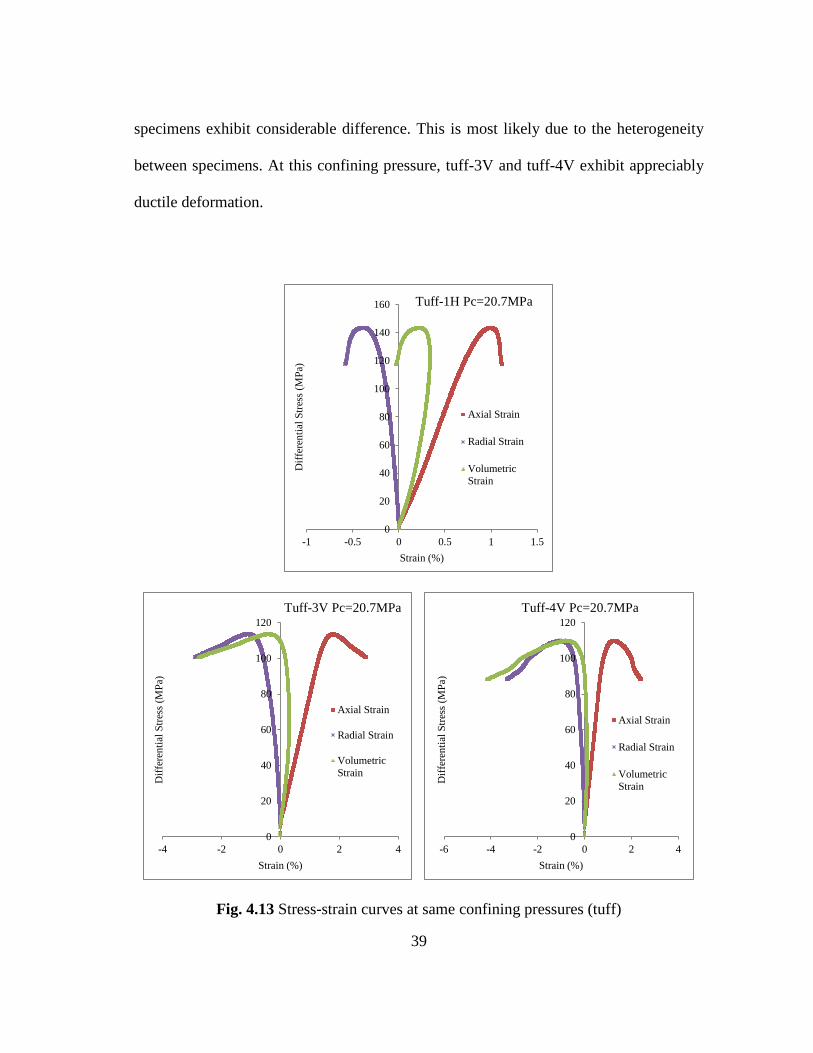
One uniaxial compression and two triaxial compression tests were conducted on
Westerly granite. Fig. 4.10 presents the stress-strain curves, while Fig. 4.11 shows
combined differential stress-axial stress curves. It can be seen that Westerly granite is
very brittle. For uniaxial compression test, axial stress dropped to almost zero instantly
at the time of failure, during which the DAQ system didn’t catch any data. For two
triaxial compression tests, Westerly granite was failed by brittle fracturing, characterized
by a drastic stress decrease after peak stress.
Fig. 4.12 shows a photo of Westerly granite specimens after test. For uniaxial
compression, multiple vertical fractures are observable on rock specimen. For other two
tests, at least one through-going fracture was created. All three specimens look much
darker after test than before test. This is because permeability measurement was
attempted after failure and confining oil leaked into specimen at the end of permeability
measurement.

37
Fig. 4.10 Stress-strain curves at different confining pressures (Westerly granite)
0
20
40
60
80
100
-0.15 -0.05 0.05 0.15 0.25
Axi
al S
tress
(MPa
)
Strain (%)
Westerly Granite Uniaxial Compression
Axial Strain
Radial Strain
Volumetric Strain
0
50
100
150
200
250
-5 -4 -3 -2 -1 0 1
Diff
eren
tial S
tress
(MPa
)
Strain (%)
Westerly Granite Pc=6.9MPa
Axial Strain
Radial Strain
VolumetricStrain
0
50
100
150
200
250
300
350
-2 -1 0 1
Diff
eren
tial S
tress
(MPa
)
Strain (%)
Westerly Granite Pc=20.7MPa
Axial Strain
Radial Strain
VolumetricStrain

38
Fig. 4.11 Combined differential stress-axial strain curves at different confining pressures (Westerly granite)
Fig. 4.12 Rock specimens after test (Westerly granite)
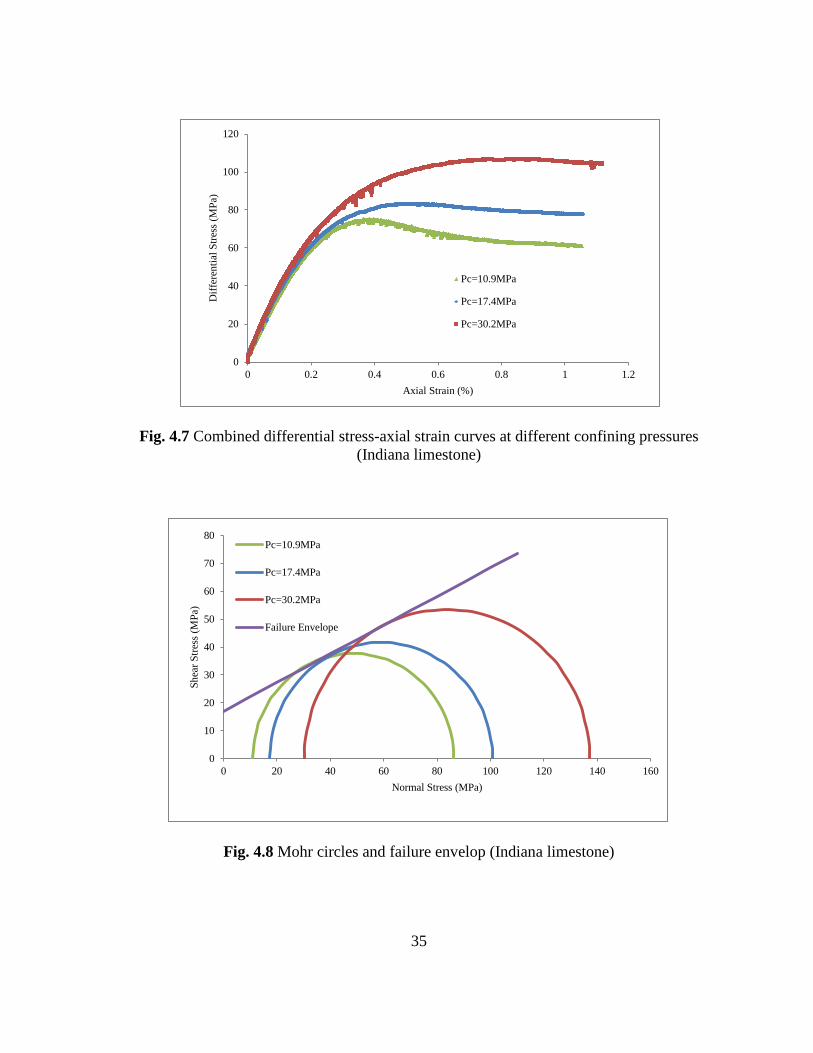
4.2.4 Tuff
Since we have only three tuff specimens, we decided to test these specimens at
formation pressure, which is about 20.7 MPa. Fig. 4.13 shows triaxial compression data
for three tuff specimens, while Fig. 4.14 shows combined differential stress-axial stress
curves. Even tested at the same confining pressure, the stress strain curves of three
0
50
100
150
200
250
300
350
0 0.1 0.2 0.3 0.4 0.5 0.6
Diff
eren
tial S
tress
(MPa
)
Axial Strain (%)
Uniaxial
Pc=6.9MPa
Pc=20.7MPa
39
specimens exhibit considerable difference. This is most likely due to the heterogeneity
between specimens. At this confining pressure, tuff-3V and tuff-4V exhibit appreciably
ductile deformation.
Fig. 4.13 Stress-strain curves at same confining pressures (tuff)
0
20
40
60
80
100
120
140
160
-1 -0.5 0 0.5 1 1.5
Diff
eren
tial S
tress
(MPa
)
Strain (%)
Tuff-1H Pc=20.7MPa
Axial Strain
Radial Strain
VolumetricStrain
0
20
40
60
80
100
120
-4 -2 0 2 4
Diff
eren
tial S
tress
(MPa
)
Strain (%)
Tuff-3V Pc=20.7MPa
Axial Strain
Radial Strain
VolumetricStrain
0
20
40
60
80
100
120
-6 -4 -2 0 2 4
Diff
eren
tial S
tress
(MPa
)
Strain (%)
Tuff-4V Pc=20.7MPa
Axial Strain
Radial Strain
VolumetricStrain

40
Fig. 4.15 shows a photo of tuff specimens after test. For all of these tests, one
through-going fracture was created in each of these specimens. Axial permeability
measurement was attempted after failure. But none of them was successful. The reason
is that the intact rock is really tight and fluid cannot flow through. The generated
macroscopic fracture didn’t connect end surfaces, where pore fluid was injected into.
Thus it was also impossible to flow fluid in the axial direction. For tuff-4V, confining oil
leaked into specimen as plastic jacket was broken during deformation of rock specimen.
Fig. 4.14 Combined differential stress-axial strain curves at same confining pressures (tuff)
0
20
40
60
80
100
120
140
160
0 0.5 1 1.5 2 2.5 3 3.5
Dife
rent
ial S
tress
(MPa
)
Axial Strain (%)
Pc=20.7MPa Tuff-1H
Tuff-4V
Tuff-3V

41
Fig. 4.15 Rock specimens after test (tuff) 4.2.5 Summary
In this section, the triaxial compression test data of four types of rocks was
analyzed. It can be seen that Berea sandstone and Westerly granite demonstrate
significant brittle behavior, while Indiana limestone exhibits strong ductile behavior.
Tuff specimens were tested at the same confining pressure and show appreciable
heterogeneity.
4.3 Permeability measurement
In order to study the dependence of permeability on stress, axial permeability
measurement was carried out during triaxial compression test. Berea sandstone and
Indiana limestone are permeable enough to allow continuous permeability measurement
throughout compression test. For Westerly granite and tuff, the permeability of their
intact samples is in nanodarcy scale. Our current experimental setup is not capable of
measuring such a low permeability. Instead, we attempted to measure axial permeability

42
of fractured rock specimen. However, not all of those measurements on tight rock turned
out to be successful. One reason is the leak of confining oil due to rock specimen
breakage. Before failure specimen jacket was already deformed with the deformation of
rock specimen. Further loading can easily break jacket, which is problematic for
permeability measurement of fractured rock. Another reason is that the through-going
fracture developed at high confining pressure test does not connect all the way to top and
bottom platens through which fluid is injected into rock specimen. Fluid still cannot flow
through rock specimen in the axial direction even with fracture present. As a result, we
were only able to measure axial permeability of fractured Westerly granite. None of the
axial permeability measurement on tuff specimens was successful.
During axial permeability measurement, differential pressure across rock
specimen was measured while flowing deionized water under constant flow rate. With
measured differential pressure and specimen dimension, axial permeability can be
calculated based on Darcy’s law. In this study, it is intended to measure axial
permeability continuously during the process of rock deformation. Therefore, it is
necessary to verify that the permeability measurement system can respond quickly
enough to give the instantaneous axial permeability as stress on rock specimen varies. A
verification test was performed, which increases differential stress at a constant rate and
then holds the differential stress for some time. The obtained axial permeability is
compared with stress to check if they are well correlated to each other. In a typical
triaxial compression test, rock specimen is usually compressed under constant strain rate.
In the verification test, the constant strain rate control is not favorable because constant

43
stress cannot be accomplished by maintaining a constant strain. Analysis of triaxial
compression data shows that the majority part of the constant strain rate controlled test
has a stress rate lower than 0.35 MPa/second. Take the triaxial compression test on
Berea sandstone as an example (Fig. 4.16), the stress rate exceeds 0.35 MPa/second at
the beginning test. This is because the triaxial machine tries to adjust itself to achieve the
target strain rate. After the system is stabilized, stress rate goes below 0.35 MPa/second.
At the time of failure, especially brittle fracturing, the stress rate can be much higher
than 0.35 MPa/second. As it is impractical to use a very high stress rate in the
verification test due to the limitation of testing system, the measured axial permeability
at the time of failure may not be the instantaneous axial permeability. But it is believed
that the trend of axial permeability change can still be observed as the rate of stress
change goes back to below 0.35 MPa/second after failure.
Fig. 4.16 Instantaneous stress rate during triaxial compression test
-1.40-1.05-0.70-0.350.000.350.701.051.401.752.10
0 200 400 600 800 1000 1200
Stre
ss R
ate
(MPa
/sec
ond)
Time (second)
Berea Sandstone Pc=18.5 MPa

44
Fig. 4.17 Verification of axial permeability measurement with increasing stress
Therefore the stress rate used in the verification test was chosen to be 0.35
MPa/second. As Indiana limestone is less permeable than Berea sandstone, Indiana
limestone specimen was chosen to perform the verification test. Fig. 4.17 shows the
result of verification test on Indiana limestone. It can be seen that the measured axial
permeability is well correlated to stress change. This proves that continuous
measurement of axial permeability on permeable Berea sandstone and Indiana limestone
is feasible.
4.3.1 Berea sandstone
Continuous axial permeability measurement was performed during triaxial
compression tests on Berea sandstone. Figs. 4.18-21 show stress-strain curves and
corresponding axial permeability variation of four triaxial compression tests at different
confining pressures. In all tests, axial permeability keeps decreasing during rock
deformation, even after rock breaks and macroscopic fracture forms.
1.18
1.2
1.22
1.24
0
5
10
15
20
25
0 20 40 60 80 100
Axi
al P
erm
eabi
lity
(mD
)
Diff
eren
tial
Stre
ss (M
Pa)
Time (second)
Differential Stress
Axial Permeability

45
Rock deformation is divided into three stages based on the characteristics of
stress-strain curves. Three stages include linear elastic deformation, inelastic
deformation, after fracturing (brittle behavior) or after peak strength (ductile behavior).
In the stage of linear elastic deformation, the major deformation mechanisms include
closure of pre-existing microcracks and grain compression. In the stage of inelastic
deformation, microcracking develops in rock specimen. At low confining pressure, the
stress-induced microcracks tend to coalesce and become localized, leading to brittle
fracturing of rock specimen characterized by drastic drop in differential stress. While at
high confining pressure, microcracking tends to develop homogeneously throughout
rock specimen and results in more ductile behavior.
From Figs. 4.18-21, it is apparent that axial permeability variation is well
correlated to different deformational stages. At low confining pressures (8.2 MPa, 18.5
MPa, Figs. 4.18-19), the closure of pre-existing microcraks and grain compression in the
linear elastic deformation stage reduce pore space, which leads to axial permeability
decrease. It is interesting to note that axial permeability decrease almost linearly at this
stage. As rock specimen enters inelastic deformation, extensive microcracking tends to
increase the overall pore space of rock specimen. This is evidenced by differential stress
versus volumetric strain curves, where volumetric strain deflects from positive values
(shrinkage of rock specimen) to negative values (dilatancy of rock specimen) before
brittle fracturing. However, axial permeability does not increase due to the increase of
porosity at this stage. Rather the decrease of axial permeability is accelerated. To
understand this phenomenon, it is important to bear in mind that the intact Berea

46
sandstone is very permeable, with an initial fluid permeability of about 90 mD. Pore
space is homogeneously distributed and well-sorted, and flow paths are well established.
As rock specimen is deformed under stress, microcracking tends to destroy original pore
structures and flow paths. As a result, the tortuosity of pore space is significantly
increased, which leads to accelerated axial permeability decrease. At the time of brittle
fracturing, the decrease of axial permeability is further accelerated (more obvious in Fig.
4.18). The creation of macroscopic fracture (Fig. 4.5) does not increase the ease of fluid
flow in the axial direction. This can be explained when comparing intact rock surface
and fracture rock surface of SEM images in later sections. As fractured rock specimen
starts sliding, axial permeability continues to decrease at a lower speed.
Fig. 4.18 Differential stress and axial permeability versus strain (Berea sandstone Pc = 8.2 MPa)
0
20
40
60
80
100
120
0
20
40
60
80
100
-1.2 -0.7 -0.2 0.3 0.8
Axi
al P
erm
eabi
lity
(mD
)
Diff
eren
tial S
tress
(MPa
)
Strain (%)
Berea Sandstone Pc=8.2MPa
Axial StrainRadial StrainVolumetric StrainAxial Permeability
linear elastic inelastic
after fracturing

47
Fig. 4.19 Differential stress and axial permeability versus strain (Berea sandstone Pc = 18.5 MPa)
At higher confining pressures (32.2 MPa, 45.9 MPa, Figs. 4.20-21), axial
permeability also decreases linearly at linear elastic deformation stage. In the inelastic
deformation stage, dilatancy of rock specimen is more compressed. As shown in
differential stress versus volumetric strain curve, the volumetric strain stays positive
before peak strength and indicates overall shrinkage of rock specimen (therefore overall
decrease of pore space). At this stage, the decrease of axial permeability is slightly
accelerated. At around peak strength, axial permeability curve tends to level off. As rock
specimen behaves more ductile, no drastic drop in axial permeability due to brittle
fracturing is observed and variation of axial permeability tends to be much smoother. It
seems that more distributed microracking at high confining pressure has similar impact
0
20
40
60
80
100
0
20
40
60
80
100
120
-1.5 -1 -0.5 0 0.5 1 1.5
Axi
al P
erm
eabi
lity
(mD
)
Diff
eren
tial S
tress
(MPa
)
Strain (%)
Berea Sandstone Pc=18.5MPa
Axial Strain
Radial Strain
Volumetric Strain
Axial Permeability
linear elastic
inelastic after fracturing

48
on axial permeability as at low confining pressure, except at the time of brittle
fracturing.
Zhu and Wong (1997) observed similar phenomenon from triaxial compression
tests on different sandstones. Before the onset of dilatancy, both axial permeability and
porosity decrease with increasing stress. As rock starts dilating, axial permeability
continues to decrease. And the formation of shear-induced fracture accelerates the
decrease of axial permeability.
Fig. 4.20 Differential stress and axial permeability versus strain (Berea sandstone Pc = 32.2 MPa)
0
20
40
60
80
100
0
40
80
120
160
-1 -0.5 0 0.5 1 1.5
Axi
al P
erm
eabi
lity
(mD
)
Diff
eren
tial S
tress
(MPa
)
Strain (%)
Berea Sanstone Pc=32.2MPa
Axial Strain
Radial Strain
Volumetric Strain
Axial Permeability linear elastic inelastic
after peak
strength

49
Fig. 4.21 Differential stress and axial permeability versus strain (Berea sandstone Pc = 45.9 MPa)
In order to better understand the impact of rock deformation on axial
permeability change, SEM images were obtained for both intact and broken rock
surfaces under same magnification (Fig. 4.22). The left SEM image clearly shows grains
of Berea sandstone. In the right SEM image, grain is no longer observable. Instead,
almost all of the pore space is filled with fine particles. This helps explain the drastic
reduction of axial permeability at the time of brittle fracturing.
0
20
40
60
80
100
0
40
80
120
160
200
-1 -0.5 0 0.5 1 1.5 2 2.5
Axi
al P
erm
eabi
lity
(mD
)
Diff
eren
tial S
tress
(MPa
)
Strain (%)
Berea Sandstone Pc=45.9MPa
Axial StrainRadial StrainVolumetric StrainAxial Permeability linear
elastic inelastic
after peark strenght

50
Fig. 4.22 SEM images of Berea sandstone: Left, intact rock surface; Right, fracture rock surface (200x magnification)
4.3.2 Indiana limestone
Continuous axial permeability measurement was also performed during triaxial
compression tests on Indiana limestone. Figs. 4.23-25 show stress-strain curves and
corresponding axial permeability change of three triaxial compression tests at different
confining pressures. The axial permeability of intact Indiana limestone is around 1 mD.
Although Indiana limestone is much less permeable than Berea sandstone, the axial
permeability variation of Indiana limestone is in general similar to that of Berea
sandstone.
As with Berea sandstone, rock deformation is divided into three stages based on
the characteristics of stress-strain curves: linear elastic deformation, inelastic
deformation and after peak strength. It can be seen that Indiana limestone demonstrates
appreciable ductile behavior. No drastic drop in differential stress is observed at low

51
confining pressure (10.9 MPa) and work hardening is observable at high confining
pressure (17.4 MPa). Therefore it is believed that inelastic deformation such as
microcracking is more homogeneously developed in the rock specimen.
For Indiana limestone, the variation of axial permeability is also well correlated
to different deformational stages. At all three tested confining pressure levels, the
variation of axial permeability behaves very similar in the first two stages. In the linear
elastic deformation stage, axial permeability decreases at relatively lower speed. Unlike
Berea sandstone, the decrease of axial permeability no longer resembles linear
relationship. In the inelastic deformation stage, axial permeability tends to decrease more
rapidly. It is interesting to note that the decrease of axial permeability first accelerates
and then decelerates, which is shown in all three tests. This phenomenon can be also
observed in the Berea sandstone which exhibits ductile behavior. At this stage, it seems
that initial alteration of pore space by process like microcracking has a stronger impact
on axial permeability. As pore space is further altered, the decrease of axial permeability
tends to stabilize to a lower speed. In the third stage, different Indiana specimen behaves
rather differently. At low confining pressure (10.9 MPa), axial permeability reverses
from decrease to increase. At intermediate confining pressure (17.4 MPa), axial
permeability increases slightly at the end. While at high confining pressure (30.2 MPa),
axial permeability decreases slightly at the end.

52
Fig. 4.23 Differential stress and axial permeability versus strain (Indiana limestone Pc = 10.9 MPa)
Fig. 4.24 Differential stress and axial permeability versus strain (Indiana limestone Pc = 17.4 MPa)
0
0.4
0.8
1.2
1.6
0
20
40
60
80
-1.5 -1 -0.5 0 0.5 1
Axi
al P
erm
eabi
lity
(mD
)
Diff
eren
tial S
tress
(MPa
)
Strain (%)
Indiana Limestone Pc=10.9MPa
Axial Strain
Radial Strain
Volumetric Strain
Axial Permeability inelastic
after peak strength
linear elastic
0
0.4
0.8
1.2
1.6
0
20
40
60
80
100
-1 -0.5 0 0.5 1
Axi
al P
erm
eabi
lity
(mD
)
Diff
eren
tial S
tress
(MPa
)
Strain (%)
Indiana Limestone Pc=17.4MPa
Axial Strain
Radiall Strain
Volumetric Strain
Axial Permeability
inelastic after peak strength linear elastic

53
Fig. 4.25 Differential stress and axial permeability versus strain (Indiana limestone Pc = 30.2 MPa)
SEM pictures images were also obtained for both intact and broken rock surfaces
of Indiana limestone. As can be seen in Fig. 4.26, the intact rock surface and the fracture
rock surface are comparable. The left SEM image shows grains of Indiana limestone are
well cemented and almost indistinguishable. Several microcracks are observable. In the
right SEM image, fine particles produced by fracturing and sliding are also observable.
Microcracks are also observable. However, pore structure was not altered as
significantly as for Berea sandstone. It is possible that the formation of macroscopic
fracture plays a different role on Indiana limestone. In Berea sandstone, the formation
and sliding of macroscopic fracture produces abundance fine particles which are pushed
into pore spaces, leading to dramatic decrease in axial permeability. However, Indiana
limestone is much less permeably and not many fine particles are produced. Therefore,
0
0.2
0.4
0.6
0.8
0
20
40
60
80
100
120
-1 -0.5 0 0.5 1
Axi
al P
erm
eabi
lity
(mD
)
Diff
eren
tial S
tress
(MPa
)
Strain (%)
Indiana Limestone Pc= 30.2MPa
Axial Strain
Radial Strain
Volumetric Strain
Axial Permeability
inelastic after
peak strength linear elastic

54
pore space and microcracks are connected after formation of fracture, which results in an
increase in axial permeability. From Fig. 4.9 we can see that the rock specimen tested at
low confining pressure (10.9 MPa) developed a single fracture, while the other two
specimens tested at higher confining pressures (17.4 MPa, 30.2 MPa) have no noticeable
fractures. The presence of macroscopic fracture helps connect pore space and
microcracks on two sides of fracture surface, which results in the increase of axial
permeability after failure. While at confining pressure of 30.2 MPa, rock specimen
exhibits work hardening, which indicates the shear-enhanced cataclastic flow as the
major deformation mechanism. As microcracking distributes fairly homogenously
throughout rock specimen, pore structure is further altered, resulting in increasing
tortuosity and decreasing axial permeability. The test at confining pressure of 17.4 MPa
seems to be transitional, microcracking distributes rather locally. The variation of axial
permeability depends on the extent of localization of inelastic deformation.
Fig. 4.26 SEM images of Indiana limestone: Left, intact rock surface; Right, fracture rock surface (200x magnification)

55
4.3.3 Westerly granite
The permeability of intact Westerly granite is in nanodarcy scale; our
experimental setup is not capable of measuring such a low permeability. As a result,
axial permeability was not measured for Westerly granite before failure. However,
attempts were made to measure the axial permeability after rock failure. For uniaxial
compression test, multiple vertical fractures were created after failure. Rock specimen
was kept at a constant initial hydrostatic pressure of 10.4 MPa for some time, which
allowed the fractured dry specimen to be fully saturated. The saturation process was long
enough so that a steady flow of pore fluid was established. Then hydrostatic pressure
was increased at a constant rate of 3.5 MPa/min, which was slow enough to allow
continuous axial permeability measurement. Fig. 4.27 shows the hydrostatic pressure
and axial permeability versus volumetric strain. As shown in the plots, the decrease of
axial permeability experiences two stages. At initial loading, axial permeability
decreases rapidly, which is mostly due to the rapid initial fracture closure. As hydrostatic
pressure further increases, the contact of fracture planes reaches a point that fracture
closure slows down. As a result, the decrease of axial permeability slows down as well.

56
Fig. 4.27 Hydrostatic pressure and axial permeability versus volumetric strain (Uniaxially fractured Westerly granite)
For triaxial compression test at confining pressure of 6.9 MPa, it was also
attempted to measure axial permeability after rock failure. However, the jacket that
separates rock specimen from confining oil was broken during saturation. As a result,
axial permeability measurement was not successful. For triaxial compression test at
confining pressure of 20.7 MPa, rock specimen was successfully saturated after failure.
But soon after the start of hydrostatic compression test, specimen jacket was broken
again. During triaxial compression test, jacket was already deformed with the
deformation of rock specimen. Therefore, further deformation of rock specimen can
easily break jacket, which is a major problem for axial permeability measurement of
fractured rock. However, the initial axial permeability of fractured rock specimen at
confining pressure of 20.7 MPa was obtained from the saturation process. The
determined axial permeability is 0.55 mD, which is much lower than that of uniaxially
fractured specimen. As can be seen in Fig. 4.12, uniaxial compression created multiple
0
2
4
6
8
10
12
14
16
0
10
20
30
40
50
60
0 0.2 0.4 0.6 0.8 1 1.2 1.4
Aia
l Per
mea
bilit
y (m
D)
Hyd
rost
atic
Pre
ssur
e (M
Pa)
Volumetric Strain (%)
Westerly Granite Hydrostatic Compression
Hydrostatic Pressure
Axial Permeability

57
vertical fractures, while only one fracture connects the end surfaces of rock specimen for
triaxial compression test at 20.7 MPa confining pressure. This is probably the main
reason that uniaxially fractured specimen has a much higher initial axial permeability.
4.3.4 Summary
In this section, the axial permeability data was analyzed along with triaxial
compression test data for Berea sandstone, Indiana limestone and Westerly granite.
SEM images were used to improve the understanding of the effect of rock deformation
on axial permeability variation. Axial permeability can be well correlated to different
rock deformational stages. It was found that rock deformation alters pore structures and
hence impact fluid flow through rock. For permeable rock like Berea sandstone and
Indiana limestone, the destruction of pore structure by rock deformation usually leads to
the decrease of axial permeability. For tight rock like Westerly granite, fractures created
by rock deformation significantly improve the ease of fluid flow.
4.4 Acoustic emission monitoring
It was intended to monitor acoustic emission response during triaxial
compression and axial permeability measurement. However, the flow of pore fluid
generates significant amount of high strength noise, which completely blankets the
signal generated during rock deformation. As a result, there is no point to monitor AE
during triaxial compression with axial permeability measurement as no valuable
information can be obtained. In order to obtain AE data of Berea sandstone and Indiana
limestone, AE monitoring was performed on a different set of specimens without axial
permeability measurement at corresponding confining pressures. This set of specimens

58
was prepared from the same block for axial permeability measurement. For Westerly
granite and tuff, AE monitoring was conducted on the same set of specimens as axial
permeability measurement was only attempted after rock failure.
4.4.1 Berea sandstone
AE monitoring was performed on Berea sandstone at confining pressures of 8.2
MPa, 18.5 MPa, 32.2 MPa and 45.9 MPa, which correspond to the confining pressure
levels used in the axial permeability measurement. The threshold amplitudes used in
these tests are around 55 dB. Figs. 4.28-31 show stress-strain curves as well as AE rate
versus axial strain curve. AE data was collected with the change of time. The axial strain
in the AE rate curve was converted from time by multiplying strain rate applied during
triaxial compression test.
At confining pressure of 8.2 MPa (Fig. 4.28), AE rate stays at low level at the
early stage of loading. It increases with increasing stress. After peak strength, AE rate
reaches its peak value and maintains at high level until the final fracturing of rock
specimen.
At confining pressure of 18.5 MPa (Fig. 4.29), AE rate keeps increasing until the
time of rock failure. It drops to a low level with the drop of differential stress at the time
of brittle fracturing. As broken rock specimen starts sliding, AE rate climbs and
maintains at a level during steady frictional sliding.

59
Fig. 4.28 Differential stress and AE rate versus axial strain (Berea sandstone Pc = 8.2 MPa)
Fig. 4.29 Differential stress and AE rate versus axial strain (Berea sandstone Pc = 18.5 MPa)
0
50
100
150
200
250
0
20
40
60
80
100
0 0.2 0.4 0.6 0.8 1 1.2
AE
Rat
e (e
vent
/sec
ond)
Diff
eren
tial
Stre
ss (M
Pa)
Strain (%)
Berea Sandstone Pc=8.2MPa
Differential Stress
AE Rate
0
100
200
300
400
500
0
20
40
60
80
100
120
140
0 0.2 0.4 0.6 0.8 1 1.2 1.4 1.6
AE
Rat
e (e
vent
/sec
ond)
Diff
eren
tial
Stre
ss (M
Pa)
Strain (%)
Berea Sandstone Pc=18.5MPa
Differential Stress
AE Rate

60
At higher confining pressure levels (32.2 MPa and 45.9 MPa, Figs. 4.30-31), AE
rate quickly increases to its peak value and maintains at this high level until sliding
occurs. It is interesting to note that the highest AE rate at confining pressures of 18.5
MPa, 32.2 MPa and 45.9 MPa is consistently similar, which is around 300
events/second. High AE rate marks strong microcracking during loading. It is apparent
that higher confining pressure leads to longer period of strong microcracking. As a
result, pore structure would be more severely destroyed, resulting in more pronounced
permeability decrease.
Fig. 4.30 Differential stress and AE rate versus axial strain (Berea sandstone Pc = 32.2 MPa)
0
100
200
300
400
500
600
0
30
60
90
120
150
180
0 0.5 1 1.5 2
AE
Rat
e (e
vent
/sec
ond)
Diff
eren
tial
Stre
ss (M
Pa)
Strain (%)
Berea Sandstone Pc=32.2MPa
Differential Stress
AE Rate

61
Fig. 4.31 Differential stress and AE rate versus axial strain (Berea sandstone Pc = 45.9 MPa)
4.4.2 Indiana limestone
AE monitoring was performed on Indiana limestone at confining pressures of
10.9 MPa, 17.4 MPa and 30.2 MPa, which correspond to the confining pressure levels
used in the axial permeability measurement. The threshold amplitudes used in these tests
are around 45 dB. Figs. 4.32-34 show stress-strain curves as well as AE rate versus axial
strain curve.
Even though the threshold amplitude of Indiana limestone is lower than that of
Berea sandstone, AE signal for Indiana limestone is almost negligible. The highest AE
rate in three tests is only 3 events/second, while for Berea sandstone the highest AE rate
is over 300 events/second. This indicates different deformation mechanisms for Berea
sandstone and Indiana limestone. Micromechanical study by Menéndez et al. (1996)
shows that inelastic deformation of clastic rock, such as Berea sandstone, primarily
results from grain crushing initiated by the stress concentration at grain contacts. While
0
100
200
300
400
500
600
700
0
40
80
120
160
200
0 0.5 1 1.5
AE
Rat
e (e
vent
/sec
ond)
Diff
eren
tial S
tress
(MPa
)
Strain (%)
Berea Sandstone Pc=45.9MPa
Differential Stress
AE Rate

62
for limestone, the inelastic deformation mainly comes from pore collapse, which initiates
from stress concentration on the surface of pore structure. It seems that grain crushing in
Berea sandstone produces much higher acoustic energy, comparing to pore collapse in
Indiana limestone.
Fig. 4.32 Differential stress and AE rate versus axial strain (Indiana limestone Pc = 10.9 MPa)
0
2
4
6
8
10
0
20
40
60
80
100
0 0.2 0.4 0.6 0.8 1 1.2 1.4
AE
Rat
e (e
vent
/sec
ond)
Diff
eren
tia S
tress
(MPa
)
Strain (%)
Indiana Limestone Pc=10.9MPa
Differential Stress
AE Rate

63
Fig. 4.33 Differential stress and AE rate versus axial strain (Indiana limestone Pc = 17.4 MPa)
Fig. 4.34 Differential stress and AE rate versus axial strain (Indiana limestone Pc = 30.2 MPa)
0
2
4
6
8
10
0
20
40
60
80
100
0 0.2 0.4 0.6 0.8 1
AE
Rat
e (e
vent
/sec
ond)
Diff
eren
tial S
tress
(MPa
)
Strain (%)
Indiana Limeston Pc=17.4MPa
Differential Stress
AE Rate
0
2
4
6
8
10
0
20
40
60
80
100
120
0 0.5 1 1.5 2
AE
Rat
e (e
vent
/sec
ond)
Diff
eren
tial S
tress
(MPa
)
Strain (%)
Indiana Limetstone Pc=30.2MPa
Differential Stress
AE Rate
64
4.4.3 Westerly granite
AE monitoring was conducted for all three compression tests on Westerly
granite. Figs. 4.35-37 show stress-strain curves as well as AE rate versus axial strain
curve.
For uniaxial compression test, AE rate increases with increasing axial strain and
reaches its peak value at the time of failure. After failure, AE rate decreases to almost
zero. It can be seen in Fig. 4.12 that several vertical fractures were created. As axial
strain further increases, rock specimen almost lost its entire load carrying capability.
Fig. 4.35 Differential stress and AE rate versus axial strain (Westerly granite uniaxial compression)
For triaxial compression at confining pressure of 6.9 MPa (Fig. 4.36), AE rate
increases with increasing axial strain and reaches its peak value before failure. At the
time of failure, AE rate drops and then immediately goes back to peak value as fractured
0
50
100
150
200
0
20
40
60
80
100
0 0.05 0.1 0.15 0.2 0.25
AE
Rat
e (e
vent
/sec
ond)
Axi
al S
tress
(MPa
)
Axial Strain (%)
Westerly Granite Uniaxial Compression
Axial Stress
AE Rate

65
rock specimen slides. It can be seen that rock sliding generates relatively constant AE
response.
Fig. 4.36 Differential stress and AE rate versus axial strain (Westerly granite Pc = 6.9 MPa)
For triaxial compression test at confining pressure of 20.7 MPa (Fig. 4.37),
similarly, AE rate increases with increasing axial strain and reaches its peak value before
failure. Comparing to lower confining pressure, the peak value of AE rate is reached
earlier with respect to the peak strength of rock specimen. At the time of failure, AE rate
doesn’t drop but maintains at the peak value.
0
200
400
600
800
0
50
100
150
200
250
0 0.1 0.2 0.3 0.4 0.5 0.6
AE
Rat
e (e
vent
/sec
ond)
Diff
eren
tial
Stre
ss (M
Pa)
Strain (%)
Westerly Granite Pc=6.9MPa
Differential Stress
AE Rate

66
Fig. 4.37 Differential stress and AE rate versus axial strain (Westerly granite Pc = 20.7 MPa)
For three different compression tests, peak AE rate increases with increasing
confining pressure. This indicates that more damage is accumulated in rock to arrive at
failure at higher confined conditions.
4.4.4 Tuff
AE monitoring was performed on all three tuff specimens at the same confining
pressure. The AE response of tuff specimens is different from all other three rock types
(Figs. 4.38-40). In the linear elastic part of the stress-strain curve, AE rate is almost zero.
As rock starts yielding, AE rate increases rapidly and attains its peak value after peak
strength of rock. Unlike Berea sandstone and Westerly granite which almost maintain a
constant peak value, AE rate fluctuates considerably at high level for tuff specimens.
Comparing to Berea sandstone and Westerly granite, the peak value of AE rate for tuff is
much lower, which is below 50 events/second.
0
200
400
600
800
1000
0
50
100
150
200
250
300
350
0 0.1 0.2 0.3 0.4 0.5 0.6
AE
Rat
e (e
vent
/sec
ond)
Diff
eren
tia S
tress
(MPa
)
Strain (%)
Westerly Granite Pc=20.7MPa
Differential Stress
AE Rate

67
Fig. 4.38 Differential stress and AE rate versus axial strain (Tuff-3V Pc = 20.7 MPa)
Fig. 4.39 Differential stress and AE rate versus axial strain (Tuff-4V Pc = 20.7 MPa)
0
10
20
30
40
50
0
40
80
120
160
0 0.5 1 1.5 2 2.5 3 3.5
AE
Rat
e (e
vent
/sec
ond)
Diff
eren
tial S
tress
(MPa
)
Strain (%)
Tuff-3V Pc=20.7MPa
Differential Stress
AE Rate
0
10
20
30
40
50
0
40
80
120
160
0 0.5 1 1.5 2 2.5 3
AE
Rat
e (e
vent
/sec
cond
)
Diff
eren
tial S
tress
(MPa
)
Strain (%)
Tuff-4V Pc=20.7MPa
Differential Stress
AE Rate

68
Fig. 4.40 Differential stress and AE rate versus axial strain (Tuff-1H Pc = 20.7 MPa) 4.4.5 Summary
In this section, the AE data was analyzed along with triaxial compression test
data of four types of rocks. Although each rock type has its unique AE response during
rock deformation, it seems that the AE response can be well correlated to the brittleness
and ductility of rock. Ductile rocks like Indiana limestone and tuff generate very low AE
response, while brittle Berea sandstone and Westerly granite produce much higher AE
rate throughout rock deformation.
0
10
20
30
40
50
0
40
80
120
160
0 0.2 0.4 0.6 0.8 1 1.2
AE
Rat
e (e
vent
/sec
ond)
Diff
eren
tial S
tress
(MPa
)
Strain (%)
Tuff-1H Pc=20.7MPa Differential Stress
AE Rate
69
5. CONCLUSION & RECOMMENDATION
In this study, four different rock types, including Berea sandstone, Indiana
limestone, Westerly granite and tuff, were tested for mechanical, axial permeability and
acoustic emission data. Based on experimental results, following conclusions can be
drawn
1. Mechanical data shows that Berea sandstone and Westerly granite are relatively
brittle, while Indiana limestone and tuff are relatively ductile.
2. Rock deformation alters pore structures and hence impact fluid flow through rock.
For permeable rock like Berea sandstone and Indiana limestone, the destruction of
pore structure by rock deformation usually leads to decrease of axial permeability.
For tight rock like Westerly granite, fractures created by rock deformation
significantly improve the ease of fluid flow.
3. AE response of rock deformation is strongly dependent on rock type. Brittle Berea
sandstone and Westerly granite produce high AE rate during compression test, while
ductile Indiana limestone and tuff generate very low AE rate.
Recommendations for future work are listed as follows
1. It is recommended to apply alternative permeability measurement technique to
measure permeability variation of tight rock during triaxial compression test before
failure.

70
2. It is also interesting to test more rock types with wider permeability range, so that
more comprehensive study can be performed on the dependence of permeability on
rock deformation.

71
REFERENCES
Bӧker, R. (1915). Die Mechanik der bleibenden Formӓnderung in kristallinisch
aufgebauten Kӧrpern (The mechanics of permanent deformation in chrystalline
bodies). Ver. dt. Ing. Mitt. Forsch., 175, 1-51.
Brace, W. (1978). A note on permeability changes in geologic material due to stress.
Pure and Applied Geophysics, 116(4-5), 627-633.
Brace, W., & Martin, R. (1968). A test of the law of effective stress for crystalline rocks
of low porosity. International Journal of Rock Mechanics and Mining Sciences
& Geomechanics Abstracts, 5(5), 415-426.
Brace, W., Walsh, J., & Frangos, W. (1968). Permeability of granite under high pressure.
Journal of Geophysical Research, 73(6), 2225-2236.
Costin, L. (1983). A microcrack model for the deformation and failure of brittle rock.
Journal of Geophysical Research: Solid Earth (1978–2012), 88(B11), 9485-
9492.
Fortin, J., Stanchits, S., Dresen, G., & Gueguen, Y. (2009). Acoustic emissions
monitoring during inelastic deformation of porous sandstone: comparison of
three modes of deformation. Pure and Applied Geophysics, 166(5-7), 823-841.
Handin, J., & Hager Jr, R. V. (1957). Experimental deformation of sedimentary rocks
under confining pressure: Tests at room temperature on dry samples. AAPG
Bulletin, 41(1), 1-50.

72
Hirata, T. (1987). Omori's power law aftershock sequences of microfracturing in rock
fracture experiment. Journal of Geophysical Research: Solid Earth (1978–2012),
92(B7), 6215-6221.
Holcomb, D. J. (1993). General theory of the Kaiser effect. International Journal of
Rock Mechanics and Mining Sciences & Geomechanics Abstracts, 30(7), 929-
935.
Kaiser, J. (1950). An investigation into the occurrence of noises in tensile tests, or a
study of acoustic phenomena in tensile tests. Ph. D. thesis, Tech. Hochsch.
Munchen, Munich, Germany.
Kranz, R., Satoh, T., Nishizawa, O., Kusunose, K., Takahashi, M., Masuda, K., &
Hirata, A. (1990). Laboratory study of fluid pressure diffusion in rock using
acoustic emissions. Journal of Geophysical Research: Solid Earth (1978–2012),
95(B13), 21593-21607.
Lei, X. L., Kusunose, K., Nishizawa, O., Cho, A., & Satoh, T. (2000). On the spatio‐
temporal distribution of acoustic emissions in two granitic rocks under triaxial
compression: The role of pre-existing cracks. Geophysical Research Letters,
27(13), 1997-2000.
Lockner, D. (1993). The role of acoustic emission in the study of rock fracture.
International Journal of Rock Mechanics and Mining Sciences & Geomechanics
Abstracts, 30(7), 883-899.

73
Lockner, D., & Byerlee, J. (1977). Acoustic emission and creep in rock at high confining
pressure and differential stress. Bulletin of the Seismological Society of America,
67(2), 247-258.
Menéndez, B., Zhu, W., & Wong, T. f. (1996). Micromechanics of brittle faulting and
cataclastic flow in Berea sandstone. Journal of Structural Geology, 18(1), 1-16.
Paterson, M. (1958). Experimental deformation and faulting in Wombeyan marble.
Geological Society of America Bulletin, 69(4), 465-476.
Scholz, C. (1968). Microfracturing and the inelastic deformation of rock in compression.
Journal of Geophysical Research, 73(4), 1417-1432.
Stanchits, S., Vinciguerra, S., & Dresen, G. (2006). Ultrasonic velocities, acoustic
emission characteristics and crack damage of basalt and granite. Pure and
Applied Geophysics, 163(5-6), 975-994.
Terzaghi, K. (1923). Die Berechnung der Durchlässigkeitsziffer des Tones aus dem
Verlauf der hydrodynamischen Spannungserscheinungen. Akad Wissensch Wien
Sitzungsber Mathnaturwissensch Klasse IIa, 132, 105-124.
von Kármán, T. (1911). Festigkeitsversuche unter allseitigem Druck (Strength
measurements under uniforme pressure). Zeit. Ver. dt. Ing., 55, 1749-1757.
Walsh, J. (1981). Effect of pore pressure and confining pressure on fracture
permeability. International Journal of Rock Mechanics and Mining Sciences &
Geomechanics Abstracts, 18(5), 429-435.
Wang, J. A., & Park, H. (2002). Fluid permeability of sedimentary rocks in a complete
stress-strain process. Engineering Geology, 63(3), 291-300.

74
Wong, T. f., David, C., & Zhu, W. (1997). The transition from brittle faulting to
cataclastic flow in porous sandstones: Mechanical deformation. Journal of
Geophysical Research: Solid Earth (1978–2012), 102(B2), 3009-3025.
Zhu, W., & Wong, T. f. (1997). The transition from brittle faulting to cataclastic flow:
Permeability evolution. Journal of Geophysical Research: Solid Earth (1978–
2012), 102(B2), 3027-3041.
Zoback, M. D., & Byerlee, J. D. (1975). Permeability and effective stress: Geologic
note. AAPG Bulletin, 59(1), 154-158.
Zoback, M. D., & Byerlee, J. D. (1976). Effect of high-pressure deformation on
permeability of Ottawa sand. AAPG Bulletin, 60(9), 1531-1542.