hysteresis characteristics of brittle rock deformation
TRANSCRIPT

906 Technical Gazette 27, 3(2020), 906-911
ISSN 1330-3651 (Print), ISSN 1848-6339 (Online) https://doi.org/10.17559/TV-20180705053718 Original scientific paper
Hysteresis Characteristics of Brittle Rock Deformation under Constant Load Cyclic Loading and Unloading
Peijie LOU, Chengjie LI, Shuling LIANG, Mingming FENG, Bin PAN
Abstract: This paper mainly explores the deformation characteristics of limestone specimens under constant load cyclic loading. For limestone specimens under uniaxial compression, the stress-strain curve can be divided into three stages: compaction stage, elastic stage and sudden failure stage. Under cyclic loading, the hysteresis loop on the stress-strain curve is long and thin, taking the shape of "toothpicks". The axial strain and radial strain both change with the stress amplitude and cycle number, but in different variation patterns. There is a stress amplitude "threshold" for radial deformation, indicating that the radial deformation is more sensitive to stress amplitude than the axial deformation. It is calculated that the incremental deformation between peaks includes both plastic deformation and the deformation recoverable after unloading, and the recoverable deformation is positively correlated with the load amplitude of the cyclic loading. Keywords: cyclic loading and unloading; deformation threshold; hysteresis deformation; recoverable deformation
1 INTRODUCTION
In the underground mining process, the tunnel excavation layout is usually quite complicated. Due to the impact of nearby roadways, chamber excavation or coal seam mining [1-2], the loads received by the roadway surrounding rock are cyclical, therefore, some researchers have conducted in-depth studies on the mechanics of rocklike materials under cyclic loads and achieved good results [3-5]. As a natural geological material, rocks often have a large number of micro-cracks, pores and other defects inside their structures; under the action of cyclic loading, they would exhibit accumulated plastic deformation, and thereby forming hysteresis curves [6-7]. Zhang Yuan et al. [8] divided the hysteresis loop into the loading section and the unloading section, and performed the fitting twice; then the relationship between the fitting parameters and the confining pressure was analyzed. Xiao Fukun et al. [9] conducted a uniaxial cyclic loading/unloading test on coal samples and found that the hysteresis loop was generated during the compaction phase of the cyclic loading/unloading process; when the coal sample was near failure, the irreversible plastic deformation in the compaction phase reached the maximum. Liu et al. [10] found in their research that, under cyclic loading, the degree of rock salt deformation damage was related to the stress level; when the stress level exceeded 40% of the uniaxial compressive strength, the specimen damage variable had an increasing trend. In fact, the plastic deformation accumulation of the specimen not only occurs in the axial direction (the loading/unloading direction), but also in the radial direction [11]. Wang Ke et al. [12] investigated the axial and radial plastic deformation of sandstone and mudstone specimens, and found that when the failure of the specimen occurred, the radial cumulative plastic strain of the mudstone was close to the axial cumulative plastic strain, while the radial cumulative plastic strain of the sandstone was about 1/2 of the axial strain, and the higher the stress level, the greater the cumulative plastic strain.
With the applying and releasing of external loads, during the deformation recovery process of the specimen, besides plastic deformation, the specimen would exhibit a
different phenomenon, namely the damping characteristics of the rock materials [13-15]. Xiao Jianqing et al. [16] analyzed the non-linear elastic hysteresis characteristics of granite under constant amplitude cyclic loading/unloading, and discussed the possible forms of hysteresis loop based on the relationship between strain phase and stress phase. According to the test results of the damping parameters of fine sandstone and silty mudstone, Liu Jianfeng et al. [17] obtained the rock density, and the plastic deformation and damping characteristics under cyclic loading/unloading, and believed that the damping parameter characteristics can be preliminarily qualitatively determined by rock density. In literature [12], for both mudstone and sandstone, the radial damping ratio was greater than the axial damping ratio, and in the initial stage of cyclic loading, the radial damping ratio increased faster, the radial damping ratio and the axial damping ratio were linearly correlated, which showed that the rock specimen had damping characteristics in both radial and axial directions, and were related to the stress level.
Compared with mudstone and sandstone, the hard and brittle limestone may have different deformation characteristics. In this study, the brittle limestone specimens are subject to equal-load cyclic loading/unloading tests under different amplitudes; based on previous research, this study attempts to further explore the difference between the axial and radial deformation of rock specimens under cyclic loading. 2 TEST OVERVIEW
The rock samples in the test are taken from the tunneling face of a roadway in a coal mine in Huainan, China, and processed into Ø50×100 mm standard specimens in the lab. The preliminary specimens with similar longitudinal wave velocities are chosen for the test. The wave velocities of the selected specimens average at 3148.0 m/s. The test is performed on the MTS816 mechanical experiment system purchased by Anhui University of Science and Technology. Prior to the cyclic loading test, 3 specimens are selected to receive a uniaxial compression test. The result shows that the average strength of the specimens is 161.3 MPa. In reference to the
Peijie LOU et al.: Hysteresis Characteristics of Brittle Rock Deformation under Constant Load Cyclic Loading and Unloading
Tehnički vjesnik 27, 3(2020), 906-911 907
strength, the constant load cyclic loading and unloading test is performed for 10 cycles under different stress amplitudes, namely, 40 MPa, 85 MPa and 130 MPa. The three amplitudes share the same valley value: 30 MPa. Under each amplitude, 3 specimens are tested. Both the uniaxial test and cyclic loading test adopt the linear loading method and the loading and unloading rate of 0.5 MPa/s. After the end of the 10 cycles, the specimens are further loaded at the same rate till they fail.
Figure 1 Specimen to be loaded Figure 2 Damaged specimen
3 ANALYSIS OF TEST RESULTS 3.1 Analysis of Uniaxial Compression Deformation and
Failure Characteristics of Specimens
The specimens are mostly subjected to splitting failure and are broken into numerous similar-sized fragments as well as many chippings, showing obvious brittle damages (Fig. 2). Fig. 3 presents the uniaxial compressive stress-strain curve of one of the limestone specimens.
Figure 3 Stress-strain curve under uniaxial compression
According to the curve in Fig. 3, the deformation is
small in the compaction section, accounting for merely 1/4 of the total deformation; the relatively significant deformation takes place in the elastic stage, taking up a great portion in the total pre-failure deformation; in the elastic section, the curve is almost straight, and the elastic modulus (linear segment slope) remains largely the same. After that, some specimens suffer certain local damages (segment bc), as evidenced by the surface stripping and noise of the specimens in the test, while the main part of the specimens continue to withstand the axial load. Despite further loading, there is no obvious flattening of the curve,
the signal of unstable rupturing. The specimens undergo sudden failures, some of which even "explode" in the test. The post-failure segment is rather short. Under uniaxial compression, the stress-strain curve of limestone specimens can be divided into three distinctive stages: the compaction stage (oa), the elastic stage (ab) and the sudden failure stage (be). It is worth mentioning that the local damages prior to the overall failure section (bc) occur abruptly and affect the overall strength of the specimens. Therefore, the period after point b is regarded as the sudden failure stage
The failure process of the limestone specimens can be explained from the angle of energy accumulation and dissipation. From the beginning of loading to the failure, the test machine continuously inputs energy into the specimens. In the initial phase, the energy is partially absorbed by the compaction of cracks and fissures in the specimens. However, this part of energy only accounts for a small portion of the total input energy. Owing to the high rigidity of the specimens and the large proportion of elastic deformation in the total deformation before failure, most of the input energy is converted into the elastic energy of the specimens. Since the specimens are made up of fine rock particles, which are held tightly during the loading process, the deformation of the specimens is predominantly the elastic deformation of rock particles. The elastic energy rises "perpendicularly" until it reaches the energy storage limit of the rock. Any additional energy input would cause the sudden release of the elastic energy accumulated in the rock specimens, resulting in overall fragmentation of the specimens and countless rock fragments. No softening section is observed after the peak.
3.2 Deformation Characteristics of Specimens under
Cyclic Loading
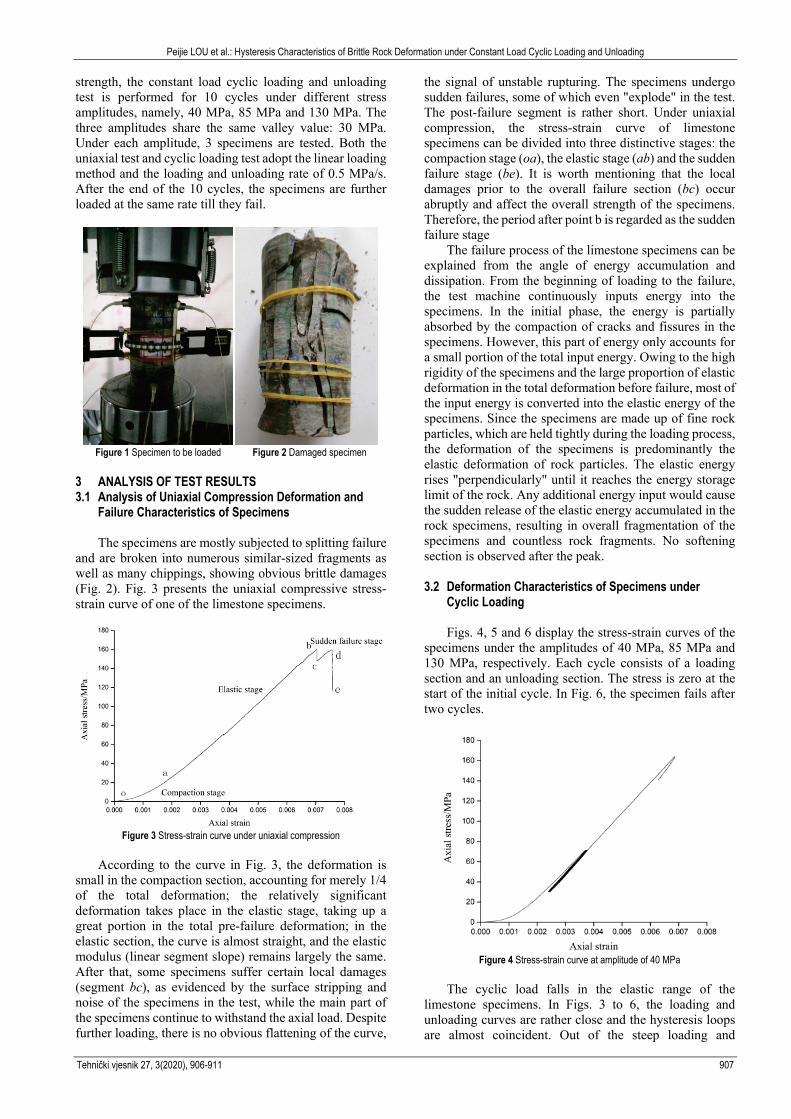
Figs. 4, 5 and 6 display the stress-strain curves of the specimens under the amplitudes of 40 MPa, 85 MPa and 130 MPa, respectively. Each cycle consists of a loading section and an unloading section. The stress is zero at the start of the initial cycle. In Fig. 6, the specimen fails after two cycles.
Figure 4 Stress-strain curve at amplitude of 40 MPa
The cyclic load falls in the elastic range of the
limestone specimens. In Figs. 3 to 6, the loading and unloading curves are rather close and the hysteresis loops are almost coincident. Out of the steep loading and

Peijie LOU et al.: Hysteresis Characteristics of Brittle Rock Deformation under Constant Load Cyclic Loading and Unloading
908 Technical Gazette 27, 3(2020), 906-911
unloading sections of each curve, the initial loading section has the smallest elastic modulus. The curves slightly bend upward in the unloading section. The hysteresis loop formed by the loading and unloading sections is long and thin, taking the shape of "toothpicks". The greater the amplitude, the larger the size of the hysteresis loop. It is difficult to identify the movement of the hysteresis loop because of the closeness between the loading and unloading curves. Based on Tab. 1 below, however, it is seen that the peak and valley values of axial strain are gradually increasing, indicating that the hysteresis loop is moving to the right. Most of the specimens fail at 160 MPa under the additional loading after the 10 cycles.
Figure 5 Stress-strain curve at amplitude of 85 MPa
Figure 6 Stress-strain curve at amplitude of 130 MPa
Specimen in Fig. 6 fails during the unloading in the
third cycle. Compared with the unbroken specimens at the end of other cycles, its curve is flattened right before the peak in the initial loading section. This means the specimen is not damaged despite the extensive development of cracks and fissures inside the specimen. The specimen does not survive the loading section of the third cycle, and fails with the additional axial deformation of 0.00012. The situation is explained as follows. The rock specimen is very sensitive to load when the axial load draws close to the ultimate strength of the specimen. At the peak load of the cyclic loading, the strain is close to the ultimate strain. Seriously damaged internally in the previous two cycles, the specimen deforms at a nearly constant speed and eventually fractures under the additional strain at the end of the loading section in the third cycle.
3.3 Variation in Peak and Valley Values of Strain
The rock specimens have a certain ultimate strain values. Once the strain reaches such limits, the specimens would be destabilized and damaged. The original data are processed to obtain the peak strain and valley strain of all the specimens. Tab. 1 lists the peak and valley values of strain for some specimens. The three types of specimens are loaded and unloaded under the stress amplitude of 40 MPa, 85 MPa and 130 MPa, respectively. It should be noted that the peak value of radial strain lags significantly behind the stress peak, but the lag does not occur to the peak and valley values of axial strain and the valley value of radial strain. The data in Tab. 1 are the extreme strain values within the strain cycle.
Figure 7 Stress-strain hysteresis curves of the specimens
The analysis of test data shows that: 1. Under the same
stress amplitude, the peak and valley values of axial and radial strains of the rock specimens increase with the cycle number, and the axial strain has higher peak and valley values than radial strain; 2. Within the same cycle, the peak value of axial strain grows with the increase in the stress amplitude. The variation pattern is easy to understand because the specimens are more deformed under higher amplitude. However, the peak value of radial strain is different with axial strain in the first few cycles, and gradually exhibits the same change law with further increase in cycle number. The results signify that, although the radial deformation is more discrete than axial deformation in the same rock specimen, the increase of the radial deformation is still relevant to the stress amplitude.
The peak and valley strains at points 1, 2 in the first cycle are contrasted (Fig. 7). Figs. 8 and 9 show the differences between the strain in each cycle and that in cycle 1 for the three specimens.
Through the comparison between Fig. 8 and Fig. 9, it is seen that the peak strain increment changes in a similar way with the value strain increment. The analysis of the variation in valley strain value in Fig. 8 indicates that: 1. The axial strain increases at different rates under different amplitudes; overall, the rate is accelerated as the amplitude increases and eventually tends to be stable. 2. Compared with the axial strain, the radial strain grows insignificantly under small amplitude and rises sharply under high amplitude; the increase is stabilized after the amplitude reaches a certain size. The tendencies are well

Peijie LOU et al.: Hysteresis Characteristics of Brittle Rock Deformation under Constant Load Cyclic Loading and Unloading
Tehnički vjesnik 27, 3(2020), 906-911 909
demonstrated by the incremental change curve of radial strain valley value of specimen II-6 in Fig. 8.
After the 10th cycle, the specimens II-16, II-17 and II-6 suffer 0.094, 0.123 and 0.146 of additional axial strains, respectively, and 0.049, 0.392 and 0.592 of additional radial strains. The increment of axial strain is smaller than that of radial strain. Although the specimens are subjected to more axial strain than radial strain, the radial strain grows at a faster rate. The stress amplitude has more impact on radial strain than axial strain. According to the incremental change curve of radial strain valley value, the
radial strain grows faster under the stress amplitude of 85 MPa than that of 30 MPa and finally reaches a stable state; under the stress amplitude of 130 MPa, the rate of increase in the radial strain is even more apparent. After the sixth cycle, the rate is gradually stabilized. This means the strain would reach the maximum as the cycle number grows, leading to the failure of the specimens. Hence, there is a stress amplitude "threshold" for radial deformation. Once the stress amplitude of cyclic loading exceeds the threshold, the specimens' radial strain would increase steadily and lead to the ultimate failure.
Table 1 Peak and valley values of strain in each cycle (some specimens)
Specimen number
Amplitude / MPa
Strain (×10−3)
Cycle number 1 2 3 4 5 6 7 8 9 10
Specimen II-16 40
Axial strain peak 3.826 3.889 3.921 3.930 3.945 3.952 3.955 3.954 3.957 3.960 Axial strain valley value 2.370 2.412 2.432 2.444 2.452 2.462 2.461 2.460 2.463 2.464
Radial strain peak 0.809 0.896 0.907 0.909 0.913 0.914 0.914 0.914 0.912 0.915 Radial strain valley value 0.628 0.656 0.664 0.670 0.672 0.674 0.677 0.676 0.677 0.677
Specimen II-17 85
Axial strain peak 6.341 6.363 6.385 6.399 6.406 6.423 6.440 6.462 6.476 6.493 Axial strain valley value 2.194 2.205 2.222 2.231 2.246 2.245 2.273 2.295 2.312 2.317
Radial strain peak 0.505 0.603 0.874 0.937 0.996 1.016 1.061 1.088 1.100 1.102 Radial strain valley value 0.123 0.168 0.341 0.402 0.430 0.443 0.487 0.502 0.509 0.515
Specimen II-6 130
Axial strain peak 7.995 8.044 8.065 8.218 8.218 8.245 8.259 8.262 8.270 8.282 Axial strain valley value 5.138 5.156 5.166 5.234 5.251 5.267 5.271 5.276 5.291 5.284
Radial strain peak 0.460 0.504 0.510 0.864 1.094 1.338 1.388 1.424 1.459 1.480 Radial strain valley value 0.166 0.176 0.183 0.414 0.578 0.755 0.769 0.791 0.831 0.858
Figure 8 Variation in valley strain value with cycle number
Figure 9 Variation in peak valley value with cycle number
In Fig. 9, the incremental change curve of strain peak
value has a similar tendency as the curve in Fig. 8. A possible explanation of the similarity goes as follows: the strain at the peak point in a cycle is the sum of the strain at
the valley point in the previous cycle and the incremental strain generated in the loading section of the current cycle. 3.4 Analysis of Recoverable Deformation Characteristics
The data in Tab. 1 are further processed to obtain the incremental strain of the peak and valley points in each cycle relative to the previous cycle (Tab. 2). The increment in the first cycle is zero.
In accordance with the sketch map of the cycles (Fig. 7), there are 10 cycles: the first cycle is 0-1-2, the second cycle is 2-3-4, ..., the last cycle is 18-19-20. In the sketch map, the incremental plastic strain between points 2 and 4 is assumed as the result of the loading section 23 and the unloading segment 34. Similarly, the plastic strain increment between two valley points is the total of the plastic strain increments generated in all loading and unloading sections between the two points. Based on the plastic strain analysis of peak points, the author makes the following assumptions: If the strain increment between points 1 and 3 is purely plastic strain increment, the incremental size should be the sum of the plastic strain increment generated in the unloading section 12 and that in the loading section 23. If the plastic strain increments generated in the loading section 23 and the unloading section 56 are added to the strain increment between the peak points 3 and 5, the result should be equal to the plastic strain increment between points 2 and 6. Hence, the plastic strain increment between points 2 and 6 ought to be greater than that between the peak points 3 and 5. The plastic strain increment of the other points can be deducted in the same fashion. Nevertheless, these assumptions are proved invalid by actual calculation. Taking specimen II-17 as an example, the axial plastic strain between peak points 5 and 19 is greater than that between valley points 4 and 20; second example: the strain increment between peak points 5 and 7 in specimen II-6 stands at 1.533, even higher than

Peijie LOU et al.: Hysteresis Characteristics of Brittle Rock Deformation under Constant Load Cyclic Loading and Unloading
910 Technical Gazette 27, 3(2020), 906-911
the total plastic strain between valley points 2-10. This confirms that the incremental deformation between peaks includes both plastic deformation and the deformation recoverable after unloading. The recoverable deformation might be newly added elastic deformation or viscous deformation. It is positively correlated with the load amplitude of the cyclic loading. The radial strain has the
same phenomenon. For example, in specimen II-6, the total plastic strain increment generated in the two cycles between valley points 4 and 8 amounts to 2.383, while that generated in the one cycle between peak points 7 and 5 is as high as 3.543. Thus, the recoverable strain between peak points 5 and 7 is greater than 1.16.
Table 2 Incremental changes in strain peak value between adjacent strain peaks
Specimen number II-16 II-17 II-6 Specimen number II-16 II-17 II-6 Peak point number Peak increment of axial strain (×10−4) Valley point number Valley increment of axial strain (×10−4)
1-1 0 0 0 2-2 0 0 0 1-3 0.625 0.217 0.49 2-4 0.426 0.102 0.186 3-5 0.324 0.217 0.209 4-6 0.198 0.173 0.097 5-7 0.091 0.138 1.533 6-8 0.12 0.09 0.678 7-9 0.152 0.074 −0.004 8-10 0.073 0.153 0.174 9-11 0.072 0.17 0.274 10-12 0.101 −0.012 0.161 11-13 0.024 0.168 0.132 12-14 −0.006 0.278 0.034 13-15 −0.012 0.226 0.031 14-16 −0.006 0.22 0.053 15-17 0.034 0.141 0.084 16-18 0.024 0.175 0.148 17-19 0.026 0.163 0.118 18-20 0.009 0.051 −0.068
Specimen number II-16 II-17 II-6 Specimen number II-16 II-17 II-6 Peak point number Peak increment of radial strain (×10−4) Valley point number Valley increment of radial strain (×10−4)
1-1 0 0 0 2-2 0 0 0 1-3 0.874 0.981 0.433 2-4 0.287 0.448 0.103 3-5 0.105 2.705 0.064 4-6 0.077 1.729 0.07 5-7 0.024 0.629 3.543 6-8 0.058 0.613 2.313 7-9 0.042 0.597 2.301 8-10 0.015 0.273 1.632 9-11 0.011 0.196 2.432 10-12 0.026 0.137 1.775 11-13 −0.008 0.452 0.501 12-14 0.033 0.438 0.144 13-15 0 0.264 0.36 14-16 −0.016 0.144 0.213 15-17 −0.018 0.12 0.354 16-18 0.016 0.073 0.404 17-19 0.028 0.026 0.212 18-20 −0.007 0.062 0.273
In the above test, part of the deformation increment
between the peak points is recoverable, and the amount of recoverable deformation varies with the stress amplitude. For axial strain, the phenomenon is not obtained on specimen II-16 through the above calculation. However, it does not mean the phenomenon does not occur. The phenomenon is more prominent in specimen II-17, i.e. the recoverable deformation is greater in this specimen. The comparison shows that the increase of recoverable deformation depends on the stress amplitude: the larger the amplitude, the bigger the increment. Besides, the radial strain increment of a peak point is greater than the axial strain increment at the corresponding point (e.g. the radial strain increment 3.543 between peak points 5 and 7 is more than twice of the axial strain increment 1.533 between the two points), signifying that the cyclic load amplitude has a greater impact on the radial deformation increment. 4 CONCLUSION
(1) For limestone specimens under uniaxial compression,
the stress-strain curve can be divided into three stages: compaction stage, elastic stage and sudden failure stage. In the short-lasting third stage, the large amount of elastic energy accumulated in loading is suddenly released, causing irreversible damages to the rock specimens.
(2) Under cyclic loading, the limestone specimens' hysteresis loop is long and thin, taking the shape of "toothpicks". The greater the amplitude, the larger the size of the hysteresis loop. The rock specimens have certain ultimate strain values. Once the strain reaches
such limits, the rock specimens would be extremely sensitive to load. Under the action of the cyclic load amplitude, the specimens would suffer steady deformation and eventual rupturing when it is close to the ultimate strain.
(3) Under the same stress amplitude, the peak and valley values of axial and radial strains of the rock specimens increase with the cycle number; the peak value of axial strain grows with the increase in the stress amplitude, and the peak radial value is greatly discretized; the greater the stress amplitude, the more the radial strain increment.
(4) The axial plastic strain and radial plastic strain both increase with the stress amplitude. The greater the amplitude, the faster the increase. The axial plastic strain will be gradually stabilized under each of the three amplitudes; the radial strain grows insignificantly under small amplitude and rises sharply under high amplitude; the increase is stabilized after the amplitude reaches a certain size.
(5) The incremental deformation between peaks includes both plastic deformation and the deformation recoverable after unloading. The recoverable deformation might be newly added elastic deformation or viscous deformation. It is positively correlated with the load amplitude of the cyclic loading. The phenomenon has a greater impact on radial strain.
(6) This experiment only considers the (specific name) limestone, which is a brittle hard rock. The research results do not apply to the deformation and hysteresis characteristics of soft rocks in constant load cyclic loading and unloading under different stress

Peijie LOU et al.: Hysteresis Characteristics of Brittle Rock Deformation under Constant Load Cyclic Loading and Unloading
Tehnički vjesnik 27, 3(2020), 906-911 911
amplitudes. Repeated new tests are needed in the future to disclose the characteristics of soft rocks.
Acknowledgements
This paper is supported by: Opening Laboratory for Deep Mine Construction, Henan Polytechnic University (2015KF-05), Anhui Provincial Natural Science Foundation (1608085QE122), China Postdoctoral Science Foundation (2016M590558), The Open Project Program Foundation of Engineering Research Center of underground mine construction, Ministry of Education (Anhui University of Science and Technology) (2015KF04) and Graduate innovation fund of Anhui University of Science and Technology (2017CX2011, 2017CX2078). 5 REFERENCES [1] Yanhai, Z., Shuren, W., Hagan, P. et al. (2018). Evolution
characteristics of pressure-arch and elastic energy during shallow horizontal coal mining. Tehnički vjesnik, 25(3), 867-875. https://doi.org/10.17559/TV-20180305084447
[2] Ji, L., Q. Xubo, Wenshuo, W. et al. (2019). Distribution law of principal stress difference of deep surrounding rock of gob-side entry and optimum design of coal pillar width. Tehnički vjesnik, 26(6), 1743-1752.
https://doi.org/10.17559/TV-20190813163025 [3] Xuejun, Z., Yangyang, L., Changxiang, W. et al. (2019).
Deformation failure characteristics and loading rate effect of sandstone under uniaxial cyclic loading and unloading. Geotechnical and Geological Engineering, 37, 1147-1154.
https://doi.org/10.1007/s10706-018-0674-9 [4] Jiawen, Z., Xingguo, Y., Wenxi, F. et al. (2010).
Experimental test and fracture damage mechanical characteristics of brittle rock under uniaxial cyclic loading and unloading conditions. Chinese Journal of Rock Mechanics and Engineering, 29(6), 1172-1183.
[5] Sigmund, V., Zovkić, J., & Guljaš, I. (2014). Behaviour of RC frame with strong masonry infill in response to cyclic horizontal loading. Tehnički vjesnik, 21(2), 389-399.
[6] Jie, X., Gang, P., Yuan, D. et al. (2016). Hysteresis loop characteristics of concrete under cyclic loading and unloading. Hydro-Science and Engineering, 6, 97-102.
[7] Tiantao, L., Xiangjun, P., Dongpo, W. et al. (2019). Nonlinear behavior and damage model for fractured rock under cyclic loading based on energy dissipation principle. Engineering Fracture Mechanics, 206, 330-341.
https://doi.org/10.1016/j.engfracmech.2018.12.010 [8] Yuan, Z., Jiang, X., Hongwei, Y. et al. (2011). Effect of
confining pressure on evolution law of hysteresis loop of sandstone under cyclic loading. Chinese Journal of Rock Mechanics and Engineering, 30(2), 320-326.
[9] Fukun, X., Zhiliang, S., Gang, L. et al. (2014). Relationship between hysteresis loop and elastoplastic strain energy during cyclic loading and unloading. Chinese Journal of Rock Mechanics and Engineering, 33(9),1791-1797.
[10] Jianfeng, L., Heping, X., Zhengmeng, H. et al. (2014). Damage evolution of rock salt under cyclic loading in unixial tests. Acta Geotech, 9, 153-160.
https://doi.org/10.1007/s11440-013-0236-5 [11] Deyi, J., Jinyang, F., Jie, C. et al. (2016). A mechanism of
fatigue in salt under discontinuous cycle loading. International Journal of Rock Mechanics and Mining Sciences, 86, 255-260.
https://doi.org/10.1016/j.ijrmms.2016.05.004 [12] Ke, W., Danguang, P., Wenyan, L. et al. (2019).
Experimental study on damping characteristics of mudstone
and sandstone under graded cyclic loading. Journal of Central South University (Science and Technology), 50(12), 3046-3054.
[13] Jianqing, X., Xiating, F., Dexin, D. et al. (2010). Study of hysteresis and damping effect of rock subjected to constant amplitude cyclic loading. Chinese Journal of Rock Mechanics and Engineering, 29(8), 1677-1 683.
[14] Beibei, Y., Mingming, H., & Yunsheng, C. (2020). Experimental study of nonlinear damping characteristics on granite and red sandstone under the multi-level cyclic loading-unloading triaxial compression. Arabian Journal of Geosciences, 13, 72. https://doi.org/10.1007/s12517-019-5022-8
[15] Kumar, A., Manna, B., & Rao, K. S. (2013). Dynamic Response of Block Foundations Resting on Soil–Rock and Rock–Rock System Under Vertical Excitation. Indian Geotechnical Journal, 43, 83-95.
https://doi.org/10.1007/s40098-012-0036-0 [16] Jianqing, X., Xiating, F., Deqin, D. et al. (2010). Study of
hysteresis and damping effect of rock subjected to constant amplitude cyclic loading. Chinese Journal of Rock Mechanics and Engineering, 29(8), 1677-1 683.
[17] Jianfeng, L., Jin, X., Qingsong, L. et al. (2010). Experimental research on damping parameters of rock under cyclic loading. Chinese Journal of Rock Mechanics and Engineering, 29(5), 1036-1041.
Contact information: Peijie LOU, lecturer School of Civil and Architectural Engineering, Anhui University of Science and Technology, 232001Huainan, China Opening Laboratory for Deep Mine Construction, Henan Polytechnic University, 454000Jiaozuo, China Center for Post-Doctoral Studies of Civil Engineering, Anhui University of Science and Technology, 232001Huainan, China Engineering Research Center of Underground Mine Construction, Ministry of Education, Anhui University of Science and Technology, 232001Huainan, China E-mail: [email protected] Chengjie LI, PhD candidate (Corresponding author) School of Civil and Architectural Engineering, Anhui University of Science and Technology, 232001Huainan, China E-mail: [email protected] Shuling LIANG, assistant experimentalist School of Civil and Architectural Engineering, Anhui University of Science and Technology, 232001Huainan, China E-mail: [email protected] Mingming FENG, master degree candidate School of Civil and Architectural Engineering, Anhui University of Science and Technology, 232001Huainan, China E-mail: [email protected] Bin PAN, master degree candidate School of Civil and Architectural Engineering, Anhui University of Science and Technology, 232001Huainan, China E-mail: [email protected]