experimental study of laser-initiated radiofrequency ...legolas.ece.wisc.edu/papers/luo_06.pdfieee...
TRANSCRIPT

IEEE TRANSACTIONS ON PLASMA SCIENCE, VOL. 34, NO. 6, DECEMBER 2006 2637
Experimental Study of Laser-InitiatedRadiofrequency-Sustained
High-Pressure PlasmasSiqi Luo, Member, IEEE, John E. Scharer, Senior Member, IEEE,
Magesh Thiyagarajan, Student Member, IEEE, and C. Mark Denning, Member, IEEE
Abstract—Experiments are performed using 193-nm ultravioletlaser preionization of a seed gas in atmospheric pressure rangeargon and nitrogen to initiate a discharge that is sustained by13.56-MHz radiofrequency (RF) power using efficient inductivewave coupling. High-density (4.5 × 10¹²/cm3 line average den-sity) large-volume (∼500 cm3) 760-torr argon plasma is ini-tiated and maintained for more than 400 ms with 2.2 kW ofnet RF power coupled to the plasma. Using the same technique,a 50-torr nitrogen plasma with line average electron density of3.5 × 1011/cm3 is obtained. The nitrogen plasma volume of1500 cm3 is initiated by the laser and maintained by a net RFpower of 3.5 kW for 350 ms. Measurements of the time-varyingplasma impedance and optimization of the RF matching for thetransition from laser-initiated to RF-sustained plasma are carriedout. Both laser-initiated plasmas provide much larger plasmavolumes at lower RF power densities than can be obtained by RFalone. Millimeter wave interferometry is used to determine theelectron density and the total electron–neutral collision frequency.A new diagnostic technique based on interferometry is developedto evaluate the electron temperature in high-pressure plasmaswith inclusion of the neutral heating. Broadband plasma emissionspectroscopy is used to illustrate the changes in the ionized speciescharacter immediately after the laser pulse and later during theRF pulse.
Index Terms—Excimer laser, high pressure, interferometry,plasma, radiofrequency (RF).
I. INTRODUCTION
H IGH-PRESSURE inductively coupled plasmas (ICPs)have been used for a variety of scientific and industrial
applications over a large gas pressure range from tens of torr upto and beyond atmospheric pressures. For this plasma source,a helical antenna coil is used to couple radiofrequency (RF)power to the plasma using a capacitive impedance matchingnetwork. The applications of these plasmas require high-density (∼1011−13 cm−3), uniform plasmas over large volumes(∼1000 − 5000 cm3) with a reduced RF power budget. At-mospheric pressure plasmas can be used in open space for a
Manuscript received December 8, 2005; revised July 7, 2006. This work wassupported by the Air Force Office of Scientific Research (AFOSR) under GrantF49620-03-1-0252.
The authors are with the Department of Electrical and ComputerEngineering, University of Wisconsin-Madison, WI 53706 USA (e-mail:[email protected]; [email protected]).
Color versions of Figs. 6, 7, and 14 are available at http://ieeexplore.ieee.org.Digital Object Identifier 10.1109/TPS.2006.885096
variety of applications including materials processing [1], bio-logical decontamination [2], microwave reflector and absorber[3], [4], reduction of supersonic drag, and modification of theradar cross section and signature of an aircraft [5]. An up-to-date summary of atmospheric plasmas is available in a recentbook entitled Non-Equilibrium Air Plasmas at AtmosphericPressure [6].
One of the major challenges associated with such high-pressure plasma sources is the high-RF-power budget requiredto initiate large volumes of these discharges at high density. Theminimum theoretical power density per unit volume required toinitiate an air plasma density of 1013 cm−3 at sea level (760 torr)has been calculated to be 9 kW/cm3 [7]. The primary reasonfor the increased power budget is that under high pressure andhigh neutral concentrations, the frequency of inelastic processes(especially the recombination process) between electrons andneutrals is much higher than for lower pressure plasma cases,greatly reducing the lifetime of energetic free electrons. Asa result, it becomes very difficult to use RF electric fieldsto accelerate electrons to sufficiently high kinetic energies toionize neutrals and initiate a large volume plasma dischargeunless a high field intensity is created.
The collisional (ν ωRF) skin depth for RF penetrationin an unmagnetized plasma is given by δ =
√2(c/ωp)
(ν/ωRF)1/2 m where ν is the total electron–neutral collisionfrequency, c is the speed of light in vacuum, ωRF is the RF fre-quency (13.56 MHz for our case), and ωp is the electron plasmafrequency. The skin depth is larger for higher total collisionfrequencies, lower densities, and lower RF frequencies. TheRF penetration depth, field strength, and ionization at a givenplasma density and total collision frequency will be larger forlower RF frequencies than for microwaves [8]–[10].
In a classic experiment, Eckert and Kelly [11] created an at-mospheric pressure plasma by initiating the RF-only dischargeat a low pressure (1 torr) in both argon and air and slowly raisingthe pressure over time. They studied the emission spectrum pro-duced by the high-pressure plasma and determined the plasmadensity and temperature. Following the work of Babat [12], theycreated a plasma using an inductive coil at a lower pressureand slowly increased the neutral pressure and RF power untilthey could open the plasma chamber to the atmosphere. Toprotect the quartz chamber from heat damage and to helpstabilize the discharge, the gas was injected in a vortex, es-sentially forming a thermal gas barrier between the hot plasma
0093-3813/$20.00 © 2006 IEEE

2638 IEEE TRANSACTIONS ON PLASMA SCIENCE, VOL. 34, NO. 6, DECEMBER 2006
and the chamber wall. The coupled power required to maintainthe discharge was 18–50 kW at 4 MHz, sufficient to createthe plasma at lower pressure and sustain it up to atmosphericpressure with a large volume. The time scale for creating thehigh-pressure plasma from the initial low-pressure dischargewas several minutes. They used the spectroscopic diagnostic ofthe N2 second positive (N2(2+)) line ratio to obtain an electrontemperature of Te = 0.62 eV and Tn = 6300 K for 760-torr air.By observing Stark broadening of the Hβ line in the air plasma,they found the electron density to be 5 × 1014 cm−3 in the airplasma created. More recently, experimental and computationalmodeling work has been done on a high power density andplasma density RF inductively coupled air and argon/nitrogenplasma torch by Laux [6, pp. 395–407], [13], [14]. They utilizea wide spectrum of techniques including spectroscopy (OHand N+
2 emissions, especially) and chemical kinetic models tostudy the RF plasmas generated in fast-injected (100 standardliters per minute (SLM) through the torch) air and nitrogen.In Laux’s work, plasmas with higher electron densities (ne
on the order of 1014/cm3) and smaller volumes are createdand sustained with higher RF power density (105 W/cm3).Gas temperatures of several thousand K are observed amongother results.
Currently, there is substantial interest in a rapid, almostinstantaneous initiation of large-volume (∼1000 cm3) high-density (1011 − 1013 cm−3) discharges at atmospheric pres-sures (50–760 torr, corresponding to altitudes of 60 000 ft downto sea level) with a minimal steady-state RF power budget.The power required in an experiment to ionize and initiate aninductively coupled RF plasma in atmospheric pressure air ata density of 1013 cm−3 will be much higher than the theoret-ical minimum power level (∼9 kW/cm3). For an atmosphericpressure plasma arc torch, a 300-kV potential was required toinitiate a discharge, whereas only 100 V is needed to maintainthe discharge with operating currents of 200–600 A [15], [16].Therefore, there is a need for an alternative scheme to reducethe power budget required to sustain the pulsed plasma at highgas pressures. We envisioned that if we could ionize a seed gaswith a low ionization energy such as tetrakis (dimethylamino)ethylene (TMAE) (ionization energy 6.1 eV) by ultraviolet(UV) laser or flashtube photon absorption [17]–[19], then wecould efficiently couple electrodeless RF power to the plasmaat high gas pressures and sustain the plasma at greatly reducedRF power levels [20].
We have thus focused on developing an electrodeless methodfor creating a large-volume (greater than 500 cm3) seed plasmausing UV photoionization to provide a good load for efficientRF coupling at low RF power levels via pulsed inductivelycoupled sources. Previous experiments [17]–[19] have shownthat a high initial density TMAE plasma (1012−13 cm−3) oflong axial extent (∼100 cm) can be created by a 193-nm laser in760 torr of nitrogen, air, oxygen, or argon background gas.We have been able to create a quasi-steady-state high-pressureplasma that projects well away from the antenna by thismeans that could not be obtained by RF alone. The techniqueof initiating a discharge by 193-nm-laser photoionization ofTMAE seeded in high-pressure background argon gas thatis sustained by inductive coupling of reduced RF power at
moderate pressures (< 120 torr) has been demonstrated byKelly et al. [18], [20]. While we have utilized a laser to performthe preionization, a more compact and lower power UV flashtube scheme could also be used to initiate the seeded plasma.
The objective of this paper is to utilize the UV-laser-initiatedaxially extended high-density seed plasma to help overcome theinitial high-RF-power requirement to breakdown high-pressuregas and create an RF-sustained high-pressure argon or nitrogenplasma through improved inductive RF power coupling andincreased RF wave penetration. Another characteristic of theplasma created with the help of laser initiation is its possible de-viation from thermal equilibrium. We anticipated that the laserformed seed plasma could allow for further RF penetration,higher plasma density and larger plasma volumes comparedwith RF-only initiated plasmas.
A 105-GHz millimeter wave interferometer is employedto determine the line-average plasma density, totalelectron–neutral collision frequency, and electron temperatureusing a new analysis method. Optical emission spectroscopyis used to characterize the temporal evolution of the plasma.A technique to measure the time-dependent, plasma-loadedantenna impedance Zp(t), during an RF plasma pulse usinga dual RF directional coupler, which can be used for precisecapacitive matching to the plasma load, is also presented.
This paper is organized as follows: a brief theoretical analy-sis of the laser-initiated RF-sustained plasma is presented inSection II, followed by a description of the experimental config-uration and theory for the plasma diagnostics in Section III; theexperimental results are discussed in Section IV, and Section Vprovides a summary with discussions.
II. THEORETICAL ANALYSIS OF THE
UNMAGNETIZED PLASMA
A. Electron and Neutral Thermal Energy
In this section, we present a theoretical analysis of thelaser-initiated and RF-sustained plasma based on an energyconservation principle. By creating an excimer laser preion-ized seed plasma, a quasi-steady-state RF plasma is createdand sustained. Due to the RF plasma impedance mismatch, afraction of the incident RF power (Pinc) is delivered to thehelical antenna as Pnet while the rest is reflected back to the RFgenerator (Pref). Only part of the power coupled to the antenna,Pe = er Pnet is coupled to the plasma electrons throughazimuthal field coupling
Pe =∫∫
V
∫12jθEθ dV = erPnet (1)
where the 1/2jθEθ term is the RF power density coupled tothe plasma from the inductive coil, with jθ being the azimuthalplasma current and Eθ the azimuthal electric field. V is thevolume of plasma, and er is the antenna radiation efficiency.Not all the RF power delivered to the helical antenna is coupledinto plasma, as some is dissipated by contact resistance in thematching system and antenna, the Ohmic heating of the antenna

LUO et al.: EXPERIMENTAL STUDY OF LASER-INITIATED HIGH-PRESSURE PLASMAS 2639
(skin effect) (denoted by eOhm), and radiation loss into theoutside RF field (denoted by eRad) [21]
er =Pe
Pnet= eOhmeRad. (2)
We use a circuit measurement and analysis technique to cal-culate eOhm and eRad. We first measure the matchbox seriesresistance and vacuum antenna resistance using an HP E5061AENA-L RF network analyzer, and then measure the plasmaimpedance of argon and nitrogen plasma using the dual RFdirectional coupler. eOhm and eRad are then calculated usingKirchoff’s law. This method is used in Part IV for coupled RFpower and electron temperature analysis.
The RF power coupled to the plasma is coupled to numerouspower consumption and loss mechanisms that are representedby different terms in (3), the complete differential form of theenergy conservation equation for electrons [8], [22]–[24]
∂
∂t
(32neTe
)+ ∇ · 3
2neTeue
= −∇ · (Ke∇Te + heJe) − pe∇ · ue +Je
ne· ∇pe
− Qelastic,e−n +∑
r
Rer∆Hor +
12jθEθ (3)
where ne is the electron density, Te is electron temperature,ue is the convection velocity, Ke is the thermal conductivityof electrons, he is the specific enthalpy of electrons, Je isthe diffusion flux of electrons, and pe is the electron pres-sure. Equation (3) illustrates the radiation, heat conduction andconvection, dissociation, and ionization processes that com-pete with neutral heating via electron–neutral collisions. Thefirst term on the left-hand side is the temporal variation ofelectron thermal energy, which can be neglected in our quasi-steady-state plasma; the second term is the convective energytransport term. The first term on the right-hand side is thesum of thermal conduction and diffusion, the two terms thatfollow are volume work, and the Qelastic,e−n term representsthe energy transfer rate between electrons and neutrals. Basedon an elastic collision model for energy transfer from electronsto neutrals [8, p. 55], [23, p. 145], [25], Qelastic,e−n can be ap-proximated as Qelastic,e−n = Eeavνe · 2(me/Mn)ne = Teνe ·3(me/Mn)ne in which Eeav is the average electron energy(Eeav = 3/2kBTe for electrons in a three-dimensional (3-D)Maxwellian distribution), me is the electron mass, Mn is theneutral mass, and νe is the frequency of elastic electron–neutralcollisions. Te is the line average electron temperature and2(me/Mn) is the fraction of electron kinetic energy transferredto neutrals during each elastic collision. The
∑r Rer∆Ho
r termstands for the sum of reactive energy released or absorbed byvarious reactions. Some of the energy loss via reactions canleave the plasma system as radiation via photon emission. The1/2jθEθ term is the energy source term from incoming RFpower. The gas flow through the chamber also removes RFpower and cools the neutrals, which we neglect because the gasflow rate is small compared with the electron heating rate andtotal gas volume in the chamber. We can simplify the energy
relation for electrons by introducing an efficiency coefficient ηe
defined as the fraction of RF power that is consumed by elasticcollisions with the neutrals:
Qelastic,e−n = ηe ·12jθEθ (4)
and (1 − ηe) of the RF power coupled to the electrons is con-sumed by the other competing power consumption mechanismslisted above. We designate ηe as the elastic collision factor.
As electrons gain their thermal energy through the interac-tion with the RF electric field and transfer a fraction of theirenergy to neutrals through elastic collisions, the neutral gas willgain some of the thermal energy through the elastic collisionprocess. Hence, the Qelastic,e−n term is the energy source forthe thermal energy gain of the neutrals. The differential form ofenergy equation for neutrals is [22], [24]
∂
∂t
(32nnTn
)+ ∇ · 3
2nnTnun
= −∇ · (Kn∇Tn + hnJn) − pn∇ · un
+Jn
nn· ∇pn + Qelastic,e−n +
∑r
Rnr∆Hor . (5)
All the terms are similar to those in the electron energy (1), withtwo exceptions: 1) the sign of the Qelastic,e−n term is positivebecause neutrals gain thermal energy from the electrons viaelastic collisions and 2) the absence of 1/2jθEθ term. Not allof the thermal energy available from electrons is transferredto heating neutrals through collisions (Qelastic,e−n); part of itis consumed by radiation, diffusion, convection, conduction,cooler gas flow in and warm neutral pumping out of the system,and neutral emission energy losses. We further simplify (5) byintroducing another efficiency factor: The neutral heating factorηn which stands for the ratio of elastically transferred energythat does contribute to heating of neutrals [22], [24]
∂
∂t
(32nnTn
)+ pn∇ · un − Jn
nn· ∇pn = ηnQelastic,e−n. (6)
If we use the constant-pressure specific heat Cp to incorporatevolume work by neutrals, (6) can be rewritten in this form
Cpnn∂Tn
∂t= erη
12jθEθ. (7)
The total neutral heating efficiency factor η = ηnηe is definedas the ratio of RF power density that ultimately contributes tothermal temperature rise of neutrals. In effect, the electrons inhigh-pressure plasmas act as intermediaries that transfer someof the RF power to the neutrals and heat them to elevatedtemperatures [11]. We note that the process of gas heatingarising from the electrons in the experiment competes withmany other power loss processes including plasma ionization,dissociation, excitation, recombination, radiation, cooler gasflow in and pumping out of the system, and heat transfer tothe Pyrex walls and regions of gas surrounding the plasmaby means of convection, conduction, diffusion, and radiation.The reaction mechanisms are given in [25] and [26] for argon

2640 IEEE TRANSACTIONS ON PLASMA SCIENCE, VOL. 34, NO. 6, DECEMBER 2006
and nitrogen plasmas. As a result that follows other referencedcomputational modeling neutral heating papers [22], [24], [25],we define the total neutral heating efficiency factor η as the ratioof RF power density that contributes to the temperature rise ofneutrals. The choice of the η factor is of special importance: ηis dependent on the gas and the reaction mechanisms involved.Experimental and detailed computational modeling researchwork has been done on neutral heating effect in ICP sources in[22], [24], and [25] at pressures up to 0.5 torr. For different gasspecies, pressure levels, electron energy levels and RF powerdensity levels involved, different η factors for different gasesranging from 5% to 30% have been employed as referenced byHash et al. [22] and result in electron temperatures well abovethe gas temperature. Because our experiments are conductedin the 50–760-torr pressure range with laser-initiation andRF-sustainment technique, no η factor has been evaluated forthis pressure and plasma density range. In the absence of a com-plex, detailed computational model that includes the reactionslisted in [25] and [26], and all the thermal dynamics processesthat competes with neutral heating, or a spectroscopic studyof this neutral temperature change for our special case of alaser-initiated RF-sustained lower power and electron densityplasma, we take η = 40% for the 760-torr argon plasma, andη = 20% for the nitrogen plasma. η is assumed to be higher(40%) for 760-torr argon plasma because at this pressure, theelectron–neutral collision process provides a higher neutralheating efficiency, and being an noble gas, argon has less addi-tional power-consuming reactions compared to the nitrogen gasspecies. η is chosen at a level of 20% for the nitrogen plasmadue to the lower pressure of operation (50 torr), lower plasmadensity and additional competing power balance reactions in-volved in producing the plasma [26].
The ideal gas law is also valid for the neutrals
pn = nnkBTn (8)
where pn is the neutral pressure measurable using our piezo-electric pressure gauge, kB is Boltzmann’s constant, and nn
is the neutral density. Equations (7) and (8) can be used toevaluate the neutral temperature and density changes as a resultof neutral heating. With these conditions and assumptions, wethen evaluate the neutral heating that can occur and include itin the evaluation of the line-average electron temperatures. Theresults are presented in Section IV.
B. Electron–Neutral Collisions
The total electron–neutral collision frequency is given by[8, p. 47], [27, p. 157]:
ν = σnnv (9)
in which σ is the total electron collision cross section betweenelectrons and neutrals and v is the average velocity of theelectrons. Note that the total cross section σ is a function of theaverage electron energy (again, Eeav = 3/2 kBTe for electronsin a 3-D Maxwellian distribution): the curves illustrating thisdependence for various gases are summarized by Shkarofsky in[28] and more recently by Zecca in [29]. v is related to electron
temperature Te by (10) if we assume a 3-D near-Maxwellianvelocity distribution for the electrons [8, p. 39], [27, p. 228]:
v =(
8kBTe
πme
)1/2
(10)
Eliminating v, we can combine (9) and (10) to write
kBTe =πme
8
(ν
σnn
)2
. (11)
This equation can be used to evaluate the line average Te
with nn obtained using (7) and (8), and ν obtained using ourinterferometer diagnostic.
III. EXPERIMENT
A. Overview of Excimer Laser, Plasma Chamber, andRF Power Coupling
The experimental set up is shown schematically in Fig. 1.The plasma chamber is a 5-cm-inner-diameter Pyrex tube oflength 140 cm. Mass flow controllers along with a gas injectionsystem are located at the laser window end as shown in Fig. 1.The chamber is evacuated to a base pressure of 50 mtorr priorto each experiment. After evacuation, a stable chamber pressureis achieved by fine tuning and balancing the gas input valve andthrottle valve of the mechanical pump to control gas input rateand pumping rate. A thermal gas flow meter (McMillan Model50S) located at the gas injection pipeline is used to measurethe incoming gas flow rate. A piezomicroelectromechanical-systems-based pressure gauge (MKS HPS Series 902 AbsolutePiezo Transducer) is used to monitor the chamber pressureaccurately from 100 mtorr to 1000 torr. Typical gas flow ratesrange from 0.5 to 5.0 SLM. After a steady chamber pressureand flow rate is established, TMAE is injected into the chamber.Prior to injection, the TMAE cylinder is pressurized with thebackground gas at 5 torr above the gas pressure in the mainchamber. For fast injection of TMAE, an electromechanicalvalve is opened for 1 s, so that an optimum TMAE gas partialpressure of 15 mtorr [17] is achieved in the chamber and thelaser-RF sequence is initiated several seconds later.
A 25-kW 13.56-MHz radio-frequency generator (CXH25K,Comdel, Inc.) is used to deliver power to the antenna using anefficient capacitive impedance matching network. This genera-tor is a tube-powered unit capable of putting out 5-kW incidentRF power even with the output end shorted. The short (20 ns)laser pulse is triggered late during the initial rise of the RFwhen the forward RF power is 90% of the maximum power, inorder to provide the seed plasma for efficient RF coupling andsustainment at low RF power levels. A dual directional coupler(Connecticut Microwave) with 50-dB incident and 40-dB re-flected coupling is used to measure the incident and reflectedvoltage (Vinc and Vref ) to determine the plasma load impedanceZp(t) defined at the feed points to the six-turn helical antenna.The RF power is coupled through a helical antenna that excitesRF fields in the laser-formed plasma. The water-cooled helicalantenna is made of six turns of quarter-inch copper tube ofaxial coil length 10 cm and internal diameter 6 cm, wound

LUO et al.: EXPERIMENTAL STUDY OF LASER-INITIATED HIGH-PRESSURE PLASMAS 2641
Fig. 1. Experimental configuration of the laser and RF plasma source.
tightly over the 5-cm-inner-diameter chamber. The end of thehelical antenna closest to the laser window is grounded to thecapacitive match box. The high-voltage lead of the helix istoward the pump side of the chamber. Radio frequency power iscoupled to the capacitive impedance matching network using a1–5/8”, 50-Ω semirigid coaxial transmission line (Myat, Inc.).
The capacitive matching network consists of two high-working-voltage vacuum variable capacitors (Jennings GCS100-7.5S, 5-100 pF, 7.5 kV, and Jennings CVFP-1000-40S,35–1000 pF, 40 kV). The capacitances and series and contactresistances of the two variable capacitors are determined bynetwork analyzer. A lookup table with these values can beused to either determine the capacitance or tune to a desiredcapacitance based on the number of turns. The two-capacitormatching circuit and wide (4 in) interconnect copper stripswhich are chosen to reduce inductance and skin effect lossesare enclosed in an aluminum box to provide RF shielding. Therange of plasma radiation resistance at the antenna terminals(0.5–5 Ω, confirmed by measurement of the plasma radiationimpedance in our experiment) mandates special care to reduceohmic losses in the impedance matching network and connec-tions. To reduce RF losses arising from connection points andsolder joints, the six-turn helical antenna has been made out ofa continuous length of copper tube with a measured equivalentvacuum series resistance of 0.5 Ω due to skin effect, contactresistance and radiation resistance into vacuum.
A uniform intensity UV beam of 193-nm wavelengthis produced using an excimer laser (Lumonics PulsemasterPM-842) that runs in the ArF (6.4 eV per photon) mode. Thehalf-width of the laser pulse is 20 ±2 ns, with a 2 ns rise/falltime, a maximum available laser output energy of 300 mJ, and atypical working output of 100 mJ. The uniform laser flux output
cross section is 2.8 × 1.2 cm. The laser beam enters the plasmachamber through a 2.8-cm diameter Suprasil quartz window(98% transparency at 193-nm wavelength) at the upstream end.Laser energy passing through the UV window is measuredusing an energy meter (Scientech AC 50 UV Calorimeter andAstral AD30 Laser Energy Meter). In order to account for thelaser attenuation by the UV window, the window is placed infront of the energy meter for this measurement.
A very accurate computer-controlled timing circuit se-quences RF turn-ON and turn-OFF, laser firing, and data ac-quisition. This exact timing sequence is very critical sincethe RF pulse must be enabled during the laser-formed TMAEplasma lifetime (τ ∼ 3 µs) where the seed plasma density issufficiently large (ne > 1012/cm3) [17] to provide a sufficientplasma radiation resistance load (Rp > 1 Ω) for efficient RFcoupling through the helical antenna. Due to the long rise timeof the tube powered RF generator, we trigger the laser pulsewhen the RF power is ramped to approximately 90% of fullpower, so that the laser-initiated plasma can be sustained byhigh RF power.
B. Millimeter Wave Interferometry at High Gas Pressures
A 105-GHz quadrature millimeter wave interferometer isused to measure the electron plasma frequency (ωp), plasmadensity (ne), total electron–neutral collision frequency (ν), andelectron temperature (Te) at high neutral gas pressures. Theinterferometer works in the Mach–Zehnder configuration, inwhich the plasma is in one arm of the two-beam interferom-eter. The interferometer works by using an I-Q (In-phase andQuadrature-phase) mixer to determine the phase and amplitudechange of the 105-GHz wave signal going through the plasma

2642 IEEE TRANSACTIONS ON PLASMA SCIENCE, VOL. 34, NO. 6, DECEMBER 2006
with reference to the wave that does not go through the plasma([17], [18], and [30]). An oscilloscope is used to acquire thesignals from the interferometer, which are then transferred to acomputer for analysis. As much of the interferometer assemblyas possible is enclosed in a conducting shielding box, only thewaveguide horns and phase shifter are exposed. In addition,cables with very high shielding (90 dB, Times MicrowaveSystems) have been used to reduce the noise level from the laserand RF sources in the interferometer signal. An axial densityscan is obtained by varying the position of the interferometeralong the z-axis.
The objective of the plasma interferometry experiment is toaccurately diagnose the high-pressure plasma over the entirepulse. A new approach has been developed and employed toevaluate the plasma characteristics ν, ωp, ne, and Te, basedon the millimeter wave interferometry. Given a plasma witha total electron–neutral collision frequency (ν) and plasmafrequency (ωp), if we launch a plane wave through the plasma,which is assumed to be infinite in dimensions transverse tothe direction of microwave propagation and has thickness dalong the direction of propagation, the phase constant βp andattenuation constant αp of the wave are [30]
βp =ω
c
12
(1 −
ω2p
ω2 + ν2
)
+12
(1 −
ω2p
ω2 + ν2
)2
+
(ω2
p
ω2 + ν2
ν
ω
)2
1/2
1/2
(12)
αp =ω
c
− 1
2
(1 −
ω2p
ω2 + ν2
)
+12
(1 −
ω2p
ω2 + ν2
)2
+
(ω2
p
ω2 + ν2
ν
ω
)2
1/2
1/2
(13)
in which ω is the frequency of the millimeter wave inter-ferometer signal. Both ν and ωp are plasma characteristicswhich are functions of spatial location within the plasma atany given time. They can therefore be written as ν(z, r, θ, t)and ωp(z, r, θ, t), where we use cylindrical coordinates dueto chamber geometry. Both ν and ωp are local characteristicsof the plasma. There exist radial as well as axial profiles forplasma density and total electron–neutral collision frequency.Note that since βp and αp are determined by ν and ωp, theyare local values and therefore also have a spatial variation.However, the interferometry method measures the phase shiftand attenuation as integration over the entire wave path
∆ϕ =
d∫0
(β0 − βp) dx (14)
A =A0e
d∫0
(α0−αp)dx
(15)
because the 105-GHz microwave beam penetrates throughthe entire plasma column and experiences a total phase shiftand attenuation. Here, α0 is the attenuation constant of air(α0 ≈ 0), β0 is the phase constant of free space, d is thediameter of plasma chamber, and x is the integration variable.∆ϕ is the phase shift, A0 is the initial amplitude, and A is theamplitude of the microwave after the attenuation effect by theplasma.
Since it is impractical to measure the radial profile of νand ne in an atmospheric-pressure plasma, we assume a one-dimensional (1-D) plasma slab model with a radial profileassumed uniform due to the high recombination rates. As aresult, the integrations in (16) and (17) can be simplified intomultiplication
∆ϕ =(β0 − βp)d (16)
A =A0e−αpd. (17)
This 1-D uniform plasma slab model is conservative inpredicting the peak density and collision rate because it ignoresthe effect that the chamber wall will have on the plasma andassumes a uniform radial profile of ν and ωp within the plasma.
Notice that (14) and (15) are explicit expressions of βp
and αp in terms of ν and ωp. In order to make use of theexperimentally measured values for αp and βp, it is necessaryto invert these equations to produce explicit expressions for νand ωp. First, let us define two intermediate variables X and Ygiven by
X =12
(1 −
ω2p
ω2 + ν2
)(18)
Y =12
(
1 −ω2
p
ω2 + ν2
)2
+
(ω2
p
ω2 + ν2
ν
ω
)2
1/2
=12
(2X)2 +
(ω2
p
ω2 + ν2
ν
ω
)2
1/2
. (19)
By substituting X and Y into (12) and (13), βp and αp canbe simplified as
βp =ω
cX + Y 1/2 (20)
αp =ω
c−X + Y 1/2. (21)
We can solve (20) and (21) for X and Y in terms of βp and αp
X =c2
2ω2
(β2
p − α2p
)(22)
Y =c2
2ω2
(β2
p + α2p
). (23)

LUO et al.: EXPERIMENTAL STUDY OF LASER-INITIATED HIGH-PRESSURE PLASMAS 2643
By inverting (18) and (19), we can calculate ν as
ν = 2ω(Y 2 −X2)1/2
(1 − 2X)(24)
and ωp as
ωp =[(1 − 2X)
(ω2 + ν2
)]1/2. (25)
Therefore, ultimately, we can write ν and ωp in terms ofthe experimentally measured values βp and αp by plugging theexpression of X and Y in (22) and (23) into (24) and (25)
ν = 2(c2
ω
)[αpβp
1 − c2
ω2
(β2
p − α2p
)]
(26)
ωp =
[1− c2
ω2
(β2
p − α2p
)]
×
ω2 + 4
(c4
ω2
)(αpβp
1 − c2
ω2
(β2
p − α2p
))2
1/2
.
(27)
The plasma frequency is related to electron density(cm−3) by
ωp = 2π × 8.98 × 103√ne (28)
so we can calculate ne from ωp. Equations (26) and (27)are inversions of (12) and (13). They are explicit and exactexpressions of ωp and ν with all the right-hand side termsknown or measurable from interferometer.
In our plasma interferometry experiment, we first measurephase shift ∆ϕ and relative attenuation A/A0 using interferom-eter, then use (16) and (17) to calculate the βp and αp values,then calculate the plasma characteristics ν, ωp, and ne from thecalculated βp and αp values using (26)–(28).
The quantities ν, ωp, and ne were derived in an earlier work[30] using approximations of (12) and (13) for highly andweakly collisional cases. Since neither of these approximationsis valid in the present experiment, it is necessary to use the exactexpressions we have derived above. No approximation is usedto derive (26) and (27) so they are exact solutions of ν and ωp
which can be used to calculate ν and ne from a wide range ofexperiments in which interferometry is available. Axial profilesof the plasma characteristics can also be obtained using thismethod.
The interferometer technique and method of analysis waspreviously compared with a Langmuir probe to obtain line-average density measurements in a lower pressure heliconplasma source over a wide range of densities and magneticfields. The two measurements were found to be in agreementwithin 8% over a density range from 4 × 10¹²/cm3 to 1.5 ×10¹³/cm3 [31].
In addition to the evaluation of line average ωp, ne, and ν,we have developed a method for determining the line-averageelectron temperature (Te) using plasma interferometry basedon (11) utilizing the measured total electron–neutral collisionfrequency. The total electron cross section σ depends on theelectron thermal energy: The total electron–neutral collisioncross section curves generalized by Zecca et al. [29] are usedto solve this equation for Te. We used fifth-order polynomialfunctions to fit these experimental cross section data curvesover a range from 0.1 to 2.5 eV and obtain σ as a function ofEeav for use in (11). From (7), Tn is found for the laser-RFplasmas we produce and nn is obtained using (8). An iterativeroot-finding routine is needed to solve (11) for Te using thismethod.
C. Plasma Impedance Diagnostic and Optimizationof RF Matching
One important advance that allows us to create fast, pulsed,high-pressure plasmas with lower RF power levels is a real-timeplasma impedance measurement technique that we have devel-oped that allows efficient matching of the 50-Ω RF networkto the time varying plasma load. We define the plasma-loadedhelical antenna radiation impedance Zp(t) = Rp(t) + jXp(t)(also referred to as the plasma impedance) as the impedancemeasured at the input to the antenna feeds from the capacitivematchbox. This impedance is a function not only of the char-acter of the matchbox and helix itself, but also of the plasmainitiated by the laser and sustained by the RF pulse. We writeZp(t) as a function of time, meaning the RF plasma load isa function of time during the entire laser initiation and RFsustainment sequence. Before the 20-ns laser pulse ionizes theTMAE seed plasma, the chamber is filled with neutral gasthat behaves essentially like a vacuum (µ0, ε0). The antennaimpedance without the plasma is given by Za = Ra + jXa.Immediately after the laser pulse and the 100 ns delayed ion-ization process [17], the plasma is formed in the chamber andsustained by the RF power. During this time the laser pulse canlead to high-pressure plasma fluctuations that are observed vi-sually. The dielectric properties of the plasma are substantiallydifferent from the vacuum antenna load. The permittivity of theplasma depends on ne and ν of the plasma, both of which varysubstantially during the RF sustainment period due to transientbehavior of the high-pressure plasma. As a result, the RF loadZp(t) will exhibit a very fast transition when the plasma isinitiated by the laser and varies in time due to the high-pressureplasma fluctuations and plasma recombination processes. It isof considerable interest to obtain Zp(t) because the knowledgeof plasma impedance provides the information that allows usto tune the capacitors for optimal RF matching during the RFpulse. This is crucial to achieve a high-RF-power couplingefficiency rapidly in a pulsed plasma and to protect the high-power RF generator from reflected power. Optimal matchingcan reduce the RF power levels, weight, and cost requirementsfor making pulsed high-pressure plasmas by measuring the RFload impedance in real-time to enable good matching of thefinal-stage steady-state plasma load to the 50-Ω RF impedancenetwork.
2644 IEEE TRANSACTIONS ON PLASMA SCIENCE, VOL. 34, NO. 6, DECEMBER 2006
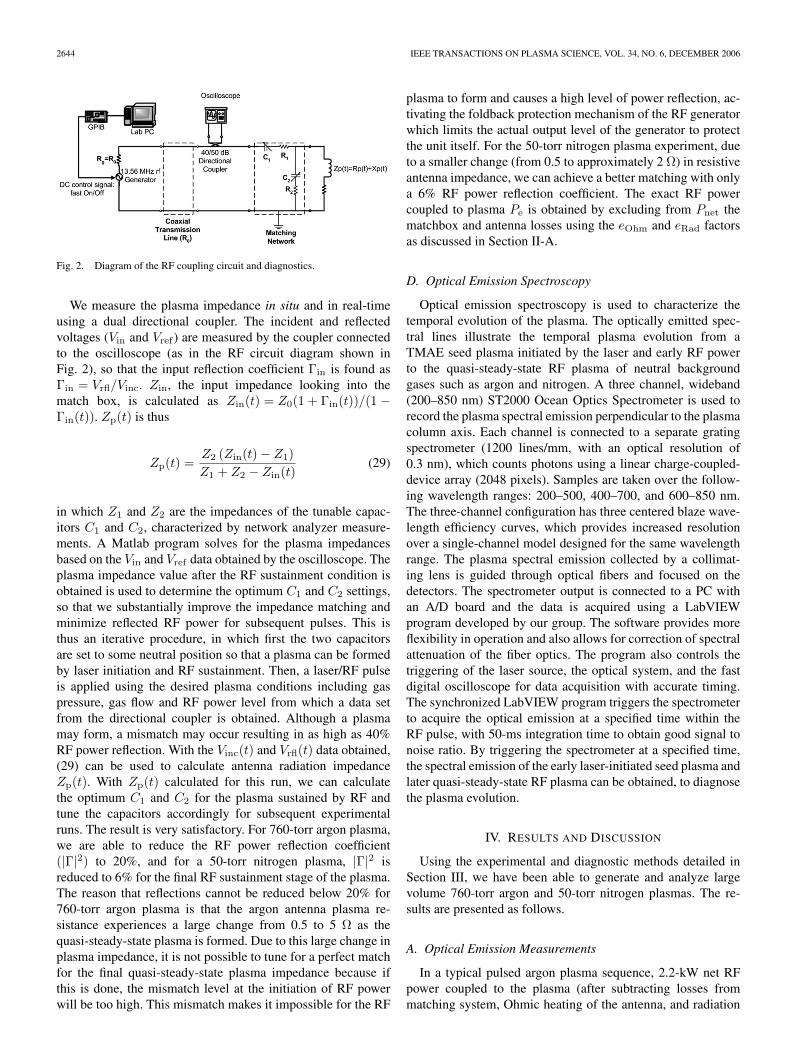
Fig. 2. Diagram of the RF coupling circuit and diagnostics.
We measure the plasma impedance in situ and in real-timeusing a dual directional coupler. The incident and reflectedvoltages (Vin and Vref ) are measured by the coupler connectedto the oscilloscope (as in the RF circuit diagram shown inFig. 2), so that the input reflection coefficient Γin is found asΓin = Vrfl/Vinc. Zin, the input impedance looking into thematch box, is calculated as Zin(t) = Z0(1 + Γin(t))/(1 −Γin(t)). Zp(t) is thus
Zp(t) =Z2 (Zin(t) − Z1)Z1 + Z2 − Zin(t)
(29)
in which Z1 and Z2 are the impedances of the tunable capac-itors C1 and C2, characterized by network analyzer measure-ments. A Matlab program solves for the plasma impedancesbased on the Vin and Vref data obtained by the oscilloscope. Theplasma impedance value after the RF sustainment condition isobtained is used to determine the optimum C1 and C2 settings,so that we substantially improve the impedance matching andminimize reflected RF power for subsequent pulses. This isthus an iterative procedure, in which first the two capacitorsare set to some neutral position so that a plasma can be formedby laser initiation and RF sustainment. Then, a laser/RF pulseis applied using the desired plasma conditions including gaspressure, gas flow and RF power level from which a data setfrom the directional coupler is obtained. Although a plasmamay form, a mismatch may occur resulting in as high as 40%RF power reflection. With the Vinc(t) and Vrfl(t) data obtained,(29) can be used to calculate antenna radiation impedanceZp(t). With Zp(t) calculated for this run, we can calculatethe optimum C1 and C2 for the plasma sustained by RF andtune the capacitors accordingly for subsequent experimentalruns. The result is very satisfactory. For 760-torr argon plasma,we are able to reduce the RF power reflection coefficient(|Γ|2) to 20%, and for a 50-torr nitrogen plasma, |Γ|2 isreduced to 6% for the final RF sustainment stage of the plasma.The reason that reflections cannot be reduced below 20% for760-torr argon plasma is that the argon antenna plasma re-sistance experiences a large change from 0.5 to 5 Ω as thequasi-steady-state plasma is formed. Due to this large change inplasma impedance, it is not possible to tune for a perfect matchfor the final quasi-steady-state plasma impedance because ifthis is done, the mismatch level at the initiation of RF powerwill be too high. This mismatch makes it impossible for the RF
plasma to form and causes a high level of power reflection, ac-tivating the foldback protection mechanism of the RF generatorwhich limits the actual output level of the generator to protectthe unit itself. For the 50-torr nitrogen plasma experiment, dueto a smaller change (from 0.5 to approximately 2 Ω) in resistiveantenna impedance, we can achieve a better matching with onlya 6% RF power reflection coefficient. The exact RF powercoupled to plasma Pe is obtained by excluding from Pnet thematchbox and antenna losses using the eOhm and eRad factorsas discussed in Section II-A.
D. Optical Emission Spectroscopy
Optical emission spectroscopy is used to characterize thetemporal evolution of the plasma. The optically emitted spec-tral lines illustrate the temporal plasma evolution from aTMAE seed plasma initiated by the laser and early RF powerto the quasi-steady-state RF plasma of neutral backgroundgases such as argon and nitrogen. A three channel, wideband(200–850 nm) ST2000 Ocean Optics Spectrometer is used torecord the plasma spectral emission perpendicular to the plasmacolumn axis. Each channel is connected to a separate gratingspectrometer (1200 lines/mm, with an optical resolution of0.3 nm), which counts photons using a linear charge-coupled-device array (2048 pixels). Samples are taken over the follow-ing wavelength ranges: 200–500, 400–700, and 600–850 nm.The three-channel configuration has three centered blaze wave-length efficiency curves, which provides increased resolutionover a single-channel model designed for the same wavelengthrange. The plasma spectral emission collected by a collimat-ing lens is guided through optical fibers and focused on thedetectors. The spectrometer output is connected to a PC withan A/D board and the data is acquired using a LabVIEWprogram developed by our group. The software provides moreflexibility in operation and also allows for correction of spectralattenuation of the fiber optics. The program also controls thetriggering of the laser source, the optical system, and the fastdigital oscilloscope for data acquisition with accurate timing.The synchronized LabVIEW program triggers the spectrometerto acquire the optical emission at a specified time within theRF pulse, with 50-ms integration time to obtain good signal tonoise ratio. By triggering the spectrometer at a specified time,the spectral emission of the early laser-initiated seed plasma andlater quasi-steady-state RF plasma can be obtained, to diagnosethe plasma evolution.
IV. RESULTS AND DISCUSSION
Using the experimental and diagnostic methods detailed inSection III, we have been able to generate and analyze largevolume 760-torr argon and 50-torr nitrogen plasmas. The re-sults are presented as follows.
A. Optical Emission Measurements
In a typical pulsed argon plasma sequence, 2.2-kW net RFpower coupled to the plasma (after subtracting losses frommatching system, Ohmic heating of the antenna, and radiation

LUO et al.: EXPERIMENTAL STUDY OF LASER-INITIATED HIGH-PRESSURE PLASMAS 2645
Fig. 3. Temporal evolution of early TMAE seed plasma and later quasi-steady-state RF argon plasma emission spectrum: (a) t = 50 ms; (b) t =200 ms; (c) t = 400 ms.
loss to the outside RF field) is used in conjunction with the100-mJ laser pulse and 15-mtorr TMAE seed gas to initiateand sustain the plasma. The gas pressure of argon is 760 torr,which is maintained by 4.5-SLM flow rate. The valve ofthe mechanical pump is carefully set to balance the inputgas and provide a steady chamber pressure of 760 torr. Thespectrometer is triggered to capture the broad (200–800 nm)spectrum at three different times during the 1-s RF pulse withan integration time of 50 ms. The 20-ns laser pulse is fired att = 50 ms. The captured spectrums are shown in Fig. 3(a)–(c)which illustrate the transition from the TMAE seed plasmato the argon quasi-steady-state plasma. Fig. 3(a) shows thebroad emission spectrum of the TMAE seed gas molecule att = 50 ms. The seed plasma dominates the entire spectrumearly in the pulse. Fig. 3(b) shows that at t = 200 ms the argonlines begin to dominate the spectrum. At t = 400 ms as shownin Fig. 3(c), the quasi-steady-state argon plasma is reachedwith negligible seed gas presence. Thus, the laser ionization ofthe TMAE seed gas and transition to argon plasma is readilyaccomplished with our system.
Fig. 4. Temporal evolution of early TMAE seed plasma and later quasi-steady-state RF nitrogen plasma emission spectrum: (a) t = 50 ms; (b) t =100 ms. (c) t = 300 ms.
In a typical pulsed nitrogen plasma sequence, 3.5-kW net RFpower is coupled to the plasma in conjunction with the 100-mJlaser pulse and 15-mtorr TMAE seed gas to initiate and sus-tain the nitrogen plasma at 50-torr pressure, corresponding toatmospheric pressure at 60 000 feet altitude. The net RF powercoupled into the plasma is found to be 3.5 kW after subtractinglosses from the matching system, Ohmic heating of the antenna(skin effect), and radiation loss to the outside RF field. Thenitrogen gas pressure is 50 torr, maintained by a 1.5-SLM flowrate. The evolution of the optical emission spectrum in a 50-torrnitrogen plasma is very similar, and is shown in Fig. 4(a)–(c),which show the plasma emission at t = 50, 100, and 300 mswith laser pulse set at t = 50 ms.
B. Argon Plasma
The argon plasma condition has been described inSection IV-A. RF power and plasma impedance experiment

2646 IEEE TRANSACTIONS ON PLASMA SCIENCE, VOL. 34, NO. 6, DECEMBER 2006
Fig. 5. (a) Incident and reflected RF power over a typical pulsed laser andRF generated argon plasma sequence. (b) Temporal variation of RF powerreflection coefficient over the pulsed argon plasma sequence. (c) Temporalvariation of Rp and Xp of this pulsed argon plasma sequence. The plasmacondition is described in Section IV-A.
results are presented. Temporal as well as axial variation ofplasma characteristics are diagnosed and presented in thissection.1) RF Power and Plasma Impedance Measurements: The
dual directional coupler shown in Fig. 2 is used to measure Pinc
and Pref with results presented in Fig. 5(a). The net RF powercoupled to the matchbox and antenna, Pnet = Pinc − Pref . TheRF power reflection coefficient is |Γ|2 = Pref/Pinc as presentedin Fig. 5(b). Pnet is 2.5 kW during the final quasi-steady-stateplasma stage and |Γ|2 ≈ 20%. In order to obtain the RF powerefficiency of the matchbox and helical antenna, we used themethod discussed in Section II-A and obtain eOhm = 96% andeRad = 90%. Therefore, ultimately a power of Pe = 2.2 kW iscoupled to the steady-state argon plasma electrons.
One important aspect of RF sustainment of the laser-initiatedplasma is to ensure that the RF matching is very good overthe majority of the pulse, so that high-RF-power coupling ef-ficiency can be achieved and the RF generator can be protectedfrom high levels of reflected power. In order to achieve goodmatching, the temporal RF impedance variation is calculatedusing (29) based on directional coupler measurement of Vinc(t)and Vref(t) over the RF plasma pulse. The plasma impedanceZp(t) = Rp(t) + jXp(t) is presented in Fig. 5(c). It is ob-served that Rp, the resistive load, exhibits a transition from0.50 to 5.0 Ω when the quasi-steady-state plasma is formed att = 183 ms, while the inductive load Xp(t) shows a fractionalincrease of 2.0 Ω. This changing load means we have to deal
Fig. 6. Intermediate formation stage of the argon plasma.
Fig. 7. Quasi-steady-state stage of argon plasma.
with two very different plasma load impedance levels duringthe pulse. We typically set the matching network to match theimpedance of the quasi-steady-state plasma (5.0 + j120 Ω) tothe 50-Ω generator, and allow a higher reflection level at thebeginning of the pulse when the quasi-steady-state plasma isnot formed. The RF generator can accept reflected power for acertain duration because of its high foldback reflected powertolerance of 5.0 kW. With this impedance measurement andmatching technique, we obtain a 20% RF power reflectionduring the quasi-steady-state plasma despite the significantvariation in plasma impedance during the plasma formation(from 0.50 + j118 to 5.0 + j120 Ω).
2) Time-Resolved Electron Density and Total Electron–Neutral Collision Frequency: It is observed that the laser-initiated RF-sustained TMAE-seeded argon 760-torr plasmagoes through two distinct stages. The RF power is initiated att = −210 ms and the laser pulse is triggered when the incidentRF power output reaches approximately 90% of the maximumvalue (at t = 50 ms): the tube powered RF generator needs∼260 ms to ramp up its power output. Note that since weset the oscilloscope to trigger at the initial laser power supplycharging, the laser actually fires at t = 50 ms because it requiresa 50-ms charging delay before firing. In other words, the RFpower ramps up to 90% of its maximum power 260 ms after theRF pulse is triggered, at which time the laser is fired to formthe initial seed plasma. The 20-ns laser pulse produces a high-density plasma [17] with ne = 5.0 × 10¹² − 1013/cm3 with a2.8 × 1.2-cm2 cross-sectional area that is observable on theinterferometer as a spike with a decay on the hundreds of mi-croseconds time scale. Immediately after the laser plasma pulseis formed, a narrow plasma is formed under the antenna thatfluctuates spatially, as shown photographically in Fig. 6. Thisis the intermediate formation stage of the plasma. Figs. 6 and7 are taken at t = 50 and 400 ms using exposure time 10 ms.Note that the laser pulselength is 20 ns, so the RF electric fieldis dominant for this plasma. The plasma is intense and sustainedby the RF electric field. The less dense but bright track betweenregion under the helical antenna and end plate on the left sideis due to the large potential drop between the plasma core andthe conducting end plate. During a typical RF pulse, this stagelasts 133 ms (from t = 50 ms to t = 183 ms on the time axis ofFigs. 5 and 8).

LUO et al.: EXPERIMENTAL STUDY OF LASER-INITIATED HIGH-PRESSURE PLASMAS 2647
Fig. 8. (a) Temporal variation of electron density of the pulsed argon plasmasequence. (b) Temporal variation of total electron–neutral collision frequencyof the pulsed argon plasma.
Fig. 9. Interferometer trace of a laser plus RF argon plasma sequence.
At t = 183 ms (133 ms after the laser pulse), the plasmaevolves into a quasi-steady-state high-density large-volumeargon plasma (Fig. 7) which is sustained for 400 ms (untilt = 581 ms when RF power is turned OFF) and is readily diag-nosed by the interferometer. In the RF power figures [Fig. 5(a)and (b)], a sharp fall in the RF power reflection coefficient is ob-served roughly at t = 183 ms, corresponding to the formationof the quasi-steady-state stage of the plasma which is stable,has large volume and high density and has good RF couplingefficiency. The transition into the quasi-steady-state plasmastage is also observed in the interferometer signal (Fig. 8) asa rise in ne and ν which stabilize at elevated values during thisstage of plasma. We examine the characteristics of this stage ofthe plasma using the method outlined in Section III-B. Whenthe plasma is formed, the 5.0-cm line-average electron densityand total electron–neutral collision frequency are diagnosableusing the interferometer signals. The two signals (in-phase and
Fig. 10. Axial profile of plasma characteristics of the argon plasma:(a) electron density; (b) total electron–neutral collision frequency. The twodashed lines mark the position of two ends of the helical RF antenna. The sameapplies to Fig. 15.
quadrature-phase) from the interferometer are acquired by twochannels of the oscilloscope, which are used to extract thephase shift and attenuation of the wave after it propagatesthrough the plasma. The raw interferometer trace in Cartesiancomplex coordinates (X-Y) is presented in Fig. 9 as a polarplot (r − θ) with in-phase signal plotted as X and quadrature-phase plotted as Y . In this polar plot, the radius correspondsto the normalized wave amplitude (maximum = 1.0) whileangle corresponds to the phase angle of the signal relativeto the reference signal. Details of this method are presentedin [30]. Point A corresponds to the vacuum millimeter wavesignal before the plasma is initiated. Point B corresponds towave launched through the quasi-steady-state plasma createdby laser initiation and RF sustainment with delayed phaseand dampened amplitude compared with A. The trace makesa transition from point A to B when the quasi-steady-stateplasma is formed at t = 183 ms, then back to A when theRF power is turned OFF at t = 581 ms. Using the previouslydiscussed mathematical method, the time-resolved ne and νresults are calculated and presented in the Fig. 8 (a) and (b).The resulting line-average ne is 4.5 × 1012 cm−3, and ν is1.1 × 1011 Hz at z = 44 cm axial position, with z = 0 definedat the laser window of the plasma chamber (Fig. 1). Even afterthe plasma reaches quasi-steady-state, we still observe somefluctuation in these measurements due to instabilities in high-pressure plasmas that has been discussed by other researchers[6], [11].3) Axial Profile of the Electron Density and Total Electron–
Neutral Collision Frequency: The axial profile of the line-average plasma characteristics ne and ν are diagnosed andpresented in Fig. 10. As shown in the figures, we have achieveda high-pressure argon plasma that extends axially from the

2648 IEEE TRANSACTIONS ON PLASMA SCIENCE, VOL. 34, NO. 6, DECEMBER 2006
helical antenna. The peak density occurs at z = 44 cm, about4.0 cm downstream from the helical antenna and the plasmaextends approximately 15 cm beyond the antenna. Significantreduction in RF power levels required to sustain large volumehigh-pressure argon discharges was achieved using the laserinitiation technique compared to that required for RF onlyplasma initiation and sustainment. Within the 500-cm3 plasmavolume that extends 25 cm axially, a volume average electrondensity of 2.0 × 1012 cm−3 is achieved with 4.4 W/cm3 steady-state RF power budget. The seed plasma also provides a goodload for efficient RF coupling at lower power levels via rapidlypulsed, inductively coupled sources.4) Electron Temperature: To evaluate Te, we iteratively
solve (11) for Te based on the measured line average totalelectron–neutral collision frequency of 1.1 × 10¹¹ Hz. Since Pe
is 2.2 kW, and η is taken to be 40% for our case, which is basedon detailed simulations and experimental work on argon neutralheating in ICP sources [22], [24], [25], a total of 880 W of netRF power contributes to neutral heating in the 500 cm3 argonplasma. Using (7) and (8), the neutral temperature is found to be1100 K. The neutral pressure is measured to rise by 50% from760 to 1100-torr using the fast-response piezoelectric pressuregauge when the plasma reaches quasi-steady state. We assumethat the chamber pressure reaches equilibrium within veryshort time scales compared to the RF pulselength. Thus, thepressure measured downstream using the piezoelectric gaugeis an accurate representation of the gas pressure in the plasmaregion. Ultimately, after the neutrals are heated for 400 ms bythe elastic electron–neutral collisions, the neutral density inthe plasma region decreases to 39% of the room temperaturedensity value at 760-torr pressure. The left- and right-handsides of (11) are plotted in Fig. 11 using the measured ν valueand total electron collision cross section data generalized byZecca et al. [29]; the intersection yields the electron temper-ature Te = 0.86 eV at z = 44 cm axial position. The high-pressure plasma we make is categorized “quasi-steady-state”plasma because the electrons reach steady-state when theplasma is stabilized, but the neutrals continuously gain thermalenergy from electrons through collisions and hence do not reachsteady-state within the 400-ms plasma pulse.
C. Nitrogen Plasma
The nitrogen plasma condition is presented in detail inSection IV-A. A similar set of techniques as used for the argonplasma is used for the nitrogen plasma experiment to obtainRF power, plasma impedance, electron density, total electroncollision frequency and electron temperature results.1) RF Power and Plasma Impedance: The transition in
resistive plasma impedance from the intermediate to quasi-steady-state plasma stage also occurs in the nitrogen plasma,but it is of lower magnitude due to the lower plasma densitycompared to the argon plasma: the resistive load increases fromvacuum level of 0.50 to 2.0 Ω when the quasi-steady-stateplasma is formed [Fig. 12(c)] which has a lower electron den-sity compared with argon plasma. This smaller variation resultsin better RF matching for the nitrogen plasma. A remarkablylow RF power reflection coefficient of 6.0% is achieved for
Fig. 11. Iterative solution of (11) for argon plasma.
Fig. 12. (a) Incident and reflected RF power over a typical pulsed laser andRF generated nitrogen plasma sequence. (b) Temporal variation of RF powerreflection coefficient over the pulsed nitrogen plasma sequence. (c) Temporalvariation of Rp and Xp of this pulsed nitrogen plasma sequence. The plasmacondition is described in Section IV-A.
the quasi-steady-state nitrogen RF plasma because we tunethe matching network according to the steady-state plasmaimpedance. The RF power coupled into the matchbox andantenna Pnet is 5.0 kW during the quasi-steady-state plasmastage. The RF power efficiency of the matchbox and helical

LUO et al.: EXPERIMENTAL STUDY OF LASER-INITIATED HIGH-PRESSURE PLASMAS 2649
Fig. 13. (a) Temporal variation of electron density of the pulsed nitrogenplasma sequence. (b) Temporal variation of total electron–neutral collisionfrequency of the pulsed nitrogen plasma.
Fig. 14. Quasi-steady-state stage of nitrogen plasma.
antenna are found to be eOhm = 93% and eRad = 75%, respec-tively. Therefore, ultimately a Pe of 3.5 kW is coupled into thesteady-state nitrogen plasma electrons. At lower pressure, thelower pressure nitrogen plasmas show much less temporalfluctuation in plasma characteristics than the argon plasma.2) Time-Resolved Electron Density and Total Electron–
Neutral Collision Frequency: The 50-torr nitrogen plasmaexhibits a lower line-averaged electron density of 3.5 ×10¹¹/cm3, but similar collision frequency of ν ∼ 1.2 × 10¹¹/s(Fig. 13) when compared with the argon plasma. The densityand collision frequency are measured at the peak density po-sition of z = 44 cm, 3 cm from the end of the antenna. TheRF power is turned on at t = −70 ms, then the laser is fired att = 50 ms creating a seed plasma represented by a spike in theinterferometry signal shown in Fig. 13. As shown in Figs. 12and 13, the duration of the intermediate formation stage lastsapproximately 50 ms, much less than that of the argon plasmadue to the lower neutral pressure. The electron density andtotal electron–neutral collision frequency fluctuate significantlyduring this plasma stage and ν cannot be measured because theinterferometer signal goes below the detectable range of theinstrument. The quasi-steady-state nitrogen plasma is formedat t = 100 ms. This plasma also exhibits some instabilities thatare not uncommon in higher pressure discharges. The quasi-steady-state nitrogen plasma created has strong optical emis-
Fig. 15. Axial profile of plasma characteristics of the nitrogen plasma:(a) electron density; (b) total electron–neutral collision frequency.
sion (Fig. 14). The picture is taken at t = 300 ms with 10 msexposure time. It has a very bright purple core surroundedby dimmer blue peripheral region. The single-photon 193-nmexcimer laser’s direct and delayed ionization substantially en-hances the RF penetration away from the helical antenna.3) Axial Profile of the Electron Density and Total Electron–
Neutral Collision Frequency: The axial profiles of line averagene and ν are presented in Fig. 15. The nitrogen plasma densityalso exhibits a bell-shaped axial profile. The interferometerresult suggests that the plasma extends 25 cm axially. How-ever, visually the plasma extends 75 cm along the chamberaxis (Fig. 14). This discrepancy is because the interferometercan only detect density within the range between 1011 and1014 cm−3 (when ne is below the lower limit, the phaseshift of the millimeter wave is too small to be detected, andabove the upper limit, the millimeter wave is cutoff by theplasma), and the plasma outside the detectable region hasa density below 1011 cm−3 although it has strong opticalemission. If we assume a quasi-linear axial density profilewithin the 1500-cm3 visible plasma volume that extends 75 cmaxially, a volume average ne of 5.0 × 1010 cm−3 and ν of0.80 × 1010 Hz is achieved with the 2.3-W/cm3 RF powerbudget.4) Electron Temperature: We iteratively solve (11) for the
line average Te based on the measured total electron–neutralcollision frequency. The total heating efficiency factor η of ni-trogen plasma is taken to be 20%. Numerous inelastic processesthat compete with neutral heating occur in high-pressure nitro-gen plasmas [26], reducing the neutral heating fraction. Using(7) and (8), the neutral temperature is found to be 2400 K. The

2650 IEEE TRANSACTIONS ON PLASMA SCIENCE, VOL. 34, NO. 6, DECEMBER 2006
Fig. 16. Iterative solution of (11) for nitrogen plasma.
neutral pressure is measured to rise from 50 to 90 torr usingthe piezoelectric pressure gauge when the plasma is stabilizedand sustained. As a result of neutral heating, the neutral densitydecreases to 22% of the room temperature density value at50-torr pressure. The left- and right-hand sides of (11) areplotted in Fig. 16, so Te is found to be 1.5 eV at z = 44 cmaxial position.
V. DISCUSSION AND SUMMARY
A technique for creating and diagnosing electrodeless high-pressure large-volume (≥ 500 cm) plasmas in argon (760 torr)and nitrogen (50 torr) is presented. The use of the readily ioniz-able TMAE seed gas with UV excimer laser initiation allowsthe formation of plasma at high pressure of large volumeswith substantially reduced RF power levels. Previous work byour group has shown that the UV excimer laser can penetratewell into the highly collisional TMAE plasma it creates [15],so a 100-cm-long TMAE plasma initial condition is madefor efficient RF power coupling. Although the RF frequencyfRF = 13.56 MHz is much less than the ν ∼ 1011 Hz totalelectron–neutral collision frequency, the laser-formed, longplasma initial condition allows better penetration of the RFpower and creation of longer argon and nitrogen plasma thatallows the plasma to project well beyond the helical coil thanwould be possible with RF power alone. Broadband opticalspectroscopy is utilized to illustrate the transition from theTMAE-seeded laser-initiated plasma to the majority gas plasmalater in the pulse sequence.
A technique to accurately measure the plasma impedance isdiscussed and demonstrated, which enables greatly improvedRF matching via the two capacitor matching system with pulsedoperation. Power reflection levels as low as 6.0% in nitrogenare achieved. Millimeter wave interferometry is used to diag-nose the line average plasma density and total electron–neutralcollision frequency: The argon plasma has maximum line-average electron density of 4.5 × 1012 cm−3 and line-averagetotal electron–neutral collision frequency of 1.1 × 10¹¹ Hz; thenitrogen plasma has maximum line average electron densityof 3.5 × 1011 cm−3 and line average total electron–neutral
collision frequency of 1.2 × 10¹¹ Hz. The maximum densitiesand collision frequencies occur 4-cm downstream from thehelical antenna due to RF penetration and gas flow.
Utilizing an RF power budget of 4.4 W/cm3, we have beenable to sustain a high density (a volume average electron densityof 2.0 × 1012 cm−3), 760-torr argon plasma for 400 ms that ex-tends 25 cm axially and has a total plasma volume of 500 cm3.The nitrogen plasma that we obtained using the same techniqueextends approximately 75 cm axially, has 1500-cm3 volumeand requires an RF power budget of 2.3 W/cm3 to sustainthe volume average density of 5.0 × 1010 cm−3 for 350 ms.If only RF power is used to initiate and sustain the argonand nitrogen plasmas, we can create pulsed plasmas at thesepower levels in argon below 50 torr and nitrogen below 10 torr,respectively. In these cases, the plasma volumes and RF pen-etration lengths are well below those for the laser-initiatedplasmas: in argon, the plasma can only extend 15 cm axially(a 300-cm3 volume); in nitrogen, it can only penetrate 25 cm(a 500-cm3 volume). In addition, we have developed a newinterferometer technique to evaluate the line average electrontemperature in neutral dominated high-pressure plasmas. Basedon assumed neutral heating efficiencies for argon and nitrogen,our RF power balance analysis and interferometer diagnostictechnique yields an electron temperature of 0.86 eV in argonat 760 torr with Tn = 1100 K and 1.5 eV in nitrogen at50 torr with Tn = 2400 K. Because Tn is evaluated just beforethe end of the RF pulse, nn and Te are also evaluated for thequasi-steady-state plasma just before the RF power is turnedOFF. Following a plasma equilibrium analysis by Griem [32],an electron density higher than 2 × 10¹⁷ is needed for theplasmas with Te greater than 0.8 eV to be in complete localthermal equilibrium (LTE). LTE means all the quantum stateswithin the atoms or ions are in thermal equilibrium includingthe ground state. This gives additional validation to the exper-imental result of temperature difference between electrons andneutrals.
ACKNOWLEDGMENT
The authors would like to thank Dr. K. Akhtar for manyuseful discussions, J. Morin of Comdel, Inc. for useful technicalassistance on the RF generator, and Prof. S. Nelsen and G. Liof the Chemistry Department of the University of Wisconsin-Madison for their help in synthesizing TMAE.
REFERENCES
[1] P. Tsai, L. Wadsoworth, and J. R. Roth, “Surface modification of fabricsusing a one-atmosphere glow discharge plasma to improve fabric wetta-bility,” Tex. Res. J., vol. 67, no. 5, pp. 359–369, 1997.
[2] K. Kelly-Wintenberg, T. C. Montie, C. Brickman, J. R. Roth, A. K.Carr, K. Sorge, L. C. Wadsworth, and P. P. Y. Tsai, “Room temperaturesterilization of surfaces and fabrics with a one atmosphere uniform glowdischarge plasma,” J. Ind. Microbiol. Biotech., vol. 20, no. 1, pp. 69–74,Jan. 1998.
[3] K. Kelly, J. E. Scharer, G. Ding, M. Bettenhausen, and S. P. Kuo, “Mi-crowave reflections from a vacuum ultraviolet laser produced plasmasheet,” J. Appl. Phys., vol. 85, no. 1, pp. 63–68, Jan. 1999.
[4] R. J. Vidmar, “On the use of atmospheric pressure plasmas as electromag-netic reflector and absorbers,” IEEE Trans. Plasma Sci., vol. 18, no. 4,pp. 733–741, Aug. 1990.

LUO et al.: EXPERIMENTAL STUDY OF LASER-INITIATED HIGH-PRESSURE PLASMAS 2651
[5] M. Laroussi, “Scattering of EM waves by a layer of air plasma surround-ing a conducting cylinder,” Int. J. Infrared Millim. Waves, vol. 17, no. 12,pp. 2215–2232, Dec. 1996.
[6] K. H. Becker, U. Kogelschatz, K. H. Schoenbach, and R. J. Barker, Non-equilibrium air plasmas at atmospheric pressure. Bristol, U.K.: Inst.Phys., 2005.
[7] R. J. Vidmar and K. R. Stalder, “Air chemistry and power to generateand sustain plasmas: Plasma lifetime calculations,” in Proc. AIAA, 2003,pp. 1–8.
[8] M. A. Lieberman and A. J. Lichtenberg, Principles of plasma dischargesand materials processing, 2nd ed. New York: Wiley, 2005.
[9] S. P. Bozeman and W. M. Hooke, “Magnetically enhanced electromag-netic wave penetration in weakly ionized plasmas,” Plasma Sources Sci.Technol., vol. 3, no. 1, pp. 99–107, Feb. 1994.
[10] A. B. Petrin, “On the transmission of microwaves through plasma layer,”IEEE Trans. Plasma Sci., vol. 28, no. 3, pp. 1000–1008, Jun. 2000.
[11] H. U. Eckert and F. L. Kelly, “Spectroscopic observations on inductivelycoupled plasma flames in air and argon,” J. Appl. Phys., vol. 39, no. 3,pp. 1846–1852, Feb. 1968.
[12] G. I. Babat, “Electrodeless discharges and some allied problems,” J. Inst.Electron. Engrs., (London), vol. 94, pt. III, pp. 27–37, Jan. 1947.
[13] C. H. Kruger, T. G. Owano, and C. O. Laux, “Experimental investigationof atmospheric pressure nonequilibrium plasma chemistry,” IEEE Trans.Plasma Sci., vol. 25, no. 5, pp. 1042–1051, Oct. 1997.
[14] C. O. Laux, T. G. Spencer, C. H. Kruger, and R. N. Zare, “Opticaldiagnostics of atmospheric pressure air plasmas,” Plasma Sources Sci.Technol., vol. 12, no. 2, pp. 125–138, May 2003.
[15] S. Ramakrishnan and M. W. Rogozinski, “Properties of electric arc plasmafor metal cutting,” J. Phys. D, Appl. Phys, vol. 30, no. 4, pp. 636–644,Feb. 1997.
[16] A. Schutze, J. Y. Young, S. E. Babayan, J. Park, G. S. Selwyn, andR. F. Hicks, “The atmospheric-pressure plasma jet: A review and com-parison to other plasma sources,” IEEE Trans. Plasma Sci., vol. 26, no. 6,pp. 1685–1694, Dec. 1998.
[17] K. Akhtar, J. Scharer, S. Tysk, and C. M. Denning, “Characterizationof laser produced tetrakis (dimethylamino) ethylene plasma in a high-pressure background gas,” IEEE Trans. Plasma Sci., vol. 32, no. 2,pp. 813–822, Apr. 2004.
[18] K. L. Kelly, J. E. Scharer, E. S. Paller, and G. Ding, “Laser ionization andradio frequency sustainment of high-pressure seeded plasmas,” J. Appl.Phys., vol. 92, no. 2, pp. 698–709, Jul. 2002.
[19] G. Ding, J. E. Scharer, and K. Kelly, “Diagnostics and analyses of decayprocess in laser produced tetrakis (dimethyl-amino) ethylene plasma,”Phys. Plasmas, vol. 8, no. 1, pp. 334–342, Jan. 2001.
[20] K. L. Kelly, “Laser ionization and radiofrequency sustainment of high-pressure seeded plasmas,” Ph.D. dissertation, Univ. Wisconsin, Madison,WI, 2001.
[21] W. L. Stutzman and G. A. Thiele, Antenna Theory and Design, 2nd ed.Hoboken, NJ: Wiley, 1998, p. 43.
[22] D. B. Hash, D. Bose, M. V. V. S. Rao, B. A. Cruden, M. Meyyappan,and S. P. Sharma, “Impact of gas heating in inductively coupled plasmas,”J. Appl. Phys., vol. 90, no. 5, pp. 2148–2157, Sep. 2001.
[23] Y. P. Raizer, Gas Discharge Physics, Reprint ed. New York: Springer-Verlag, 1997.
[24] S. K. Nam and D. J. Economou, “Two-dimensional simulation of a minia-turized inductively coupled plasma reactor,” J. Appl. Phys., vol. 95, no. 5,pp. 2272–2277, Mar. 2004.
[25] M. W. Kiehlbauch and D. B. Graves, “Modeling argon inductively cou-pled plasmas: The electron energy distribution function and metastablekinetics,” J. Appl. Phys., vol. 91, no. 6, pp. 3539–3546, Mar. 2002.
[26] M. Moravej, X. Yang, M. Barankin, J. Penelon, and S. E. Babayan,“Properties of an atmospheric pressure radio-frequency argon and nitro-gen plasma,” Plasma Sources Sci. Technol., vol. 15, no. 2, pp. 204–210,May 2006.
[27] F. F. Chen, Introduction to Plasma Physics and Controlled Fusion,2nd ed. New York: Plenum Press, 1984.
[28] I. P. Shkarofsky, T. W. Johnston, and M. P. Bachynski, The ParticleKinetics of Plasmas. Dordrecht, Netherlands: Addison-Wesley, 1966.
[29] A. Zecca, G. P. Karwasz, and R. S. Brusa, “One century of experiments onelectron-atom and molecule scattering: A critical review of integral crosssections,” Rivista Del Nuovo Cimento, vol. 19, no. 3, pp. 1–146, 1996.
[30] K. Akhtar, J. Scharer, S. Tysk, and E. Kho, “Plasma interferometryat high pressures,” Rev. Sci. Instrum., vol. 74, no. 2, pp. 996–1001,Feb. 2003.
[31] S. Tysk, C. M. Denning, J. E. Scharer, and K. Akhtar, “Optical, wavemeasurements, and modeling of helicon plasmas for a wide range ofmagnetic fields,” Phys. Plasmas, vol. 11, no. 3, pp. 878–887, Mar. 2004.
[32] H. R. Griem, Plasma Spectroscopy, 1st ed. New York: McGraw-Hill,1964.
Siqi Luo (M’05) received the B.S. degree in mate-rials science from Shanghai Jiao Tong University,Shanghai, China, in 2001 and the M.S. degree inadvanced materials from the Singapore-MIT Al-liance Program, National University of Singapore,Singapore, in 2003. He is currently working towardthe Ph.D. degree at the Department of Electrical andComputer Engineering, University of Wisconsin-Madison.
His industrial experience includes a graduate re-search internship with the Institute of Microelec-
tronics, Singapore, in 2003 and an engineer position with SemiconductorManufacturing International Corporation, Shanghai, in 2001. His research workfocuses on experimental and computational study of the RF, microwave, andlaser plasma technologies.
Mr. Luo was the recipient of the Institute of Materials Research and Engi-neering Award for Best Student for his M.S. work.
John E. Scharer (SM’90) received the B.S., M.S.,and Ph.D. degrees in electrical engineering fromthe University of California, Berkeley, in plasmaphysics.
He is a Professor with the Department of Electricaland Computer Engineering and the Co-Director ofthe Center for Plasma Theory and Computation,University of Wisconsin-Madison. He has spent sab-baticals at the Commissariat a l’Energie Atomique,Fontenary-aux-Roses, France, in 1970, the JointEuropean Torus, Culham, U.K., in 1983, and the
Australian National University, Sydney, Australia, in 2000, working on RFplasma physics. He has substantial research experience in excimer laser plasmacreation, optical spectroscopy, radio frequency sustainment, millimeter-wavediagnostics, and chemistry of organic seed gas plasmas in air and microwavevacuum electronics. He also has extensive experience in theoretical, computa-tional, and experimental researches on antenna coupling and wave propagation,as well as heating and creative diagnostics in plasmas and vacuum electronics.
Magesh Thiyagarajan (S’99) was born in Chennai,India, in 1981. He received the B.E. degree (withhonors) in engineering from the University ofMadras, Chennai, in 2001 and the M.S. degree (withthe citation for professional promise) from the Uni-versity of Tennessee, Knoxville, in 2004. He is cur-rently working toward the Ph.D. degree in plasmaand applied physics at the University of Wisconsin-Madison. His M.S. thesis focused on nonthermallarge-volume atmospheric pressure plasmas, tunableplasma stealth antennas, and plasma ball lightning.
His current research interest is focused on laser-initiated and radio-frequency-sustained atmospheric pressure air constituent plasmas, as well ashigh-power laser-focused breakdown plasmas and optical diagnostics.
Mr. Thiyagarajan is a member of the engineering honor societies Tau BetaPi, Eta Kappa Nu, and Order of the Engineer. He was the Vice President of theIEEE Chapter at Wisconsin-Madison (2004-2005). He was the recipient of theIEEE Graduate Student Scholarship Award in 2004.
C. Mark Denning (M’01) received the B.S. de-gree in electrical engineering from the Universityof Illinois at Chicago in 2002 and the M.S. de-gree in electrical engineering from the University ofWisconsin-Madison in 2004. He is currently work-ing toward the Ph.D. degree at the Department ofElectrical and Computer Engineering, University ofWisconsin-Madison.
His research interests include experimentation andcomputational modeling of helicon plasmas as wellas high-pressure inductive discharges.