experimental studies on polymer and...
TRANSCRIPT

EXPERIMENTAL STUDIES ON POLYMER AND
ALKALINE-SURFACTANT-POLYMER FLOODING
TO IMPROVE HEAVY OIL RECOVERY
A Thesis
Submitted to the Faculty of Graduate Studies and Research
In Partial Fulfillment of the Requirements
For the Degree of
Master of Applied Science
In
Petroleum Systems Engineering
University of Regina
By
Razieh Solatpour
Regina, Saskatchewan
June 1, 2015
Copyright 2015: Razieh Solatpour

UNIVERSITY OF REGINA
FACULTY OF GRADUATE STUDIES AND RESEARCH
SUPERVISORY AND EXAMINING COMMITTEE
Razieh Solatpour, candidate for the degree of Master of Applied Science in Petroleum Systems Engineering, has presented a thesis titled, Experimental Studies on Polymer and Alkaline-Surfactant-Polymer Flooding to Improve Heavy Oil Recovery, in an oral examination held on April 15, 2015. The following committee members have found the thesis acceptable in form and content, and that the candidate demonstrated satisfactory knowledge of the subject material. External Examiner: Dr. Nader Mobed, Department of Physics
Supervisor: Dr. Farshid Torabi, Petroleum Systems Engineering
Committee Member: Dr. Fanhua Zeng, Petroleum Systems Engineering
Committee Member: Dr. Babak Mehran, Environmental Systems Engineering
Chair of Defense: Dr. Craig Gelowitz, Software Systems Engineering

i
ABSTRACT
Polymer flooding is considered a non-thermal secondary/tertiary oil recovery
method. Polymer flooding is intended to reach the goal of improving mobility ratio by
injecting long chain polymer molecules with high molecular weights in order to increase the
viscosity of displacing water. Viscous water assists by having a piston like displacement of
heavy oil, which mitigates fingering phenomena to some extent.
This work aims to investigate the potential of highly concentrated polymer solutions
from different polymers, with respect to enhancing heavy oil recovery. This work also
validates the feasibility of combining alkaline-surfactant-based solutions and polymer
flooding, called Alkaline-Surfactant-Polymer (ASP) flooding, to improve the oil recovery
from thin heavy oil reservoirs in Western Canada.
Extensive review on polymer-chemical flooding literature indicated that most of the
researches investigated the mobility ratio aspect of polymer flooding. This study further
investigated polymer and ASP flooding from the application time aspect by applying them
as a secondary and tertiary recovery method. The effects of implementing polymer and ASP
flooding as a secondary/tertiary recovery method have been studied through a series of
carefully designed laboratory experiments.
Nine sets of polymer flooding experiments were conducted using oil-saturated sand-
pack, various concentrations of Flopaam 3530S (0.1, 0.2, and 0.4 wt%), 0.4 wt% Flocomb
3525C, 0.5 wt% Na2CO3 as alkaline, and different surfactants with various concentrations.
0.1 wt% NaCl solution was used during all of the experiments as brine. The viscosity of the
oil used in this study accurately measured 960 cp at 23°C. All tests were done in similar

ii
rock/fluid system (similar sand packs and heavy oil samples). During the experiments, data
such as production trends, recovery factors, differential pressure and, injection pressure were
collected to analyze the experiments. Phase behaviour analysis was conducted prior to the
ASP flooding tests.
Although polymer floods generally show a higher recovery factor than water
flooding, there were no significant differences in ultimate oil recoveries with different
polymers which having the same concentration. The results of increasing polymer
concentration on heavy oil recovery were more noticeable in lower polymer concentrations.
Similar to other enhanced heavy oil recovery techniques, polymer flooding is not
always an ideal process as, in some cases, high injection pressures can be encountered in
heavy oil reservoirs. As the oil near the watered-out pathways is contacted by the alkaline-
surfactant, interfacial tension between them is lowered. A lowered interfacial tension fluid
can be displaced by injection of a lower-viscosity polymer, which then leads to improved
heavy oil recovery under more feasible operational conditions. Addition of alkaline and
surfactant to the polymer solution improved recovery factor. Implementing secondary
polymer/ASP flooding showed faster and higher oil recovery.

iii
ACKNOLEDGMENTS
First and foremost, I would like to express the deepest appreciation to my supervisor,
Dr. Torabi, for providing me with an excellent atmosphere for doing my research. I would
also like to acknowledge him for his financial support. One simply could not wish for a
better or friendlier supervisor.
I would like to thank Mr. Manoochehr Akhlaghinia, for his personal, academic, and
technical support since the start of my studies.
I wish to express my sincere gratitude to Mr. Ryan Wilton for his friendship and
support. He generously shared his knowledge and experience all the way through my
laboratory experiments.

iv
DEDICATION
To my family, for all the years we shared together.

v
TABLE OF CONTENTS
ABSTRACT ........................................................................................................................ I
ACKNOLEDGMENTS .................................................................................................. III
DEDICATION ................................................................................................................ IV
LIST OF TABLES ......................................................................................................... VII
LIST OF FIGURES ..................................................................................................... VIII
NOMENCLATURE ....................................................................................................... XII SUBSCRIPTS ............................................................................................................................................................... XII ABBREVIATIONS ...................................................................................................................................................... XIII
CHAPTER 1: INTRODUCTION .................................................................................. 1 1.1 HEAVY OIL ....................................................................................................................................................... 1 1.2 ENHANCED OIL RECOVERY METHODS ....................................................................................................... 7 1.3 WATER FLOODING ......................................................................................................................................... 9 1.4 CHEMICAL FLOODING .................................................................................................................................. 11 1.5 POLYMER FLOODING ................................................................................................................................... 13 1.6 ALKALINE FLOODING .................................................................................................................................. 14 1.7 SURFACTANT FLOODING ............................................................................................................................. 14 1.8 MICELLAR FLOODING .................................................................................................................................. 16
CHAPTER 2: LITERATURE REVIEW ................................................................... 17 2.1 POLYMER FLOODING ................................................................................................................................... 17 2.1.1 Best Time For Polymer Flooding ................................................................................................... 19 2.1.2 Polymer Type ......................................................................................................................................... 20 2.1.3 Polymer Slug Size ................................................................................................................................. 23 2.1.4 Mobility Control .................................................................................................................................... 23 2.1.5 Polymer Slug Concentration ............................................................................................................ 24 2.1.6 Viscosity of Polymer Slug .................................................................................................................. 25 2.1.7 Density of Polymer Slug ..................................................................................................................... 27 2.1.8 Reservoir’s Salinity Effect ................................................................................................................. 27 2.1.9 Pre-‐flush and Post Flush .................................................................................................................... 28 2.1.10 Polymer Flow Behavior in Porous Media ................................................................................... 29 2.1.11 Advantages of Polymer Flooding ................................................................................................... 39 2.1.12 Economical Point of View ................................................................................................................. 41
2.2 ALKALINE-‐SURFACTANT-‐POLYMER (ASP) FLOODING ........................................................................ 42 2.2.1 Definition ................................................................................................................................................. 42 2.2.2 ASP Flooding in Canada .................................................................................................................... 44 2.2.3 ASP Mechanism ..................................................................................................................................... 45 2.2.4 Design ........................................................................................................................................................ 47 2.2.5 Screening Criteria ................................................................................................................................ 48

vi
2.2.6 Advantages of ASP Flooding ............................................................................................................ 49 2.3 OBJECTIVES ................................................................................................................................................... 51
CHAPTER 3: EXPERIMENTAL SETUP AND PROCEDURES ........................... 52 3.1 MATERIAL ..................................................................................................................................................... 52 3.1.1 Brine ........................................................................................................................................................... 52 3.1.2 Polymer ..................................................................................................................................................... 52 3.1.3 Alkaline ..................................................................................................................................................... 57 3.1.4 Surfactant Systems .............................................................................................................................. 57 3.1.5 Oil ................................................................................................................................................................ 57
3.2 1D TWO-‐PHASE CORE FLOOD EXPERIMENTAL PROCEDURE .............................................................. 58 3.3 DIFFERENTIAL PRESSURE RESPONSE MEASUREMENT ......................................................................... 64 3.4 PHASE BEHAVIOR ANALYSIS ...................................................................................................................... 64
CHAPTER 4: EXPERIMENTAL RESULTS ............................................................ 68 4.1 RHEOLOGICAL MEASUREMENTS OF POLYMER SOLUTIONS ................................................................. 68 4.2 1D TWO-‐PHASE CORE FLOODS PERFORMANCE ..................................................................................... 71 4.3 WATER FLOODING (960 MPA·S OIL, 1 WT% NACL BRINE SOLUTION) ............................................ 73 4.4 EFFECT OF POLYMER CONCENTRATION (960 CP OIL, 0.4 WT%, 0.2 WT%, AND 0.1 WT%
FLOPAAM 3530S HPAM) ..................................................................................................................................... 76 4.5 EFFECT OF POLYMER TYPE (960 CP OIL, 0.4 WT% FLOCOMB C3525 HPAM) ............................ 86 4.6 EFFECT OF ADDING ALKALINE AND SURFACTANT TO POLYMER SOLUTION (960 CP OIL, 0.2 WT% FLOPAAM 3530S + 0.5 WT% NA2CO3 + 0.2 WT% SURFACTANT) .................................................. 89 4.7 ASP FLOODING AS SECONDARY RECOVERY METHOD (960 CP OIL, 0.2 WT% FLOPAAM 3530S + 0.5 WT% NA2CO3 + 0.2 WT% SURFACTANT) .................................................................................................. 93 4.8 POLYMER FLOODING AS A SECONDARY RECOVERY METHOD (960 CP OIL, 0.4 WT% FLOCOMB C3525) ..................................................................................................................................................................... 96 4.9 ALKALINE-‐POLYMER FLOODING AS A SECONDARY RECOVERY METHOD (960 CP OIL, 0.2 WT%
FLOPAAM 3530S + 0.5 WT% NA2CO3) ............................................................................................................. 99
CHAPTER 5: DISCUSSION ..................................................................................... 103 5.1 CASE 1 – WATER FLOODING VS. POLYMER FLOODING AS A SECONDARY AND TERTIARY RECOVERY METHOD ............................................................................................................................................. 104 5.2 CASE 2 – EFFECT OF POLYMER CONCENTRATION ON HEAVY OIL RECOVERY .............................. 107 5.3 CASE 3 – EFFECT OF POLYMER TYPE ON HEAVY OIL RECOVERY .................................................... 110 5.4 CASE 4 – POLYMER FLOODING VS. ASP FLOODING RECOVERY METHOD ...................................... 112 5.5 CASE 5 – ASP FLOODING AS SECONDARY AND TERTIARY RECOVERY METHOD .......................... 116 5.6 CASE 6 – ASP FLOODING VS. AP FLOODING RECOVERY METHODS ................................................ 119
CHAPTER 6: CONCLUSIONS AND RECOMMENDATIONS ........................... 122 6.1 CONCLUSIONS ....................................................................................................................................... 122 6.2 RECOMMENDATIONS FOR FUTURE WORKS ........................................................................... 125
REFERENCES ............................................................................................................... 127

vii
LIST OF TABLES
Table 1-1: Classification of crude oils to its measured API gravity. ................................... 1
Table 1-2: Heavy oil and bitumen resource in Western Canada. ........................................ 3
Table 2-1: Summary of oil properties screening criteria for chemical EOR methods. ...... 48
Table 2-2: Summary of Reservoir Characteristic screening criteria for chemical EOR methods. ...................................................................................................................... 49
Table 3-1: List of used polymers and their properties. ...................................................... 54
Table 3-2: RD and Lot number for the surfactants used in this study. .............................. 57
Table 4-1: Viscosities of injected chemicals at 70% Torque. ............................................ 71
Table 4-2: Sand pack properties for each 1D core flood experiments conducted in this study. .......................................................................................................................... 72

viii
LIST OF FIGURES
Figure 1-1: Principal heavy oil and bitumen sandstone deposits of Western Canada ......... 2
Figure 1-2: Diagram of Western Canada basin .................................................................... 4
Figure 1-3: Schematic of water flooding method .............................................................. 10
Figure 1-4: Mobility control by polymer flooding. Displacement of water flooding and polymer flooding. ....................................................................................................... 13
Figure 1-5: Comparison of displacement efficiency by water flooding, surfactant flooding, and SP flooding ........................................................................................... 15
Figure 2-1: Polyacrylamide and partially hydrolyzed polyacrylamide .............................. 22
Figure 2-2: Schematic of different fluid behaviours. ......................................................... 26
Figure 2-3: Displacement of residual oil in dead end pores by water flooding and polymer flooding. ...................................................................................................................... 31
Figure 2-4: Residual oil after water flooding and polymer flooding ................................. 31
Figure 2-5: Residual oil saturation comparison in water, polymer, and ASP flooding ..... 50
Figure 3-1: Chemical structure of PAM and HPAM polymer molecules. ........................ 53
Figure 3-2: Schematic of 1D core flood experiments setup. ............................................. 58
Figure 3-3: Photo of 1D core flood experiments setup. ..................................................... 59
Figure 3-4: Swagelok® sand pack holder. 60
Figure 3-5: Prepared surfactant solutions in different concentrations from 0.1 to 0.4 wt% for each surfactant type. .............................................................................................. 65
Figure 3-6: Prepared surfactant solutions after adding 1 ml oil, unshaken for 24 hours. .. 65
Figure 3-7: Prepared surfactant solutions 3 hours after shaking. ....................................... 66
Figure 3-8: Prepared surfactant solutions 30 hours after shaking (aqueous phase becoming more cloudy). ............................................................................................. 67
Figure 4-1: Viscosity vs. Torque of 0.4 wt% Flopaam 3530 in 1 wt% brine at 23°C. ...... 68
Figure 4-2: Viscosity vs. Torque of 0.4 wt% Flocomb C3525 in 1 wt% brine at 23°C. ... 69

ix
Figure 4-3: Viscosity vs. Torque of AP solution (0.2 wt% Flopaam 3530S + 0.5 wt% Na2CO3) in 1 wt% brine at 23°C. ............................................................................... 70
Figure 4-4: Viscosity vs. Torque of ASP solution (0.2 wt% Flopaam 3530S + 0.5 wt% Na2CO3 + 0.2 wt% Surfactant) in 1 wt% brine at 23°C. ............................................ 70
Figure 4-5: Recovery factor vs. Injected fluid for water flooding. .................................... 73
Figure 4-6: Water cut vs. Injected fluid for water flooding. .............................................. 74
Figure 4-7: Pressure difference vs. Injected fluid for water flooding. ............................... 75
Figure 4-8: Recovery factor vs. Injected fluid for 0.4 wt% Flopaam 3530S solution flooding after water flooding. ..................................................................................... 76
Figure 4-9: Water cut vs. Injected fluid for 0.4 wt% Flopaam 3530S solution flooding after water flooding. ................................................................................................... 77
Figure 4-10: Pressure vs. Injected fluid for 0.4 wt% Flopaam 3530S solution flooding after water flooding. ................................................................................................... 78
Figure 4-11: Recovery factor vs. Injected fluid for 0.2 wt% Flopaam 3530S solution flooding after water flooding. ..................................................................................... 79
Figure 4-12: Water cut vs. Injected fluid for 0.2 wt% Flopaam 3530S solution flooding after water flooding. ................................................................................................... 80
Figure 4-13: Pressure vs. Injected fluid for 0.2 wt% Flopaam 3530S solution flooding after water flooding. ................................................................................................... 81
Figure 4-14: Pressure vs. Injected fluid (IWF + 0.2 wt% Flopaam 3530S solution flooding + EWF) ......................................................................................................... 82
Figure 4-15: Recovery factor vs. Injected fluid for 0.1 wt% Flopaam 3530S solution flooding after water flooding. ..................................................................................... 83
Figure 4-16: Water cut vs. Injected fluid for 0.1 wt% Flopaam 3530S solution flooding after water flooding. ................................................................................................... 84
Figure 4-17: Pressure difference vs. Injected fluid for 0.1 wt% Flopaam 3530S solution flooding after water flooding. ..................................................................................... 85
Figure 4-18: Pressure vs. Injected fluid (IWF + 0.1 wt% Flopaam 3530S solution flooding + EWF) ......................................................................................................... 85

x
Figure 4-19: Recovery factor vs. Injected fluid for 0.4 wt% Flocomb C3525 solution experiment. ................................................................................................................. 86
Figure 4-20: Water cut vs. Injected fluid for 0.4 wt% Flocomb C3525 solution experiment. ................................................................................................................. 87
Figure 4-21: Pressure difference vs. Injected fluid for 0.4 wt% Flocomb C3525 solution experiment. ................................................................................................................. 88
Figure 4-22: Pressure vs. Injected fluid (OF + IWF + 0.4 wt% Flocomb C3525 solution flooding + EWF + OFP) ............................................................................................. 88
Figure 4-23: Recovery factor vs. Injected fluid for ASP solution flooding after water flooding. ...................................................................................................................... 90
Figure 4-24: Water cut vs. Injected fluid for ASP solution flooding after water flooding. ...................................................................................................................... 91
Figure 4-25: Pressure difference vs. Injected fluid for ASP solution flooding after water flooding. ...................................................................................................................... 92
Figure 4-26: Pressure vs. Injected fluid (OF + IWF + ASP flooding + EWF + OFP) ...... 92
Figure 4-27: Recovery factor vs. Injected fluid for ASP solution flooding as a secondary recovery method. ........................................................................................................ 94
Figure 4-28: Water cut vs. Injected fluid for ASP solution flooding as a secondary recovery method. ........................................................................................................ 94
Figure 4-29: Pressure vs. Injected fluid for ASP solution flooding as a secondary recovery method. ........................................................................................................ 95
Figure 4-30: Pressure vs. Injected fluid (OF + ASP flooding + EWF + OFP) .................. 96
Figure 4-31: Recovery factor vs. Injected fluid for polymer flooding as a secondary recovery method. ........................................................................................................ 97
Figure 4-32: Water cut vs. Injected fluid for polymer flooding as a secondary recovery method. ....................................................................................................................... 98
Figure 4-33: Pressure vs. Injected fluid for polymer flooding as a secondary recovery method. ....................................................................................................................... 99
Figure 4-34: Pressure vs. Injected fluid (OF + PF + EWF + OFP) ................................... 99

xi
Figure 4-35: Recovery factor vs. Injected fluid for AP flooding as a secondary recovery method. ..................................................................................................................... 100
Figure 4-36: Water cut vs. Injected fluid for AP flooding as a secondary recovery method. ..................................................................................................................... 101
Figure 4-37: Pressure vs. Injected fluid for AP flooding as a secondary recovery method. ..................................................................................................................... 101
Figure 4-38: Pressure vs. Injected fluid (OF + AP + EWF + OFP) ................................. 102
Figure 5-1: Recovery factor vs. Injected fluid for Water flooding, Flocomb 400 ppm flooding as a secondary and tertiary recovery method. ............................................ 106
Figure 5-2: Pressure difference vs. Injected fluid for water flooding, Flocomb 4000 ppm flooding as a secondary and tertiary recovery method. ............................................ 107
Figure 5-3: Recovery factor vs. Injected fluid for 0.1, 0.2, and 0.4 wt% Flopaam 3530S polymer flooding. ..................................................................................................... 108
Figure 5-4: Pressure difference vs. Injected fluid for 0.1, 0.2, and 0.4 wt% Flopaam 3530S polymer flooding. .......................................................................................... 110
Figure 5-5: Recovery factor vs. Injected fluid for 0.4 wt% Flopaam 3530S and Flocomb C3525 polymer flooding. .......................................................................................... 111
Figure 5-6: Pressure difference vs. Injected fluid for 0.4 wt% Flopaam 3530S and Flocomb C3525 polymer flooding. .......................................................................... 112
Figure 5-7: Recovery factor vs. Injected fluid for 0.2 wt% Flopaam 3530S and ASP flooding. .................................................................................................................... 114
Figure 5-8: Pressure difference vs. Injected fluid for 0.2 wt% Flopaam 3530S and ASP flooding. .................................................................................................................... 115
Figure 5-9: Recovery factor vs. Injected fluid for ASP flooding as a secondary and tertiary recovery method. .......................................................................................... 117
Figure 5-10: Pressure drop vs. Injected fluid for ASP flooding as a secondary and tertiary recovery method. ...................................................................................................... 118
Figure 5-11: Recovery factor vs. Injected fluid for AP and ASP flooding. ..................... 119
Figure 5-12: Pressure difference vs. Injected fluid for AP and ASP flooding. ............... 120

xii
NOMENCLATURE
A cross sectional area of the porous media ft2
k absolute permeability of the porous media darcy
kw water permeability darcy
L length of the porous media ft
M mobility ratio dimensionless
q flow rate bbl/day
Soi initial oil Saturation fraction
Vk Dykstra-Parson coefficient dimensionless
ΔP differential pressure psi
γ shear rate 1/S
η apparent viscosity cp
λo oil mobility darcy/cp
λp polymer mobility darcy/cp
λw water mobility darcy/cp
µ viscosity of injected fluid cp
µp in-situ polymer solution viscosity cp
ρ density lb/ft3
τ shear stress lb/ft2
Subscripts
EWF extended water flood
IWF initial water flooding
o Oil
OF initial oil saturation

xiii
OFP post polymer oil injection
P Polymer
PF polymer flooding
w Water
Abbreviations
AP alkaline-polymer
ASP alkaline-polymer-surfactant
CHOPS cold heavy oil production
CSS cyclic steam stimulation
EOR enhanced oil recovery
FR resistance factor
GAGD gas assisted gravity drainage
HPAM partially hydrolyzed polyacrylamide
ISC in-situ combustion
OOIP original oil in place
PAM Polyacrylamide
PV pore volume
SP surfactant-polymer
RRF residual resistance factor
SAGD steam assisted gas drainage
TAN total acid number
VAPEX vapour extraction

1
CHAPTER 1: INTRODUCTION
1.1 Heavy Oil
George, W. and Smith, C. (2012) define crude oil as a flammable liquid which
occurs naturally in geologic formations under Earth's surface and consists of a complex
mixture of liquid organic compounds mainly hydrocarbons with various molecular weights.
Crude oils or Petroleum can be divided in Light oils, Heavy oils, Waxy oils, Asphaltic oils,
Naphthenic oils, and Acidic and basic oils.
American Petroleum Institute (API) gravity is a measure used to compare the
densities of petroleum liquids. Table 1-1 shows the classification of petroleum according to
its API gravity (George et al. [2012]).
Table 1-1: Classification of crude oils to its measured API gravity. (George et al. [2012])
Classification API Gravity
Light >31
Medium heavy 21-31
Heavy 14-21
Extra heavy 10-14
Bitumen <10
Miller (1994) states that historically, the term “heavy oil” has been used to describe
oil that has higher density and viscosity than conventional oil. Heavy oil viscosity ranges
from 50 cp up to around 50,000 cp (Mai et al. [2009]). However, the definition of heavy oil,
based on API gravity range, varies from state to state (McCullough [1955]).
2
Canada has a significant share of total production and a large volume of in-place
resources of heavy oil and bitumen. Fifty percent of Western Canadian crude oil production
is heavy oil and bitumen, therefore the terms “heavy oil” and “bitumen” are used often in the
Canadian oil industry (Miller et al. [2000] and Mohammadpoor et al. [2012]).
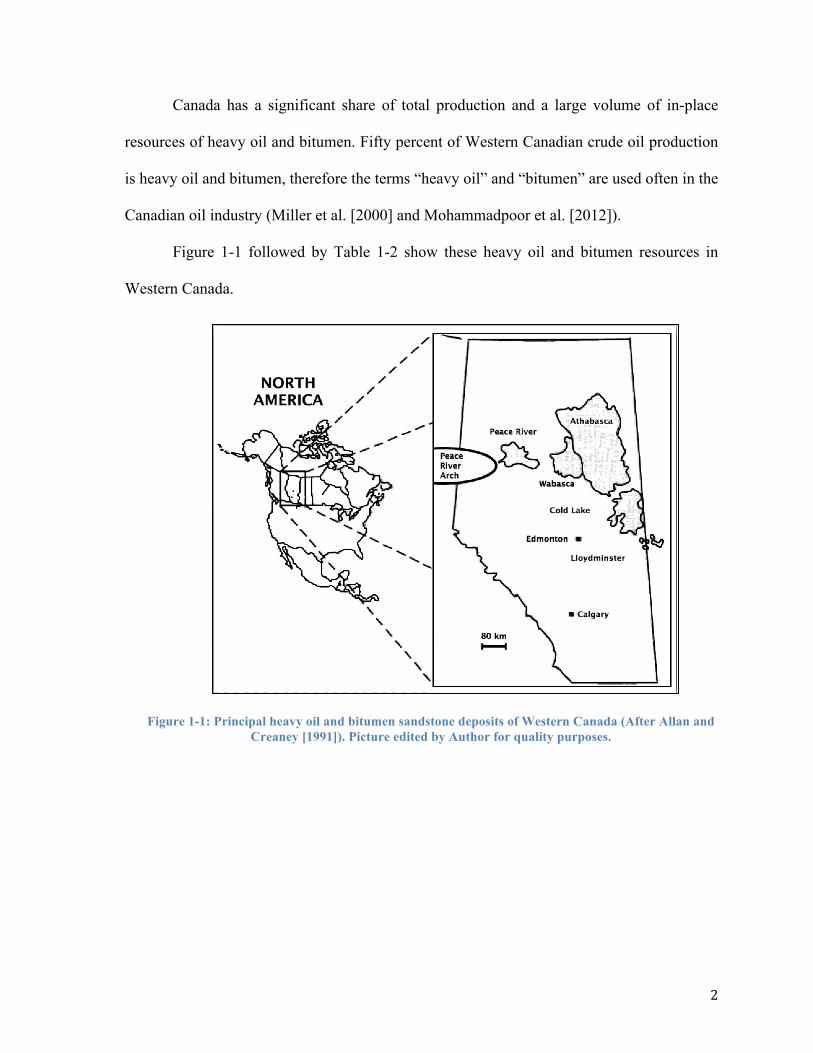
Figure 1-1 followed by Table 1-2 show these heavy oil and bitumen resources in
Western Canada.
Figure 1-1: Principal heavy oil and bitumen sandstone deposits of Western Canada (After Allan and Creaney [1991]). Picture edited by Author for quality purposes.

3
Table 1-2: Heavy oil and bitumen resource in Western Canada (AERCB and SEM, Reserve Estimates).
Deposit (North-South locations)
Volume in place (109M3) Classification
Athabasca 144 Bitumen
Peace river 12 Bitumen
Wabasca 7 Bitumen
Carbonate triangle 215 Bitumen
Primrose 8 Heavy oil and Bitumen
Cold lake 34 Heavy oil and Bitumen
Lloydminster (Alberta) 1.4 Heavy oil
Lloydminster (Saskatchewan) 1.7 Heavy oil
Southern Alberta (Provost to Suffield) 1.1 Intermediate
and Heavy oil
Southern Saskatchewan (Senlac to Battrum) 0.8 Intermediate
and Heavy oil
Total 425
Most of the Western Canada heavy oil is found in the Mannville Formation of the
Cretaceous Age (Figure 1-2). Heavy oil deposits have been known to exist in the vast area
of west-central Saskatchewan, known as the Lloydminster-Kindersley heavy oil belt. In
1936, heavy oil was discovered on the Saskatchewan side of the Lloyd-minster area;
however, the commercial discovery was made in 1994. Saskatchewan is estimated to have
25*10^9 barrel heavy oil in place. Saskatchewan’s heavy oil has a viscous and heavy nature
with density around ρ= 59.31-59.93 lb/ft3 (950-990 Kg/m3) and API about 11-17 degree
(Reid [1984]).

4
Figure 1-2: Diagram of Western Canada basin (After Tissot and Welte [1984]). Picture edited by Author for quality purposes.
Heavy oil reservoirs are structured like other types of oil reservoirs; however, they
are naturally thin and heterogeneous. Saskatchewan’s heavy oil reservoirs typically have a
thin pay zone, bottom water, high permeability, exhibit heterogeneity, high oil saturation,
and high viscosity oil (Reid [1984]).
Heavy and extra heavy oils face challenges such as biodegradation due to geological
processes in reservoirs and carrier beds, which cause the separation of lighter hydrocarbons
from oil and conversion of other hydrocarbon into new compounds, such as organic acids.
The most common characteristic properties of these oils are: high specific gravity/density,
high Total Acid Numbers (TANs), low hydrogen to carbon ratios, high carbon residues, and
high asphaltenes, sulphur, heavy metals, and nitrogen contents (George et al. [2012]).
These crude oils do not flow or process easily because of their high viscosity and
low mobility under reservoir temperature and pressure. Darcy’s Law predicts that under high
applied pressure gradients, these oils can flow slowly. In these reservoirs, using natural drive

5
energy can produce a small fraction of the Original Oil In Place (OOIP), which is initially
available in the reservoir (primary production). Primary oil recovery of these reservoirs is
about 5% of OOIP; so there is still a significant amount of OOIP remain in the reservoir
(Mai et al. [2009]).
Oil and gas resources in conventional oil reservoirs around the world continue to
decline; meanwhile, energy demands are raising and an interest in heavy oil recovery has
increased in recent years. Some strategies have been taken in Canada, as the owner of more
than half of the world’s heavy oil. Initially, the Canadian government reduced royalty and
tax regime for Enhanced Oil Recovery (EOR) production methods. This program
encouraged industry to utilize existing promising new recovery technology and helped EOR
development. The second step for the governments of Canada and Saskatchewan and
consumer’s co-operative refinery Ltd. in August 1983, to build the co-op refinery site in
Regina to encourage increased heavy oil production (Reid [1984]).
If 50% of the heavy oil and bitumen could be produced by petroleum companies for
more than 50 years, 50% of North American demands would be met (George et al. [2012]).
However, there are flow and processing problem associated with the production of heavy
oil. Most of heavy oil production problems seem to come from two sources (McCullough
[1955]):
1. Physical problems caused by high viscosity of heavy oil;
2. Economic problem (higher market price) caused by competition with cheaper
………….light oil.
Produced heavy oil, due to its high viscosity, usually contains impurities, such as
water, sand, and silt. These impurities must be removed at high temperature. A portion of

6
common problems associated with crude oils are considered due to the presence of some
impurities in the composition of oils, such as (McCullough [1955] and George et al [2012]):
• Iron, copper, nickel, and vanadium (Cause some problems in utilization);
• Salts of calcium and sodium (Presumably come from water associated with the
………….oil);
• Sulphur (High amount about 4% to 8%);
• CO2, H2S, CH4, and C2H6 (Extremely hazardous to personnel and corrosive to
………… equipment);
• Lethal hydrogen sulphide (Often found in tank vapours in this case gas masks
………….and safety equipment are provided to prevent casualties); and
• Asphaltenes, paraffin, naphthenates, and inorganic scale depositions.
Problems associated with processing and transporting heavy oil (George et al.
[2012]):
• Artificial lift is needed to produce viscous oils from wells;
• Difficult handling problems due to flow, separation, emulsion, storage, and
………….transportation;
• High heating demand for processing;
• Large equipment required (for residence times);
• Solid production associated with producing; and
• During refining process, heavy oils generate more of the less valued products;
………….and they have more prone to cause problems.

7
1.2 Enhanced Oil Recovery Methods
In Saskatchewan, approximately 9% of OOIP has been produced after both primary
and secondary oil recovery. By displacing more oil to the production wells and, in turn,
obtaining more oil recovery, reservoir energy has to be maintained. EOR is used for all
replenishing reservoir energy techniques. Conventional oil production in the United States is
continuing to decline; then EOR percent of the U.S. oil production is larger than ever.
Today, about 3% of the world’s petroleum production is through EOR techniques
(Mohammadpoor et al. [2012]).
EOR methods are classified as the following:
• Water flooding;
• Cold Heavy Oil Production with Sand (CHOPS);
o Sand production
• Thermal EOR;
o Steam drive
§ Steam flooding
§ Cyclic Steam Stimulation (CSS)
§ Steam Assisted Gravity Drainage (SAGD)
o In-Situ Combustion (ISC)
o Electromagnetic
• Chemical flooding;
o Polymer flooding
o Surfactant flooding
o Alkaline flooding

8
o Micellar flooding
• Gas injection; and
o Gas injection
o Gas Assisted Gravity Drainage (GAGD)
o VAPour EXtraction (VAPEX)
• Other methods:
o Microorganisms
Several steps are required for selecting and implementing an EOR method
(Mohammadpoor et al. [2012] and Goodlett et al. [1986]):
1. Checking the applicability of a specific EOR method: for this step, a technical
………….screening criteria should be define, and it requires studying reservoir properties
………….and formation characteristics;
2. Basic static tests are carried out after selection of candidate methods;
3. The viability of the selected EOR method can be proved by pilot projects;
4. Then, an EOR project is implemented in field wide, conditions lower the
………….screening criteria and pilot project levels will be assumed; and
5. Economic studies are conducted throughout all screening levels.
In Canada, water flooding is the most typical EOR method used for heavy oil
reservoir’s production. Following water flooding, cold production and steam flooding are
the most common methods. Chemical flooding and other techniques are usually coupled
with these methods; however, implementing these technologies is highly dependent on the
economic profitability (Mohammadpoor et al. [2012]).

9
The following techniques have been practically used to improve EOR efficiency
(Mohammadpoor et al. [2012]):
• Horizontal drilling accounts for a significant increase in cold heavy oil
………….productions;
• Conversion of producers to injectors in water flooding,
• Introducing line drive and edge drive will improve the water flooding
………….performance;
• Addition of water mobility control agents in water flooding; and
• Steam stimulation in water flooding.
Most of the above techniques have been successfully applied in Saskatchewan;
however, in some cases, they did not improve the water flooding efficiency. Thermal EOR
methods with broad screening criteria are the most efficient heavy oil recovery techniques.
Next to water flooding, in-situ combustion and steam flooding can become the most widely
used heavy oil recovery methods. If fire flooding methods couple with simultaneous or
intermittent water injection with air, they can be more profitable (Mohammadpoor et al.
[2012]).
1.3 Water Flooding
In conventional oil reservoirs, water flooding theory is a well-recognized and a well-
documented technique for oil recovery after primary production. Water flooding improves
oil recovery at lower injection rates when oil has the viscosity between heavy oil and water;
however, in heavy oil applications, this is not the case. Conditions of water flooding in the

10
case of heavy oil reservoirs are different from those in light oil reservoirs; additionally, each
heavy oil reservoirs has its own conditions of implementation (Mai et al. [2009], Green et al.
[1998], Moore et al. [1956], and Dong et al. [1999]).
Challenges encountered in water flooding of heavy oil reservoirs can be summarized
as follows:
• Viscosity variation has affected the water flooding efficiency;
• The creation of more viscous foamy oil descends the oil production;
• Dirty injection water has been filtered into the induced fracture networks, which
………….increases the possibility of formation plugging. The sweep efficiency has been
………….very poor and increasing the water injection rate will not improve the situation;
• Fingering phenomena is so severe in water flooding. Converting mature
………….injectors to producers can lower water cut shortly after conversion.
The Figure 1-3 shows the schematic of water flooding method.
Figure 1-3: Schematic of water flooding method (newenergyandfuel website).

11
In water flooding, imbibition is the mechanism leading to additional oil recovery. As
long as injection rates have been kept low enough for capillary forces to aid recovery, heavy
oil water floods can be successfully performed; however, in general, the mechanism of
viscous oil recovery by water flooding has not been explored. The technique of low
injection rate could be valid in marginal heavy oil pools, which would not be economic to
produce with other methods. Water flooding could also be conducted as an intermediate
step, while other more expensive recovery options are being considered (Mai et al [2009]).
Heavy oil water flooding method has been in operation in Saskatchewan and Alberta
for about 50 years (Miller [2006]). Water flooding efficiency is low for high viscosity heavy
oil reservoirs, but in many heavy oil fields, water flooding is still commonly applied because
(Mai et al [2009]):
• Water flooding is a relatively inexpensive method; and
• Field operators have years of experience in designing and controlling water
………….floods.
1.4 Chemical Flooding
Chemical flooding is a general term for injection processes where chemicals such as
polymer, alkaline, surfactant, and Micellar, or any combination of them is injected into the
reservoir in order to improve oil recovery efficiency. Chemical flooding methods can
improve oil recovery efficiency even in macroscopic forms by polymer flooding, or
microscopic form by injecting Micellar, alkaline, and soap-like substances to reduce
interfacial tensions in the reservoir. The first setup when designing any chemical floods is to
12
measure the Inter Facial Tension (IFT) between oil and water in the presence of the
chemical. This is the primary requirement for the design of any chemical injection process.
Chemical EOR can be a complex process, involving reactions between the oil, injected
aqueous solution, and the porous medium (Mai et al. [2009]).
There are three main problems when implementing chemical EOR method in the
field (Mai et al. [2009]):
• High cost of chemicals;
• Achieving a good distribution of the polymer or chemical additive in the
………….reservoir; and
• Preventing the consumption of the polymer or chemical additive by interaction
………….with the formation minerals and the formation water.
Chemical flooding is a major component of EOR process, and is considered a well-
recognized technique for conventional oil reservoirs, since they were proposed as early as
1950s (Reisberg et al. [1956]).
Chemical flooding methods can be divided in four main groups:
• Polymer flooding;
• Surfactant flooding;
• Alkaline (caustic) flooding; and
• Micellar flooding.
Any combination of these four groups are also considered to be a chemical flooding
process, such as:
• SP flooding (Surfactant-Polymer flooding);
• AP flooding (Alkaline-Polymer flooding); and

13
• ASP flooding (Alkaline-Surfactant-Polymer flooding).
1.5 Polymer Flooding
In conventional oil reservoirs, residual oil after water flooding exists as
discontinuous ganglia trapped by capillary forces. This is not the case for water flooding
heavy oil reservoirs. The residual oil in the heavy oil reservoirs after water flooding is the
result of oil bypassing by water because of high oil viscosity, which causes a poor mobility
ratio between displacing and displaced fluids (Mai et al. [2009]). Polymer solution results in
increasing volumetric sweep efficiency by improving mobility ratio, and reducing fluid flow
through more permeable channels, Figure 1-4 (netl website).
Figure 1-4: Mobility control by polymer flooding. Displacement of water flooding and polymer flooding.
14
1.6 Alkaline Flooding
The concept of alkaline flooding dates back to 1917 when Squires stated that
displacement might be made more effective by introducing an alkali into the water. The
earliest known patent on alkaline flooding for enhancing oil recovery was issued to Flyeman
in Canada in 1920 for developing a process to separate bitumen from tar sands using sodium
carbonate (Christian [1982] and Ma [2005]).
Five western Canada heavy oils with viscosities ranging from 656 to 18000 cp at
22°C were investigated using alkaline flooding, primarily focusing on tertiary oil recovery
tests. Tertiary oil recoveries of about 10-35% of the initial oil-in-place were obtained from
these tests with corresponding oil/brine and proper alkaline solutions. These high
incremental oil recoveries suggest that the purposed dilute alkaline injection is a promising
EOR process for thin heavy oil reservoirs (Ma [2005]).
The injected alkali reacts with naturally occurring acids in the oil, leading to the
generation of in situ surface-active agents (soaps) at the oil-water interface. These soaps lead
to significant reductions in the oil-water interfacial tension, which can greatly reduce the
capillary forces trapping an oil ganglion in a rock pore (Cooke et al [1974], Garrett [1972],
Rosen [1989], Mungan [1964], Issacs et al. [1992], and netl website).
1.7 Surfactant Flooding
Surfactant-water flooding is a process primarily based upon the formation of very
low interfacial tension between the water phase and the reservoir crude oil, due to surfactant
addition. The action of very low interfacial tensions in porous media will allow the viscous

15
forces associated with the flow of an injected drive fluid to overcome the capillary forces
holding the oil in place. Consequently, the residual oil left from a normal water flood can be
mobilized (Ramirez [1987]). Figure 1-5 shows a comparison of displacement efficiency by
water flooding, surfactant flooding, and SP flooding.
Figure 1-6: Comparison of displacement efficiency by water flooding, surfactant flooding, and SP flooding (egyptoil-gas website).
The formation of surfactants in alkaline flooding improves oil recovery by one or
more of the following mechanisms (belgravecrop website):
• Reduction of interfacial tension;
• Spontaneous emulsification; and
• Wettability alteration.
Anderson looked at SP flooding and suggested that optimal concentrations are
typically very high. However, the type of surfactant is determined based on the type of

16
reservoir (sandstone, lime stone), bottom hole temperature, salinity of the injection brine,
and connate brine. (Alsofi et al. [2011])
1.8 Micellar Flooding
This EOR method uses the injection of a micellar slug into a reservoir. The slug is a
solution usually containing a mixture of a surfactant, co-surfactant, alcohol, brine, and oil
that acts to release oil from the pores of the reservoir rock, much as a dishwashing detergent
releases grease from dishes so that it can be flushed away by flowing water. As the micellar
solution moves through the oil-bearing formation in the reservoir, it releases much of the oil
trapped in the rock. To further enhance production, polymer-thickened water for mobility
control (as described in the polymer flooding process) is injected behind the micellar slug.
Here again, a buffer of fresh water is normally injected following the polymer and ahead of
the drive water to prevent contamination of the chemical solutions. This method has one of
the highest recovery efficiencies of the current EOR methods, but it is also one of the most
costly to implement (netl website).

17
CHAPTER 2: LITERATURE REVIEW
2.1 Polymer Flooding
Eighty-five percent of the world’s energy demand is provided by fossil fuels, while
more than 30% of that is covered by oil and gas. Currently, about 87 million barrels of
petroleum per day (32 billion barrels per year) are being produced in the world. In spite of
declining oil and gas resources in conventional oil reservoirs, energy demand is raising.
Heavy oils have been considered as the most proper and accessible substitute for these
resources (sheng [2011]).
Western Canadian oil has the viscosity between 100 to 10,000 cp; so primary oil
recovery and water flooding only recover about 10% of OOIP in these heavy oil reservoirs.
Water flooding has the low effect on improving oil recovery in Alberta and Western
Canadian reservoirs due to its poor sweep efficiency and early viscous fingering. In heavy
oil reservoirs water flooding, oil has been produced at very high water/oil ratio; which
requires large scale separators. Polymer flooding can be implemented to lowering the
water/oil ratio and improving sweep and displacement efficiency in heavy oil reservoirs
especially in Western Canada oil reserves (Miller [2005] and Wassmuth et al [2007]).
The concept of implementing polymer flooding technique by using polymer solution
for improving heavy oil recovery, was introduced by Pye and Sandiford in 1964, and Knight
and Rhudy at 1977; and then became one of the most mature EOR techniques. Polymer
flooding is considered as a secondary/tertiary oil recovery method, which is a process of
injecting long chain polymer molecules with high molecular weights, in order to increase
water viscosity to reach the goal of improving mobility ratio, similar to most EOR methods.

18
Viscosifying the injected water helps to generate a piston like displacement of heavy oil,
which results in postponing fingering phenomena, and then increases the swept volume
(Wang et al. [1993], Alsofi et al. [2011], Knight et al. [1977], Pye [1964], and Sandiford
[1964]).
There are two goals for every EOR method: Improving the mobility ratio and
increasing the capillary number (Maheshwari [2011]).
Polymer flooding will be reached these goals by adding polymer to the injected
water due to increasing the viscosity of water and decreasing the permeability of flooding
zone; resulting in more oil production. Polymer flooding technique has three potential ways
to increasing recovery oil efficiency (Szabo [1975] and Needham et al. [1987]):
1. Effects of polymers on fractional flow;
2. Decreasing the mobility ratio; and
3. Diverting injected water from zones that have been swept to unswept zones.
The following factors should be considered when selecting and operating polymer
flooding method as an EOR technique for a given oil reservoir:
• Best time for polymer flooding;
• Polymer type;
• Polymer slug size;
• Mobility control;
• Polymer slug concentration;
• Viscosity of polymer slug;
• Density of polymer slug;
• Reservoir’s salinity effect;

19
• Pre-flush and post flush;
• Polymer flow behavior in porous media;
o Permeability
o Residual oil saturation effect
o Cross linking effect
o Polymer adsorption
o Resistance factor and residual resistance factor
o Polymer retention
o Inaccessible pore volume
o Polymer rheology
o Polymer degradation
• Advantages of polymer flooding; and
• Economical point of view.
2.1.1 Best Time For Polymer Flooding
The timing for implementing polymer flooding has significant effect on production
efficiency. It can improve the recovery factor by two or three times, so it is worthwhile to
know when the best time is for starting polymer solution injection (Sheng [2011]).
Using polymer solution injection in secondary floods causes considerably more oil
recovery for less polymer usage than tertiary floods. It is always beneficial to start polymer
flooding as soon as possible, preferably before any water flooding, because polymer
flooding has much greater potential as a secondary process than in post-water flood

20
applications. The amount of polymer used to recover a barrel of oil appears to have been
about six times greater in tertiary than in secondary applications. However optimal start for
polymer flooding method is at time zero (start of the production) (Needham et al. [1987] and
Alsofi et al. [2011]).
Using Polymer flood as a secondary oil recovery method and also post water flood
oil recovery method had been investigated in this thesis and its effect on increasing oil
recovery, injection pressure, and decreasing water cut has been compared.
2.1.2 Polymer Type
Synthetic polymers (polyacrylamides) and Biopolymers are two general types of
polymers, which are used in polymer flooding method (Needham et al [1987]).
Polymer molecular weight is a very important parameter in selecting the polymer
type. Contradictory points should be considered in polymer selection because of its
molecular weight importance (Needham et al. [1987] and Demin et al. [1998]):
1. High polymer molecular weight increases the viscosity of polymer solution,
2. High polymer molecular weight reduces the permeability in high permeability
………….zones,
3. High polymer molecular weight produces higher resistance factor,
4. Very high polymer molecular weight may plug the formation pore spaces,
5. Very high polymer molecular weight has the greater tendency to shear
………….degradation.
The size of polymer molecule should be high enough to increase the viscosity of
solution and plug the high permeability channels. Conversely, it should be small enough to

21
let the solution go through the pore spaces. Optimum polymer molecule size is when its
gyration radius is five times smaller than average size of pore spaces (Demin et al. [1998]).
Polyacrylamide is the most common type of polymer for using in polymer flooding EOR
method. The performance of the polyacrylamide in a flooding situation will depend on its
molecular weight and its degree of hydrolysis (Needham et al. [1987]). Powder
polyacrylamide has the molecular weight equal 10 million Kg/Kg.mole; and its wide use is
based on the (Wang et al. [1993] and Shehata et al. [2012]):
• Appropriate for the formations with salinity range between 700 to 25000 ppm,
• Low price compared with other polymer types,
• Adsorbs on the rock surface to produce a long lasting permeability reduction
………….(the residual resistance effect).
Some polyacrylamides disadvantages are considered as follows (Needham et al.
[1987]):
• Tendency to shear degradation at high flow rates;
• Poor performance in high salinity water (low viscosity, frequently excessive
………….reduction, and high retention level); and
• Precipitate in waters containing too much calcium, at temperature above 170°F
………….(needs high control in salinity of the flooding water).
Partially hydrolyzed polyacrylamide (HPAM) with molecular weight equal to
2500*104 works as the stabilizer (Qingfeng et al. [2012]). In this kind of synthetic polymer,
some of the acrylamide is replaced by, or converted into, acrylic acid. This tends to increase
the viscosity of fresh water; but no viscosity reduction in hard waters (Needham et al.
[1987]).

22
Figure 2-1: Polyacrylamide and partially hydrolyzed polyacrylamide (Lake [1989]).
Biopolymers such as xanthan gums are the other types of polymers with excellent
viscosity in high salinity waters and resistance to shear degradation. Biopolymers also have
an advantage as they are not retained on rock surfaces, and thus propagate more readily into
a formation. This can reduce the amount of polymer required for a flood; but also means that
there is no residual resistance effect. A disadvantage is that they thermally degrade too fast
at temperatures above 200°F (Needham et al. [1987]).
Natural polymers such as guar gum, sodium carboxymethyl cellulose, and hydroxyl
ethyl cellulose are less common types of polymers that are used in polymer flooding process
(Maheshwari [2011]).
23
2.1.3 Polymer Slug Size
Economic limitations, such as Initial Oil In Place (IOIP) and oil price, control the
optimal slug size in polymer flooding process. Optimal slug size favors the use of slightly
larger slugs close to being continuous (Alsofi et al. [2011]).
Increase in slug size will increase injected polymer, incremental oil recovery, oil
price, and also polymer cost.
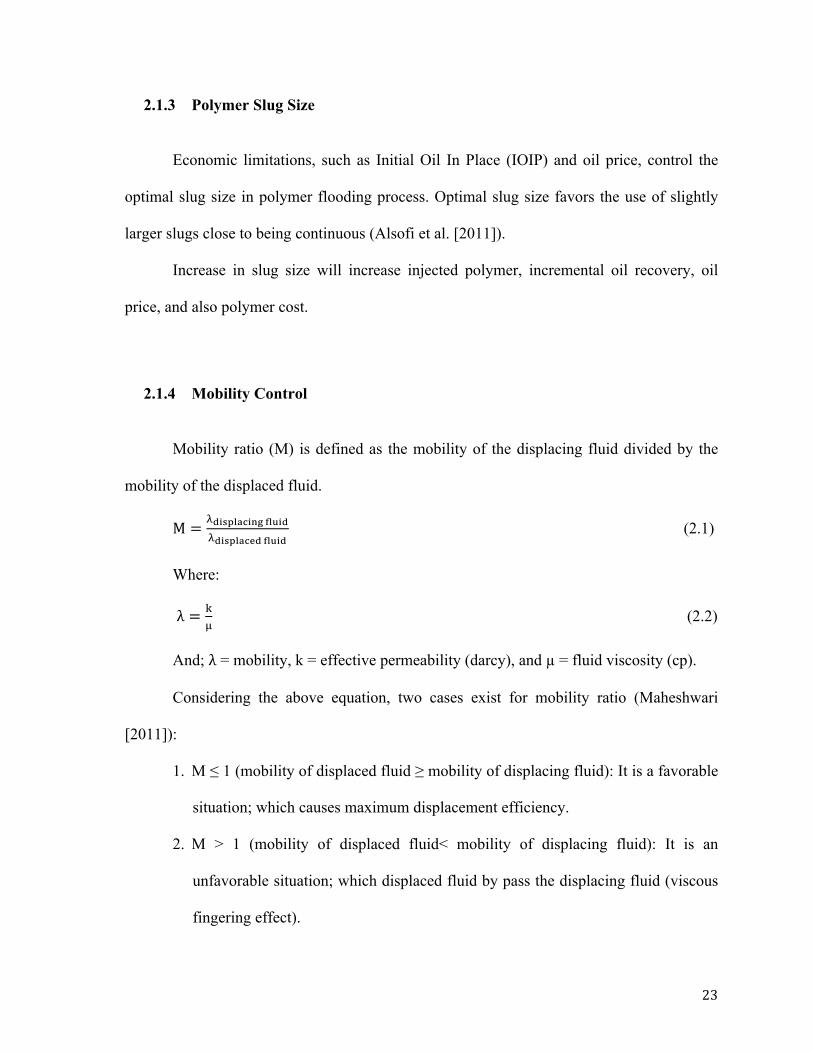
2.1.4 Mobility Control
Mobility ratio (M) is defined as the mobility of the displacing fluid divided by the
mobility of the displaced fluid.
M =!!"#$%&'"() !"#$%!!"#$%&'(! !"#$%
(2.1)
Where:
λ = !! (2.2)
And; λ = mobility, k = effective permeability (darcy), and µ = fluid viscosity (cp).
Considering the above equation, two cases exist for mobility ratio (Maheshwari
[2011]):
1. M ≤ 1 (mobility of displaced fluid ≥ mobility of displacing fluid): It is a favorable
………….situation; which causes maximum displacement efficiency.
2. M > 1 (mobility of displaced fluid< mobility of displacing fluid): It is an
………….unfavorable situation; which displaced fluid by pass the displacing fluid (viscous
………….fingering effect).

24
Mobility ratio should be made smaller, for reaching the favorable mobility ratio.
Implementing each of the Following ways can improve the mobility ratio (Maheshwari
[2011]):
• Lowering the viscosity of the displaced fluid;
• Increasing the viscosity of displacing fluid;
• Increasing the displaced fluid relative permeability; and
• Decreasing the displacing fluid relative permeability.
It means that any changes that can reduce the ratio will shift the mobility ratio to its
desirable amount; and frequently improve the sweep efficiency and increase the oil recovery
factor. Adding polymer to the displacing fluid increases its viscosity and decreases its
relative permeability; which causes a resistance force against the flow of displacing fluid in
the reservoir. Delaying the fingering phenomenon, increasing vertical and areal sweep
efficiencies, and displacement efficiency are considered to be polymer flooding results due
to its positive effects on lowering the mobility ratio (Needham et al. [1987] and Wassmuth
et al. [2007]).
2.1.5 Polymer Slug Concentration
Different recommendations are available that address the optimal concentration of
polymer, which varies between 500 mg/L.PV to 2000 mg/L.PV (Szabo [1975], Demin et al.
[1998], and Alsofi et al. [2011]).
There are two recommendations regarding the effects of increasing polymer
concentration in polymer slugs on efficiency, as follows (Szabo [1975]):

25
• Increasing the polymer concentration has poor effect on oil recovery when
………….larger volumes of fluids were injected.
• Increasing the polymer concentration from 1000 to 2000 ppm was found to
………….improve the economics at both high and low oil price.
Optimal concentration of polymer depends on injection rate, polymer viscosity,
reservoir heterogeneity, well radius, bottom hole pressure, shear thinning, sand permeability,
oil properties, and oil price. Polymer slugs with different concentrations had been
experimented in this thesis to compare the effect of polymer concentration in increasing oil
recovery.
2.1.6 Viscosity of Polymer Slug
From a fluid behavior point of view, polymer solutions generally show non-
Newtonian flow behavior at sufficiently high polymer concentrations and shear rates (Vafaei
[2012]). Flow properties of Non-Newtonian fluids are different from Newtonian fluids in all
aspects. There is a linear relation between stress and strain in Newtonian fluids as follow;
where constant coefficient of proportionality is known as the viscosity.
τ = µμ !"!"
(2.3)
Where: τ = drag force, the shear stress exerted by the fluid (lb/ft2), µμ = fluid
viscosity (cp), and !"!"
= The strain rate, the gradient of the velocity perpendicular to the
direction of shear stress (S-1).

26
Figure 2-2: Schematic of different fluid behaviours.
For designing a practical slug in polymer flooding, the magnitudes of the viscosity of
the displacing and displaced fluid are important variables. Considering the mobility ratio
equation, the ratio of displaced fluid viscosity to the displacing fluid viscosity, affects the
recovery factor. In the other words, areal and vertical sweep efficiencies are determined by
the mobility ratio in every flooding process; which is proportional to the displaced fluid
viscosity whereas it is inversely proportional to the displacing fluid viscosity (Green et al.
[1998]).
Fluid viscosity is a function of micro emulsion composition. Viscosity of micro
emulsions varies from values on the order of magnitude of water to significantly larger
values. This wide range of change in viscosity can be provided by proper adjustment of
micro emulsion composition, polymer addition, and alcohol co-surfactant addition. Polymer
addition to any chemical slug is to increase the slug viscosity for the purpose of mobility
control; without effecting phase behavior or interfacial tension (Green et al. [1998]).
In order to improving oil recovery in polymer flooding process, viscosity of polymer
slugs can be increased by either of the following methods (Szabo [1975]):

27
• Increasing the polymer concentration in brine; and
• Decreasing the salinity of the solvent.
The effect of polymer addition on viscosity can be quite significant at low volumes
of injected fluid and lower salinities. However, the role of the viscosity of the polymer slug
is less dominant at greater volume of injected fluids. For example, the viscosity of polymer
solution in tap water is much greater than the 2% NaCl polymer solution viscosity (Green et
al. [1998], Szabo [1975], and Pope et al. [1982]).
2.1.7 Density of Polymer Slug
The ratio of the displacing fluid density to the displaced fluid density, is an important
parameter for designing a polymer slug; which affects volumetric displacement efficiency.
The relative density of the displaced and displacing fluids is used to determine the tendency
to gravity override or under ride. Besides that, density is also a function of micro emulsion
composition (Green et al. [1998]).
2.1.8 Reservoir’s Salinity Effect
Saline reservoir with salinity higher than 30,000 ppm is not favorable for polymer
flooding. Polymer flooding needs a special cure with fresh water for the polymer before and
after injection to avoid direct contact with the formation saline water. Decreasing in salinity
resulted in improved oil recovery at low polymer concentrations, but it had little effect at
higher polymer concentrations (Szabo [1975] and Shehata et al. [2012]).

28
2.1.9 Pre-flush and Post Flush
Pre-flush and post flush fresh water slugs, have been performed as a part of a
successful model for polymer flooding methods (Needham et al. [1987]). The purpose of
injecting these pre and post flushes is to avoid direct contact between polymer and formation
saline water. Steady water and oil distribution and decreasing the salinity of the formation
water is considered the advantages of pre-flush injection (Wang et al. [1993]).
Some pre-flush disadvantages, which can negatively affect on polymer flooding
efficiency; can be summarized as follows (Vafaei [2012]):
• Fingering phenomena might occur due to low viscosity of fresh water;
• Long injection time is required for pre-flush to prevent fingering; which can be
………….costly; and
• High water saturation areas in the reservoir will be left after pre-flush.
There are two different ideas about how to operate the pre-flush in order to increase
efficiency in polymer flooding method:
1. The effects of polymer flooding will increase by increasing the size of pre-flush
…………..water slug (Demin et al. [1998]).
2. Small slug size of dilute polymer solution with a low degree of hydrolysis due to
………….its less sensitive to salinity, will improve the polymer flooding performance
………….(Vafaei [2012]).
There is the possibility of breakthrough in polymer flooding by post flush water
flooding; thus, a sufficient amount of polymer injected as a mobility control is needed.

29
2.1.10 Polymer Flow Behavior in Porous Media
2.1.10.1 Permeability
Reservoir heterogeneity is described by the Dykstra-Parson coefficient of
permeability variation, Vk, which measures reservoir uniformity by the dispersion of
permeability values. Dykstra-Parson coefficient lower limit is for homogeneous reservoirs
(Vk = 0) and upper limit is defined for extremely heterogeneous reservoir (Vk = 1)
(rubencharles website).
Amplitude of the incremental oil recovery is large when the Vk value ranges from
0.5 to 0.9. In polymer flooding process, after pre-flush water flooding was performed, the
contrast became even higher; however, permeability reduction occurred by polymer
injection while flooding the polymer molecules fill the rock pores in high permeable zones
in the reservoir. The following advantages can be considered for this preferential
permeability reduction, which can be a very long-lasting phenomenon (Needham et al.
[1987], Wang et al. [1993], and Shehata et al. [2012]):
• Giving the chance to lower permeable streaks to be flooded;
• Lowers flow velocity; and
• Increases the sweep area and incremental oil recovery.
During polymer flooding method, if the same amount of polymer injects into
reservoirs with different Dykstra-Parson coefficients values, smaller Vk reservoirs (strong
heterogeneity) will respond late, produce polymer late, and produce with less polymer
concentration. Amplitude of the incremental oil recovery will also change for these
reservoirs. Changing in amplitudes of the incremental oil recovery will be occurred just near
the optimum value for polymer flooding (Demin et al. [1996], and Xue et al. [1999]).

30
Applying polymer solutions can improve the sweep efficiency in heterogeneous
systems, but polymer flooding is economically and technically feasible in the relative
homogeneous thick reservoir; and shows better technical results such as remarkable water
dropping and oil increasing (Szabo [1975] and Xue et al. [1999]). In the heterogeneous
reservoirs, the effect of flow-profile performance is more significant than the role of
mobility control; but polymer slug with high concentration can be used for better
displacement result (Demin et al. [1998] and Kazempour et al. [2011]).
Polymer flooding features such as slug size, slug concentration, permeability
reduction, polymer retention, and mobility control, in medium and low permeable formation
are different from those of high permeable formation (Xue et al. [1999]). Small amounts of
polymer, small polymer concentration, smaller slug size, and high polymer retention are
polymer flooding features for the effective mobility control and oil recovery improvements,
in low permeability sands (Szabo [1975]).
2.1.10.2 Residual Oil Saturation Effect
Some of the disadvantages of the water flooding method are suffering from low
displacement efficiency and a significant amount of residual oil saturation in the water
contacted region due to interfacial tension between the oil and the injected water, and low
volumetric sweep between the oil and injected water due to viscous fingering (Paul et al.
[1982]).

31
Figure 2-3: Displacement of residual oil in dead end pores by water flooding and polymer flooding.
Figure 2-4: Residual oil after water flooding and polymer flooding (China national petroleum corporation). Picture edited by Author for quality purposes.
Mobile oil saturation present at the initiation of the polymer flood is a key variable.
When the connate water saturation is equal or close to irreducible water saturation in the
sand pack before polymer flooding, the residual oil saturation decreases after presenting
polymer at displacing front. Polymer flooding does not reduce the residual oil saturation; it
is a method to reach the residual oil saturation more quickly and economically, by reducing
water production (Szabo [1975], Needham [1987], and Paul et al. [1982]).

32
High oil saturations at the starts of polymer injection would be preferable compared
to low oil saturations. Starting oil saturation and residual oil saturations are the most
significant variables impacting recovery, whereas these combined with heterogeneity has the
most influence on chemical breakthrough time (Rai et al. [2009]).
Chemical flood performance is most sensitive to (Sorbie [1991]):
• Mobile oil saturation at start of chemical flood,
• Residual oil saturation to water flood,
• Mobility ratios,
• Reservoir heterogeneity,
• Nature of stratification, and
• Permeability anisotropy.
A secondary polymer flood would be much more efficient than a tertiary flood due to
a high starting oil saturation and low water saturation. Likewise, a completely watered out
reservoir would most likely result in marginal or negative economics for chemical flooding
(Paul et al. [1982]).
2.1.10.3 Cross Linking Effect
Cross linking causes the polymer to be linked into a network which results in greater
reductions in water permeability. Cross linking has enhanced the oil recovery in polymer
flooding method, by effecting on permeability reduction. Cross linking can be achieved in a
number of ways (Needham et al. [1987]):
• Use of multivalent cations,

33
• Use of organic compounds, and
• Adding aluminum citrate to polymer slug.
If one of the above methods is used to achieve cross linking in polymer flooding
secondary oil recovery, the results compared with the use of polymer solutions alone will be
(Needham et al. [1987]):
• 1.5 times higher recovery factor per pound of polymer used,
• Higher residual resistance factors, and
• Longer-lasting residual resistance factors.
If no cross flow existed, the tight zones would see only a decreased polymer
concentration at the front, far from the injection face (Szabo [1975]).
2.1.10.4 Polymer Adsorption
Polymer adsorption is defined as the physical adsorption of the polymer molecules to
the solid rock surface by using the Van der Waal’s and hydrogen bonding (Ma [2005]). If
lower amounts of polymer absorb to the reservoir’s rock surface, the polymer flooding EOR
method will be more efficient. However, higher polymer adsorption causes effective
permeability reduction and further reducing in the injected fluid mobility. Adsorption of
polymer is affected by type of polymer, molecular weight of the polymer, degree of
hydrolysis in polyacrylamides, polymer concentration, reservoir salinity and hardness, rock
permeability, mineral composition of the rock, and reservoir temperature (Vafaei [2012]).

34
Polymer adsorption can be harmful to polymer flooding process; and reduces its
recovery factor. The effects of adsorbed polymer in the polymer flooding process can be
classified as follows (Vafaei [2012]):
• Polymer solution gradually loses its viscosity,
• Water wettability will be increased,
• Irreducible water saturation will be increased,
• Water relative permeability will be decreased,
• Radius of pore throats of the rock will be decreased,
• Capillary pressure will be increased, and
• Little effect on interfacial tension between phases.
2.1.10.5 Polymer Retention
The phenomena that removes polymer from the transported aqueous phase are
referred to collectively as retention. The retention of a polymer will lead to the formation of
a bank of injection fluid wholly or partially stripped of polymer. This bank will have a lower
viscosity than the injected polymer solution, and this will lead to a reduction in the
efficiency of the polymer flood. Polymer retention can be estimated only by laboratory
measurements using core samples and the polymer solution to be used in the field (Vafaei
[2012]).
Retention of polymer in a reservoir includes following mechanisms (Maheshwari
[2011]):

35
• Adsorption (principal mechanism and irreversible): interaction between polymer
………… molecules and the solid surface;
• Mechanical trapping (substantial under some circumstances): occurs when larger
………….polymer molecules become lodged in narrow flow channels; and
• Hydrodynamic retention.
The level of polymer retained in a reservoir rock depends on permeability, nature of
the reservoir’s rock, polymer type, polymer molecular weight, polymer concentration,
reservoir’s brine salinity, and rock surface (Sheng [2011] and Lake [1989]).
2.1.10.6 Resistance Factor and Residual Resistance Factor
“Resistance factor” and “Residual resistance factor” are terms frequently used as
measures of the effectiveness of polymer solution compared with that of water. After
polymer injection, because polymer increases the viscosity of the displacing phase and
adsorbs onto the reservoir rock it contacts, a high flow resistance to any subsequent fluid
flow through that rock is created. Resistance factor is the ratio of the mobility of water to the
mobility of a polymer solution. Residual resistance factor is the ratio of the mobility of
water measured before the injection of the polymer solution to the mobility of water after
polymer injection. The benefits of fluid diversion are achieved by high, long-lasting residual
resistance factors (Needham et al. [1987] and Wang et al. [1993]).

36
2.1.10.7 Inaccessible Pore Volume
When size of polymer molecules is larger than some pores in a porous medium, the
polymer molecules cannot flow through those pores. The volume of those pores that cannot
be accessed by polymer molecules is called inaccessible pore volume (IPV). The
inaccessible pore volume is a function of polymer molecular weight, medium permeability,
porosity, salinity, and pore size distribution (Maheshwari [2011] and Lake [1989]).
IPV is a portion of the total pore space is un-invaded or inaccessible to polymer,
which can be 30% of the total pore volume in extreme cases; has the following effects on
polymer flooding process (Vafaei [2012]).
• Accelerated polymer flow through the porous media (in the absence of
………….adsorption/retention or when the porous medium polymer adsorption level is fully
………….satisfied);
• Polymer will be filtrated by small pores through the inaccessible pore volume;
and
• Make propagation speed of polymer faster.
2.1.10.8 Polymer Rheology (Shear Thinning)
The rheological behavior of fluids can be classified as Newtonian and Non-
Newtonian. In Newtonian fluid the flow rate varies linearly with the pressure gradient, thus
viscosity is independent of flow rate. Polymers are Non-Newtonian fluids. Rheological
behavior can be expressed in the terms of “apparent viscosity” which can be defined as:
η = !! (2.4)

37
Where τ = Shear stress (lb/ft2) and γ = Shear rate (S-1).
Under the influence of shear, they align themselves with the direction of flow. Such
alignment reduces intermolecular interaction and decreases the apparent viscosity. The
degree of alignment increases with increasing shear. In lower Newtonian regions, the shear
is too small to cause any alignment. Hence, there is no reduction in the apparent viscosity. In
the upper Newtonian region, the alignment has already reached its limit and no further
viscosity reduction can take place by improving the alignment. Polymer molecules are like
fibres or are rod-like in structure. In general, dilute solutions of EOR polymers are
pseudoplastic. Materials that exhibit shear thinning effect are called pseudoplastic (shear-
thinning) (Figure 2-2) (Green et al. [1998], Maheshwari [2011], and Vafaei [2012]).
2.1.10.9 Polymer Properties Degradation
An important aspect for polymers used in oil recovery operations is the degradation
of their properties over time. It is not required that the polymer is stable indefinitely, but it
must last long enough to be effective on the time scale of the oil recovery project. Polymer
degradation refers to any process that will break down the molecular structure of the
macromolecule. The main property of interest in this aspect is generally the polymer
solution viscosity (Maheshwari [2011]).
Polymer degradation processes are classified as follows (Vafaei [2012]):

38
Chemical Degradation
Chemical degradation refers to the breakdown of the polymer molecules, either
through short-term attack by contaminants, such as oxygen, or through longer-term attacks
on the molecular backbone by processes such as hydrolysis.
Thermal Degradation
For a polymer solution there will be some temperature above which the polymer will
thermally crack. For most EOR polymers, this temperature is fairly high, on the order of
260ºF. Since the original temperature of oil reservoir is almost always below this limit, we
should mainly consider the temperature at which other degradation reactions occur. The
average residence time in a reservoir is typically very long, on the order of a few years, so
even slow reactions are potentially serious. Reaction rates also depend strongly on other
variables such as pH or hardness.
Oxidation
Oxidation or free radical chemical reactions are usually considered the most serious
source of degradation. Oxygen scavengers and antioxidants are often added to prevent these
reactions from degrading the polymer.
Biological Degradation
Biological degradation refers to microbial breakdown of macromolecules by bacteria
during storage or in the reservoir. This is only important at lower temperatures or in the
absence of effective biocides. Pressure, temperature, salinity, the type of bacteria in the

39
brine, and the other chemicals present affecting biological degradation. The answer to this
problem is to use a biocide like formaldehyde.
Mechanical Degradation
Mechanical degradation describes the breakdown of a molecule due to high shear
experienced in the high flow rate region close to a well. It is only important in the reservoir
near the well bore. Mechanical degradation is potentially present under all applications. It
occurs when polymer solutions are exposed to high velocity flows, which can be present in
surface equipment (valves, orifices, pumps, or tubing).
The shear-damaged polymer will exhibit a lower average molecular mass than the
original polymer; however, it can still have satisfactory properties for a polymer flood. The
main factor affecting the mechanical stability of macromolecules is the molecular type.
Flexible coil molecules (like HPAM) are very sensitive to shear degradation, while a
polymer with a more rigid molecular backbone (like xanthan) is extremely shear stable
(Sorbie [1991]).
2.1.11 Advantages of Polymer Flooding
Applying polymer flooding enhanced oil recovery method has the following
benefits:
• Increased recovery and sweep efficiency;
• Reduce the residual oil saturation through an improvement in microscopic sweep
………….efficiency (Szabo [1975]);
• Improved areal sweep efficiency through improved mobility ratio;

40
• Increases the displacement result in poor reservoirs with low water cut (Wang et
………….al. [1993]);
• Less water used in Polymer flooding compared to conventional water flooding
………….technology (albertatechfutures website);
• Can be used in thin heavy oil formations with low viscosity where SAGD and
………….VAPEX.are not suitable (albertatechfutures website);
• After polymer flooding, fluid breakthrough occurs more uniformly (Wang et al.
………….[1993]);
• Polymer flooding system has a better compatibility with reservoirs (Xue et al.
……… …[1999]);
• Polymer flooding has been successfully used in onshore oilfields (Luo et al.
………….[2011]);
• Period of polymer flooding is shorter than that of water flooding at the same
………….injection rate through improved fractional flow characteristic (Wang et al.
………….[1993]);
• Polymer flooding can increase the displacement efficiency both in water wet
………….models and oil wet models (Wang et al. [1993]);
• Polymer flooding can get good results in medium and low permeable formations
………….with multi-sedimentary units, complex sand body geometry and poorer inter-well
………….communication (Demin et al. [1996]); and
• In comparison to the other chemical flooding processes such as caustic emulsion
………….floods or surfactant/polymer processes, straight polymer injection is a relatively
………….uncomplicated process (Wassmuth et al. [2007]).

41
2.1.12 Economical Point of View
When screening EOR technologies for possible field application, the basic screening
criteria are usually based on economic considerations. It is almost certain that a polymer
flood will dramatically improve the oil recovery performance, but it remains to be
determined whether or not this can be done in a cost effective manner. Even when dilute
(500 to 1500 ppm) solutions of polymers are used, the cost of polymers becomes substantial.
The viability of the process depends primarily on the amount of polymer required per
incremental barrel of oil produced (Wassmuth et al. [2007]).
The cost of well drilling and basic facility construction is a onetime investment. Cost
of polymer flooding increases with the increase of the amount of polymer injected. Income
from accumulative incremental oil production also increases of the amount of polymer
injected (Demin et al. [1998]).
Polymer injection initiated at an early stage of water flooding is more efficient than
when initiated at an advanced stage (Szabo [1975]). Water flooding, after primary heavy oil
recovery, generates an initial high water cut at breakthrough, which decreases when the
heavy oil is mobilized after the reservoir is repressurized and a substantial pressure gradient
is established between injector and producer (Wassmuth et al. [2007]).
The combination of horizontal wells and polymer technology provides sufficient
injectivity to inject the viscous polymer solution and to displace the heavy oil at economic
rates. The separation between the horizontal wells is one of the few variables that can be
adjusted to dictate the duration of the polymer flood. On a smaller well separation the
polymer flood maintains a large pressure gradient between injector and producer, generating
higher oil production rates, and decreasing the duration of the polymer flood. The converse

42
is true for larger horizontal well separations to the point where the polymer flood can
underperform in comparison to a water flood. When considering a polymer flood application
on a heavy oil field, the horizontal well separation is one of the key economic parameters
that need to be considered as it impacts the time value of money (Wassmuth et al. [2007]).
2.2 Alkaline-Surfactant-Polymer (ASP) Flooding
2.2.1 Definition
ASP flooding has been recognized to be one of the major EOR techniques that can
be successfully used in producing light and medium oils left in the reservoirs after primary
and secondary recovery in order to extend reservoir pool life and extract incremental
reserves currently inaccessible by conventional techniques such as water flooding (Majidaie
et al. [2010], hydrocarbonrecovery website , and proven-reserves website).
In alkaline flood process, the surfactants are generated in-situ by chemical reaction
between the alkali of the aqueous phase and the organic acids of the oil phase. However, for
a low acidic oil reservoir, the amount of surfactants generated in-situ is insufficient to
produce ultra-low interfacial tension. Nelson et al. (1984) presented the concept of using a
chemical surfactant to augment the in-situ surfactant. He found that a properly chosen co-
surfactant increases the electrolyte concentration so that a minimum IFT may be achieved.
Thus, a co-surfactant can be used to obtain the conditions of “optimum salinity” of an
alkaline flood. Schuler et al. (1986) reported the initial laboratory studies demonstrating the
benefit of combining alkaline, surfactants and polymers (Ma [2005]).
ASP is a new modification to the alkaline process which is the addition of surfactant
and polymer to the alkali. ASP has been shown to be an effective, less costly form of
43
Micellar-polymer flooding (netl website). ASP floods have been successfully conducted
worldwide in recent years, commonly achieving 20% incremental oil recovery, due to
increasing the viscosity of injected fluid, decreasing the oil/water mobility ratio, and
enlarging sweeping volume in reservoirs (China national petroleum corporation and proven-
reserves website). ASP flooding is a potentially viable technique for recovering oil at the
conclusion of water flooding (Mai et al. [2009]).
Water flooding usually results in a very low secondary heavy oil recovery factor and
a high producer water-oil ratio (WOR). This is due to early water breakthrough caused by an
extremely high mobility ratio and a high interfacial tension between the injected water and
heavy oil. After the point of water breakthrough in water flooding, water channels of low
flow resistance were continuous along the reservoir, and the oil production is very
inefficient for high rate water flood. In ASP flooding, which is a tertiary recovery method;
the surfactant agents act to free oil trapped in the pore spaces of the reservoir and the
polymer increases the area of the reservoir sweep. Water flooding resumes after chemical
injection to produce oils released by the injected chemicals (Mai et al. [2009] and
huskyenergy website).
Application of these methods is usually limited by the cost of the chemicals and their
adsorption and loss onto the rock of the oil containing formation (hydrocarbonrecovery
website). The success of ASP flooding method depends on the identification of the proper
alkali, identification of the proper surfactant, identification of the proper polymer, and the
way they are combined to produce compatible formulation that yields good crude oil
emulsion/ mobilization, low chemical losses and good mobility control (Al-Hashim et al.
[2004]).

44
2.2.2 ASP Flooding in Canada
Western Canada has tremendous heavy oil deposits, which are located in east-central
Alberta and extended into western Saskatchewan. Efficient and economical recovery of such
heavy oil deposits has gained considerable attention due to an increase in demand for
hydrocarbon fuels and decline in production from the conventional light and medium oil
resources. The primary oil recovery factor for heavy oil reservoirs is typically as low as 6-
8% of the OOIP, which is mainly attributed to the extremely high oil viscosities and almost
immobile conditions of the heavy oils under the actual reservoir conditions.
There have been limited investigations into alkali and ASP flooding in heavy oil
reservoirs with varying degrees of success. Most of these works have focused specifically on
oil-water IFT reduction as the mechanisms for improved oil recovery. Canada is the world
leader in developing EOR techniques for heavy oil production. Huang and Ding (2002)
conducted an initial study to assess the suitability of ASP flooding for Southwest
Saskatchewan medium oil reservoirs (Ma [2005]). Husky Energy Inc., in Calgary, Alberta,
successfully implemented ASP flood technology in Canada to extend the production life of
the Taber South Mannville B Pool, in the Warner field, in 2006. The successful
implementation of the ASP technique means that a significant number of reservoirs in
Alberta may benefit from the knowledge gained from this technology. A similar project at
the Crowsnest field near Taber is currently in detailed design phase (huskyenergy website ).

45
2.2.3 ASP Mechanism
In the ASP process, a very low concentration of the surfactant is used to achieve
ultra low interfacial tension between the trapped oil and formation water. The ultra low
interfacial tension also allows the alkali present in the injection fluid to penetrate deeply into
the formation and contact the trapped oil globules. Also, addition of a surfactant lowers the
interfacial tension between water and oil, which helps to reduce capillary pressure in the
reservoir. This allows residual oil to be mobilized and produced from the formation. The
alkali then reacts with the acidic components in the crude oil to form additional surfactant
in-situ, thus, continuously providing ultra low interfacial tension and freeing the trapped oil;
and also it can reduce adsorption of surfactants and react with acids in the oil to form soaps.
In this process, polymer is used to increase the viscosity of the injection fluid, to minimize
channeling, and provide mobility control. The combination of the three chemicals is
synergistic; together they are more effective than as individual components (Kazempour et
al. [2011], hydrocarbonrecovery website, oil-chem website , and huskyenergy website).
Displacement mechanisms in ASP method may be summarized as follows (Sheng
[2011]):
• Increase capillary number effect to reduce residual oil saturation because of low
………….to ultralow IFT;
• Surfactant adsorption is reduce on both sandstones and carbonates at high pH;
• High pH also improves micro emulsion phase behavior;
• Improved macroscopic sweep efficiency because of the viscous polymer drive;
• Improved microscopic sweep efficiency and displacement efficiency as a result of
………….polymer viscoelastic property; and
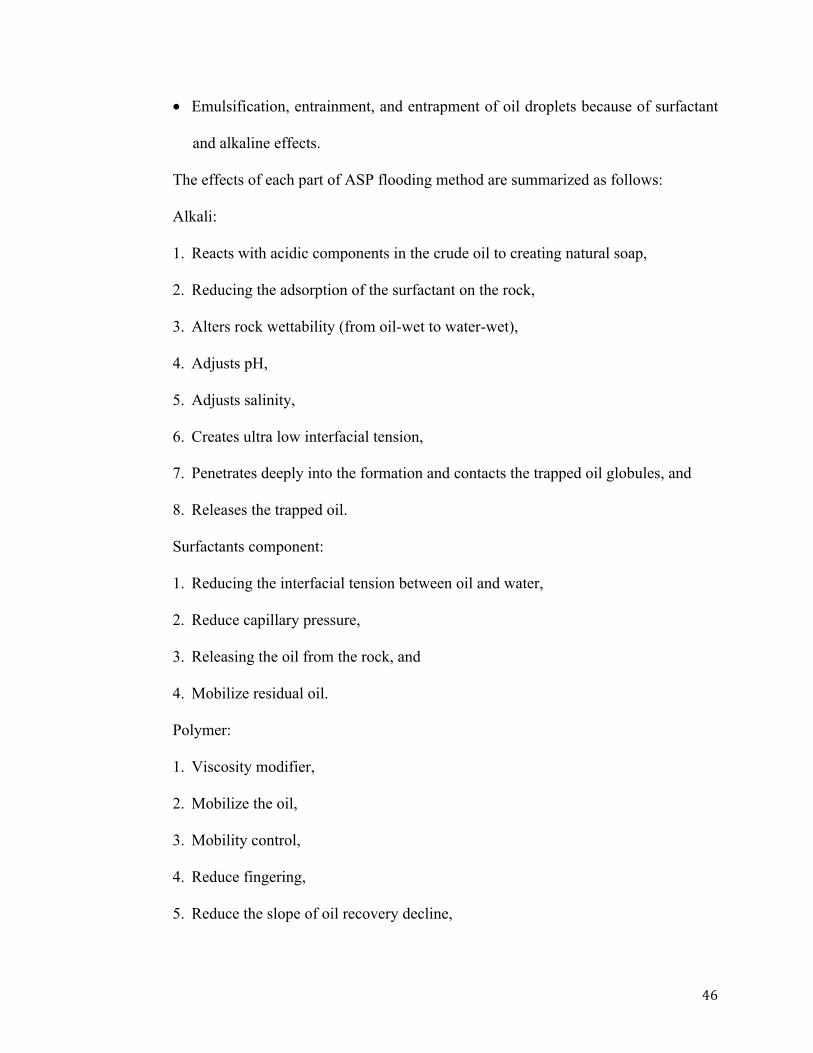
46
• Emulsification, entrainment, and entrapment of oil droplets because of surfactant
………….and alkaline effects.
The effects of each part of ASP flooding method are summarized as follows:
Alkali:
1. Reacts with acidic components in the crude oil to creating natural soap,
2. Reducing the adsorption of the surfactant on the rock,
3. Alters rock wettability (from oil-wet to water-wet),
4. Adjusts pH,
5. Adjusts salinity,
6. Creates ultra low interfacial tension,
7. Penetrates deeply into the formation and contacts the trapped oil globules, and
8. Releases the trapped oil.
Surfactants component:
1. Reducing the interfacial tension between oil and water,
2. Reduce capillary pressure,
3. Releasing the oil from the rock, and
4. Mobilize residual oil.
Polymer:
1. Viscosity modifier,
2. Mobilize the oil,
3. Mobility control,
4. Reduce fingering,
5. Reduce the slope of oil recovery decline,
47
6. Extend the production for a longer period of time,
7. Push solution, and
8. More uniform movement or sweep.
Driving fluid (water):
1. Move the chemicals and resulting oil bank towards production wells,
2. Increase the viscosity of the injection fluid,
3. Minimize channeling, and
4. Provide mobility control.
2.2.4 Design
The design and formulation for ASP flooding are different for each field and
depends on crude oil characteristics, brine characteristics, bottom hole temperature, alkali,
surfactant, and polymer type, well history, and treatment design (oil-chem website).
Typically, the ASP formulation consists of about 0.5-1% alkali, 1% surfactant, and
0.1% polymer (tiorco website ). Ultra-low IFT can be formed by ASP system when the
concentration of the alkaline (NaOH) ranges from 0.6-1.2 wt% and the surfactant
concentration ranges from 0.1-0.6 wt% (Demin et al. [1999]). Gharbi (2001) looked at ASP
deign and found optimal polymer concentration to be around 2800 ppm, which is relatively
high (Alsofi et al. [2011]).
An ASP flood involves injecting a predetermined pore volume of ASP into the
reservoir. Often the ASP injection is followed by an additional injection of polymer. Upon
completion of the ASP and polymer injection, regular water flooding behind the ASP wall

48
resumes again. The combination of the three chemicals is synergistic. Together they are
more effective than as components alone (proven-reserves website).
Generally, the reservoir is conditioned by a pre-flush (with water, alkali or polymer
depending on rock mineralogy) before the injection of ASP slug into reservoir (tiorco
website).
2.2.5 Screening Criteria
Screening criteria have been proposed for all EOR methods. Data from EOR projects
around the world has been examined and the optimum reservoir/oil characteristics for
successful projects have been noted. Screening criteria for polymer and ASP flooding and
other chemical methods have shown in table below (Taber et al [1997]).
Table 2-1: Summary of oil properties screening criteria for chemical EOR methods (Taber et al. [1997]).
Oil properties
EOR methods API Viscosity (cp) Component
Micellar/ Polymer, ASP, and
Alkaline flooding 20-35 13-35
Light, intermediate, some
organic acids for alkaline
floods
Polymer flooding >15 10-150 NC

49
Table 2-2: Summary of Reservoir Characteristic screening criteria for chemical EOR methods (Taber et al. [1997]).
Reservoir Characteristic
EOR methods So (%) Formation type
Net Thickness
Average Permeability (md)
T (F)
Micellar/ Polymer, ASP, and Alkaline flooding
35-53 Sandstone preferred NC 3250-9000 80-200
Polymer flooding 50-80 Sandstone preferred NC <9000 140-200
2.2.6 Advantages of ASP Flooding
The use of alkali adds many benefits to an ASP flood. The alkali reacts with
elements of the oil to form in-situ surfactants. Additionally, it helps make the reservoir rock
more water wet, thus increasing the flood effectiveness. As alkali is inexpensive, this helps
to reduce the cost of an ASP flood. The polymer increases the vertical and areal sweep
efficiencies of the flood by increasing water viscosity. The increased viscosity decreases the
chance of fingering and allows more oil to be contacted on a macroscopic scale (proven-
reserves website).

50
Figure 2-5: Residual oil saturation comparison in water, polymer, and ASP flooding (China national petroleum corporation). Picture edited by Author for quality purposes.
Some advantages of ASP method can be summarized as follows:
• Less surfactant required recovering significantly incremental oil (tiorco website);
• Applicable for more viscous oils;
• Presently has the highest application potential, since they are low risk methods
………….with a well developed application technology (hydrocarbonrecovery website);
• Surfactant/polymer flooding is an immature method from an application point of
………….view. It will need substantial research and development to become a technique of
………….any importance compared to ASP (hydrocarbonrecovery website);
• The potential and feasibility of ASP flooding continues to grow and offers much
………….potential for increased oil recovery (hydrocarbonrecovery website); and
• Achievement of 20% incremental oil recovery.

51
2.3 Objectives The objective of this research is to first, investigate the key aspects influencing
polymer flooding for the purpose of enhancing heavy oil recovery of Canadian reservoirs.
These aspects are polymer solution concentration, viscosity, elasticity, and polymer type to
establish which polymer types and concentration ranges best represent the potential polymer
regimes in heavy oil porous media.
Polymers increase the viscosity of the water phase and therefore reduce the mobility
of injected solution. They are expected to significantly reduce the produced fluid water cut
through production of a mobile oil bank due to improving sweep efficiency and reducing the
effect of fingering phenomenon because of polymer adsorption.
Extensive review on polymer-chemical flooding literature indicated that most of the
researches investigated the mobility aspect of polymer flooding enhanced oil recovery. This
study further investigated polymer and ASP flooding from the application time aspect by
implementing them as a secondary and tertiary recovery method. This objective
accomplished through laboratory-based evaluation utilizing 1D physical model of
unconsolidated heavy oil sand reservoirs.
The other objective of this thesis is to determine the relative importance of interfacial
tension in the displacement of heavy oil. This goal will be accomplished through phase
behavior analysis and 1D core ASP floods using different combination of alkaline,
surfactant, and polymer. Alkali reacts with naturally occurring acids in the oil, leading to the
generation of in situ soaps at the oil-water interface. These soaps and surfactants (surface-
active agents) lead to significant reductions in the oil-water interfacial tension, allow viscous
forces associated with the flow of an injected drive fluid to overcome the capillary forces
and consequently, the residual oil left from a normal water flood can be mobilized.
52
CHAPTER 3: EXPERIMENTAL SETUP AND
PROCEDURES
This chapter describes the basic physical and chemical properties of fluids used in
this study, as well as the preparation of various chemical solutions. The equipment and
detailed procedures applied for 1D linear core flooding with Polymer and ASP are also
described.
All the core floods are carried out in a Swagelok® steel sand pack holder. The same
type of porous medium and heavy oil are utilized for all the experiments in order to
quantitatively validate the efficiency of various polymers and ASP flooding.
3.1 Material
3.1.1 Brine
In all experiments 1 wt % NaCl (SX0420-3 from EMD Chemicals Inc.) in deionized
water solution is used as the aqueous phase. The solution obtained is then stirred for at least
one hour to assure the powder dissolves in de-ionized water. This brine solution is sat for 24
hours to make sure all the air bubbles came out of the solution.
3.1.2 Polymer
Acrylamide polymers have emerged as the most widely used synthetic polymer
family for application in polymer flooding, because of cost, availability issues, favorable
chemical robustness, and biological stability (Sohn et al. [1990]).
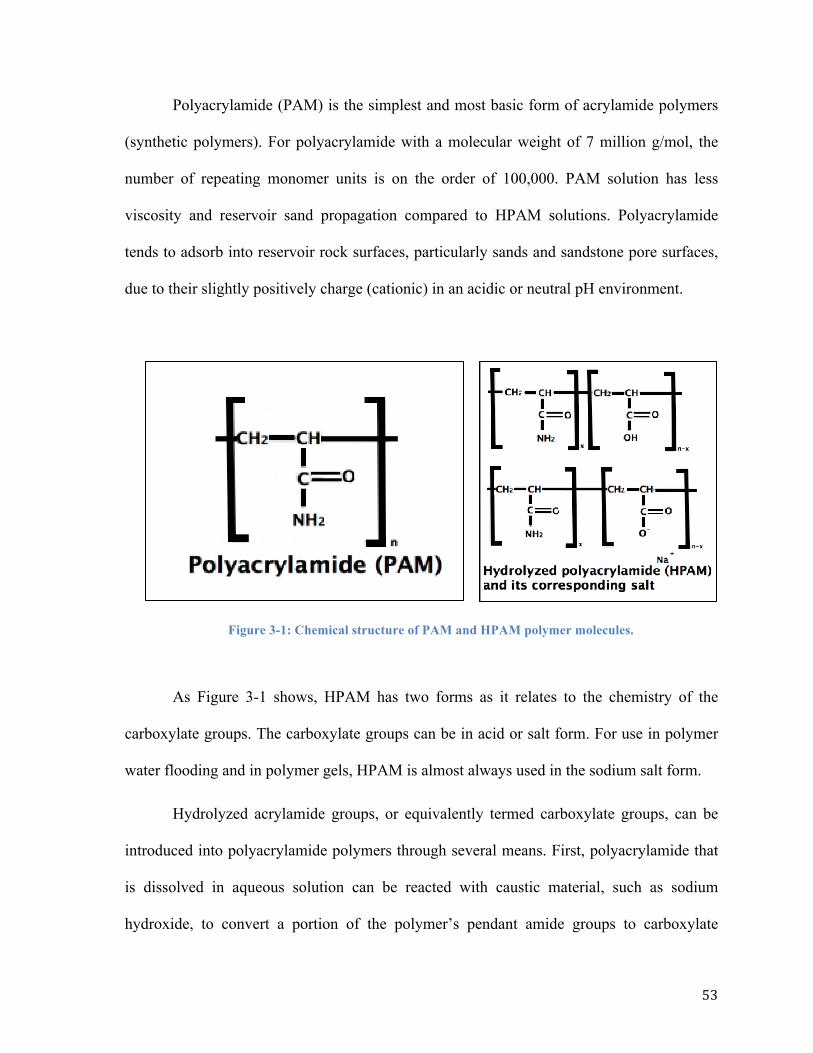
53
Polyacrylamide (PAM) is the simplest and most basic form of acrylamide polymers
(synthetic polymers). For polyacrylamide with a molecular weight of 7 million g/mol, the
number of repeating monomer units is on the order of 100,000. PAM solution has less
viscosity and reservoir sand propagation compared to HPAM solutions. Polyacrylamide
tends to adsorb into reservoir rock surfaces, particularly sands and sandstone pore surfaces,
due to their slightly positively charge (cationic) in an acidic or neutral pH environment.
Figure 3-1: Chemical structure of PAM and HPAM polymer molecules.
As Figure 3-1 shows, HPAM has two forms as it relates to the chemistry of the
carboxylate groups. The carboxylate groups can be in acid or salt form. For use in polymer
water flooding and in polymer gels, HPAM is almost always used in the sodium salt form.
Hydrolyzed acrylamide groups, or equivalently termed carboxylate groups, can be
introduced into polyacrylamide polymers through several means. First, polyacrylamide that
is dissolved in aqueous solution can be reacted with caustic material, such as sodium
hydroxide, to convert a portion of the polymer’s pendant amide groups to carboxylate

54
groups, also referred to as partially hydrolyzed polyacrylamide. Second, during the
polymerization process, acrylamide monomers can be copolymerized with acrylate
monomers to form HPAM, referred to a copolymer of acrylamide and acrylate (Sohn et al.
[1990]).
Flopaam 3530S and Flocomb C3525 are the polymers used in this study for either
making polymer, ASP, AP, or SP solutions. Polymers were purchased from SNF
FLOERGER®. Table 3-1 presents a list of the polymer fluids and their properties. Both
polymer types are mixed in 1 wt% brine at various desirable concentrations.
Table 3-1: List of used polymers and their properties (SNF FlopaamTM [2004]).
Fluids Type Hydrolysis (mol%)
Approximate molecular weight (g/mol)
Flopaam 3530S
Anionic HPAM 25-30 16.106
Flocomb C3525
Anionic post-HPAM
25-30 20-22.106
Higher viscoelasticity of HPAM solutions, as compared to other polymers, is the
result of the tendency of polyacrylamide groups to react with sodium, potassium hydroxide,
and sodium carbonate (Wang et al. [2006]).
The negative charges of the polymer result in a repulsive force at low salinity or in
fresh water; consequently, causing the polymer chains to more stretch and, in turn, leading
to higher polymer viscosity. If more electrolytes (e.g. NaCl) are added to the polymer
solution, chain stretching can be reduced; therefore, repulsive forces between negative

55
charges are neutralized by a double-layer electrolyte, leading to HPAM flexible chain
compression, resulting in a reduction in polymer solution viscosity (Sohn et al. [1990]).
Hydrolysis leads to transformation of amide groups (CONH2) into carboxyl groups
(COO-), in turn, reducing adsorption on mineral surfaces, increased viscosity, and reduced
chemical stability due to less CONH2. Then, negative charges on the backbones of the
polymer chains are introduced by hydrolysis and impact the rheological properties of the
polymer solutions (Sheng [2011] and Sohn et al. [1990]).
A 30% hydrolysis level within polyacrylamide is near the optimum in terms of
simultaneously promoting maximum viscosity enhancement of the polymer solution and
minimizing polymer adsorption onto reservoir rock surfaces during most polymer water
floods (Sohn et al. [1990]).
3.1.2.1 Procedure of Polymer Solution Preparation
Polymers tend to degrade over time, so fresh polymer solution is used in each
experiment. Polymer solution is obtained by mechanically stirring HPAM polymer powder
in the brine, or by diluting the initial solution into desired concentrations using a magnetic
stirrer. An accurate process of polymer solution preparation is applied before each
experiment. The procedure is not the same for brine or other Newtonian aqueous fluids. The
process follows that generally applied by SNF FLOERGER® (SNF FLOPAAM™ Brochure
[2004]); a complex procedure, as the polymers are shear dependent non-Newtonian fluids.
Shriwal and Lane also described the procedure in 2012. The degassed 1 wt% brine is stirred
using a high shear mechanical stirrer at a speed high enough to create a vortex. The polymer

56
powder is then gently added to the vortex flow, in order to prevent fisheyes forming in the
solution. The solution is stirred until it becomes viscous enough that the vortex shape
changes into a flat surface. Next, the rotation speed is decreased and the solution is left
stirring for another 24 hours. It is crucial to make sure that there are no air bubbles trapped
in the solution. At the next stage the polymer solution is filtered. To avoid any superficial
plugging effects, 5.0 µm microfiltration flat hydrophilic membrane filters (e.g., Whatman®,
Millipore™) and a sintered glass funnel with sand media are used to properly filter the
polymer solution.
3.1.2.2 Polymer Solution Viscosity Measurement
Brookfield LV-DV II+ viscometer is used to measure polymer solution viscosity
during preparation of the polymer solution with desired concentration. The desired
temperature (23 °C) is applied to the tested sample in a sampling cup and kept constant
using a Brookfield Circulating thermo-regulated water bath. A temperature reading is
performed with an RTD temperature sensor.
The Electronic Gap Adjustment™ allows calibration of the viscometer for each
particular type of fluid and its viscosity. Brookfield’s Wingather™ software (Brookfield
catalog [2001]) is used to record continuous and automatic viscosity, shear rate/stress,
spindle speed, % torque data gathering process, and further historical comparisons.
Allowable speed range of different speeds gave us sufficient capacity to measure polymer
viscosity at possible shear rates. The data collected were then exported into Microsoft®
Excel for further analysis of measured samples and determination of desired viscosity ratio.

57
3.1.3 Alkaline
Sodium Carbonate (Na2CO3) used in making AP and ASP solutions. 0.5 weight
percent Na2CO3 is added to the solution to react with acidic components in the crude oil and
create natural soap; thereby creating low interfacial tension to release the trapped oil.
Alkaline also helps reduce the adsorption of the surfactant in ASP flooding.
3.1.4 Surfactant Systems
As presented in Table 3-2, four types of surfactant are investigated in this study. The
table shows the RD and lot number surfactants from BASF Company.
Table 3-2: RD and Lot number for the surfactants used in this study.
Surfactant # RD Lot #
1 174046 7897220
2 174048 U21A29Z035
3 174050 U21D06Z004
4 178133 U20J25Z017
3.1.5 Oil
Golden-colored Esso Spartan 680 Industrial Gear oil is used in this study. Viscosity
is measured 960 cp at 23 °C and oil density is measured 57.93 lb/ft3 (928 kg/m3).

58
3.2 1D Two-phase Core Flood Experimental Procedure
1D core floods are conducted using the 70 mesh fraction of glass beads and 960 cp
heavy oil to represents real reservoir properties. The work simulates a homogeneous
unconsolidated sand reservoir with an average permeability of 8 to 10 Darcy. A schematic
diagram of the experimental setup and a photo of working space are presented in Figure 3-2
and Figure 3-3, respectively.
1. Syringe pump 5. Transfer cylinder 9. Test tube
2. Two-way valve 6. Pressure transducer 10. Thermometer
3. Three-way valve 7. Computer 11. Air bath
4. Pressure gauge 8. Core holder
Figure 3-2: Schematic of 1D core flood experiments setup.

59
Figure 3-3: Photo of 1D core flood experiments setup.
The flooding experiments are performed using a modified 1 ft long Swagelok® sand
pack holder (Figure 3-4). High permeable distributors, with a 200-mesh stainless steel
screen, were specially designed and manufactured to fit the inlet and outlet ends of the
holder so the fluid injected through the porous media is uniformly distributed.
The simple design of the sand pack holder allows reliability, flexibility, and
versatility, particularly to deal with the polymer flood tests, as a freshly packed sand pack is
used for each experiment.

60
Figure 3-4: Swagelok® sand pack holder.
In each experiment, fresh sand pack in a holder with a newly-coated inside surface is
used to exclude the effect of adsorbed polymer on the mineral surface from previous runs. In
addition, it reduces the potential for the fluid to follow the channels and paths in the sand
from previous tests. In the case of polymer concentration, three different concentrations of
Flopaam 3530S are studied. Flocomb C3525 is used to determine the effect of polymer type
on improving heavy oil recovery. One AP, one SP, and one ASP flood using Flopaam 3530S
with 2000 ppm concentration, is carried out to investigate the applicability of ASP flooding
compared to polymer, alkaline-polymer, and surfactant-polymer flooding recovery factors.
For each experiment the inside surface of the sand pack holder is coated with sand
using liquid Blue Magic waterproof electrical tape to minimize fines migration issues and
subsequent water channelling along the tube walls.

61
The inside coated sand pack holder is then placed vertically and wet-packed using 70
mesh sand and methanol while a vibrator is placed on the sand pack holder to let the sands
settle uniformly.
The pore volume and porosity are calculated using the mass of sand and brine during
the packing process. Dead volumes in the system need to be taken into account.
The sand pack holder is then placed in a horizontal position connected to the syringe
pump and transfer cylinders. Absolute permeability to 1 wt% brine is determined at different
flow rates using Darcy’s law.
𝑞 = −1.127 !"!∆!!
(3.1)
Where: q = injection flow rate (bbl/day), µ = viscosity of injected fluid (cp), k =
absolute permeability of the porous media (darcy), L = length of the porous media (ft), A =
cross-sectional area of the porous media (ft2), and ΔP = differential pressure across the
porous media (psi).
The slope of the pressure drop vs. flow rate is used to calculate the absolute
permeability.
Oil is injected at 0.5 ml/min and the produced brine is collected at certain times in 15
ml vials until the water cut in produced oil reaches less than 3%. The initial oil saturation
(Soi) is then calculated taking into account the dead volumes.
In five tests out of eight chemical flooding experiments, initial water flood are
conducted for a better comparison of conducting chemical flood as a secondary and tertiary
recovery method. Water flooding recovery for experiments containing initial water flood
begins with injecting brine at 0.1 ml/min for up to 0.8 Pore Volume (PV). Effluents are then

62
centrifuged and the corresponding recovery factors are determined. The brine injection
continues until the differential pressure across the core stabilizes and oil cut in effluent
reaches less than 3%; this stage is eliminated in the last three experiments to conduct
chemical flood as a secondary oil recovery method.
In the next phase, polymer flood injection is started at 0.1 ml/min. The produced
emulsion, containing oil, brine, and polymer solution, is collected in vials to calculate
recovery factor. Note that the dead volumes with system should be taken into account.
Polymer solution injection occurs until differential pressure is established across the core
and oil cut in produced fluid reaches less than 3%. Resistance factor (FR), representing the
ratio of the mobility of water during initial water flooding to the mobility of a polymer
solution during polymer flood and in-situ polymer solution viscosity, are calculated using
the equation (3.2):
𝐹! =!!!!= ∆!!"
∆!!"#≈ 𝜇! (3.2)
Where λ! = Water mobility (darcy/cp), λ! = Polymer mobility (darcy/cp), ∆P!" =
Polymer flooding differential pressure (psi), ∆𝑃!"# = Initial water flood differential pressure
(psi), and 𝜇! = In situ Polymer solution viscosity (cp).
Next, extended water flooding starts after polymer injection, at 0.1 ml/min, to
displace any residual or unabsorbed polymer in the sand pack, to complete the material
balance on the dynamic adsorption measurement, and finally to observe any additional oil
recovery. Brine injection is carried out until the differential pressure established across the
core and oil cut in produced fluid reaches less than 3%. The stabilized pressure drop
indicates the reduction in the permeability due to polymer adsorption, it is also used to

63
calculate residual resistance factor to water (RRFw) the ratio of water mobility before the
polymer injection (IWF) to mobility of water after polymer injection (EWF):
RRF! =!!(!"#)
!!(!"#)= !!(!"#)
!!(!"#)= ∆!!"#
∆!!"# (3.3)
Where λ!(!"#) = Initial water flooding water mobility (darcy/cp), λ!(!"#) =
Extended water flooding water mobility (darcy/cp), k!(!"#) = Initial water flooding water
permeability (darcy), k!(!"#) = Extended water flooding water permeability (darcy), ∆P!"#
= Extended water flooding differential pressure (cp), and∆P!"# = Initial water flood
differential pressure (cp).
Post-polymer oil injection (OFP) is carried out at 0.1 ml/min until the differential
pressure across the core is established and the water cut in produced fluid reaches less than
3%. A residual resistance factor to oil (RRFo), or the ratio of mobility of oil, during initial
core oil saturation (OF) to mobility of post-polymer oil injection (OFP), is then calculated
using the equation (3.4):
𝑅𝑅𝐹! =!!(!")!!(!"#)
= ∆!!"#∆!!"
(3.4)
Where 𝜆!(!") = Initial oil saturation oil mobility (darcy/cp), 𝜆!(!"#) = Post-polymer
oil injection oil mobility (darcy/cp), ∆𝑃!"# = Post-polymer oil injection differential pressure
(psi), and ∆𝑃!" = Initial oil saturation differential pressure (psi).
64
3.3 Differential Pressure Response Measurement
Differential pressure drop is continually monitored and recorded using the Validyne
pressure transducer system. Two pressure transducer diaphragms (5 psi for absolute
permeability measurement and 125 psi for displacement experiments) are used. Before each
test, calibration is conducted to ensure that the pressure transducer diaphragms respond
accurately to changes in pressure. It is also necessary to obtain conversion factors for the
desired units of measure (psi or kPa), since readings are initially delivered as mV/V.
Pressure drop data is analyzed for injection pressure, resistance, and residual resistance
factor information for the polymer flood experiments.
3.4 Phase Behavior Analysis
A phase behavior analysis is conducted to examine the effectiveness of the surfactant
at SP and ASP system to get better heavy oil emulsification and higher oil recovery,
subsequently. Different surfactant types and concentrations are examined to choose the best
type and concentration for making SP and ASP solutions for flooding purposes.
In 12 test tubes, 4 different types of surfactants, with 3 different concentrations of
each are used. First, 5 ml of the aqueous phase is placed in each test vial. Then 1 ml of crude
oil is gently added with a syringe to the top of the aqueous phase to prevent any mechanical
disturbance.
Figures 3-5 to 3-8 show prepared surfactant solutions in different concentrations
from 0.1 to 0.4 wt%, for each surfactant type.

65
Figure 3-5: Prepared surfactant solutions in different concentrations from 0.1 to 0.4 wt% for each surfactant type.
Figure 3-6: Prepared surfactant solutions after adding 1 ml oil, unshaken for 24 hours.

66
After 24 hours, the surfactant solution phase and oil phase do not show any reaction.
Vials were gently turned upside down to mix the phases. In the next phase, the vials were
kept still for 3 hours until the whole solution stabilized. After 30 hours, the surfactant type
and concentration from the vial with the highest emulsions (cloudiest) are chosen for the SP
and ASP experiments.
Figure 3-7: Prepared surfactant solutions 3 hours after shaking.

67
Figure 3-8: Prepared surfactant solutions 30 hours after shaking (aqueous phase becoming more cloudy).

68
CHAPTER 4: EXPERIMENTAL RESULTS
4.1 Rheological Measurements of Polymer Solutions
This section presents rheological parameter (viscosity) measurement of polymer
solutions used in this study. As part of the scope of the current work, it should be noted that
the effect of polymer concentration and type, during immiscible displacement of heavy oil
by polymer solutions, is evaluated.
Polymer solutions are non-Newtonian fluids; therefore, their viscosities alter as shear
rate is applied. A series of curves are developed to describe viscosity-polymer concentration
behaviour of two tested types of polymer, ASP, and AP systems in 1 wt% brine. Solution
viscosities at different torques are determined using Brookfield LV-DV II+ viscometer.
Figure 4-1 presents the viscosity versus torque of 4000 ppm Flopaam 3530S polymer
solution.
Figure 4-1: Viscosity vs. Torque of 0.4 wt% Flopaam 3530 in 1 wt% brine at 23°C.
0
50
100
150
200
250
300
350
400
0 20 40 60 80 100
Viscosity (cp)
Torque (%)
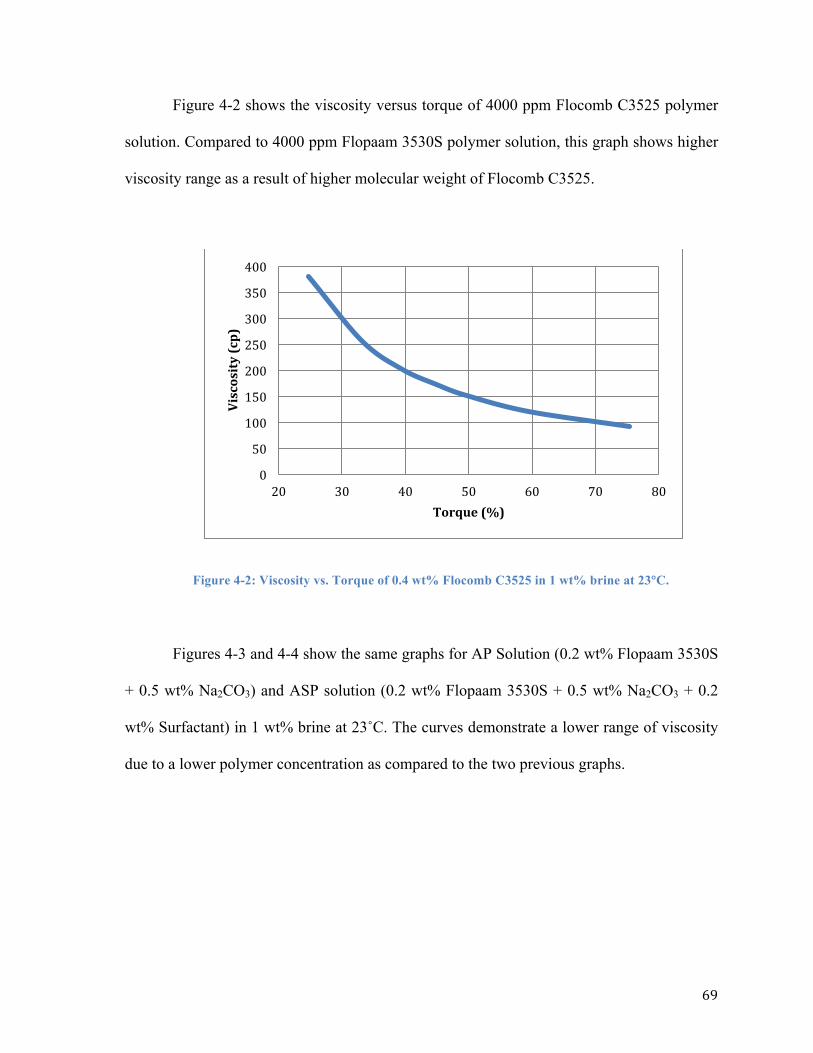
69
Figure 4-2 shows the viscosity versus torque of 4000 ppm Flocomb C3525 polymer
solution. Compared to 4000 ppm Flopaam 3530S polymer solution, this graph shows higher
viscosity range as a result of higher molecular weight of Flocomb C3525.
Figure 4-2: Viscosity vs. Torque of 0.4 wt% Flocomb C3525 in 1 wt% brine at 23°C.
Figures 4-3 and 4-4 show the same graphs for AP Solution (0.2 wt% Flopaam 3530S
+ 0.5 wt% Na2CO3) and ASP solution (0.2 wt% Flopaam 3530S + 0.5 wt% Na2CO3 + 0.2
wt% Surfactant) in 1 wt% brine at 23˚C. The curves demonstrate a lower range of viscosity
due to a lower polymer concentration as compared to the two previous graphs.
0
50
100
150
200
250
300
350
400
20 30 40 50 60 70 80
Viscosity (cp)
Torque (%)

70
Figure 4-3: Viscosity vs. Torque of AP solution (0.2 wt% Flopaam 3530S + 0.5 wt% Na2CO3) in 1 wt% brine at 23°C.
Figure 4-4: Viscosity vs. Torque of ASP solution (0.2 wt% Flopaam 3530S + 0.5 wt% Na2CO3 + 0.2 wt% Surfactant) in 1 wt% brine at 23°C.
0 5 10 15 20 25 30 35 40 45 50
0 10 20 30 40 50 60 70 80 90
Viscosity (cp)
Torque (%)
0
5
10
15
20
25
30
35
40
45
0 20 40 60 80 100
Viscosity (cp)
Torque (%)

71
A comparison between viscosities of injected chemicals is shown in the table 4-1.
Each chemical solution viscosity measured at 70% torque from their related viscosity-torque
graphs. Flocomb C3525 shows higher viscosity than Flopaam 3530S with the same
concentration; however, polymer solutions with 4000 ppm concentration have viscosities at
the same range and about 10 times higher than polymer solutions with 2000 ppm
concentration.
Table 4-1: Viscosities of injected chemicals at 70% Torque.
Injected Solution Viscosity @ 70% Torque (cp)
Flopaam 0.4 wt% 78.39
Flocomb 0.4 wt% 99.11
AP (0.2 wt% Flopaam 3530S + 0.5 wt% Na2CO3)
14.4
ASP (0.2 wt% Flopaam 3530S + 0.5 wt% Na2CO3 + 0.2 wt% Surfactant)
15.27
4.2 1D Two-phase Core Floods Performance
Results from a series of core flood tests are presented in the following sections to
compare the displacement efficiency of different flooding methods for recovering heavy oil.
Water flooding results from the first experiment are presented as a base for comparing
polymer to water flood. Flooding results of two different polymer solutions (Flopaam 3530S
and Flocomb C3525 in 1 wt% NaCl) to produce 960 mPa·s heavy oil is presented to
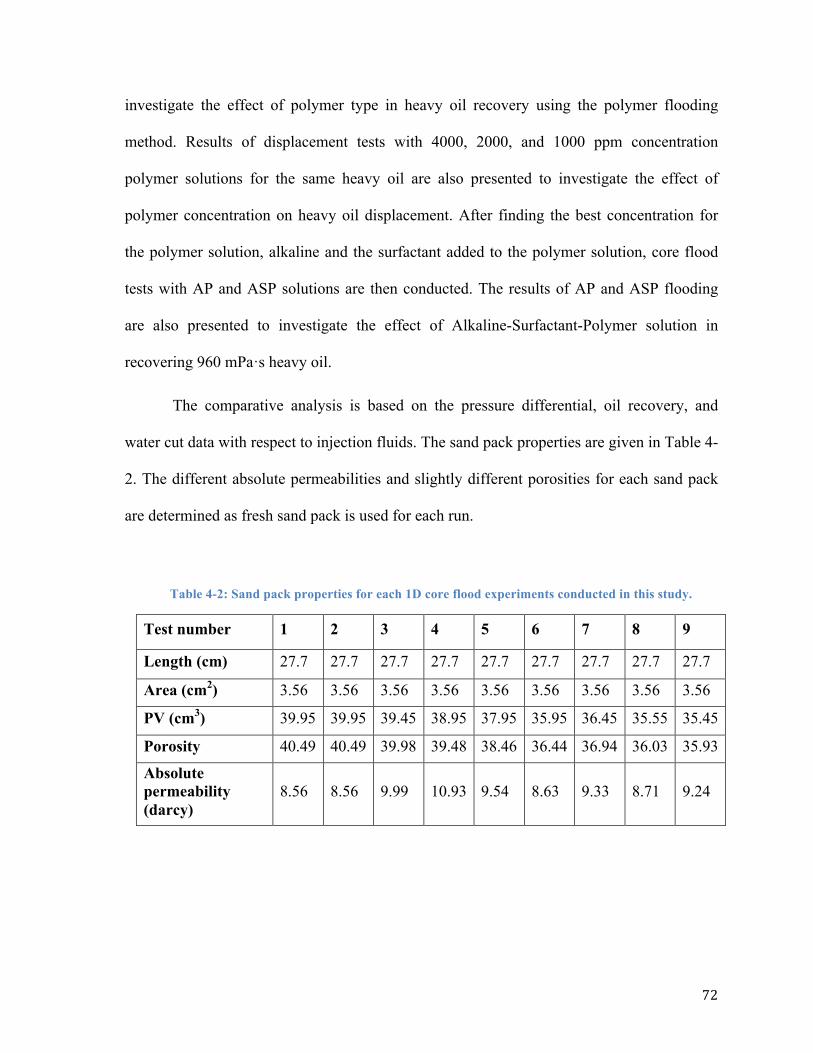
72
investigate the effect of polymer type in heavy oil recovery using the polymer flooding
method. Results of displacement tests with 4000, 2000, and 1000 ppm concentration
polymer solutions for the same heavy oil are also presented to investigate the effect of
polymer concentration on heavy oil displacement. After finding the best concentration for
the polymer solution, alkaline and the surfactant added to the polymer solution, core flood
tests with AP and ASP solutions are then conducted. The results of AP and ASP flooding
are also presented to investigate the effect of Alkaline-Surfactant-Polymer solution in
recovering 960 mPa·s heavy oil.
The comparative analysis is based on the pressure differential, oil recovery, and
water cut data with respect to injection fluids. The sand pack properties are given in Table 4-
2. The different absolute permeabilities and slightly different porosities for each sand pack
are determined as fresh sand pack is used for each run.
Table 4-2: Sand pack properties for each 1D core flood experiments conducted in this study.
Test number 1 2 3 4 5 6 7 8 9
Length (cm) 27.7 27.7 27.7 27.7 27.7 27.7 27.7 27.7 27.7
Area (cm2) 3.56 3.56 3.56 3.56 3.56 3.56 3.56 3.56 3.56
PV (cm3) 39.95 39.95 39.45 38.95 37.95 35.95 36.45 35.55 35.45
Porosity 40.49 40.49 39.98 39.48 38.46 36.44 36.94 36.03 35.93
Absolute permeability (darcy)
8.56 8.56 9.99 10.93 9.54 8.63 9.33 8.71 9.24

73
4.3 Water Flooding (960 mPa·s oil, 1 wt% NaCl brine solution)
The first part primarily observes the result of water flooding. In a heavy oil sand
pack, as water is injected, oil is continuously produced until breakthrough. After this point
very little extra oil is recovered and virtually all the injected water is produced. The recovery
profile for heavy oil water flood is shown in Figure 4-5.
Figure 4-5: Recovery factor vs. Injected fluid for water flooding.
Since heavy oil is considerably more viscous than water, injection of a less viscous
fluid with high mobility to recover heavy oil, with limited mobility, leads to viscous
fingering. The result is early water breakthrough and reduction of the efficiency of the water
flood.
0
2
4
6
8
10
12
14
16
0 0.5 1 1.5 2 2.5 3 3.5 4
RF (%
OOIP)
Injected ;luid (PV)

74
Heavy oil breakthrough occurs early, as evidenced by the rapidly rising water cut at
early stage of the water flooding (figure 4-6). After breakthrough, oil is still being produced
along with high water-cut.
Figure 4-6: Water cut vs. Injected fluid for water flooding.
0
0.2
0.4
0.6
0.8
1
1.2
0 0.5 1 1.5 2 2.5 3 3.5 4
WC (fraction)
Injected ;luid (PV)

75
Pressure builds up upon constant rate water injection at early stage of the
experiment; after breakthrough pressure decreases down to very low values.
Figure 4-7: Pressure difference vs. Injected fluid for water flooding.
0
2
4
6
8
10
12
14
16
0 0.5 1 1.5 2 2.5 3 3.5 4
P (psi)
Injected ;luid (PV)

76
4.4 Effect of Polymer Concentration (960 cp oil, 0.4 wt%, 0.2 wt%, and 0.1 wt% Flopaam 3530S HPAM)
This section discusses the effect of polymer concentration on heavy oil polymer
flooding performance. The experiments are used for Flopaam 3530S at various
concentrations from 0.1 to 0.40 wt%, in 1 wt% NaCl solution. An initial water flood is
conducted to approximately 0.8 PV of injection. Recovery from the initial water flooding
showed comparatively poor efficiency as 13% of OOIP was recovered. After that polymer
flood sequence is started. Incremental oil recovery for 0.4 wt% Flopaam 3530S reached to
more than 40.2% of original oil in place.
Figure 4-8: Recovery factor vs. Injected fluid for 0.4 wt% Flopaam 3530S solution flooding after water flooding.
0
10
20
30
40
50
60
0 0.5 1 1.5 2 2.5 3 3.5 4
RF (%
OOIP)
Injected ;luid (PV)
WF PF (0.4 wt% Flopaam)

77
After injecting polymer solution water cut decreased immediately then raised very
slowly compared to the water flooding stage. Figure 4-9 shows the water cut versus injected
pore volume for water flooding and polymer flooding for one core flood test. The curves
show the water cut reaches from 0 to1 in the water flooding process after 0.28 PV injected;
however, reaching from 0.56 water cut to 1 in polymer flooding process after water flooding
takes 2.77 injected PV.
Figure 4-9: Water cut vs. Injected fluid for 0.4 wt% Flopaam 3530S solution flooding after water flooding.
The differential pressure behaviour is typical for each stage of displacement and is
indicated in all tests presented in this section. The pressure build-up indicates water or
polymer bank pushing through the porous media displacing heavier fluid until reaching
breakthrough. At this point of displacement the pressure decreases until reaching a stabilized
value and the sand pack is in equilibrium with injected fluid.
0
0.2
0.4
0.6
0.8
1
1.2
0 0.5 1 1.5 2 2.5 3 3.5 4
WC (fraction)
Injected ;luid (PV)
WF PF (0.4 wt% Flopaam)

78
Figure 4-10: Pressure vs. Injected fluid for 0.4 wt% Flopaam 3530S solution flooding after water flooding.
Using pressure data from Figure 4-10, residual factor is calculated 11.462 for this
experiment.
In the next experiment, polymer concentration is reduced by half then same
procedure conducted. Figure 4-11 shows the recovery factor, based on the percentage of
original oil in place for the test using 0.2 wt% Flopaam 3530S solution as a driving fluid.
Initially, 0.77 PV water floods the core, then 2.5 PV polymer solution is injected into the
core. The incremental oil recovery for the polymer flooding part is approximately 38% of
the original oil in place.
0
2
4
6
8
10
12
14
16
0 0.5 1 1.5 2 2.5 3 3.5 4
P (psi)
Injected ;luid (PV)
WF PF (0.4 wt% Flopaam)

79
Figure 4-11: Recovery factor vs. Injected fluid for 0.2 wt% Flopaam 3530S solution flooding after water flooding.
At the end of the water flood, oil trapped in the porous medium due to capillary
forces. Once water finds continuous pathways from inlet to outlet, if further injection
continues the result would produce extremely high water cut, as shown in Figure 4-12. After
injecting the polymer solution the water cut decreases to 0.78 and climbs back to 0.97 much
faster than the previous experiment.
0
10
20
30
40
50
60
0 0.5 1 1.5 2 2.5 3 3.5
RF (%
OOIP)
Injected ;luid (PV)
WF PF (0.2 wt% Flopaam)

80
Figure 4-12: Water cut vs. Injected fluid for 0.2 wt% Flopaam 3530S solution flooding after water flooding.
0
0.2
0.4
0.6
0.8
1
1.2
0 0.5 1 1.5 2 2.5 3 3.5
WC (fraction)
Injected ;luid (PV)
WF PF (0.2 wt% Flopaam)

81
Figure 4-13 presents the pressure difference during water flood and polymer flood
with 0.2 wt% Flopaam 3530S. The graph shows the pressure increases after injecting
polymer solution; however this increase is about half of the increased pressure during
polymer flooding with 0.4 wt% Flopaam 3530S.
Figure 4-13: Pressure vs. Injected fluid for 0.2 wt% Flopaam 3530S solution flooding after water flooding.
Extended water flooding is performed after injection 0.2 Flopaam solution for this
experiment. The final residual oil saturation remains the same, as a small fraction of an
OOIP is recovered after extended water flooding. The corresponding pressure differential is
considerably less than the initial water flood. Using Figure 4-14, residual factor and residual
resistance factor to water are calculated 4.656 and 0.109, respectively.
0
2
4
6
8
10
12
14
0 0.5 1 1.5 2 2.5 3 3.5
P (psi)
Injected ;luid (PV)
WF PF (0.2 wt% Flopaam)

82
Figure 4-14: Pressure vs. Injected fluid (IWF + 0.2 wt% Flopaam 3530S solution flooding + EWF)
0
2
4
6
8
10
12
14
0 1 2 3 4 5 6 7
P (psi)
Injected (PV)
IWF
PF
EWF

83
For further investigation on the effect of polymer concentration on heavy oil
recovery factor, 0.1 wt% Flopaam 3530S polymer solution is injected into the core with the
same process as 0.4 and 0.2 wt% Flopaam 3530S polymer solution experiments. The
subsequent injection of 2.74 PV of 0.10 wt% Flopaam 3530S polymer solution results show
an increase in the recovery factor with incremental recovery approximately 22.26% of
original oil in place.
Figure 4-15: Recovery factor vs. Injected fluid for 0.1 wt% Flopaam 3530S solution flooding after water flooding.
Water cut reaches 0.99 after injecting 0.87 PV water. It drops down to 0.67 after the
core is exposed to the polymer solution. Injecting Flopaam 0.1 wt% solution into the sand
pack reduces the water cut down to as low as the water cut in experiments used Flopaam 0.4
and 0.2 wt%. The water cut then increases back to 0.9 much faster than the two previous
experiments, which means an earlier breakthrough and less recovery.
0
5
10
15
20
25
30
35
40
0 0.5 1 1.5 2 2.5 3 3.5 4
RF (%
OOIP)
Injected ;luid (PV)
WF PF (0.1 wt% Flopaam)

84
Figure 4-16: Water cut vs. Injected fluid for 0.1 wt% Flopaam 3530S solution flooding after water flooding.
The pressure difference for this test is presented in Figure 4-17. Injection pressure
reaches 6.5 psi after injecting 0.1 wt% Flopaam solution. The injection pressure for this
experiment is almost the same as the 0.2 wt% Flopaam injection pressure; however the
graph shows the pressure rapidly decreases to 2.6 and stabilizes.
0
0.2
0.4
0.6
0.8
1
1.2
0 0.5 1 1.5 2 2.5 3 3.5 4
WC (fraction)
Injected ;luid (PV)
WF PF (0.1 wt% Flopaam)

85
Figure 4-17: Pressure difference vs. Injected fluid for 0.1 wt% Flopaam 3530S solution flooding after water flooding.
Using pressure data in Figure 4-18, residual factor and residual resistance factor to
water are calculated 12 and 2.854, respectively.
Figure 4-18: Pressure vs. Injected fluid (IWF + 0.1 wt% Flopaam 3530S solution flooding + EWF)
0
2
4
6
8
10
12
14
0 0.5 1 1.5 2 2.5 3 3.5 4
P (psi)
Injected ;luid (PV)
WF PF (0.1 wt% Flopaam)
0
2
4
6
8
10
12
14
0 1 2 3 4 5 6 7
P (psi)
Injected ;luid (PV)
IWF
PF
EWF

86
4.5 Effect of Polymer Type (960 cp oil, 0.4 wt% Flocomb C3525 HPAM)
The effect of polymer type on polymer flooding recovery factor is the focus of this
section. Flocomb C3525 is chosen to observe the effect of polymer type on producing same
type oil (960 mPa·s) from the same sand pack and with the same procedure with Flopaam
3530S flooding experiment. The concentration on both polymer solutions is 4000ppm.
Initially, water flood is conducted to approximately 0.86 PV. As expected, the initial water
flooding recovery factor is quite low, at about 12.1% of the OOIP. Then sand pack is
flooded with 0.4 wt% Flocomb C3525 polymer solution for approximately 2.71 PV.
Figure 4-19: Recovery factor vs. Injected fluid for 0.4 wt% Flocomb C3525 solution experiment.
Incremental oil recovery for 0.4 wt% Flocomb C3525 reaches approximately 42.7%
of the original oil in place. For this experiment, the water cut reaches 0.96 at the end of
0
10
20
30
40
50
60
0 0.5 1 1.5 2 2.5 3 3.5 4
RF (%
OOIP)
Injected ;luid (PV)
WF PF (0.4 wt% Flocomb)

87
water flooding. After injecting polymer solution water cut decreases to 0.24 and didn’t
increased to its previous level.
Figure 4-20: Water cut vs. Injected fluid for 0.4 wt% Flocomb C3525 solution experiment.
By reaching 19.5 psi, injection pressure for Flocomb C3525 has the highest injection
pressure thus far. Stabilizing pressure for this polymer flooding is 9.9 psi, the highest value
as compared to previous experiments.
-‐0.2
0
0.2
0.4
0.6
0.8
1
1.2
0 0.5 1 1.5 2 2.5 3 3.5 4
WC (fraction)
Injected ;luid (PV)
WF PF (0.4 wt% Flocomb)

88
Figure 4-21: Pressure difference vs. Injected fluid for 0.4 wt% Flocomb C3525 solution experiment.
Using pressure data from Figure 4-22, residual factor, residual resistance factor to
water, and residual resistance factor to oil are calculated 7.615, 0.615, and 0.357,
respectively.
Figure 4-22: Pressure vs. Injected fluid (OF + IWF + 0.4 wt% Flocomb C3525 solution flooding + EWF + OFP)
0 2 4 6 8 10 12 14 16 18 20
0 0.5 1 1.5 2 2.5 3 3.5 4
P (psi)
Injected ;luid (PV)
WF PF (0.4 wt% Flocomb)
0 10 20 30 40 50 60 70 80 90 100
0 2 4 6 8 10 12 14
P (psi)
Injected ;luid (PV)
OF
IWF
PF
EWF
OFP

89
4.6 Effect of Adding Alkaline and Surfactant to Polymer Solution (960 cp oil, 0.2 wt% Flopaam 3530S + 0.5 wt% Na2CO3 + 0.2 wt% Surfactant)
In alkaline flooding applications, the minimum oil-water IFT is often attained at very
low concentrations of alkali; however, alkali losses from adsorption in the porous media
often require higher alkali concentrations to be injected. As a result, floods are performed at
conditions not optimal for recovery, thus a mixture of alkali and surfactant is often injected
in order to stabilize the flood at the optimum concentration for minimum IFT (Bryan
[2007]).
The experiments use Flopaam 3530S at 2000 ppm concentrations 1 wt% NaCl
solution plus 0.5 wt% Na2CO3 as alkaline and 0.2 wt% surfactant for making ASP solution.
An initial water flood is injected for approximately 1 PV. Recovery from the initial water
flooding is approximately 14.7% of OOIP. Next, the ASP flood sequence is started.
Recovery factor versus injected ASP is shown in Figure 4-23. Incremental oil recovery for
ASP flooding is aproximately 43.43% of the OOIP.
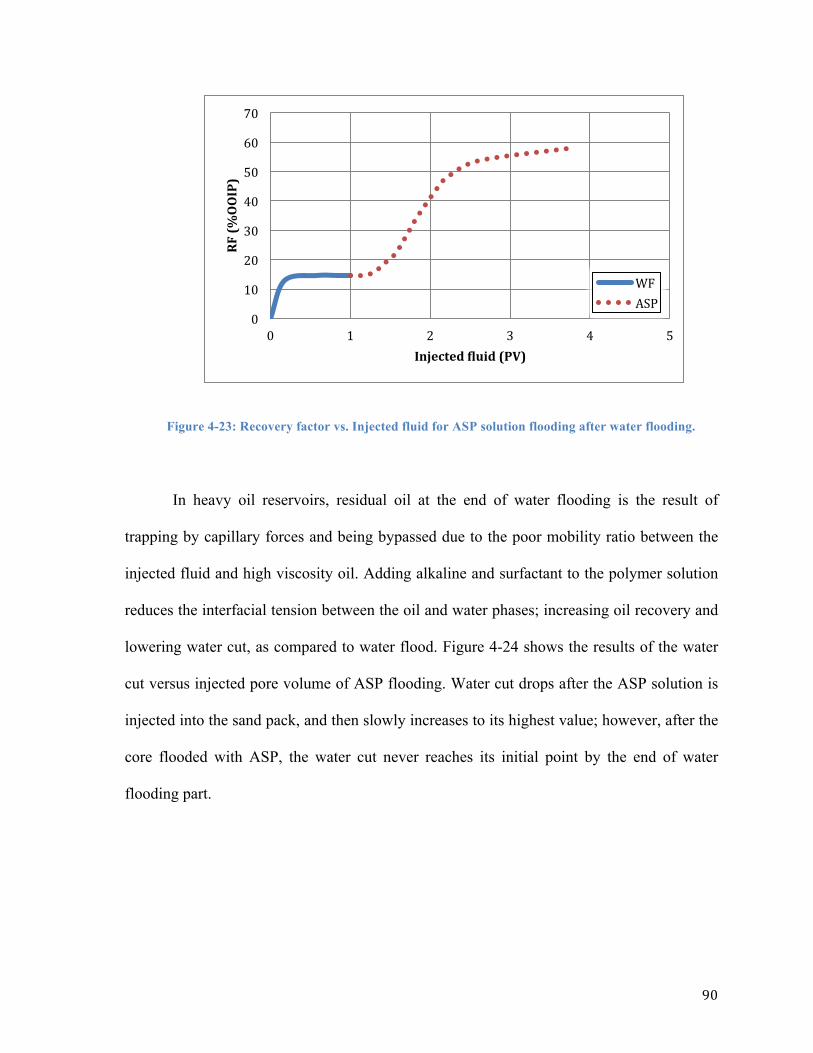
90
Figure 4-23: Recovery factor vs. Injected fluid for ASP solution flooding after water flooding.
In heavy oil reservoirs, residual oil at the end of water flooding is the result of
trapping by capillary forces and being bypassed due to the poor mobility ratio between the
injected fluid and high viscosity oil. Adding alkaline and surfactant to the polymer solution
reduces the interfacial tension between the oil and water phases; increasing oil recovery and
lowering water cut, as compared to water flood. Figure 4-24 shows the results of the water
cut versus injected pore volume of ASP flooding. Water cut drops after the ASP solution is
injected into the sand pack, and then slowly increases to its highest value; however, after the
core flooded with ASP, the water cut never reaches its initial point by the end of water
flooding part.
0
10
20
30
40
50
60
70
0 1 2 3 4 5
RF (%
OOIP)
Injected ;luid (PV)
WF ASP

91
Figure 4-24: Water cut vs. Injected fluid for ASP solution flooding after water flooding.
In ASP flooding the mechanisms responsible for the oil recovery are IFT reduction,
rock wettability alteration, and the formation of water-oil emulsions, leading to improve oil
recovery and decrease water cut; however injection of ASP to the system causes an increase
in pressure. Figure 4-25 demonstrates how the pressure increases after the sand pack is
exposed to ASP solution.
0
0.2
0.4
0.6
0.8
1
1.2
0 1 2 3 4 5
WC (fraction)
Injected ;luid (PV)
WF
ASP
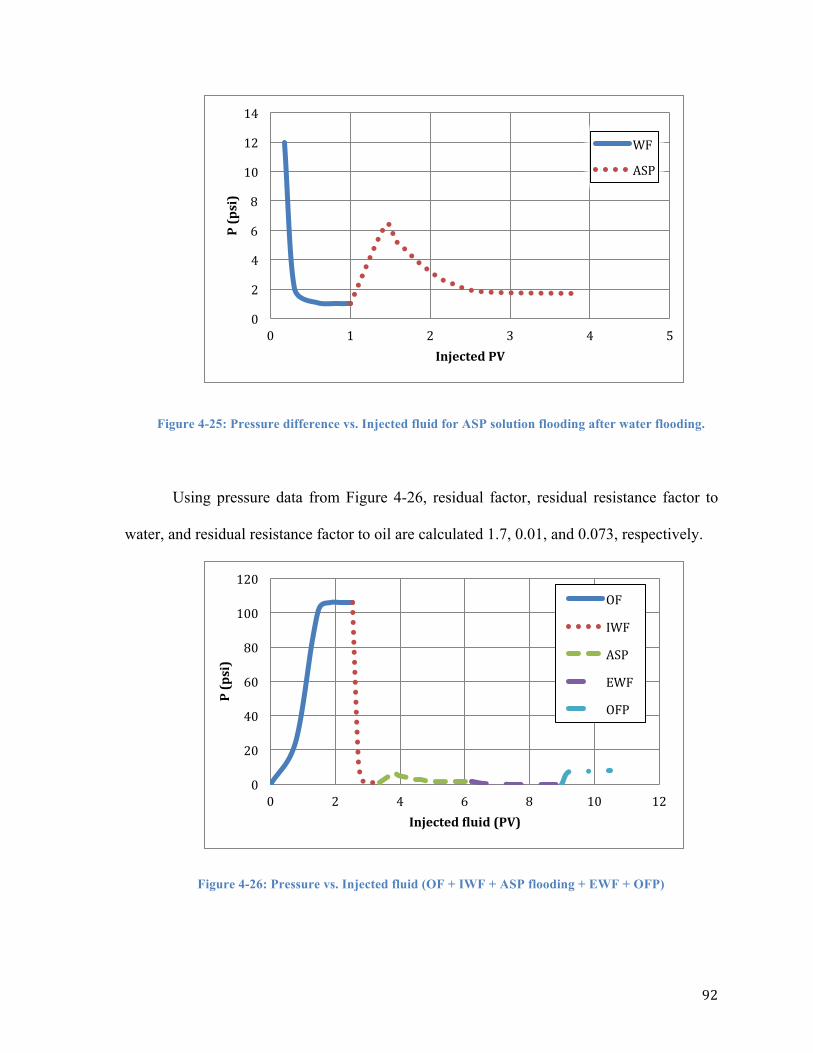
92
Figure 4-25: Pressure difference vs. Injected fluid for ASP solution flooding after water flooding.
Using pressure data from Figure 4-26, residual factor, residual resistance factor to
water, and residual resistance factor to oil are calculated 1.7, 0.01, and 0.073, respectively.
Figure 4-26: Pressure vs. Injected fluid (OF + IWF + ASP flooding + EWF + OFP)
0
2
4
6
8
10
12
14
0 1 2 3 4 5
P (psi)
Injected PV
WF
ASP
0
20
40
60
80
100
120
0 2 4 6 8 10 12
P (psi)
Injected ;luid (PV)
OF
IWF
ASP
EWF
OFP

93
4.7 ASP Flooding as Secondary Recovery Method (960 cp oil, 0.2 wt% Flopaam 3530S + 0.5 wt% Na2CO3 + 0.2 wt% Surfactant)
To evaluate the effectiveness of alkaline surfactant polymer flooding for heavy oil
recovery, an additional core flooding test is conducted implementing ASP flooding as a
secondary oil recovery method.
Pressure is the key to collecting oil from the natural underground rock formations. In
primary recovery, the natural pressures push the oil deposits from the pores into the well
where it can be recovered. Secondary oil recovery is employed when the pressure inside the
well drops to levels that make primary recovery no longer viable. The most common
secondary recovery techniques are gas injection and water flooding. In this section
polymer/ASP solution implemented as secondary oil recovery.
The chemical agents used in this study are 0.5 wt% Na2CO3, 0.2 wt% surfactant, and
0.2 wt% Flopaam 3530S in order to produce 960 cp heavy oil.
The same core holder is used for the flood test with 0.0038 ft2 area and length of
0.909 ft. The wettability of the core is water-wet. The core flooding test is conducted
horizontally. The same experimental procedure is conducted, except the initial water
flooding is eliminated. At first, the core is saturated with the saline water with 0.1 wt%
NaCl. Then, the heavy oil is injected into the core until water production ceases. Next, the
core is flooded with the ASP, followed by an extended water flood until the oil production
becomes negligible. The injection rate of water and chemical slug is set at 0.1 ml/min. All
the tests are conducted at room temperature (23 °C).

94
Figure 4-27: Recovery factor vs. Injected fluid for ASP solution flooding as a secondary recovery method.
As shown in Figure 4-27, the recovery factor for implementing ASP flooding as a
secondary recovery method, reaches to more than 62.76% OOIP. Figure 4-28 demonstrates
the water cut versus injected pore volume for this test. It is the first time, through this study
a recovery method could keep the water cut at zero after injecting displacing solution for
almost 0.25 of PV.
Figure 4-28: Water cut vs. Injected fluid for ASP solution flooding as a secondary recovery method.
0 10 20 30 40 50 60 70
0 0.5 1 1.5 2 2.5 3 RF (%
OOIP)
Injected ;luid (PV)
-‐0.2
0
0.2
0.4
0.6
0.8
1
0 0.5 1 1.5 2 2.5 3
WC (fraction)
Injected (PV)

95
Injection pressure for ASP flooding as a secondary recovery method test reaches to
20.5 psi. The pressure drops down to 4 psi after 0.4 PV of ASP solution is injected into the
sand pack. After that, the pressure almost stabilizes for the rest of the injection process.
Figure 4-29 represents the pressure versus injected fluid.
Figure 4-29: Pressure vs. Injected fluid for ASP solution flooding as a secondary recovery method.
Using pressure data from Figure 4-30, residual resistance factor to oil is calculated
0.228.
0
5
10
15
20
25
0 0.5 1 1.5 2 2.5 3
P (psi)
Injected ;luid (PV)
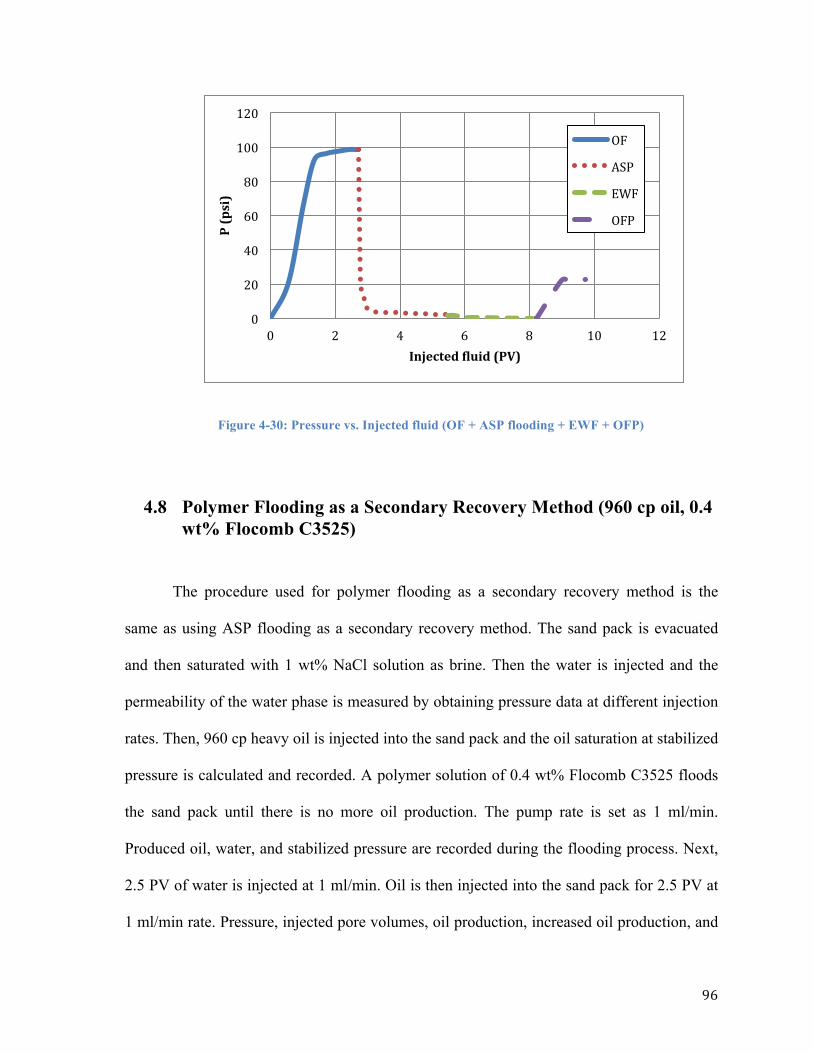
96
Figure 4-30: Pressure vs. Injected fluid (OF + ASP flooding + EWF + OFP)
4.8 Polymer Flooding as a Secondary Recovery Method (960 cp oil, 0.4 wt% Flocomb C3525)
The procedure used for polymer flooding as a secondary recovery method is the
same as using ASP flooding as a secondary recovery method. The sand pack is evacuated
and then saturated with 1 wt% NaCl solution as brine. Then the water is injected and the
permeability of the water phase is measured by obtaining pressure data at different injection
rates. Then, 960 cp heavy oil is injected into the sand pack and the oil saturation at stabilized
pressure is calculated and recorded. A polymer solution of 0.4 wt% Flocomb C3525 floods
the sand pack until there is no more oil production. The pump rate is set as 1 ml/min.
Produced oil, water, and stabilized pressure are recorded during the flooding process. Next,
2.5 PV of water is injected at 1 ml/min. Oil is then injected into the sand pack for 2.5 PV at
1 ml/min rate. Pressure, injected pore volumes, oil production, increased oil production, and
0
20
40
60
80
100
120
0 2 4 6 8 10 12
P (psi)
Injected ;luid (PV)
OF
ASP
EWF
OFP

97
increment oil recovery are recorded and calculated during each flood.
Figure 4-28 demonstrates the recovery factor versus pore volume injected for
polymer flooding as a secondary recovery method, using 0.4 wt% Flocomb C3525 polymer
solution.
Figure 4-31: Recovery factor vs. Injected fluid for polymer flooding as a secondary recovery method.
The recovery factor reaches to 62.1% of original oil in place. Recovery factor and
water cut are calculated for each sample through the polymer flooding. Water cut data
versus injected pore volume is presented in the figure 4-29. Water cut gradually increases
and it almost stabilizes after injecting 2 PV polymer solution.
-‐10
0
10
20
30
40
50
60
70
0 0.5 1 1.5 2 2.5 3 3.5
RF (%
OOIP)
Injected ;luid (PV)
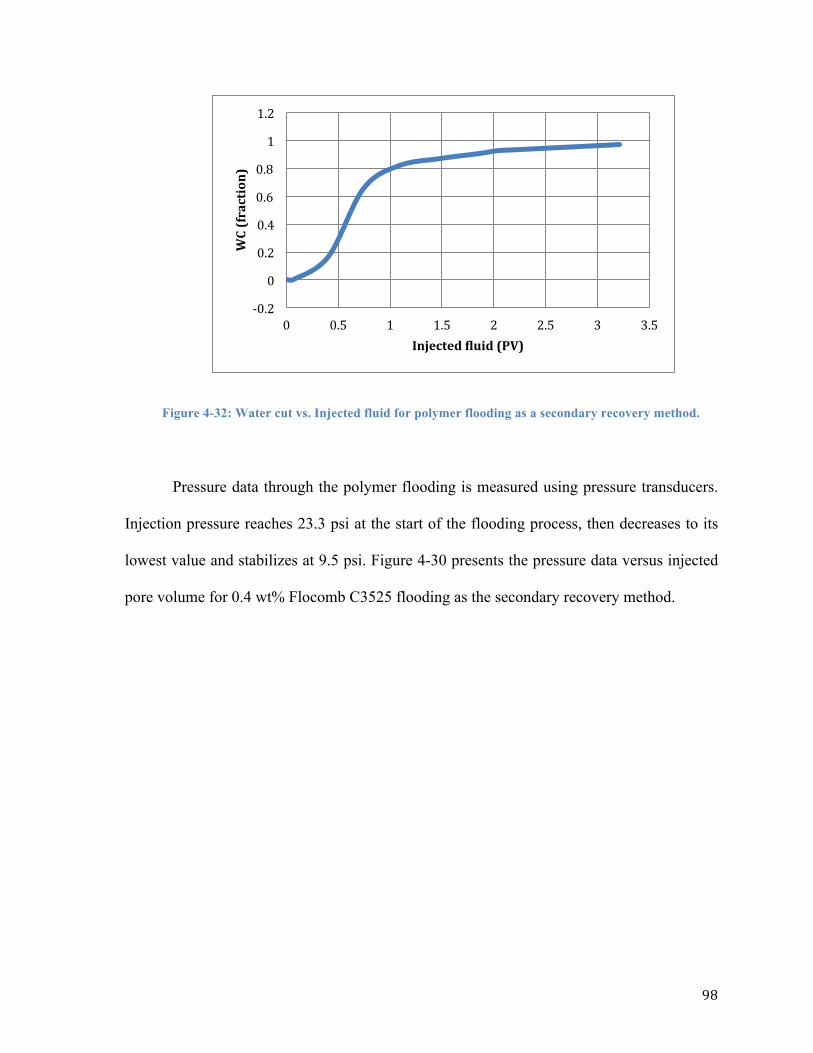
98
Figure 4-32: Water cut vs. Injected fluid for polymer flooding as a secondary recovery method.
Pressure data through the polymer flooding is measured using pressure transducers.
Injection pressure reaches 23.3 psi at the start of the flooding process, then decreases to its
lowest value and stabilizes at 9.5 psi. Figure 4-30 presents the pressure data versus injected
pore volume for 0.4 wt% Flocomb C3525 flooding as the secondary recovery method.
-‐0.2
0
0.2
0.4
0.6
0.8
1
1.2
0 0.5 1 1.5 2 2.5 3 3.5
WC (fraction)
Injected ;luid (PV)

99
Figure 4-33: Pressure vs. Injected fluid for polymer flooding as a secondary recovery method.
Using pressure data from Figure 4-34, RRF to oil is calculated 0.341.
Figure 4-34: Pressure vs. Injected fluid (OF + PF + EWF + OFP)
4.9 Alkaline-Polymer Flooding as a Secondary Recovery Method (960 cp oil, 0.2 wt% Flopaam 3530S + 0.5 wt% Na2CO3)
Alkali solutions are a special subset of surfactant flooding, whereby the injected
0
5
10
15
20
25
0 0.5 1 1.5 2 2.5 3 3.5
P (psi)
Injected ;luid (PV)
0
20
40
60
80
100
120
0 2 4 6 8 10 12
P (psi)
Injected (PV)
OF
PF
EWF
OFP

100
alkali reacts with naturally occurring organic acids in the oil, leading to the generation of in
situ surfactants.
The target heavy-oil and brine samples are the same as the other experiments in this
study - 960 cp heavy oil and 1 wt% NaCl as brine solution. Implementing alkaline polymer
solution as a secondary recovery leads to 50.65% OOIP.
Figure 4-35: Recovery factor vs. Injected fluid for AP flooding as a secondary recovery method.
Figure 4-35 demonstrates the recovery factor versus injected pore volume for this
experiment. Water cut is also measured regarding the injected pore volume, as shown in the
figure 4-36.
0
10
20
30
40
50
60
0 0.5 1 1.5 2 2.5
RF (%
OOIP)
Injected ;luid (PV)

101
Figure 4-36: Water cut vs. Injected fluid for AP flooding as a secondary recovery method.
Injection pressure for this test reaches to 21.3 psi; figure 4-37 shows the measured
pressure difference during AP flooding.
Figure 4-37: Pressure vs. Injected fluid for AP flooding as a secondary recovery method.
0 0.1 0.2 0.3 0.4 0.5 0.6 0.7 0.8 0.9 1
0 0.5 1 1.5 2
WC (fraction)
Injected ;luid (PV)
0
5
10
15
20
25
0 0.5 1 1.5 2 2.5
P (psi)
Injected ;luid (PV)

102
Using pressure data from Figure 4-38, residual resistance factor to oil is calculated
0.272.
Figure 4-38: Pressure vs. Injected fluid (OF + AP + EWF + OFP)
0
20
40
60
80
100
120
0 2 4 6 8 10 12
P (psi)
Injected ;luid (PV)
OF
AP
EWF
OFP

103
CHAPTER 5: DISCUSSION
Eight Enhance Oil Recovery (EOR) methods, such as water flooding, polymer
flooding, alkaline polymer flooding, and alkaline surfactant polymer flooding were
conducted to determine the most appropriate chemical EOR method for the selected oil (960
cp heavy oil).
The main objectives of this research are to determine the importance of mobility
ratio, polymer concentration, polymer type, surfactant, and chemical flooding as a secondary
or tertiary recovery method in the displacement of heavy oil by implementing linear core
flood tests utilizing different types and viscosities of displacing fluids.
In this study, all the experiments are performed at a constant room temperature.
Operating pressure is atmospheric pressure. Recovery factor and pressure drop during the
experiments are investigated to measure the performance and applicability of each method.
Injection pressure for all experiments is compared to determine the best recovery regarding
lower injection pressures. The recovery factor for each experiment is calculated as the
cumulative oil production divided by the corresponding original oil in place. Recovery
factor, water cut, and pressure drop are monitored as a function of injected pore volume.
Pressure difference is measured by pressure transducers connected to the data acquisition
system. Results obtained from all experiments are discussed in this section.
The simple design of 1D sand pack holder provided good reliability, flexibility, and
versatility. It was believed that this type of porous material better simulates real reservoir
material. A new sand pack was prepared for each experiment to eliminate the effect of
polymer adsorption in polymer/ASP flood experiments. This can be considered a limitation
of this study and a disadvantage during comparative analysis because of different pore

104
volume, porosity, and permeability for each test. Using wet sand pack procedure and
vibrator instrument during sand packing minimized this effect.
Also the lack of interfacial tension measurement instrument limited this study to
measure the exact interfacial tension between alkaline, surfactant and oil in ASP solutions.
However the visible difference in solution phases helped in identifying the best alkaline and
surfactant type and concentration for ASP solution.
5.1 Case 1 – Water Flooding vs. Polymer Flooding as a Secondary and Tertiary Recovery Method
Mai et al. (2008) believe that viscous fingering sometimes plays a role as the
predominant mechanism during heavy oil recovery by the water flooding method. The
addition of water soluble polymers can reduce the susceptibility of displacement to
fingering. In this study, different approaches to polymer flooding are tested to investigate
this phenomenon.
Three methods are compared in this section: water flooding, polymer flooding as a
secondary recovery method, and polymer flooding as a tertiary recovery method. The
ultimate recovery factor from the water flooding method is approximately 13.08% of OOIP.
It reached this amount after 0.17 PV water was injected and didn’t increase till the end of
injection, about 3.75 PV, resulting in substantial volumes of oil being left behind due to poor
sweep efficiency.
In two other methods, the addition of polymer as a mobility control agent in water
flooding resulted in high incremental recovery due to good volumetric sweep efficiency.

105
Polymer slug injection, as a secondary recovery method, gave higher and faster incremental
oil production than third method, which polymer slug followed by water injection. Polymer
in the slug is due to its high viscosity, creating a favourable mobility ratio and reducing the
chances of fingering, resulting in high incremental oil production.
In tertiary polymer flooding, a displacement of 960 mPa·s heavy oil by water is
initially conducted. The injection of 0.86 PV water resulted in 12.1% OOIP displacement.
An additional 2.71 PV 0.4 wt% Flocomb C3525 injection resulted in a total of 54.8% OOIP
oil recovery. The viscosity of injected polymer solution as measured in viscometer, is
99.11cp at a calculated 70% torque.
In the case of Secondary polymer flooding, an early increase in oil production
occurred after injecting polymer solution. The peak of oil production is achieved in 1.5
injected PV and then oil production became nearly stabilized. Ultimate oil production from
this method is 62.1% of OOIP.

106
Figure 5-1: Recovery factor vs. Injected fluid for Water flooding, Flocomb 4000 ppm flooding as a secondary and tertiary recovery method.
As expected, the results from 1D core floods indicate early breakthrough of water
flooding, suggesting that viscous fingering mechanisms of displacement appear to be
predominant in heavy oil water flooding.
Comparing the recovery factors of polymer flooding as a secondary and tertiary
recovery method, shows that polymer solution tends to follow paths previously channelled
by water and does not enter additional pores to sweep more oil, therefore tertiary polymer
flooding shows less recovery than secondary polymer flooding. Figure 5-1 demonstrates that
polymer flooding, as a tertiary recovery, increases oil recovery with a greater delay in oil
production from the onset of polymer injection than in the case of secondary recovery.
The injection pressure for water flooding and polymer flooding, as a secondary
recovery method, reaches to 13.83 psi and 23.3 psi, respectively. In polymer flooding, as a
tertiary oil recovery, initial water flood results in 13 psi injection pressure; comparatively
0
10
20
30
40
50
60
70
0 0.5 1 1.5 2 2.5 3 3.5 4
RF (%
OOIP)
Injected ;luid (PV)
WF PF Tertiary PF Secondary

107
less than polymer flooding injection pressure (17.5 psi). The highest heavy oil is recovered
with greatest injection pressure response from the secondary polymer flooding method.
Stabilized pressure reaches 0.36, 9.9, and 9.1 psi for water flooding, secondary polymer
flooding, and tertiary polymer flooding recovery, respectively.
Figure 5-2: Pressure difference vs. Injected fluid for water flooding, Flocomb 4000 ppm flooding as a secondary and tertiary recovery method.
5.2 Case 2 – Effect of Polymer Concentration on Heavy Oil Recovery
Figures 5-3 and 5-4 show the plot of both oil recovery and pressure differential with
respect to PV injected for 0.1, 0.2, and 0.4 wt% Flopaam 3530S cases.
An initial water flood of about 1 PV is conducted for all three experiments. On
average 11.86% of OOIP is recovered from the water flood. The follow-up polymer flood is
then carried out with different concentration slugs (0.1, 0.2, and 0,4 wt% Flopaam 3530S in
1 wt% NaCl solution).
0
5
10
15
20
25
0 0.5 1 1.5 2 2.5 3 3.5 4
P (psi)
Injected ;luid (PV)
WF PF Tertiary PF Secondary

108
Similar to case 1, polymer injection demonstrates higher value in oil recovery due to
good volumetric sweep efficiency. More oil is produced before the breakthrough of front,
indicating more stable polymer slug is formed with fewer occurrences of fingering and
channelling; however, this kind of response appears to be less intense in the case of low
concentrated polymer solution.
As shown in the figure 5-3 ultimate recovery factor is 34.56, 48.28, and 53.36% of
OOIP for 0.1, 0.2, and 0.4 wt% Flopaam 3530S solution injections, respectively. Polymer
injection was stopped after approximately 2.5 PV of fluid injection. The incremental oil
recovery in 0.4 wt% Flopaam injection slightly exceeds the recovery from 0.2 wt% Flopaam
injection.
Figure 5-3: Recovery factor vs. Injected fluid for 0.1, 0.2, and 0.4 wt% Flopaam 3530S polymer
flooding.
The polymer of concentration 0.4 wt% has the highest incremental oil production
because of higher viscosity than the other concentrations. Doubling the concentration of
polymer solution from 1000 ppm to 2000 ppm results in increasing heavy oil recovery to
0
10
20
30
40
50
60
0 0.5 1 1.5 2 2.5 3 3.5 4
RF (%
OOIP)
Injected ;luid (PV)
1000ppm 2000ppm 4000ppm

109
about 13.72% of OOIP. Increasing the concentration from 2000 ppm to 4000 ppm also
increases the recovery about 5.08% of OOIP; leading to the conclusion that the effect of
polymer concentration on oil recovery at higher concentrations is less crucial.
The pressure drop decreases to an average of 0.53 psi toward the end of the water
flood, signifying water breakthrough. The pressure increases after injecting polymer to 6.5,
6.07, and 12.29 psi for 0.1, 0.2, and 0.4 wt% polymer solution injections, respectively. As
the pressure differential increases, an additional slug of oil is produced. The pressure
differential stabilizes at 2.4, 3.6, and 7 psi for 0.1, 0.2, and 0.4 wt% polymer solution
flooding tests, respectively.
Figure 5-4 demonstrates the pressure difference versus injected pore volume for all
three experiments. As a result of the high viscosity contrast between the water and the heavy
oil samples during the water flooding, water breakthrough occurs at a small PV injection in
the sand pack flood test. After water breakthrough, the pressure decreases with continuing
water injection. As expected, a comparatively higher pressure peak was observed in 0.4 wt%
polymer injection.
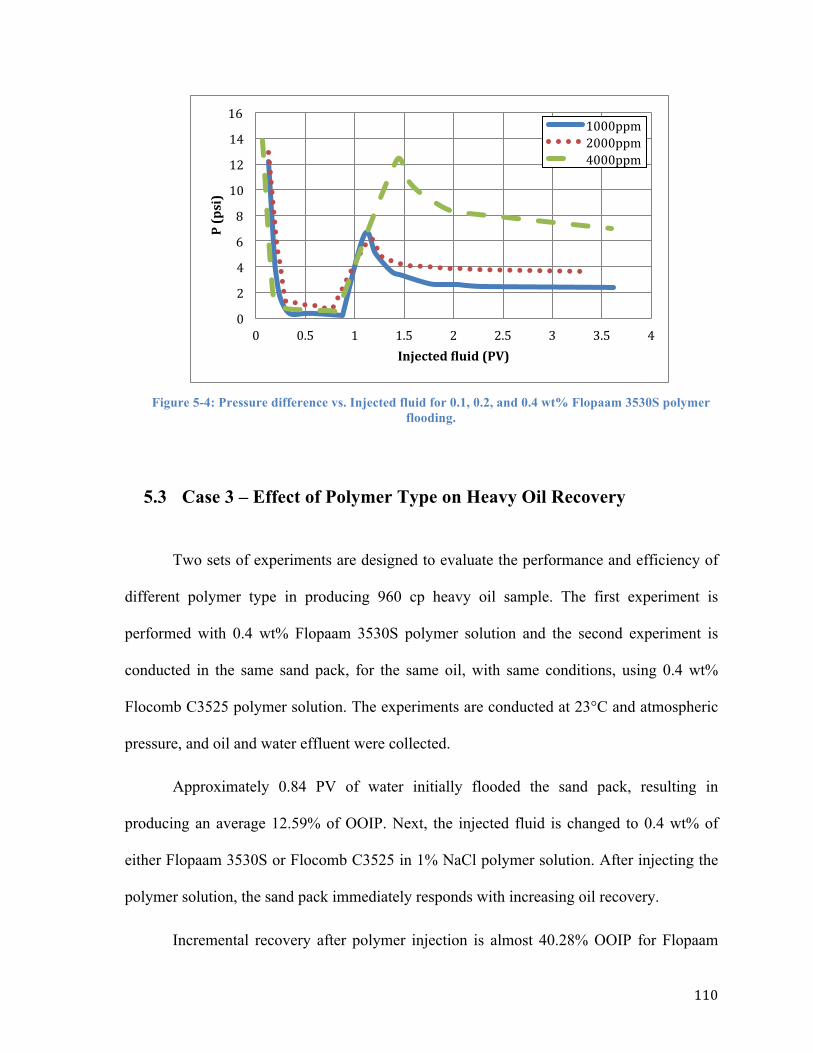
110
Figure 5-4: Pressure difference vs. Injected fluid for 0.1, 0.2, and 0.4 wt% Flopaam 3530S polymer
flooding.
5.3 Case 3 – Effect of Polymer Type on Heavy Oil Recovery
Two sets of experiments are designed to evaluate the performance and efficiency of
different polymer type in producing 960 cp heavy oil sample. The first experiment is
performed with 0.4 wt% Flopaam 3530S polymer solution and the second experiment is
conducted in the same sand pack, for the same oil, with same conditions, using 0.4 wt%
Flocomb C3525 polymer solution. The experiments are conducted at 23°C and atmospheric
pressure, and oil and water effluent were collected.
Approximately 0.84 PV of water initially flooded the sand pack, resulting in
producing an average 12.59% of OOIP. Next, the injected fluid is changed to 0.4 wt% of
either Flopaam 3530S or Flocomb C3525 in 1% NaCl polymer solution. After injecting the
polymer solution, the sand pack immediately responds with increasing oil recovery.
Incremental recovery after polymer injection is almost 40.28% OOIP for Flopaam
0
2
4
6
8
10
12
14
16
0 0.5 1 1.5 2 2.5 3 3.5 4
P (psi)
Injected ;luid (PV)
1000ppm 2000ppm 4000ppm

111
3530S and 42.71% OOIP for Flocomb C3525 test. The difference between incremental oil
recovery from both types of polymer with the same concentration (0.4 wt%) is
approximately 2.43% of OOIP. Changing the type of polymer solutions does not contribute
to significant changes in recovering the of 960 mPa·S oil.
A comparison of oil recovery and differential pressure responses for both core floods
are shown in Figure 5-5 and 5-6.
Figure 5-5: Recovery factor vs. Injected fluid for 0.4 wt% Flopaam 3530S and Flocomb C3525
polymer flooding.
As shown in figure 5-5, changing polymer from Flopaam 3530S to Flocomb C3525
does not result in significant changes in recovery, achieving approximately the same
ultimate recovery value. Figure 5-5 demonstrates the recovery factor versus injected pore
volume for both polymer solutions; a difference of 1.45% of OOIP occurs between the
ultimate recoveries. From the 1D core flood tests, it is noticeable that change in polymer
type without change in polymer concentration does not significantly alter recovery factors.
0
10
20
30
40
50
60
0 0.5 1 1.5 2 2.5 3 3.5 4
RF (%
OOIP)
Injected ;luid (PV)
Flopaam
Flocomb
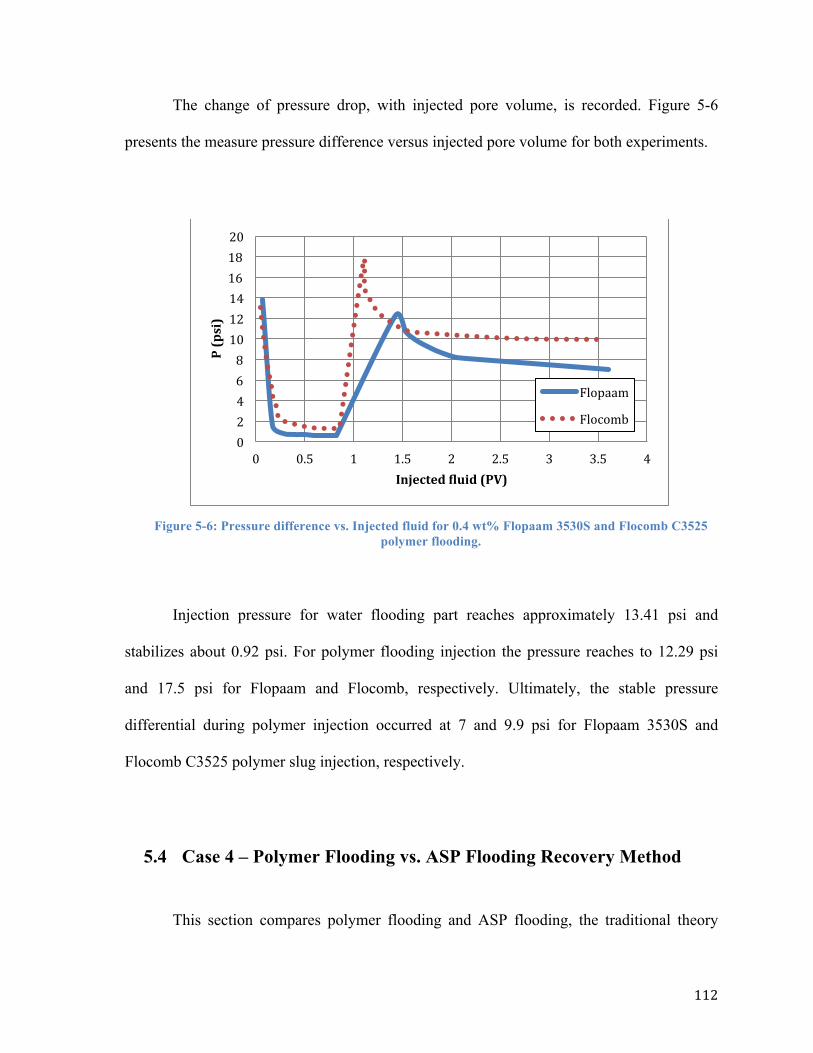
112
The change of pressure drop, with injected pore volume, is recorded. Figure 5-6
presents the measure pressure difference versus injected pore volume for both experiments.
Figure 5-6: Pressure difference vs. Injected fluid for 0.4 wt% Flopaam 3530S and Flocomb C3525
polymer flooding.
Injection pressure for water flooding part reaches approximately 13.41 psi and
stabilizes about 0.92 psi. For polymer flooding injection the pressure reaches to 12.29 psi
and 17.5 psi for Flopaam and Flocomb, respectively. Ultimately, the stable pressure
differential during polymer injection occurred at 7 and 9.9 psi for Flopaam 3530S and
Flocomb C3525 polymer slug injection, respectively.
5.4 Case 4 – Polymer Flooding vs. ASP Flooding Recovery Method
This section compares polymer flooding and ASP flooding, the traditional theory
0 2 4 6 8 10 12 14 16 18 20
0 0.5 1 1.5 2 2.5 3 3.5 4
P (psi)
Injected ;luid (PV)
Flopaam
Flocomb

113
claims that high incremental oil production with less water production is obtained from ASP
flooding compared to polymer flooding. Polymer injection alone cannot reduce the
interfacial tension between water and oil, and release capillary trapped oil. Instead, polymer
with alkaline and/or surfactant should yield high recovery. Polymer and ASP slugs improve
volumetric sweep efficiency by increasing water viscosity and improving mobility ratio.
Nearly 0.88 PV of 1% NaCl brine solution is injected during the initial water
flooding sequence. For both tests the cumulative oil recovery increases as water flooding
continues; however, the increase rate in cumulative oil recovery becomes very low at the
beginning of water injection. Approximately 12.46% of OOIP is recovered from the water
flood.
For one experiment, water injection is subsequently switched to polymer injection,
using 0.2 wt% Flopaam 3530S in 1% NaCl solution. For the other experiment, water
flooding switched to ASP slug injection, using the same polymer with the same
concentration and added alkaline and surfactant. ASP slug contains 0.5 wt% Na2CO3, 0.2
wt% surfactant, and 0.2 wt% Flopaam 3530S in 1% NaCl brine solution.

114
Figure 5-7: Recovery factor vs. Injected fluid for 0.2 wt% Flopaam 3530S and ASP flooding.
As shown in Figure 5-7, in the case of ASP flooding, the test run indicates that the
addition of AS to polymer can lead to a more effective displacement of oil. The alkali and
surfactant part in the ASP solution is responsible for emulsifying some of the oil, leading to
higher recovery. Polymer content of both solutions for chemical flooding in both
experiments improves mobility ratio.
The incremental oil for polymer flood is lower than ASP flood. Unlike surfactant,
polymer does not release the capillary-trapped oil; rather it improves volumetric sweep
efficiency and reduces mobility ratio by increasing water viscosity. Ultimately, our goal to
reduce residual oil saturation for very high amounts, may not be achieved, may be due to the
type of surfactant (as discussed in the phase behaviour experiment).
The ultimate oil recovery is 48.28 and 58.14% OOIP for polymer flooding and ASP
flooding tests, respectively. For some reason the water flooding part in ASP test recovers
more oil compared to the water flooding part in the polymer test; this effect can be almost
0
10
20
30
40
50
60
70
0 1 2 3 4 5
RF (%
OOIP)
Injected ;luid (PV)
FLopaam
ASP

115
eliminated by comparing the incremental oil recovery for the chemical injection part instead
of comparing ultimate recovery. The incremental oil recovery was 38.07 and 43.43% OOIP
for polymer injection and ASP injection, respectively. Adding alkaline and surfactant
enhances the efficiency of the polymer flooding is achieved with increasing incremental oil
recovery for about 5.36% of OOIP.
Figure 5-8 compares the pressure difference for both polymer flooding and ASP
flooding methods.
Figure 5-8: Pressure difference vs. Injected fluid for 0.2 wt% Flopaam 3530S and ASP flooding.
The injection pressure for both chemical injections are about 6.1 psi, since the
viscosity of the two chemical solutions are almost the same and the added alkaline and
surfactant do not highly reduce capillary trapped oil. The viscosity of ASP solution
measures 15.27 cp at 70% torque. Overall, oil is produced under lower pressure gradients
during the ASP injection method, and finally, stabilizes at lower pressure. Stabilized
0
2
4
6
8
10
12
14
0 1 2 3 4 5
P (psi)
Injected ;luid (PV)
FLopaam
ASP

116
pressure was 3.6 and 1.7 psi for polymer flooding and ASP flooding, respectively.
5.5 Case 5 – ASP Flooding as Secondary and Tertiary Recovery Method
This section compares ASP flooding as a secondary and tertiary recovery method for
producing heavy oil. Tertiary recovery is injection of different materials to improve the flow
between oil and rock, and to recover crude oil remaining after the primary and secondary oil
recovery phases. In this study tertiary polymer/ASP flooding implemented after secondary
water flooding.
960 cp heavy oil is used for both tests. For the tertiary ASP test, an initial water
flood is carried out to approximately 1 PV of water injection. Initial water flooding in this
test resulted in recovering 14.71% of OOIP heavy oil. After water flooding, 2.82 PV ASP
slug is injected into the sand pack. Ultimate recovery from the tertiary ASP method is
58.14% OOIP.
The second experiment implemented ASP injection as a secondary recovery method.
Both methods used the same oil and same ASP slug solution, which contains 0.5 wt%
Na2CO3, 0.2 wt% surfactant, and 0.2 wt% Flopaam 3530S in 1% NaCl brine solution. The
ultimate recovery factor for secondary ASP test reached 62.76% OOIP. Figure 5-9 shows
the recovery factor versus injected pore volume for both ASP floodings as secondary and
tertiary methods.

117
Figure 5-9: Recovery factor vs. Injected fluid for ASP flooding as a secondary and tertiary recovery
method.
As demonstrated in figure 5-9, the difference between the ultimate recovery factor
for both methods is about 4.62% OOIP; however, the difference between ultimate recovery
from both experiments is not a high value, it is noticeable that secondary ASP flooding
ultimate recovery reached after injecting approximately 2 PV solution, while tertiary ASP
ultimate recovery reached after injecting approximately 4 PV solution. It can be concluded
that secondary ASP flooding gives more recovery in less time.
In other words, in the tertiary ASP flooding test the chemical solution tended to
follow paths previously channelled by water and not enter additional pores to sweep more
oil, thereby showing a faster breakthrough response; therefore, this behaviour negatively
affects the recovery response.
The pressure differential trends of all three stages of displacement are shown in
figure 5-10 for both methods.
0
10
20
30
40
50
60
70
0 1 2 3 4 5
RF (%
OOIP)
Injected ;luid (PV)
Tertiary Secondary

118
Figure 5-10: Pressure drop vs. Injected fluid for ASP flooding as a secondary and tertiary recovery
method.
As shown in figure 5-10, for the tertiary ASP method, the pressure during the water
flood increases to nearly 12 psi, upon switching to polymer injection an immediate pressure
response is observed in the sand pack. Pressure for the ASP injection in the tertiary recovery
method increases to 6.3 psi and finally stabilizes at 1.7 psi.
For the secondary ASP injection, the corresponding pressure differential shows
much sharper increase across the sand pack by reaching to approximately 20.5 psi. At this
point of displacement the pressure starts dropping until it reaches a stabilized value and the
sand pack remains in equilibrium with injected fluid. Stabilized pressure for this method is
2.05 psi. Stabilization pressures for both methods are very close, since the chemical slugs
used are same.
0
5
10
15
20
25
0 1 2 3 4 5
P (psi)
Injected ;luid (PV)
Tertiary Secondary

119
5.6 Case 6 – ASP Flooding vs. AP Flooding Recovery Methods
Surfactants are surface active agents that, when used in very low concentrations, can
greatly reduce the surface tension of water. Surfactants used for polymer flooding are
emulsifiers, which suspend an immiscible liquid (oil). Using alkaline helps make in situ
soap and lower the need of surfactants, which are very expensive materials.
In this section, a comparison between alkaline-polymer flooding and alkaline-
surfactant-polymer flooding is performed. Both recovery methods implemented as a
secondary recovery method. The same polymer and alkaline with the same concentration are
used for making AP and ASP slugs. AP slug contains 0.2 wt% Flopaam 3530S and 0.5 wt%
Na2CO3 in 1 wt% NaCl solution. ASP slug made by using 0.2 wt% Flopaam 3530S, 0.5
wt% Na2CO3, and 0.2 wt% surfactant in 1 wt% NaCl solution.
The trend of incremental oil production curve versus injected pore volume is shown
in figure 5-11.
Figure 5-11: Recovery factor vs. Injected fluid for AP and ASP flooding.
0
10
20
30
40
50
60
70
0 0.5 1 1.5 2 2.5 3
RF (%
OOIP)
Injected ;luid (PV)
AP
ASP

120
For the AP flooding experiment, the injection of 2.04 PV of alkaline-polymer
solution produced 50.65% of OOIP. For the second experiment, the injection of 2.75 PV of
the corresponding slug resulted in cumulative incremental oil production of 62.76% OOIP.
The graph shows the addition of surfactant to alkaline polymer solution performed well at
reducing the residual oil saturation.
If oil total acid number (TAN) is high, the use of alkali makes the project profitable
by creating the natural soap in-situ, reducing the expense of surfactant, while polymer acts
as a viscosity modifier and helps to mobilize the oil.
Figure 5-12 presents the pressure difference for AP and ASP flooding methods to
compare the injection pressure and stabilized pressure in both methods.
Figure 5-12: Pressure difference vs. Injected fluid for AP and ASP flooding.
Injection pressure in AP flooding reaches 21.3 psi. Injection pressure for ASP
0
5
10
15
20
25
0 0.5 1 1.5 2 2.5 3
P (psi)
Injected ;luid (PV)
AP
ASP

121
flooding achieved a very close value of 20.5 psi. It can be concluded that since the polymer
concentration has the highest effect on injection pressure and the same polymer
concentration used for both of these experiments, then injection pressures are close. The
trend of pressure drop during ASP experiment shows less pressure difference than AP flood.
Both experiments stabilized at 3.3 and 2.05 psi for AP and ASP flooding, respectively.

122
CHAPTER 6: CONCLUSIONS AND
RECOMMENDATIONS
6.1 CONCLUSIONS
The potential of highly concentrated polymer solutions as well as different polymer
types is been investigated with respect to enhancing heavy oil recovery. The feasibility of
combining alkaline and alkaline-surfactant based solutions and polymer flooding (AP and
ASP) to improve oil recovery from thin heavy oil reservoirs in Western Canada has also
validated using a series of carefully designed laboratory experiments. Comparative
experiments were conducted between chemical (polymer base solutions) flooding methods,
as a secondary or tertiary recovery method, to conclude the best possible EOR method from
heavy oil reservoirs.
The following conclusions are the result of extensive experimental study of different
chemical (polymer, alkaline, and surfactant) flooding:
Water flooding reached its highest level of production at a very low injected pore
volume of water (0.17 pore volume water injected). Water flooding recovered 13.08% OOIP
while the injection pressure reached to 13.83 psi.
Core flood tests using any polymer base slugs show a higher recovery factor than
water flooding. Secondary polymer flooding using 0.4 wt% Flocomb C3525 shows a
49.02% OOIP higher recovery than water flooding. Tertiary polymer flooding using the
same polymer slug shows an incremental recovery of 41.72% OOIP compared to water
flooding alone.
123
Comparing recovery factor graphs for secondary and tertiary polymer flooding also
show faster recovery from secondary polymer flooding. The peak of recovery factor curves
for secondary polymer flooding occurs at approximately 1 injected PV sooner than tertiary
polymer flooding.
Injection pressure for polymer flooding section of tertiary polymer flooding method
(using 0.4 wt% Flocomb C3525) was 17.5 psi, which was less than secondary polymer
flooding injection pressure (23.3 psi) using the same polymer slug.
Doubling the polymer concentration from 0.1 wt% to 0.2 wt% Flopaam 3530S
solution increased ultimate recovery from 34.56% OOIP to 48.28% OOIP; therefore the
difference is 13.73% OOIP. The injection pressures were about the same for the two
experiments (about 6 psi). The polymer concentration doubled from 0.2 wt% to 0.4 wt% and
the ultimate recovery increased to 53.36% OOIP, causing a 5.07% OOIP increase; however,
the injection pressure almost doubled to 12.29 psi.
Comparing the results from 0.4 wt%, 0.2 wt%, and 0.1 wt% Flopaam 3530S polymer
flooding indicates that increasing the concentration for higher concentration polymer
solutions does not guarantee a significant improvement in oil recovery during polymer
flooding. In other words, at some point increasing polymer concentration not only does not
make a big difference in oil recovery and also dramatically increases the injection pressure.
Reviewing the results from experiments with different polymers, but same
concentrations indicates the recovery factor depends much more on polymer concentration,
rather than polymer type. Changing the polymer from Flopaam 3530S to Flocomb C3525
increased the ultimate recovery from 53.3% OOIP to 54.8% OOIP (a 1.3% OOIP increase);
however, this change does not significantly affect the recovery factor; it simply increases

124
injection pressure from 12.29 psi to 17.5 psi (a 5.21 psi increase).
A comparison between results from tertiary polymer flooding, tertiary ASP flooding,
and secondary ASP flooding using the same polymer (0.4 wt% Flopaam 3530S) shows the
addition of alkaline and surfactant to the polymer solution improves the recovery factor and
is more effective when implemented as a secondary recovery. Incremental recovery
increased about 5.36% OOIP, changing from polymer flooding to ASP flooding, both as a
tertiary recovery. Ultimate recovery from secondary ASP shows 14.47% OOIP higher
recovery than tertiary polymer flooding ultimate recovery, this increase also occurred at
about 1 injected pore volume sooner.
Comparing ASP, AP, and polymer flooding injection pressures show that injection
pressure is highly dependent on polymer concentration. Adding alkaline or alkaline-
surfactant to the same polymer slug did not decrease the injection pressure.
Phase behaviour experiments are conducted to find the suitable surfactant for the
ASP flooding test. The recovery factor trends from AP and ASP flooding (both as secondary
recovery method) shows a 12% OOIP increase in ultimate recovery occurs, as a result of
adding surfactant to the solution. Comparing this result with polymer flooding indicates that
used oil could be low in acid number and could not make significant in situ soap.

125
6.2 RECOMMENDATIONS FOR FUTURE WORKS
Investigating the feasibility of Alkaline-Surfactant-Polymer flooding in a 3D model
using the results from 1D ASP core flood is highly recommended. It is believed that such a
model will give further valuable information related to areal and vertical sweep efficiencies.
Alkaline reacts with the reservoirs heavy oil and makes in situ soap. An examination
of injecting AP and ASP solution slugs at a lower rate so the alkaline part of the solution has
more time to react with the acid part of the oil and also pressure could remain in the
reservoir longer.
The simulation is recommended for ASP flooding to get a better understanding of
ASP flooding procedure and also forecasting future recoveries using different methods of
implementing ASP.
Measuring interfacial tension for phase behaviour analysis gives more accurate
results for choosing the best type and concentration of alkaline and surfactant. It’s highly
recommended to measure IFT precisely prior to ASP injection.
Alkaline flooding is dependent on oil acid number; therefore, it is recommended to
measure oil acid number for a more accurate investigation on the effect of alkaline flooding.
Allowing more time to AP and ASP solutions to react with reservoir oil is the key to
get higher recovery from these two EOR methods. It is recommended to examine injecting
ASP/AP solutions to the reservoir for less than 1PV and give it time to react with the
reservoir’s oil, then flush it with AP solution, ASP solution, water, or even hot water.
Pressure and temperature will cause polymer degradation. Since shallow Canadian
reservoirs have low pressure and low temperature it may provide the opportunity to

126
implement thermal polymer/ASP flooding. It is recommended to test injecting hot water
after ASP flooding or injecting ASP slugs at higher temperatures.

127
REFERENCES
Al-Hashim, H. S., Obiora, V., Al-Yousef, H. Y., Fernandez, F., and Nofal, W.: Alkaline
Surfactant Polymer Formulation for Carbonate Reservoirs. Petroleum Science and
Technology 23(5-6), 723-746 (2005)
Alsofi, A. M., Blunt, M. J.: Polymer Flooding Design and Optimization under
Uncertainty. Paper SPE 145110 presented at SPE Enhanced Oil Recovery
Conference, Kuala Lumpur, Malaysia, 19-21 July (2011)
Anderson, W. G.: Wettability Literature Survey-Part 6: The Effects of Wettability on
Water flooding. Journal of Petroleum Technology 39(12), 1605-1622 (1987)
Beckman, J. W.: The Action of Bacteria on Mineral oil. Industrial and Engineering
Chemistry 4, 23-26 (1926)
Bryan, J. and Kantzas, A.: Potential for Alkali-Surfactant Flooding in Heavy Oil
Reservoirs Through Oil-in-Water Emulsification. Paper SPE 2007-134 presented
at Canadian International Petroleum Conference, Calgary, Canada, (2007)
Butler, R. M.: Thermal Recovery of Oil and Bitumen. GravDrain Inc. Calgary, Canada,
ISBN 0-9682563-0-9 (1997)
Carcoana, A.: Results and Difficulties of the World’s Largest In-situ Combustion
Process: Suplacu de Barcaue field, Romania. Paper SPE 20248 presented at
SPE/DOE Enhanced Oil Recovery Symposium, Tulsa, Oklahoma, 22-25 April
(1990)
Carrigy, M. A.: Thermal Recovery from Tar Sands. Presented at SPE regional meeting,
Long beach, California, 25-28 March (1988)

128
Chherti, A. B. and Islam, M. R.: A Critical Review of Electromagnetic Heating for
Enhanced Oil Recovery. Petroleum Science and Technology 26(14), 1619-1631
(2008)
Cooke, JR., C. E., Williams, R. E., and Kolodzie, P. A.: Oil Recovery by Alkaline
Waterflooding. Journal of petroleum technology 26(12), 1365-1374 (1974)
Demin, W., Heng, L., Jingang, N., and Fuming, C.: Application Results and
Understanding of Several Problems of Industrial Scale Polymer Flooding in
Daqing Oil Field. Paper SPE 50928 presented at SPE International Conference
and Exhibition, China, Beijing, 2-6 November (1998)
Demin, W., Jiecheng, c., Qun, L., Lizhong, L., changjiu, Z., and Jichun, H.: An Alkaline
Bio-surfactant Polymer Flooding Pilots in Daqing Oil Field. Paper SPE 57304
presented at SPE Asia Pacific Improved Oil Recovery Conference, Kuala
Lumpur, Malaysia, 25-26 October (1999)
Demin, W., Zhenhua, Z., Chun, L., Jiecheng, C., Xingjia, D., and Qun, L.: A Pilot for
Polymer Flooding of Saertu Formation S II 10-16 in the North of Daqing Oil
Field. Paper SPE 37009 presented at SPE Asia Pacific Oil and Gas Conference,
Adelaide, Australia, 28-31 October (1996)
Derakhshanfar, M., Jia, X., Jiang, T., Zeng, F., and Gu, Y.: Effects of Water Flooding and
Solvent Injection on the Solvent Vapor Extraction (VAPEX) Heavy Oil Recovery.
Paper SPE 150691 presented at the SPE Heavy Oil Conference and Exhibition,
Kuwait City, Kuwait, 12-14 December (2011)
Donaldson, E. C., Chilingarian, G.V., and Yen, T. F.: Microbial Enhanced Oil Recovery.
Developments in Petroleum Science Vol. 22. (1989)

129
Dong, M. and Dullien, F. A. L.: Effect of Capillary Forces on Immiscible Displacement
in Porous Media. Paper SPE 56676 presented at SPE Annual Technical
Conference and Exhibition, Houston, TX, 3-6 October (1999)
Dranchuk, P. M., Scott, J. D., and Flock, D. L.: Effect of the Addition of Certain
Chemicals on Oil Recovery During Water Flooding. Journal of Canadian
petroleum technology, 13(3), 27-36 (1974)
Erno, B. P., Christ, J. R., and Wilson, R. C.: Depth-related Oil Viscosity Variation in
Canadian Heavy Oil Reservoirs. Journal of Canadian Petroleum Technology
30(3), 36-41 (1991)
Garrett, H. E.: Surface Active Chemicals. Pergamon (1972)
George, W. and Smith, C.: The Challenges in Processing Heavy Oil. Paper SPE 157894
presented at SPE Heavy Oil Conference Canada, Calgary, Alberta, Canada, 12-14
June (2012)
Green, D. W. and Willhite, G. P.: Enhanced Oil Recovery. SPE textbook Vol. 6. (1998)
Goodlett, G. O., Honarpour, F. T., Chung, F. T., and Sarathi, P. S.: The Role of Screening
and Laboratory Flow Studies in EOR Process Evaluation. Paper SPE 15172
presented at SPE Rocky Mountain regional meeting billings, Montana, (1986)
Hutchinson, J.: Heavy Oil Research in Saskatchewan. Journal of Canadian Petroleum
Technology 24(3), (1985)
Issacs, E. E. and Chow, R. S.: Emulsions: Fundamentals and Applications in the
Petroleum Industry. American Chemical Society Books (1992)

130
James, L.A., Rezaei, N., and Chatzis, I.: VAPEX, Warm VAPEX and Hybrid VAPEX –
the State of Enhanced Oil Recovery for In-situ Heavy Oils in Canada. Journal of
Canadian Petroleum Technology 47(4), April (2008)
Jenkins, G. R. and Kirkpatrick, J. W.: Twenty Years’ Operation of an In-situ Combustion
Project. Journal of Canadian Petroleum Technology 18(1), 60-66 January (1979)
Jennings, JR., H. Y., Johnson, JR., C. E., and Mcauliffe, C. D.: A Caustic Waterflooding
Process for Heavy oils. Journal of Petroleum Technology 26(12), 1344-1353
December (1974)
Johnson, JR., C. E.: Status of Caustic and Emulsion Methods. Journal of Petroleum
Technology 28(1), 85-92 January (1976)
Kasiri, N. and Bashiri, A.: Gas-Assisted Gravity Drainage (GAGD) Process for Improved
Oil Recovery. Paper IPTC 13244 presented at International Petroleum
Technology Conference, (2009)
Kazempour, M., Sundstorm, E. A., and Alvarado V.: Effect of Alkalinity on Oil
Recovery During Polymer Floods in Sandstone. Paper SPE 141331 presented at
SPE International Symposium on Oilfield Chemistry, Woodlands, Texas, USA,
11-13 April (2012)
Knight, B. L. and Rhudy, J. S.: Recovery of High-viscosity Crudes by Polymer Flooding.
Journal of Petroleum Technology 16(4), 46-55 (1977)
Lake, L. W.: Enhanced Oil Recovery. Prentice Hall (1989)
Luo, X. and Zhao, C.: Practices and Experiences of Seven-year Polymer Flooding
History Matching in China Offshore Oil Field: A Case Study. Paper SPE 147807

131
presented at SPE Reservoir Characterization and Simulation and Exhibition, Abu
Dhabi, UAE, 9-11 October (2011)
Ma. S.: Enhance Oil Recovery by Dilute Alkaline Flooding. University of Regina,
Ottawa: NLC. (2005)
Maheshwari, Y. K.: A Comparative Simulation Study of Chemical EOR Methodologies
(Alkaline, Surfactant and/or Polymer) Applied to Norne Field E-segment. (2011)
Mai, A., Bryan, J., Goodarzi, N., and Kantzas, A.: Insights into Non-thermal Recovery of
Heavy oil. Journal of Canadian Petroleum Technology 48(3), 27-35 (2009)
Majidaie. S., Tan, Isa. M., Demiral, Birol. M. R.: Review of ASP Flooding. Universitti
Teknologi PETRONAS, Malaysia, (2010)
Maudgalya, S., Knapp, R. M., and Mclnerney, M. J.: Microbial Enhanced Oil Recovery
Technologies: A Review of the Past, Present, and Future. Paper SPE 106978
Presented at Production and Operations Symposium, Oklahoma city, Oklahoma,
March31-April3 (2007)
Mcauliffe, C. D.: Oil-in-Water Emulsions and Their Flow Properties in Porous Media.
Journal of petroleum technology 25(6), 727-733 June (1973)
McCullough, J. J.: Problems of Heavy Oil Production in California. Paper WPC-6117
presented at 4th World Petroleum Congress, Rome, Italy, 353-369 June (1955)
Meybodi, H. E., Kharrat, R., and Wang, X.: Study of Microscopic and Macroscopic
Displacement Behaviors of Polymer Solution in Water-wet and Oil-wet Media.
Springer Science + Business media 89(1), 24 March (2011)
Miller, K. A.: Heavy Oil and Bitumen-not Glamorous, but Often Profitable. Journal of
Canadian Petroleum Technology 33(4), 13-15 (1994)

132
Miller, K. A.: Improving the State of the Art of Western Canadian Heavy Oil Waterflood
Technology. Journal of Canadian Petroleum Technology 45(4), April (2006)
Miller, K. A.: State of the Art of Western Canadian Heavy Oil Water Flood Technology.
Paper 2005-251 presented at the Petroleum Society’s 6th Canadian International
Petroleum Conference (56th Annual Technical meeting), Calgary, Alberta, 7-9
June (2005)
Miller, K. A. and Holub, A. J.: Applying Canadian Heavy Oil Technology to an
Argentine Heavy Oil Reservoir. Paper SPE 2000-40 presented at the Petroleum
Society’s Canadian International Petroleum Conference, Calgary, Alberta, 4-8
June (2000)
Mohammadpoor, M. and Torabi, F.: An Extensive Review on the Effective Sequence of
Heavy Oil Recovery. Paper SPE 157864 presented at SPE Heavy Oil Conference
Canada, Calgary, Alberta, 12-14 June (2012)
Moore, R. G., Laureshen, C. J., Ursenbach, M. G., Mehta. S. A., and Belgrave, J. D. M.:
A Canadian Perspective on In-situ Combustion. Journal of Canadian Petroleum
Technology 38(13), (1999)
Moore, T. F. and Slobodo, R. L.: The Effect of Viscosity and Capillarity on the
Displacement of Oil by Water. Producers monthly 20(10), August (1956)
Mungan, N.: Role of Wettability and Interfacial Tension in Water Flooding. Society of
Petroleum Engineers Journal journal 4(2), 115-123 June (1964)
Needham, R. B., and Doe, P. H.: Polymer Flooding Review. Journal of Petroleum
Technology 39(12), 1503-1507 December (1987)
133
Paul, G. W., Lake, L. W., Pope, G. A., and Young, G. B.: A Simplified Predictive Model
for Micellar-Polymer Flooding. SPE 10733 presented at SPE California Regional
Meeting, San Francisco, California, (1982)
Pope, G. A. Tsaur, K.erming, Schechter, R. S., and Wang, B.: The Effect of Several
Polymers on the Phase Behavior of Micellar Fluids. Society of Petroleum
Engineers Journal 22(6), 816-30 December (1982)
Pye, D. J.: Improved Secondary Recovery by Control of Water Mobility. Journal of
Petroleum Technology 16(8), August (1964).
Qingfeng, H., Youyi, Z., Yousong, L., and Rui, W.: Studies on Foam Flooding EOR
Techniques for Daqing Reservoirs After Polymer Flooding. Paper SPE 151955
presented at Eighteenth SPE Improved Oil Recovery Symposium, Tulsa,
Oklahoma, 14-18 April (2012)
Rai, K., Johns, T., Lake, L. W., and Delshad, M.: Oil Recovery Predictions for Surfactant
Polymer Flooding. Paper SPE 124001 presented at SPE Annual Technical
Conference and Exhibition, New Orleans, Louisiana, (2009).
Rai, K., McComb, T., Rodriguez, E., and Withers, R.: Development of a Tool to Predict
Technical Success of Polymer Flooding Applications. Paper SPE 153878
presented at Eighteenth SPE Improved Oil Recovery Symposium, Tulsa,
Oklahoma, 14-18 April (2012)
Ramirez, W. F.: Application of Optimal Control Theory to Enhanced Oil Recovery. Vol.
21. Elsevier (1987)
Rao, D. N., Ayirala, S. C., Kulkarni, M. M., and Sharma, A. P.: Development of the Gas
Assisted Gravity Drainage (GAGD) Process for Improved Light Oil Recovery.
134
Paper SPE 89357 presented at SPE/DOE fourteenth symposium on improved oil
recovery, Tusla, Oklahoma, (2004)
Reid, B.: Heavy oil in Saskatchewan. Journal of Canadian Petroleum Technology 23(1),
50 January (1984)
Reisberg, J., Doscher, T. M. Interfacial Phenomena in Crude Oil-Water Systems.
Producers monthly, 21 November (1956)
Rosen, M.J.: Surfactant and Interfacial Phenomena. Wiley Interscience (1989)
Sahni, A.: Electromagnetic Heating Methods for Heavy Oil Reservoirs. Paper SPE paper
62550 presented at SPE/AAPG Western Regional Meeting, Long Beach, CA, 19-
23 June (2000)
Sandiford, B. B.: Laboratory and Field Studies of Water Floods Using Polymer Solution
to Increase Oil Reservoirs. Journal of Petroleum Technology 16(8), 917-922
August (1964)
Shehata, A. M., Ghatas, A., Kamel, M., Aly, A., and Hassan, A.: Overview of Polymer
Flooding (EOR) in North Africa Fields – Elements of Designing a New
Polymer/Surfactant Flood Offshore (Case Study). Paper SPE 151952 presented at
North Africa technical conference and exhibition, Cairo, Egypt, 20-22 February
(2012)
Sheng, J. J.: Modern Chemical Enhanced Oil Recovery (Theory and Practice). Elsevier
(2011)
Shin, H. and Polikar, M.: Optimizing The SAGD Process in Three Canadian Oil-Tar
Sands Area. Paper SPE 95754 presented at SPE Annual Technical Conference
and Exhibition, Dallas, TX, 9-12 October (2005)

135
Singhal, A : Preliminary Review of IEPT Projects Using Polymers. Premier reservoir
engineering services LTD, Calgary, Alberta, 1 July (2011)
Skjaeveland, S. M. and Keleppe, J.: SPOR Monograph: Recent Advances in Improved Oil
Recovery Methods for North Sea sandstone reservoirs. Norwegian Petroleum
Directorate (1992)
Sohn, W.O., Maitin, B.K., and Volz, H.: Preconditioning Concepts in Polymer Flooding
in High-Salinity Reservoirs: Laboratory Investigations and Case Histories. SPE
Reservoir Engineering 5(4), 503–507 (1990)
Sorbie Blackie, K. S.: Polymer-Improved Oil Recovery. Polymer International 28(3),
(1992)
Szabo, M. T.: Laboratory Investigations of Factors Influencing Polymer Flood
Performance. Society of Petroleum Engineering Journal 15(4), 338-346 (1975)
Taber, J. J., Martin, F. D., and Seright, R. S.: EOR Screening Criteria Revisited, Part1:
Introduction to Screening Criteria and Enhanced Recovery Field Projects. Society
of Petroleum Engineering Journal 12(3), August (1997)
Torabi, F.: Secondary Oil Recovery. University of Regina, Regina, SK, (2012)
Vafaei, V.: Application of Solvent Assisted Polymer Flooding to Improve Heavy Oil
Recovery. University of Regina, Regina, SK, (2012)
Wang, D., Hao, Y., Delamaide, E., Petrole, F., Ye, Z., HA, S., and Jiang, X.: Results of
Two Polymer Flooding Pilots in the Central Area of Daqing Oil Field. Paper SPE
26401 presented at 68th Annual Technical Conference and Exhibition of the
Society of Petroleum Engineering, Houston, Texas, 3-6 October (1993)

136
Wassmuth, F. R., Green, K., Hodgins, L., and Tutra, A. T.: Polymer Flood Technology
for Heavy Oil Recovery. Paper PETSOC-2007-182 presented at Canadian
International Petroleum Conference, Calgary, Alberta, 12-14 June (2007)
Wong, F. Y., Anderson, D. B., O’Rourke, J. C., Rea, H. Q., and Schmidt, K. A.: Meeting
the Challenge to Extend Success at the Pikes Peak Steam Project to Areas with
Bottomwater. SPE Reservoir Evaluation & Engineering 6(3), June (2003)
Xue, J., Liu, X., Yuan, T., Xu, D., Ren, W., and Ning, H.: Field Tests of Polymer
Flooding in Relative Homogeneous Thick Reservoir. Paper SPE 57292 presented
at SPE Asia Pacific Improved Oil Recovery Conference, Kuala Lumpur,
Malaysia, 25-26 October (1999)
ZoBell, C. E.: Bacterial Release of Oil from Oil Bearing Materials. Part I&II. World oil
126(13), 25 August (1947)
http://newenergyandfuel.com
http://www.rogtecmagazine.com/labels/Heavy%20Oil%20Recovery.html
http://pubs.rsc.org/en/content/articlehtml/2010/ee/b918960b
http://www.imperialoil.ca/Canada-English/operations_sands_glance_101.aspx
http://www.pembina.org/oil-sands/illustrations
http://www.ucalgary.ca/ENCH/AEG/research/reskin.html
http://www.petrotel.com/?page=EOR_Polymer&lang=en
www.netl.doe.gov/technologies/oil-gas
http://www.proven-reserves.com/pdf/july_2009.pdf
http://www.epmag.com/Production/Economic-chemical-flooding-technologies_39025
http://www.egyptoil-gas.com/read_article_issues.php?AID=100

137
http://hydrocarbonrecovery.com/technology/asp_flooding
http://www.oil-chem.com/asp.htm
http://www.huskyenergy.com/downloads/newsreleases/2006/HSE_101606_Enhanced_Oi
l_Recovery.pdf
http://www.capp.ca/ENERGYSUPPLY/INNOVATIONSTORIES/AIR/Pages/Solvents-
in-situ.aspx#CLqWUIphF8kx
http://www.rogtecmagazine.com/labels/Heavy%20Oil%20Recovery.html
http://rubencharles.com/geoscience/dykstra-parson-coefficient-spreadsheet/dykstra-
parson-coefficient-permeability-variation/
www.netl.doe.gov/technologies/oil-gas./bwalkaline.PDF
http://www.belgravecorp.com/Iframe/technology/chemical-injection/chemical-
injection_3.php
http://www.albertatechfutures.ca/RDSupport/UnconventionalNaturalGasandLightOilRec
overy/EnhancedOilRecovery/PolymerFlooding.aspx
TIORCO. ASP/ASP Technologies (http://www.tiorco.com/pdf/cutsheet/ASP-
SP_cutsheet.pdf)
http://www.musical-guest.com/mobile-plant/gas-processes--principles-and-field-
applications---hemanta-k--sarma---general-screening-criteria.html