experimental strategies for the investigation of low ... · experimental strategies for the...
TRANSCRIPT

Chemical Geology, 108 ( 1993 ) 19-30 19 Elsevier Science Publishers B.V., Amsterdam
Experimental strategies for the investigation of low temperature properties in granitic and pegmatitic melts
Donald B. Dingwell Bayerisches Geoinstitut, Universitdt Bayreuth, Postfach 101251, 95440 BayreutJ~, German),
(Received February 22, 1993; revised and accepted April 8, 1993 )
ABSTRACT
The physical behavior of silicate melts during the final stages of intrusion in the earth's crust are poorly understood. In particular, the low temperature limit of igneous petrogenesis is poorly constrained. The extreme differentiates of granitic magmatism that lead to pegmatite genesis span a very large range of composition not normally considered to be within the domain of igneous melt compositions. This combination of very low petrogenetic temperatures and extreme chemistries requires a concentrated effort for the determination of melt properties under conditions of pressure, temperature and composition appropriate to these systems. An experimental strategy for the determination of melt properties under appro- priate conditions is presented. The determination of individual melt properties at very low temperatures is described with the aid of three examples, heat capacity, volume and viscosity. In this way the physical behavior of an important compo- nent of the earth's crust will become accessible.
I. Introduction
The petrogenesis of pegmatites and granites of extreme composition has, in recent years, received increasing attention in the petrologi- cal literature (see summaries by Cerny, 1982; Taylor and Strong, 1988; Martin and Cerny, 1992 ). This has resulted, in part, from a grow- ing recognition of the evidence for the exis- tence of fractionated liquids of extreme com- position that are involved in the petrogenesis of many such rocks (Manning, 1981; Benard et al., 1985; Pichavant, 1987; London et al., 1989 ). The crystallization interval of such sys- tems has often involved temperatures much lower than those traditionally thought to be the lower limit of magmatism, the upper limit of wet metamorphism. The extreme fractionates are often enriched in elements such as Cs, Li, F, B and, of course, water. This class of mag-
matism has raised a problem for the modelling of late-stage petrogenesis. There are few data and little concensus on the chemical behavior of such systems and virtually no data on the physical behavior, at the temperatures and pressures of interest.
Due to the low temperatures believed to be appropriate to the petrogenesis of such sys- tems, the database for chemical properties (e.g., partition coefficients, volatile solubili- ties, speciation, crystallization sequences ) and the physical properties (density, compressibil- ity, viscosity, thermal and chemical diffusivi- ties) sorely needs to be augmented. We have begun an experimental program to help to fill in this picture (Dingwell et al., 1992; 1993a,b; Holtz et al., 1992; 1993a,b; Knoche et al., 1992; Bagdassarov et al., 1993; Chakraborty et al., 1993 ). This paper is an overview of some pre- liminary results.
0009-2541/93/$06.00 © 1993 Elsevier Science Publishers B.V. All rights reserved.

2(t D.B. DINGWELL
2. Experimental strategies
2.1. Petrogenetic temperatures of extreme d(fferentiates
The individual strategies for the determina- tion of melt properties are presented in detail below. There are however a number of aspects common to all the experiments which can be summarized together. Firstly, a few points should be made concerning the overall ap- proach to these experiments. The first point regarding the materials investigated is that sil- icate melts are stable over a wide range of tem- perature. Liquidus temperatures can vary by more than 1000 ° C depending on composition. Even for natural felsic systems, we must con- cern ourselves with temperatures in the crys- tallization interval from near 1000°C (Turtle and Bowen, 1958) down to less than 500°C (London et al., 1989). Further, we must deal with the preservation of liquids in the meta- stable state during the cooling of melt inclu- sions (Roedder, 1984; Touret and Frezzotti, 1993 ) and glassy volcanic and hypabyssal rocks (Carmichael, 1979). When one considers the exponential temperature-dependence of trans- port properties (viscosity in particular), to- gether with their relatively large activation energies, it becomes clear that the investiga- tion of the temperature-dependence of melt properties over a large range of temperature is desirable. Precisely this temperature-depen- dence of transport properties, however, com- plicates experimental investigations in that no single method for the determination of a par- ticular property can be easily applied over the entire temperature range. Thus we are faced with the task of combining different methods for the determination of melt properties at high and low temperatures, respectively. Because of the large range of chemical components that can be enriched in late-stage granitic/pegma- titic magmatic systems up to minor /major ele- ment concentrations, we are faced with an- other challenge in the experimental
investigation of such systems. In order to ob- tain a fully general model for the prediction of melt properties we need to include a relatively large compositional database involving, where possible, "end-member" compositions for the chemical components involved. Due to the ex- treme freezing point depressions involved in these complex systems, the temperature ranges of interest for granite and pegmatite petrogen- esis are often hundreds of degrees below the li- quidus temperature of the component compo- sitions we need to use to bracket the compositional space of our system. In many cases, restricting ourselves to the investigation of liquid properties in the equilibrium (super- liquidus) state results in the exclusion of im- portant compositional ranges, vital to the suc- cess of a general model.
2.2. Quenched melts and thermal history
Here we are helped by one kinetic property of most (but not all) granite- and pegmatite- related compositions - - their quenchability or, more precisely, their glass-forming ability. The utility of obtaining a good (single-phase or crystal-free ) glass can hardly be overstated. Al- though long recognized as a cornerstone of the experimental investigation of phase relations (Shepherd et al., 1909) of silicate melts, the quantification of quenching for silicate melts to obtain low temperature structural and prop- erty data has received concentrated attention in the geoscientific literature only recently.
Why is the glassforming ability of granite- and pegmatite-related silicate melts useful for geoscientific investigations? After all, the pros- pect that the glassy state of matter plays a sig- nificant role in the petrogenesis of such intru- sive rocks can for all but the most extreme cases of heat, mass and momentum transfer during petrogenesis, be excluded. There are two an- swers to this question. Firstly, the glasses formed have structures and (temperature-de- pendent) properties which are determined by the effective temperature at which the dy-

LOW T E M P E R A T U R E PROPERTIES IN G R A N I T I C A N D PEGMATITIC MELTS 21
namic backreaction of melt species freezes in - - a fictive temperature ( or a "trapping" or "locking" temperature, if you will) of the con- figuration or ordering of structural species in the liquid. As in the analogous case for mineral order-disorder studies, the cooling history de- termines this fictive temperature. Using the cooling or quenching history of a melt as a in- dependent variable in the generation of glass we can actually investigate the temperature- dependence of structure and properties of the liquid phase via quenched, glassy products. In the past few years, the exact quantification of these glass transition temperatures and their manipulation via quench rates has been ap- plied in the geoscientific literature (Brandriss and Stebbins, 1988; Dingwell and Webb, 1989).
2.3. Quantifying thermal history
Quench rates for various methods are illus- trated schematically in Fig. 1. The sloping line
drop q u e n c h
i
i controller rate cools I i lconx entional cold-seals
pist(m cylinder power-off
/
j J -
"annealing"
splat quench
5 s p i n q u e n c h
0
4 --
r(!eJ pl'oc;tl [ e l r lpeFatuFe
Fig. 1. The range of attainable quench rates in experimen- tal investigations of silicate melts and the corresponding trapping or "f ic t ive" temperature of quenched glasses ob- tained by such methods. The horizontal lines are quench methods and the sloping line is the temperature-depen- dent relaxation time of a melt sample. The intersection of a quench rate line with the relaxation curve fixes the value of the fictive temperature. All frozen properties of the glass are related to the melt structure frozen in at this fictive temperature.
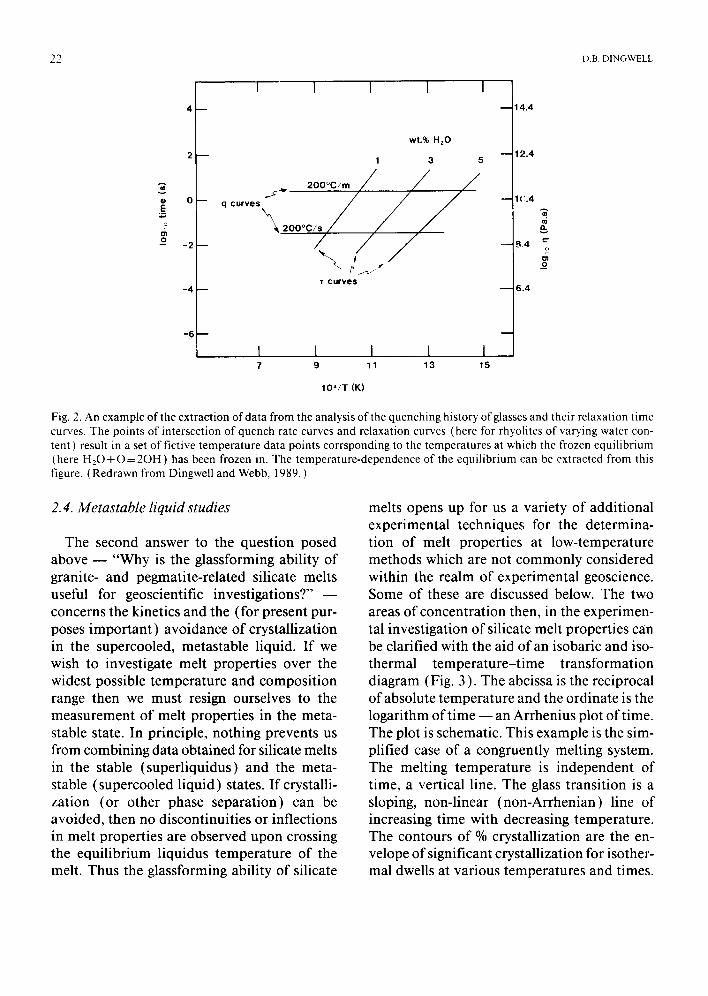
is the temperature dependent relaxation time of a silicate melt. The freezing or fictive tem- perature of quenched glasses using the various quench techniques can be read as the temper- atures of intersection of the horizontal quench rate lines with the sloping relaxation time curve. Figure 1 is particular to one specific composition and the range of fictive tempera- tures accessible by varying the quench rate us- ing such methods as i]lustrated in Fig. 1 is in practice, limited, for a particular experiment and composition. Typical ranges of 30-50 K have been obtained (Brandriss and Stebbins, 1988; Silver, 1988 ). A alternative for backcal- culating the temperature dependence of struc- ture and properties is 1:o vary the chemistry of the melt such that the relaxation curve is sig- nificantly shifted (in essence to use melt chemistry as a temperature probe). For exam- ple, the fictive temperature can be shifted hundreds of degrees, at constant quench rate, by adding water to felsic melts (Shaw, 1966). This example is outlined in Fig. 2 where the spectroscopically derived proportions of dis- sociated and molecular water, dissolved in rhyolite melts (Silver, 1988) are presented as a function of the fictive temperature of the quenched glass. Due to the fact that the fictive temperature can be altered significantly by quench rate and by composition, a wide fictive temperature range is often intrinsic in such spectroscopic studies of hydrous melts. To de- rive properties from such quenched glasses a correction for the elastic temperature (and pressure) dependence of the glass properties must be made. For the example of volume de- terminations, expansivity and compressibility data for the glass are required. Fortunately, these properties are rellatively simple to mea- sure at temperatures starting from room tem- perature and the temperature dependence of such properties can be extrapolated linearly to the glass transition.
22 D.B. DINGWELL
0 E
2 0 -2
-4
-6
I I I I
q c u r v e s
\
wt.% H20
1 3 5
T c u r v e s
I 1 I 1 I 7 9 11 13 15
I O ' / T (K)
I 14.4
12.4
1(:.4
,q.4
6.4
o
_o
Fig. 2. An example of the extraction of data from the analysis of the quenching history of glasses and their relaxation time curves. The points of intersection of quench rate curves and relaxation curves (here for rhyolites of varying water con- tent) result in a set of fictive temperature data points corrsponding to the temperatures at which the frozen equilibrium (here HzO + O = 2OH) has been frozen in. The temperature-dependence of the equilibrium can be extracted from this figure. (Redrawn from Dingwell and Webb, 1989. )
2.4. Metastable liquid studies
The second answer to the question posed above - - "Why is the glassforming ability of granite- and pegmatite-related silicate melts useful for geoscientific investigations?" - - concerns the kinetics and the (for present pur- poses important) avoidance of crystallization in the supercooled, metastable liquid. If we wish to investigate melt properties over the widest possible temperature and composition range then we must resign ourselves to the measurement of melt properties in the meta- stable state. In principle, nothing prevents us from combining data obtained for silicate melts in the stable (superliquidus) and the meta- stable (supercooled fiquid) states. If crystalli- zation (or other phase separation) can be avoided, then no discontinuities or inflections in melt properties are observed upon crossing the equilibrium liquidus temperature of the melt. Thus the glassforming ability of silicate
melts opens up for us a variety of additional experimental techniques for the determina- tion of melt properties at low-temperature methods which are not commonly considered within the realm of experimental geoscience. Some of these are discussed below. The two areas of concentration then, in the experimen- tal investigation of silicate melt properties can be clarified with the aid of an isobaric and iso- thermal temperature- t ime transformation diagram (Fig. 3 ). The abcissa is the reciprocal of absolute temperature and the ordinate is the logarithm of time - - an Arrhenius plot of time. The plot is schematic. This example is the sim- plified case of a congruently melting system. The melting temperature is independent of time, a vertical line. The glass transition is a sloping, non-linear (non-Arrhenian) line of increasing time with decreasing temperature. The contours of % crystallization are the en- velope of significant crystallization for isother- mal dwells at various temperatures and times.

LOW TEMPERATURE PROPERTIES IN GRANITIC AND PEGMATITIC MELTS 2 3
LIJ
o O~
A
liquid stable
d3
10% 1% 0 !% ~ % crystallized
,j j ~ Tlg T f ieCnavn2, c ; y s t a I,, z a t on
~ frozen
/1 ~ g ass transition /
RECIPROCAL TEMPERATURE
Fig. 3. A time-temperature plot illustrating the important features associated with chosing the experimental conditions for the investigation of the properties or structure of the undercooled liquid, in situ, in the metastable state. The regions marked A and B are the superliquidus equilibrium liquid and the subliquidus, metastable liquid domains, respectively, where experimental investigations of melt properties are possible. The TTT envelope of crystallization is excluded from experimental investigations of liquid properties as is the sub-Tg (glass transition) disequilibrium field. (Redrawn from Dingwell and Webb, 1992.)
Two regions on the diagram are of interest for the present discussion of experimental deter- minations of melt properties. The superliqui- dus region (A) is accessible for experiments on crystal-free (stable) liquids at all experimental timescales. In this region the "classical" meth- ods of high temperature, relatively low viscos- ity, determination of melt properties are car- ried out (Bockris et al., 1956; Riebling, 1966). The subliquidus region (B) between the TTT envelope of isothermal crystallization and the glass transition temperature (at relatively long timescales) is the second region of experimen- tal investigations of concern to us here. The measurement of melt properties in this zone just above the glass transition, at low temper- ature and high viscosity, constitutes the class of property measurements (common in the glass literature) that are the low temperature complement of measurements in the stable liq- uid field. Because these lower temperature measurements are in the metastable liquid field the time required for property determinations is critical. It must fall between the TTT crys-
tallization envelope and the glass transition for the temperature of interest.
One final point concerning the strategy of the metastable liquid measurements needs to be clarified. In the metastable liquid field, the dis- placive rearrangements inducing temperature- dependent changes in melt structure and the derivative melt properties are in principle path- independent. Thus any route to the metastable field of property determinations should suffice to prepare samples for measurement. We see however that the "nose" of the TTT crystalli- zation envelope (Fig. 3 ) can lie at much shorter times than our experimental dwell times dur- ing property determinations. The avoidance of crystallization just below the liquidus, during cooling of the liquid from the superliquidus state, turns out to be the greatest challenge to the preparation of metastable liquid samples for investigation. Therefore the procedure is to cool very rapidly from superliquidus tempera- tures down through the glass transition and on to room temperature. The glass can then be ex- amined by microanalytical methods for the

24 D.B. DINGWELL
presence of inhomogeneities, crystals, etc. that might exclude it from further investigation. Crystal-free, homogeneous glasses are then heated with controlled heating rates up to tem- peratures just above the glass transition for the composition and heating rate chosen. It is sub- sequently at these temperatures (area B, Fig. 3) where the measurements are carried out. Through this somewhat roundabout prepara- tion path, crystallization can be avoided dur- ing sample preparation and during sample measurement. The experimental details of sample preparation are presented below.
2.5. Sample Synthesis and Analysis
The starting materials for the generation of starting glasses are oxide and carbonate pow- ders of most of the components as well as var- ious compounds of further added components ( e.g. A1F3, NH4 ( PO3 ) 2, H3BO3 ). The powders of oxides, carbonates and other compounds are weighed directly into plastic bottles in batches corresponding to 100-120 g equivalent de- gassed weight. The powders are mixed by agi- tation for 5-10 min and then melted stepwise into flexible Pt crucibles using a MoSi2 box furnace operating at 1400-1650 ° C. The prod- ucts of the initial fusion may be inhomoge- neous in composition and phase due to the high viscosities of granitic melts. To complete the fusion and homogenize the melt products the samples are transferred with crucible to a vis- cometer furnace where they are stirred with a Pt8o-Rh2o rod at 20-100 rpm and 1400- 1675 °C for days to weeks. The general strategy is to fuse rapidly to avoid volatilization but this is not always possible (e.g. F). The fused, ho- mogenized samples are cooled slowly in the viscometer furnace to approximately 800°C and then removed to cool to room temperature in air. The cooled, quenched glasses are then prepared for the various experimental deter- minations of properties and for micro- and macroanalysis in various ways described be- low. The glasses are analysed by electron mi-
croprobe for homogeneity and by ICP-AES so- lution methods for bulk chemistry. Occasionally, certain components are ana- lysed separately by further element specific methods. The portions of the samples sub- jected to high temperature measurements are checked after the measurements.
2.6. Measurements
We call the temperature- t ime history during measurement an "excursion" above the glass transition temperature and the goal in avoid- ing crystallization (or other phase separation ) is to minimize the excursion in both tempera- ture and time. We will now present the experi- mental methods for three examples of the de- termination of melt properties at low temperatures, heat capacity, volume and ex- pansivity, and viscosity.
2.6.1. Heat capacity Of the three properties discussed here, the
measurement of heat capacity is the most straightforward. Glass cylinders are drilled from the melting crucibles following the sam- ple preparation methods discussed above. The cylinders (6.4 or 8 m m diameter) are cut to length ( 10 m m and 25 m m respectively). For glass transition temperatures below 750 °C the samples are loaded into tightfitting plat inum capsules formed from tubing, cut and welded shut at one end. The second end is shut with a tighfitting lid and the sample is loaded into a differential scanning calorimeter for the deter- mination of heat capacity. For samples with higher glass transition temperatures the 8 m m cylinders are stood in a composite alumina and plat inum capsule. All samples are heated at a constant heating rates of 1, 2 or 5 ° C / m i n un- der an atmosphere of flowing Ar gas. The mea- surements are performed up to temperature including the glass transition and (typically) a few 1 O's of degrees beyond. The trace of a suc- cessful heat capacity run is illustrated in Fig. 4a. The temperature dependent heat capacity

LOW T E M P E R A T U R E PROPERTIES IN G R A N I T I C AND P E G M A T I T I C MELTS
12
o~
(al
_N
< 0 5
o
/
f f ~
l O
20O 300 400 5O0
] EMPERA T UrHL (°C)
o l (c)
, / / ~ ,/
+o
"l o
o C 10
600 700 200 300
~T
200 300 400 500 600 700
IEMPERAIH:~E { ( )
400 500 600
TEMPERATURE ('~C)
25
b
700
Fig. 4. (a) The heat capacity of a haplogranitic melt at temperatures up to and including the glass transition temperature. The liquid value of heat capacity, useful for modelling the thermodynamic behavior of such melts during petrogenesis, can be obtained above the glass transition. It is the nearly solid-like mechanical behavior of such samples at temperatures j ust above the glass transition at such heating rates (i.e., their high viscosities) which permits such experimental investi- gations of liquid properties using methods normally reserved for solids. (b) The thermal expansivity of a haplogranitic melt at temperatures up to the glass transition temperature. The low temperature glassy value of the thermal expansivity and that of the peak, are unaffected by viscous deformation of the sample during measurement. The liquid expansivity, above the peak temperature, cannot be read from this Figure due to viscous deformation. This expansivity data, the glassy values and the peak values are used as input data for the normalisation of these and heat capacity data to obtain liquid expansivity data (see below). (c) A normalised comparison of the temperature dependent heat capacity and expansivity ofa haplogranitic sample at temperatures up to and above the glass transition temperature. Through such a normalisation, the equivalence of the kinetic parameters controlling the hysterisis in the glass transition interval, the peak and glassy values of the properties can be equated and thus the liquid values of the expansivity are accessible. Such volume and expansivity data form an important source of low temperature property data for granitic melts at near-magmatic temper- atures. (Redrawn from Dingwell et al., 1993b. )
of the glass is clearly seen as the low tempera- ture sloping segment. The glass transition re- gion is indicated by the sharp rise in "appar- ent" heat capacity and subsequent overshoot in its value to form the peak. At temperatures above the peak the curve returns to a nearly temperature-independent value of heat capac- ity, higher than that of the glass. This high tem-
perature segment is the heat capacity of the metastable liquid.
2.6.2. Density and expansivity The starting point for the low temperature
determination of the density and expansivity of the samples is the determination of density of the glass with a known thermal history at
26 D.B. DINGWELL
room temperature. This is performed using a Berman balance and toluol liquid. The tem- perature dependent volume of the sample is measured at temperatures up to the glass tran- sition temperature using push-rod scanning di- latometry at the same heating and subsequent cooling rates as are used for the scanning calor- imetry. A typical trace for the expansivity of a sample is given in Fig. 4b where again, as is the case for heat capacity, the low temperature lin- ear segment is the glassy value of the expansiv- ity and the peak indicates the temperature of the glass transition. The curve beyond the peak temperature falls to anomalously low values of the expansivity, not to equilibrium values of the liquid expansivity. This is because we are measuring the linear expansion of a liquid at this point and the viscous flow of the sample under its own weight is becoming perceptible, detracting from the cylinder height and thus the apparent expansivity. Nevertheless, the vis- cous deformation up to the peak temperature can be shown to be insignificant in comparison to the length change due to expansivity (Webb
et al., 1992). Thus we can integrate the sample length up to the peak temperature on the basis of the room temperature density and the tem- perature dependent expansivity and obtain a volume data point for the relaxed, metastable, undercooled liquid at the glass transition temperature.
But we can do more than this. Based on the equivalence of the size, shape and temperature of the glass transition feature in both calori- metry and dilatometry we can infer the equiv- alence of the underlying kinetic control on the relaxation or equilibration of both volume and enthalpy. This empirical inference is backed up by all subsequent tests for consistency of the data which we have performed using this method (e.g., Knoche et al., 1992; Webb et al., 1992; Dingwell et al., 1993a). To compare the dilatometry and calorimetry, they are both normalized using the temperature derivative of fictive temperature. In the glass this is equal to zero because the structure and thus the fictive temperature is constant. In the liquid the de- rivative equals 1 because local (metastable)
o E
~E 0 iii
_J 0
cr
._1 0
J 28 ~1"1111 ~ haplogranite melts
26
24
22
2o 1 18
16
14
12 0
V (cm 3 mot ~) = 28.09 (1-XF20)1 +_ 14.23 XFO_~
0.4 O.6
MOLE FRACTION F20 -1
0.2
fluoride melt
fictive component
. "t I
0.8 1 0
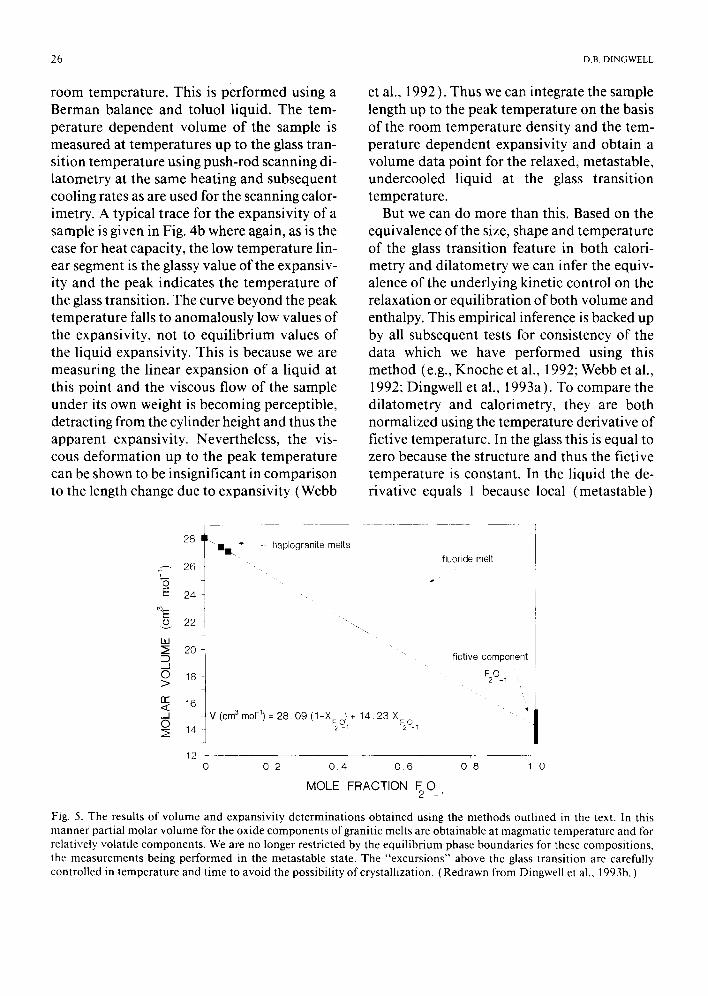
Fig. 5. The results of volume and expansivity determinations obtained using the methods outlined in the text. In this manner partial molar volume for the oxide components of granitic melts are obtainable at magmatic temperature and for relatively volatile components. We are no longer restricted by the equilibrium phase boundaries for these compositions, the measurements being performed in the metastable state. The "excursions" above the glass transition are carefully controlled in temperature and t ime to avoid the possibility of crystallization. (Redrawn from Dingwell et al., 1993b. )

LOW TEMPERATURE PROPERTIES IN GRANITIC AND PEGMATITIC MELTS 27
equilibrium exists and thus the fictive temper- ature equals the actual temperature. A plot of this normalization is presented in Fig. 4c. In- stead of normalizing the liquid values of the properties to 1 we normalize the peak heights to 1. This is arbitrary as long as the normali- zation is linear. The normalized calorimetric curve can now be used to extrapolate the dila- tometric curve to temperatures above the glass transition and to thereby obtain data for the liquid expansivity. These expansivity data compare excellently with the expansivity at these temperatures generated from fits of these low temperature volume data together with high temperature data derived from Archime- dean density determinations. The derivation of expansivity data is critically important for two reasons. Firstly to allow an estimate of the vol- ume-temperature relationship, by interpola- tion between these data and those of high tem- perature determinations into the experimentally inaccessible but geologically relevant crystallization interval and secondly, to compare data derived from different glass transition temperatures (for different compo- sitions) under isothermal conditions such that partial molar volumes for the melt compo- nents can be estimated and a volume-compo- sition model built up for granitic melts at mag- matically meaningful temperatures. Figure 5 illustrates the effect of the addition of F on the density of a haplogranite base composition at 750°C.
2.6.3. Viscosity A variety of geometries are available for the
determination of viscosities at low tempera- tures and high viscosities. Below 1000°C quartz glass dilatometers are used in our lab employing geometries of axial cylinder compression (e.g. Bagdassarov and Dingwell, 1992) fiber elongation (Webb and Dingwell, 1989) and micropenetration of spheres (Dingwell et al., 1992). These low tempera- ture geometries involve volume and shear components of deformation, at least during
initial loading, and care must be taken to ob- tain time invariant, Newtonian data. As a rule- of-thumb the value of 1014 poise is an upper limit to the routine laboratory investigation of melt viscosities. Higher viscosities imply longer relaxation times (10 ~ sec) and correspond- ingly long measurement schedules. Normally, the time evolution of strain is recorded at con- stant load. Viscosity data obtained at low tem- peratures and high viscosities are particularly useful for evaluation of the extent of non-line- arity in the compositional dependence of vis- cosity. The non-additivity of viscosity can be reconciled quantitatively with the notion that the configurational entropy of the melt is in- versely proportional to viscosity (Adam and Gibbs, 1969; Richet, 1984). Thus lower tem- perature systems have higher contributions to the total entropy ari,;ing from entropies of mixing (e.g. of alkalies) and correspondingly larger deviations from additivity. For the chemically complex systems of extreme differ- entiates of granitic melts, the development of solution models and sources of entropy data appear fated to lag substantially behind the ex- perimental determination of melt viscosity with the consequence that much more 1 atm and high pressure viscometry needs to be done. The individual effects of F, B and P on the vis- cosity of a haplogranite are illustrated in Fig. 6. From this illustration it is clear that the in- dividual effects of such components at these high viscosities are vevy large indeed. The tem- peratures in Fig. 6 are still relatively high for our purposes and the addition of water to these anhydrous bases will next be investigated. High pressure data have been traditionally obtained with the falling sphere (Stokesian) viscometer but high pressure dilatometric data exist for wet rhyolites from the 1950's (Sabatier, 1956). Both of these methods will be refined in the coming years.
2. 7. Prospective
The list of properties for investigation at low temperatures using the above strategy is by no

2~ D.B. DINGWELL
126
12.2 / H P G 8 / "
i
~ 110
0
10 2
i i
8 9
B5 /
/ / ' i
/
J , /
ii/'/'~/ ]ii
10 11 12 10,O00/T(K)
Fig. 6. The effects o fF20_ ~, P205 and BxO 3 on the viscosity ofa haplogranitic melt. Data obtained using the micropene- tration method. (Redrawn from Dingwell et al., 1993c. )
means complete, and the advantage of work- ing with volatile components at low tempera- tures can be retained for other property deter- minations. A further proven example is low frequency shear modulus determinations (Bagdassarov et al., 1993). One further un- tried example is the determination of surface tension by the sessile drop method. Another possibility is the determination of compressi- bility from dynamic loading experiments in di- latometry. In addition we have said nothing of the possibilities of spectroscopic retrieval of melt properties (e.g. elastic constants from Brillouin scattering) under these conditions. Many paths remain to be explored.
The application of the techniques described above to pressures above 1 bar await further optimization of scanning dilatometry and ca- lorimetry for use in hydrothermal or internally heated pressure vessels. These developments are currently in the planning stage. The appli- cation of such methods at 500-1500 bar will substantially improve in particular our under- standing of the role of water in these melts. The inclusion of water in such experiments also opens up qualitatively new aspects of kinetic
studies of silicate melts. One example, con- cerning fluid inclusions, can be illustrated with the help of Fig. 7. Consider an isothermal ex-
~ ~ isobar ic quench
0 ~ chemica l equilibration
H20 isochores
f~x \ 4 " 7 glass t r ans i t i on [ m~ ~ (fast and s!ow
L ~ ~ . . . ~ _ ~ coohng)
Temperature
Fig. 7. A schematic description of a hypothetical experi- mental concerning the information contained in fluid in- clusions trapped in water-saturated melts during isobaric quenching. The phase diagram of H20 is plotted, together with the projection of the glass transition in pressure- temperature space. For a vesicular melt sample, equili- brated above the glass transition temperature, and sub- jected to an isobaric quench, the temperature of "trap- ping" of the fluid inclusions corresponds to the glass transition temperature at the pressure of the quench. This temperature can be extracted by homogenization temper- ature measurements on the fluid inclusions. Varying the quench rate will shift the glass transition curves such that the temperature dependence of viscosity might be acces- sible by this method.

LOW TEMPERATURE PROPERTIES IN GRANITIC AND PEGMATITIC MELTS 29
periment where saturation of a powder of granitic glass with water results in the genera- tion of a highly vesicular glass whose vesicles contain fluid inclusions. If the viscosity of the melt is too high the fluid inclusions remain trapped in the liquid during the experimental dwell to be quenched into the glass during the cooling of the experiment. The PVT path of the fluid inclusion can yield information on the glass transition temperature and thus viscos- ity, at hydrothermal pressures. Figure 7 illus- trates the phase diagram of water and the path of the glass transition of a hydrous granitic melt in pressure and temperature (PT) space. The horizontal line in Fig. 7 symbolizes an isobaric quench. If the saturated, inclusion-bearing melt is quenched isobarically then the temperature of the "trapping" of the fluid inclusion can be equated to the glass transition temperature (for the given quench rate) at the pressure of the quench. This is because the volume of the sili- cate melt will, by definition, relax to lower and lower values in equilibrium with the tempera- ture during the quench until the glass transi- tion is reached. Subsequent to crossing the glass transition temperature the frozen glass can only respond in volume by elastic contraction. Upon reaching room temperature the glass expands elastically during the decompression to 1 bar and room temperature density. The elastic ex- pansivity and compressibility are small correc- tions to glass volume and can be measured us- ing "bench top" methods at temperatures near room temperature. Accounting for these small corrections, the density of the fluid inclusions and their homogenization temperatures can be measured using conventional fluid inclusion means and the trapping or glass transition temperature can be determined by following the isochore from the homogenization temper- ature to the pressure of the isobaric quench. Varying the quench rate shifts the glass transi- tion curve in PT space and the activation en- ergy of viscosity can be estimated from such measurements at very low temperatures. This
method is being tested at present (Romano and Dingwell, 1993 ).
3. Conclusion
An array of low temperature property deter- minations is being built up for the purpose of constructing a predictive model of granitic/ pegmatitic melt properties at the very low tem- perature limits of igneous petrogenesis. These systems represent a component of the conti- nental crust whose mechanical and chemical behavior is very difficult to predict at present. The range of chemistry is very large. The sys- tems represent a chemical and physical probe of the behavior of the continental crust at the low temperature extreme of igneous petrogen- esis. Despite their underinvestigation to date the next few years should lead to a substantial improvement in our knowledge of the physical behavior of such systems.
Acknowledgments
The paper represents an early progress re- port of ongoing research into the physical and chemical behavior of granitic melt systems via experimental methods. The work to date is the fruit of collaboration with several individuals including especially R. Knoche, S. Webb, N. Bagdassarov, S. Chakraborty, F. Holtz, H. Behrens, M. Chaussidon and C. Romano. Past and present support for this work includes funds of the Bayerisches Geoinstitut, as well as the A. v. Humboldt Foundation, Deutsche Forschungsgemeinschaft grants Di 431/2-1 and Di 431/3-1 (Gerhard-Hess-Programm) and EG (Council of Europe) Grant EV5V- CT92-O 178.
References
Adam, G. and Gibbs, J.H., 1965. On the temperature-de- pendence of cooperative relaxation properties in glass- forming liquids. J. Chem. Phys., 43:136-146.
Bagdassarov, N.S. and Dingwell, D.B., 1992. A theologi- cal investigation of vesicular rhyolite. J. Volc. Geoth- erm. Res., 50: 307-322.

30 D.B. DINGWELL
Bagdassarov, N.S., Dingwell, D.B. and Webb, S.L., 1993. Effects of boron, phosphorus and fluorine on shear stress relaxation in haplogranite melts. Eur. J. Min- eral., in press.
Benard, F., Moutou, P. and Pichavant, M., 1985. Phase relations of tourmaline teucogranites and the signifi- cance of tourmaline in silicic magmas. J. Geol., 93: 271-291.
Bockris, J.O'M., Tomlinson, J.W. and White, J.L., 1956. The structure of liquid silicates: partial molar volumes and expansivities. Faraday Soc. Trans., 52:299-310.
Brandriss, M.E. and Stebbins, J.F., 1988. Effects of tem- perature on the structure of silicate liquids. 298i NMR results. Geochim. Cosmochim. Acta, 52: 2659-2669.
Carmichael, I.S.E., 1979. Glass and the glassy rocks. In: H.S. Yoder, (Editor), The Evolution of the Igneous Rocks. Princeton University Press, Princeton, N J, 588 PP.
Cerny, P., 1982. Granitic Pegmatites in Science and In- dustry. Min. Assoc. Can. Short Course Notes, 555 pp.
Chakraborty, S., Dingwell, D.B. and Chaussidon, M., 1993. Chemical diffusion of boron in melts of haplo- granitic composition. Geochim. Cosmochim. Acta, in press.
Dingwell, D.B. and Webb, S.L., 1989. Relaxation in sili- cate melts. Eur. J. Mineral., 2: 427-449.
Dingwell, D.B. and Webb, S.L., 1992. The fluxing effect of fluorine at magmatic temperatures (600-800°C) - - A scanning calorimetric study. Am. Mineral., 77: 30- 33.
Dingwell, D.B., Knoche, R. Webb, S.L. and Pichavant, M., 1992. The effect of B203 on the viscosity of haplogran- itic liquids. 77: 457-461.
Dingwell, D.B., Knoche, R. and Webb, S.L., 1993a. A vol- ume temperature relationship for liquid GeO2 and some geophysically relevant derived parameters for network liquids. Phys. Chem. Mineral., 19: 445-453.
Dingwell, D.B., Knoche, R. and Webb, S.L., 1993b. The effect of F on the density of haplogranitic melt. Am. Mineral., in press.
Dingwell, D.B., Knoche, R. and Webb, S.L., 1993c. The effect of P205 on the viscosity of haplogranitic liquid. Eur. J. Mineral., 5: 133-140.
Holtz, F., Behrens, H., Dingwell, D.B. and Taylor, R.P., 1992. Water solubility in melts of haplogranite com- position at 2 kbar. Chem. Geol., 96: 289-302.
Holtz, F., Dingwell, D.B. and Behrens, H., 1993a. Effects of F, B203 and P205 on the solubility of water in hap- logranite melts compared to natural silicate melts. Contrib. Mineral. Petrol., 113:492-501.
Holtz, F., Behrens, H. and Dingwell, D.B., 1993b. The pressure- and temperature-dependence of water solu- bility in haplogranitic melts. In preparation.
Knoche, R., Webb, S.L. and Dingwell, D.B., 1992. A par- tial molar volume for B203 in haplogranitic melt. Can. Mineral.. 30:561-569.
London, D., 1992. The application of experimental pe- trology to the genesis and crystallization of granitic pegmatites., Can Mineral., 30: 499-540.
London, D., Morgan, G.B. VI and Hervig, R.L., 1989. Va- por-undersaturated experiments with Macusani glass. +water at 200 MPa and the internal differentia- tion of granitic pegmatites. Contrib. Mineral. Petrol., 102: 1-17.
Manning, D.A.C., 1981. The effect of fluorine on liquidus phase relationships in the system qz-ab-or with excess water at 1 kb. Contrib. Mineral. Petrol., 76:206-215.
Martin, R.F. and Cerny, P., 1992. Granitic Pegmatites. Special Issue. Can. Mineral., 30: 497-937.
Pichavant, M., 1987. Effects ofB203 and H20 on liquidus phase relations in the haplogranite system at 1 kbar. Am. Mineral., 72: 1056-1070.
Richet, P., 1984. Viscosity and configurational entropy of silicate melts., Geochim. Cosmochim. Acta, 48: 471- 483.
Riebling, E.F., 1966. Structure of sodium aluminosilicate melts containing at least 50 mole% SiO2., J. Chem. Phys., 44: 1857-1865.
Roedder, E., 1984. Fluid Inclusions. Rev. Mineral. 12, Mineral. Soc. Am., Washington, DC, 644 pp.
Romano, C. and Dingwell, D.B., 1993. Composition-de- pendence of water speciation in melts in the system KA1Si3Os-NaA1Si3Os-LiAI:Si3Os. Terra Abstr., 5: 522- 523.
Sabatier, G., 1956. Influence de la teneur en eau sur la viscosit6 d'une retinite, w~rre ayant la composition chimique d'un granite. C.R. Acad. Sci. Paris: 1340- 1342.
Shaw, H.R., 1966. Obsidian-H20 viscosities at 2 kbar and 800 to 1000°C. J. Geophys. Res., 68: 6337-6343.
Shepherd, E.S., Rankin, G.A. and Wright, F.E., 1909. The binary systems of alumina with silica, lime and mag- nesia., Am. J. Sci., 4th Ser., 28: 293-333.
Silver, L.A., 1988. Water in silicate glasses. Ph.D. Thesis, Caltech, 238 pp.
Taylor, R.P. and Strong, D.F., 1988. Recent advances in the geology of granite-related mineral deposits. Can. Inst. Min. Metall. Spec. Vo][. 39,445 pp.
Touret, J.L.R. and Frezzotti, M.L., 1993. Magmatic rem- nants in plutonic rocks. Bull. Soc. Geol. Ft., 2: 229- 242.
Turtle, O.F. and Bowen, N.L., 1958. Origin of granite in the light of experimental studies in the system NaA1- Si3Os-KAISi3Os-H/O. Geol. Soc. Am. Mem.: 74.
Webb, S.L. and Dingwell, D.B., 1990. Non-Newtonian theology of igneous melts at high stresses and strain rates. Experimental results for rhyolite, andesite, ba- salt. J. Geophys. Res., 95: 15695-15701.
Webb, S.L., Knoche, R. and Dingwell, D.B., 1992. Deter- mination of silicate liquid thermal expansivity using dilatometry and calorimetry. Eur. J. Mineral., 4: 95- 104.