experimental solanumincanum l poisoning in sheep and goats
TRANSCRIPT
-1 -
EXPERIMENTAL SOLANUMINCANUM L POISONING INSHEEP AND GOATS ̂
BY
%
ANDREW GITAU THAIYAH, BVM, MSC
A Thesis submitted in fulfillment of the requirements for the Doctor o f Philosophy
degree in the University o f Nairobi.
Department of Clinical Studies
Faculty of veterinary Medicine
University of Nairobi,
Kenya.
2007.
U n M K S ity of NAIROBI l ib r a r y
i i i i i i n i i i i0524493 4

D E C L A R A T I O N
This Thesis is my original work and has not been presented for a degree in any other
University.
This thesis has been submitted for examination with our approval as University
supervisors.
Prof. P. N. Nyaga (BVM, MPVM, PhD)
Dept, o f Veterinary Pathology, Microbiology and Parasitology
Dept, o f Clinical Studies

- Ill -
ACKNOWLEDGEMENTS
I wish to express my sincere gratitude to my first supervisor Prof. P. N. Nyaga of the
Department o f Veterinary Pathology, Microbiology and Parasitology for his
encouragement and guidance through discussions and valuable suggestions at all stages
in the course o f these studies. He is one person who believed in me and gave all to my
success. God bless you my friend and mentor. My gratitude also goes to my second
supervisor Prof. Jj M. Maribei of Clinical Studies Department for his concern throughout
the study. My gratitude also goes to the late Dr. D. J. Muchiri for his valuable help during
the initiation o f this work. May God rest his soul in eternal peace.
Special thanks go to the German Academic Exchange (DAAD), who funded the entire
scholarship and to the late Prof. G. Mugera and Prof. Ngatia and Kimeto and Dr. Mbuthia
for their invaluable help in pathology and histological examination o f slides.
My sincere gratitude also goes to Mr. Gitahi, Mr. Nduhiu, Mr. Gitau and Mrs. Elsie
Wambui, technical staff o f the Department o f Clinical Studies who helped in analyzing
the b lood s amples. I a m m ost g rateful t o M r. Jo hn M wongi a nd Daniel Sembe o f t he
Department o f Vet. Pathology, Microbiology and Parasitology, for processing all
histology slides, and to Ms. Rose Nyawira for excellent photography.
I am also grateful to the University of Nairobi for providing the basic infrastructure.
Finally, I wish to thank my immediate family members who have continued to encourage
and to pray for me.
May the blessings of the Lord be upon you

DEDICATIO N
This thesis is dedicated to my family and to the almighty God for His invaluable help and
guidance throughout this work.

TABLE OF CONTENTS
DECLARATION ......................................................................................................................ii
ACKNOWLEDGEMENTS..................................................................................................... iii
DEDICATION........................................................................................................................... iv
TABLE OF CONTENTS......................................................................................................... v
LIST OF TABLES.................................................................................................................... xi
LIST FIGURES........................................................................................................................xii
LIST OF ABBREVIATIONS................................................................................................xiii
ABSTRACT.............................................................................................................................. xv
CHAPTER 1............................................................................................................................... 1
1.0 INTRODUCTION.......................................................................................................1
1.1 HYPOTHESIS............................................................................................................. 3
CHAPTER 2................................................................................................................ 4
2.0 LITERATURE REVIEW............................................................................................4
2.1 General remarks............................................................................................................4
2.2 Measures of toxicity in animals.................................................................................. 5
2.3 Toxicants in plants....................................................................................................... 6
2.4 Toxicological work on some Kenyan plants............................................................. 6
2.5 EFFECTS OF POISONOUS PLANTS ON ANIMALS..................................... 10
2.5.1 Hepatotoxic plants...................................................................................................... 10
2.5.2 Cardio toxic plants.................................................................................................... 11
2.5.3 Nephrotoxic p lants................................................................................................... 11
2.5.4 Plant poisoning that causes disturbance in reproduction.......................................11
2.5.5 Plant induced pulmonary disturbances....................................................................11
2.5.6 Plants affecting the haematopoietic system..............................................................12
2.5.7 Plants that cause sudden death ..................................................................................12
2.5.8 Plants that affect the gastrointestinal tract................................................................12
2.5.9 Neurotoxic plants....................................................................................................... 13
2.5.10 Plants causing lesions in the musculoskeletal system............................................ 13
2.5.11 Plants causing lesions in the cutaneous system.......................................................13
2.5.12 Plant toxicants shed in milk.......................................................................................14
2.6 Solanum species.........................................................................................................15
2.6.1 Solanum species other than S. incanum L ................................................................15
2.6.2 Solanum incanum L....................................................................................................17
2.6.2.1 Distribution.................................................................................................................17
2.6.2.2 Use o f Solanum incanum L in traditional medicine.............................................18
2.6.2.3 Solanum incanum L toxicity in m an......................................................................19
2.6.2.4 Active principle........................................................................................................19
2.6.2.5 Toxicity studies in animals..................................................................................... 19
- v i -
CHAPTER 3 ,21

3.0 MATERIALS AND METHODS..............................................................................21
3.1 Plant material...............................................................................................................21
3.2 Experimental animals.................................................................................................21
3.3 Experiment 1: Determination of acute LD50 o f Solanum incanum L .....................22
3.3.1 Description of method used in LD50 determination................................................ 22
3.3.2 Determination o f acute oral LD50 of Solanum incanum L in goats and sheep.... 23
3.3.2.4 Clinical examination of animals in the LD50 experiment........................................ 24
3.3.2.5 Post mortem examination o f animals in the LD50 experiment.................................24
3.4 Experiment 2: Determination of the prolonged toxic effects..................................25
3.4.1 Clinical examination of anim als................................................................................ 25
3.4.2 Blood sampling........................................................................................................... 25
3.4.3 Handling of blood samples........................................................................................26
3.4.4 Post mortem examination o f dead animals...............................................................26
3.5 Experiment 3: Determination of the prolonged toxic effects................................ 26
3.6 Procedures for the tests.............................................................................................. 27
3.6.1 Haematological examination.....................................................................................27
3.6.2 Serum enzyme and protein examination..................................................................27
3.7 Statistical analysis.......................................................................................................28
CHAPTER 4................................................................................................................29
4.0 RESULTS....................................................................................................................29
4.1 Results of dose determination experiments............................................................... 29
4.2 Result of the LD50 determination.............................................................................. 29
4.2.1 LD50 determination in goats........................................................................................29
- v i i -

4.2.1.1 Clinical manifestation for goats in the LD50 experiment........................................30
4.2.1.2. Post mortem examination o f goats in the LD50 experiment................................. 30
4.2.2 Results of LD50 determination in sheep..................................................................30
4.2.2.1. Clinical manifestation for sheep in the LD50 experiment.......................................31
4.2.2.2. Postmortem examination o f sheep in the LD50 experiment.................................. 31
4.3 Results of prolonged toxicity of S. incanum L .......................................................31
4.3.1 Results o f clinical manifestation..............................................................................31
4.3.1.1 Clinical manifestation o f toxicity in goats.............................................................. 32
4.3.1.1.1 Clinical manifestation in Group 3 goats............................................................... 32
4.3.1.1.2 Clinical manifestation in group 2 goats................................................................. 32
4.3.1.1.3.Clinical manifestation in group 1 goats................................................................. 32
4.3.1.2 Clinical manifestation of toxicity in sheep............................................................. 32
4.3.1.2.1 Clinical manifestation in group 3 sheep................................................................. 32
4.3.1.2.2. Clinical manifestation in group 2 sheep.............................................................. 33
4.3.1.2.3 Clinical manifestation in group 1 sheep................................................................. 33
4.4 Results o f change in weight in sheep and goats.................................................... 35
4.5 Results of the haematological investigation.......................................................... 37
4.5.1 Haematological findings in goats.............................................................................37
4.5.2. Haematological findings in sheep.......................................................................... 37
4.6 Results of analysis on serum biochemical parameters........................................ 41
4.6.1 Serum biochemical findings in goats.......................................................................41
4.6.2 Serum biochemical findings in sheep.......................................................................42
- viii -

4.7 Results of Pathological examination........................................................................45
4.7.1 Pathological findings in goats.................................................................................45
4.7.1.1. Pathological findings in group 3 goats.....................................................................45
4.7.1.2. Pathological findings in group 2 goats.....................................................................45
4.7.1.3. Pathological findings in group 1 goats.....................................................................45
4.7.2 Pathological findings in sheep..................................................................................45
4.7.2.1. Pathological findings in group 3 sheep................................................................... 45
4.7.2.2. Pathological findings in group 2 sheep................................................................... 46
4.7.2.3. Pathological findings in group 1 sheep................................................................... 46
4.8 Results of Histological findings in sheep and goats..............................................48
4.8.1 Histological findings in goats.................................................................................. 48
4.8.1.1. Histological findings in group 3 in goats............................................................... 48
4.8.1.2. Histological findings in group 2 goats................................................................... 48
4.8.1.3. Histological findings in group 1 goats................................................................... 49
4.8.2 Histological findings in sheep.................................................................................49
4.8.2.1. Histological findings in group 3 sheep.................................................................. 49
4.8.2.2. Histological findings in group 2 sheep.................................................................. 49
4.8.2.3. Histological findings in group 1 sheep.................................................................. 50
CHAPTER 5............................................................................................................. 54
5.0 DISCUSSION...........................................................................................................54
CHAPTER 6.............................................................................................................. 62
6.0 CONCLUSION........................................................................................................ 62
- ix -

7.0 REFERENCES.........................................................................................................64
8.0 LIST OF APPENDICES..........................................................................................79
Appendix 1: A. Calculation of LD5o in goats (Weil, 1952)...............................................79
B. Calculation of LD5o in sheep (Weil, 1952).............................................80
Appendix 2. Extract o f table from biometrics......................................................................82
Appendix 3: Mean weight (Kg) over time (weeks) in goats and sheep...........................83
Appendix 4: Mean White blood cells (/pL) against time (weeks) in goats and sheep.. 84
Appendix 5: Mean Packed cell volume (%) against time (weeks) in goats and sheep.. 85
Appendix 6 : Mean total protein (mg/dl) against time (weeks) in goats and sheep...... 86
Appendix 7: Mean Alkaline phosphatase (U/L) against time (weeks)p..........................87

- XI -
LIST OF TABLES
Table 1. Mortalities recorded in sheep and goats in the dose finding experiment........... 29
Table 2: Mortality data per dose group in the LD50 experiment in goats .........................30
Table 3: Mortality data per dosage group in sheep in the LD50 experiment......................31
Table 4. Main clinical signs recorded per species per dosage g roup ............................... 34
Table 5. ANOVA table for weights in sheep and goats .................................................... 35
Table 6. Mean values o f PCV, WBC, RBC and total protein ......................................... 38
Table 7. Mean and standard deviation values for total protein.........................................41
Table 8. Mean and standard deviation values for total Protein.........................................42
Table 9. Gross pathological findings in sheep and goats.................................................... 47

- xii -
LIST FIGURES
Fig.l Mean weight (kg) in (a) goats and (b) sheep against time (Weeks)......................36
Fig.2 Mean PCV (%) against time (weeks) in (a) goats and (b) sheep...........................39
Fig.3 Mean WBC (/ul) against time (weeks) in (a) goats and (b) sheep.........................40
Fig.4 Mean TP (mg/dl) against time (weeks) in (a) goats and (b) sheep........................43
Fig.5 Mean AP (u/1) against time (weeks) in (a) goats and (b) sheep............................. 44
Fig.6 Brain tissue of sheep and goats................................................................................. 51
Fig.7 Liver tissue from sheep and goats............................................................................ 52
Fig.8 Normal liver and brain of sheep...............................................................................53

- X l l l -
LIST OF ABBREVIATIONS
ALT Alanine aminotransferase
ANOVA Analysis o f variance
AP Alkaline phosphatase
AST Aspartate aminotransferase
b. wt body weight
dl decilitre
ED50 median effective dose
g/dl grams per decilitre
GGT gamma glutamyltransferase
Hb haemoglobin
H & E haematoxylin and eosin
LD5o Median lethal dose
MCV mean corpuscular volume
mg/dl milligrams per decilitre
mis milliliters
PCV packed cell volume
RBC red blood cell count
rpm revolutions per minute
TP total protein
u/1 units per litre
Pi microlitre
WBC white blood cell count

- XIV -
EDTA Ethylenediamine tetra-acetic acid

- XV
ABSTRACT
Solatium incanum L. is a shrub found in many areas of Kenya. The toxicity of ripe
Solatium incanum L fruits has been carried out in sheep and goats with no effect.
However, unripe fruits are more abundant and goats and sheep may be more easily
attracted to eat unripe fruits. The toxicity of such unripe fruits of Solanum incanum L has
not been tested in sheep and goats. This study was, thus, undertaken to find out the toxic
effects of unripe fruits o f Solanum incanum L in goats and sheep.
Powdered unripe fruits o f S. incanum L were used to determine the LD50 and the toxic
effects. Toxicity was determined by drenching the animals with the powder suspended in
water in three doses; Groupl (0.25 LD50), Group 2 (0.5 LD50) and group 3 (0.75 LD50)
and observing for clinical signs and haematological, biochemical, necropsy and
histopathological findings.
The LD50 was 4.8g and 3.0g/kg body weight in sheep and goats, respectively. In group 3:
one goat had diarrhoea from day 3 until death at day 14. One other goat died on day 15 of
the experiment after showing signs of coughing, anorexia, depression with the head held
low, staggering gait and continuous bleating while one goat survived to the end of the
experiment without signs of toxicity. One group 2 goat had bloat, shivering, progressive
weakness, depression, staggering gait, lateral recumbency, leg paddling movements and
continuous bleating before death on day 24 of the experiment while three others did not
show clinical signs. All group 1 goats did not show clinical signs.
- XVI -
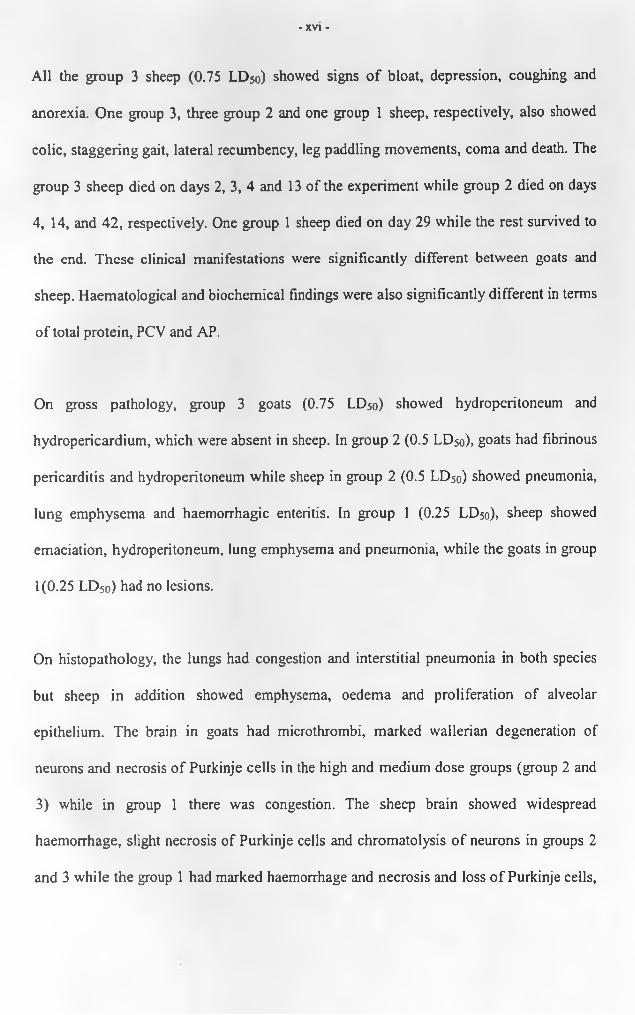
All the group 3 sheep (0.75 LD50) showed signs o f bloat, depression, coughing and
anorexia. One group 3, three group 2 and one group 1 sheep, respectively, also showed
colic, staggering gait, lateral recumbency, leg paddling movements, coma and death. The
group 3 sheep died on days 2, 3, 4 and 13 of the experiment while group 2 died on days
4, 14, and 42, respectively. One group 1 sheep died on day 29 while the rest survived to
the end. These clinical manifestations were significantly different between goats and
sheep. Haematological and biochemical findings were also significantly different in terms
of total protein, PCV and AP.
On gross pathology, group 3 goats (0.75 LD50) showed hydroperitoneum and
hydropericardium, which were absent in sheep. In group 2 (0.5 LD50), goats had fibrinous
pericarditis and hydroperitoneum while sheep in group 2 (0.5 LD50) showed pneumonia,
lung emphysema and haemorrhagic enteritis. In group 1 (0.25 LD50), sheep showed
emaciation, hydroperitoneum, lung emphysema and pneumonia, while the goats in group
1(0.25 LD50) had no lesions.
On histopathology, the lungs had congestion and interstitial pneumonia in both species
but sheep in addition showed emphysema, oedema and proliferation of alveolar
epithelium. The brain in goats had microthrombi, marked wallerian degeneration of
neurons and necrosis of Purkinje cells in the high and medium dose groups (group 2 and
3) while in group 1 there was congestion. The sheep brain showed widespread
haemorrhage, slight necrosis of Purkinje cells and chromatolysis o f neurons in groups 2
and 3 while the group 1 had marked haemorrhage and necrosis and loss o f Purkinje cells,

which were absent in goats. The liver showed centrilobular necrosis but in addition sheep
had proliferation o f bile ducts.
In conclusion the study shows that the plant is more toxic to sheep than to goats and that
there were marked differences in the clinicopathological manifestations of the toxic
effects in the two animal species. Since there was less toxic effect in goats, it may seem
that goats have a way o f reducing the toxic effects of unripe fruits o f Solarium incanum L.
- xvii -

Chapter 1
1.0 INTRODUCTION
There are about 1,500 species in the genus Solanum and among these several have been
found to be toxic to animals. These include S. aculeastrum, S. sodomoeum, S. nigmm, S.
panduriforme, S. pseudocapsicum, S. kwabense, S. malacoxylon, S. fastigiatum var
fastigiatum, S. bonariensis, S. dimidiatum, S. glaucophyllum, S. dulcamara, and
Solanum tuberosum.
Solanum incanum L. is one such Solanum species found abundantly in many areas of
Kenya where goats are sheep are kept in large numbers. Limited studies in animals have
been carried out with this plant. Steyn (1936) fed the ripe fruit to the goat, sheep and
rabbit without effect but found that the unripe fruit was toxic to the rabbit. A sheep was
fatally poisoned within t hree d ays o f b eing d osed w ith c . 19 g/kg o f S. incanum fruit
(Shone et. al., 1965). According to Steyn (1936), the main clinical signs o f S. incanum
poisoning in animals are salivation, diarrhoea, colic, bloat, stomatitis, tachycardia,
polypnea, cramps, paralysis and occasionally, a vesicular exanthema. The principal
necropsy features in animals are catarrhal enteritis (Steyn, 1936; Shone et. al., 1965),
hyperaemia and oedema o f the lungs, ascites and hydrothorax (Shone et. al, 1965).
Unripe fruits and leaves of S. incanum L were shown to be toxic when fed to rats
(Thaiyah, 1992). Clinically, affected rats showed diarrhoea and a starry coat and a
generalized congestion o f all the organs on post mortem examination. On histopathology,
there was perivascular oedema and vacuolation of the white matter of the brain, linear
-1 -

- 2 -
haemorrhages on glandular stomach and haemorrhages and necrosis of the kidney. The
rats also showed lung pneumonia and degeneration of the germinal layer o f the testis with
aspermia. In the intestines, there was coagulative necrosis in the high dose groups and
adenocarcinomas in the low dose groups. The liver showed hepatocyte hyperplasia in the
low dose groups.
No studies have been done so far on the toxicity of unripe fruits o f Solatium incanum L in
goats while in sheep only one limited study has been done. Thus, this study seeks to
determine the toxic effects of S. incanum L in goats and sheep.

- 3 -
1.1 HYPOTHESIS
This study was undertaken to evaluate the major hypothesis that “There is no difference
in the toxic effects of unripe fruits o f Solatium incanum L in sheep and goats”.
The minor hypotheses were as follows:
1. That there is no difference in the clinical findings in sheep and goats fed S.
incanum L
2. That there is no difference in the haematological and biochemical findings in
sheep and goats fed S. incanum L
3. That there is no difference in the gross pathological lesions in sheep and goats fed
S. incanum L
4. That there is no difference in the histological changes in sheep and goats fed S.
incanum L.
In order to test the above hypotheses, the following experiments were performed:
a. Determination o f the oral LD50 of 5. incanum L in goats and sheep using dried
fruit powder.
b. Determination o f the effects of graded oral doses of S. incanum L in sheep and
goats as assessed by the clinical, haematological, biochemical, pathologic and
histologic observations.

- 4 -
CHAPTER 2
2.0 LITERATURE REVIEW
2.1 General remarks.
Plant poisoning is recognized as a major problem affecting livestock in all parts of the
world. Any plant community includes poisonous plants. Overstocking, drought and other
environmental variations in range areas where livestock is extensively managed may
force animals to consume poisonous plants since they may be the only green plants
present in abundance (James et. al., 1992a). However, basing on the great diversity of
plant communities including poisonous plants, it is possible that a proportionate loss in
livestock production occurs in pastoral areas from poisonous plants especially during
harsh w eather c onditions. In a s ingle e stimate i n 1 992, d eaths a nd r eproductive 1 osses
from plant poisoning cost 17 western USA states 340,000 US dollars (James et. al.,
1992a). The losses are either direct or indirect. Direct losses are manifested as deaths,
weight loss and loss o f production and reproduction, abortions, lengthened calving
intervals and birth of weak or malformed foetuses. Indirect losses include cost of change
in management, fencing, supplementary feeding and medical costs to treat poisoned
animals.
Naturally animals and poisonous plants must coexist in range areas. In this regard,
livestock have an inherent capacity to avoid poisonous plants such that when pastures are
abundant, animals ingest non- toxic plants selectively, discriminating against the
poisonous ones. Livestock newly introduced to an area may succumb to poisoning due to
indiscriminate ingestion of herbage in the area. It has been shown that conditioned

- 5 -
aversion to poisonous plants can be induced by feeding the animals with the plant and a
known toxin such as lithium chloride to induce nausea and emesis. The animal will then
associate the illness to the poisonous plant and instinctively avoid it (Ralphs, 1992; Toit
et. al., 1992).
2.2 Measures of toxicity in animals
Each cell o f an organ has a specific function and contains enzymes unique to that
function. When the integrity of a cell is disrupted, enzymes escape into the surrounding
fluid compartment and into serum or cerebrospinal fluid, where their activity can be
measured as a useful index of that cells integrity (Kaneko, 1989). These enzymes include
alkaline phosphatase (AP), aspartate aminotransferase (AST), alanine aminotransferase
(ALT), creatine kinase (CK), sorbitol dehydrogenase (SDH) and gamma glutamyl
transferase (GGT).
AP is found in bone and the liver and is increased in serum when there is disease
affecting these organs. In normal liver, bile duct epithelium has the most AP activity and
when obstruction occurs, there is an increase in hepatic AP in serum (Hoffmann et. al.,
1977a). The transamination of L-aspartate and a-oxaloglutarate to oxaloacetate and
glutamate is catalysed by AST. This enzyme is useful when used with other enzymes as
an index o f hepatic or muscular cell damage (Kaneko, 1989). GGT cleaves terminal
glutamyl groups and transfers them to peptides and other suitable acceptors. Most cells
have GGT activity but serum GGT is mostly derived from the Liver (Braun et. al., 1978).
Creatine kinase phospholirates creatinine to form creatine phosphate, which is the storage
form of energy required by muscle for contraction. Only heart and skeletal muscles

- 6 -
contain sufficient amounts of creatine to alter serum activity in organ specific disorders
(Kaneko, 1989). These enzymes will be used to measure damage to specific organs by the
unripe fruits.
2.3 Toxicants in plants
There is a great diversity of components in plants that cause toxicity in animals. These
vary in their biochemical, physiological and pharmacological functions. These toxic
components have been comprehensively reviewed (Cheek, 1989) and the human health
implications from these toxicants examined (Cheek, 1990). These components include
alkaloids, cyanogenetic glycosides, terpenes, coumarins, flavonoids, estrogens, tannins
and sterols among others.
2.4 Toxicological work on some Kenyan plants
Toxicological work on poisonous and medicinal plants in Kenya is little probably
because of the long-term nature o f such studies. Some research in this area has been
undertaken in the Departments of Veterinary Pathology, Microbiology and Parasitology,
Clinical Studies and Public Health, Pharmacology and Toxicology, University of Nairobi.
Both sheep and calves fed the leaves and seeds of Burttia prunoides developed similar
lesions which included: froth in the mouth and trachea; Lung congestion and oedema;
ecchymotic haemorrhages on epicardium and endocardium; hydroperitoneum and
congestion in the brain and gastrointestinal mucosa (Mugera, 1970). Histologically, there
was congestion, haemorrhages, necrosis and oedema o f perivascular spaces in the brain;
hyaline degeneration, haemorrhages and fatty infiltration on heart muscle; oedema and
haemorrhages on lung tissue and haemorrhages and fatty infiltration in the liver and

- 7 -
kidneys. Mugera (1970) also fed Elaeodendron buchananii to calves, sheep and rats. All
calves and sheep developed diarrhoea and pathologically, there was generalized
heamorrhage in various organs in acute cases and emphysema and oedema in the lungs.
The rats were resistant and only had fatty infiltration in hepatic cells after one year. The
clinical signs of Acokanthera longiflora and Acokanlhera schimperi poisononig in sheep
and calves were muscular spasms, rapid breathing, salivation and diarrhoea (Mugera,
1970). On pathology, there was hydrothorax and hydropericardium, lung oedema, froth
in the trachea and ecchymotic haemorrhages on epicardium and endocardium.
Dialotropis Africana induced diarrhoea in sheep and calves with haemorrhagic
gastroenteritis (Mugera, 1970).
Stephanorossia palustris induced a haemorrhagic diarrhoea and rapid breathing in sheep
and calves and on pathology, the animals had a haemorrhagic gastroenteritis and
ecchymotic haemorrhages in the lungs, epicardium and endocardium (Mugera, 1970). In
bovine, Ornithogalum longibracteatum induces diarrhoea and tympany and on pathology,
hydropericardium, hydrothorax, haemorrhagic gastroenteritis and abomasal ulceration
(Mugera, 1970). Haemanthus multiflorus leaves and bulbs induced profuse salivation and
bloat in calves with no visible post mortem lesions. However, in sheep it induced
salivation, bloat and diarrhoea and on post mortem there was haemorrhagic enteritis,
haemorrhages on epicardium and endorcardium and degenerative changes in liver and
kidney, varying from fatty infiltration to necrosis (Mugera, 1970). Bersamia abyssinica
Fres. i nduces b loody d iarrhoea i n b ulls w ith a haemorrhagic, u lcerative g astroenteritis
and haemorrhages and necrosis o f cardiac muscle (Mugera, 1970). Leaves of Maesa

- 8 -
lanceolate induced hydrothorax, hydroperitonium and hydropericardium, diffuse fatty
infiltration in hepatic lobules and coagulative necrosis of proximal convoluted tubules
with hyaline cast formation in calves (Mugera, 1970). The leaves o f Crotalaria mauensis
Bak. produced extensive petechiae to ecchymotic haemorrhages on serous and mucous
surfaces and parenchymatous organs and ulcerative abomasitis and duodenitis in calves
(Mugera, 1970). With leaves of Cassia floribunda Cav. in sheep, there was constipation
which progressed to diarrhoea and on post mortem, there was a serous exudates in the
thoracic, pleural, pericardial and abdominal cavities. In addition, there was fatty
infiltration in the liver, coagulative necrosis and interstitial haemorrhages in the kidney
and necrotic gastroenteritis (Mugera, 1970).
Cassia didymobotrya Fres. induced signs of diarrhoea in sheep and on post mortem,
generalized congestion, petechial haemorrhages on epicardium and endocardium, lung
oedema and haemorrhagic gastroenteritis (Mugera, 1970). In sheep and bulls,
Diplocyclos palmatus (L) Jeffrey induced diarrhoea clinically and on post mortem,
hydrothorax and ascites, lung oedema, ulcerative gastroenteritis and degenerative
changes in liver and kidney varying from fatty infiltration to necrosis (Mugera, 1970).
Dichlocephala chrysanthemifolia induces bloody diarrhea in sheep and on post mortem,
haemorrhagic gastroenteritis and congestion o f the kidneys. Microscopically, there was
fatty infitration in the liver and kidneys and a necrotizing haemorrhagic gastroenteritis
(Mugera, 1970). The leaves and young shoots o f Senecio moorei induced bloody
diarrhoea in bulls and on post mortem there were ecchymotic haemorrhages in the
epicardium, endocardium, pleura and diaphragm. The hepatic changes varied from a

- 9 -
haemorrhagic hepatitis to necrosis and hyperplasia while the kidney showed fatty
infiltration (Mugera, 1970). No toxicity was demonstrated with Ehretia cymosa Thonn,
Lippia unkambensis Valke, Leonotis nepetifolia L and Cassia singueana (Mugera, 1970).
In cattle, Senecio moorei produced liver fibrosis and bile duct proliferation; in swine it
produced epithelialization of lung alveoli and enlargement of nuclei in hepatocytes and
proximal convoluted tubules o f the kidney while in rats there were hepatocellular
carcinomas, bile duct adenomas and fibroma (Kamau, 1973). Adenia volkensii fed to
sheep, rabbits and rats produced congestion to haemorrhage in various internal organs
(Kamau, 1973).
Gnidia latifolia fed to calves for 2-3 months produced hydrothorax, hydropericardium,
hydropleura, follicular hepatic fibrosis and necrosis, haemorrhage, congestion and
fibrosis in the lymphopoietic cells in the spleen and lymph nodes. Chronically, the
animals had a slight anaemia and lymphopaenia and degenerative fibrosis and
glomerulonephritis with hyaline casts in kidneys. In rats, the kidney, liver and adrenals
showed marked cellular degeneration with hyaline casts while other organs had
generalized petechiae haemorrhages (Kiptoon, 1981).
The methanolic extract of Spirostachys venenifera pax produced signs of
immonosuppression in rats while tumor cells implanted into similarly treated rats
produced malignancy attributed to the immunosuppressive status (Njiro, 1984).
Peddie volkensii Gilg and Scutia myrtina produced pulmonary haemorrhage and alveolar
thickening in rats (Muchiri, 1987). In addition, P. volkensi Gilg fed rats developed

-10-
hydropericardium, hydrothorax, froth in the trachea, degeneration o f proximal tubules of
the kidney, hepatic and adrenal cortical haemorrhages, splenic haemosiderosis and
increased red blood cell destruction. Badru (1989) studied the toxic effects of Ajuga
remota Benth in rats and goats.
Unripe fruits and leaves of Solanum incanum L fed to rats produced diarrhoea and a
starry coat clinically and generalized congestion o f all the organs on post mortem
examination (Thaiya, 1992). Histologically, there was perivascular oedema and
vacuolation o f the white matter o f the brain; linear haemorrhages on glandular stomach;
haemorrhages and necrosis of the kidney; lung pneumonia; degeneration o f the germinal
layer of the testis with aspermia; coagulative necrosis in the intestines in the high dose
groups and adenocarcinomas in the low dose groups; and hepatocyte hyperplasia in the
low dose groups (Thaiyah, 1992).
Primus africanus in rats produced lymphocytosis in all lymphoid organs, myocardial
necrosis, mild vacuolation of hepatocytes and gross reduction in the size o f the prostrate
gland (Gathumbi, 1995).
2.5 EFFECTS OF POISONOUS PLANTS ON ANIMALS
2.5.1 Hepatotoxic plants
Many plant poisonings in animals cause lesions in the liver. These include plants in the
genera Senecio, Heliotropium, Amsinca, Echium, Crotalaria, Symhytum and Trichodesma
spp containing pyrrolizidine alkaloids (Adams, 1974; Hooper, 1978), Cestrum (Mugera
and Nderitu, 1968b), Lantana (Gopinath and Ford, 1969), Tribulus terrestris L (Van

-11 -
Tonder et. al., 1972), Brachiaria decubens (Graydon et. al., 1991), Asaemia axillaris,
Pteronia pollens, Lasiospermun bipinnatum and Galenia africana in South Africa
(Kellerman et. al., 1988).
2.5.2 Cardio toxic plants
Direct cardio toxins include cardiac glycosides (Schulz et. al., 1975). A comprehensive
review of plants that contain cardiac glycosides and other toxic effects in animals has
been presented (Kellerman et. al., 1988).
2.5.3 Nephrotoxic plants
Plants that result in nephrotoxicity include Quercus robur L (Neser et. al., 1982),
Anagallis arvensis L (Schneider, 1978) and Oxalate containing plants (Spinacia
olearacea L, Beta vulgaris L, Rumex acetosa L, Opuntia spp and Halogeton glomeratus)
(James, 1978). Others include Tribulus terrestris (Coetzer, et. al., 1963) and Vicia spp
(Anderson and Divers, 1983).
2.5.4 Plant poisoning that causes disturbance in reproduction
Some plant toxins cause anomalies in reproduction manifested by infertility, reproductive
disturbances and fetotoxicity. A review of specific plant poisoning that affects the
various stages o f the reproductive cycle has been presented (James et. al., 1992b). A
review of plants that affect the embryonic, fetal and neonatal development, the animals
affected and the most susceptible stage of gestation are also available (Panter et. al.,
1992).
2.5.5 Plant induced pulmonary disturbances
The most commonly reported plant induced respiratory distress in animals is acute bovine
respiratory emphysema (fog fever) associated with the ingestion of lush pastures

-12-
containing high amounts of amino acid L-tryptophan (Carlson and Dickinson, 1978;
Carlson and Breeze, 1984). A similar condition has been reported in cattle ingesting
Perilla frutescens, mouldy sweet potatoes and Ipomoea batatas (Wilson et. al., 1978).
Other plants inducing pulmonary problems include Crotalaria dura (Kellerman et. al.,
1988), Lasiospermum bipinnatum (Williams, 1990) and Hertia pollens (DC) (Prozesky
et. al., 1986).
2.5.6 Plants affecting the haematopoietic system
Some plant poisonings that affect the haematopoietic system are known. These include
Allium cepa (Hutchinson, 1977; Kirk and Bulgin, 1979; Verhoeff et. al., 1985; Lincoln
et. al., 1992), Brassica species (Smith, 1980), Acacia nilotica and cereal grasses
(Carrigan and Gardiner, 1982), Pterdium aquilinum (Evans, 1964) and Ricinus communis
(Geary, 1950).
2.5.7 Plants that cause sudden death
Plants that contain cyanogenetic glycosides are a common cause of sudden death in
livestock (Burrow and Tyrl, 1989). As reported by Conn (1978), 1000 species of plants
worldwide, representing 250 genera and 80 families contain cyanogenetic glycosides.
The various plants and the cyanogenetic glycosides they contain are presented by Conn
(1978).
2.5.8 Plants that affect the gastrointestinal tract
Plants affecting the gastrointestinal tract include Solanum species (Morris and Lee,
1984), Gnidia species (Terblanche et. al., 1966; Kiptoon et. al., 1982), Spirostachys
venenifera (Njiro, 1984), Geigeria species (Kellerman et. al., 1988) and Pennisetum
cladestinum (Bryson, 1982; Newsholme et. al., 1983).

-13-
2.5.9 Neurotoxic plants
A wide variety o f plants cause central nervous system disturbances and these include: -
Datura stramonium L (Agnew, 1974), Dipcadi glaucum Bak (Kellerman et. al., 1988),
Matricaria nellifolia DC (Newsholme et. al., 1984), Cynanchum africana (Kellerman et.
al., 1988), Euphorbia mauritanica L (Terblanche et. al., 1966), Oxytropis and astragalus
species (Van Kampen and James, 1 969), Phalaris species (Hartley, 1 978a), Karwinski
humboldtiana (Chalton et. al., 1971), Cycad palm (Hooper et. al., 1974) and annual
ryegrass (Lorium species) (Schneider, 1981; Lanigan et. al., 1976; McIntosh and
Thomas, 1967). Other sources o f intoxication include the ingestion o f maize cobs
infected with the fungus Diplodia maydis (Kellerman et. al., 1991) and maize infected
with the fungus Fusarium moniliforme Sheldon (Marasas et. al., 1976; Kellerman et. al.,
1972).
2.5.10 Plants causing lesions in the musculoskeletal system
Plant poisonings that cause damage to the musculoskeletal system are few and include
Thermopsis montana (Baker and Keeler, 1992), Geigeria ornativa (Van der Luht and
Van Heerdan, 1993), Crotalaria burkeana (Kellerman et. al., 1988) and chronic selenium
poisoning (Olson, 1978).
2.5.11 Plants causing lesions in the cutaneous system
Plant poisons affecting the cutaneous system are many and the lesions are varied.
Chrysocoma tenuifolia (Kellerman, et. al., 1988) causes alopecia while Vicia villosa
causes granulomatous nodular to ulcerative dermatitis (Kellerman et. al., 1988).
Euphorbia species contain highly irritating latex that causes severe burning irritation to
mucous membranes and the skin (Watt and Breyer-brandwijk, 1962). Plants in the genera

- 1 4 -
Apiaceae, Ruraceae, Fabaceae, Moraceae and Archidaceae contain furocoumarins and
when ingested cause primary photosensitization (Kellerman et. al., 1988). Gangrene
formation occurs in animals ingesting cereal grains infected with the fungus Claviceps
purpurea (Yager and Scott, 1985) while fescue foot is caused by ingestion of Festuca
arundinaceae (tall fescue) that is infected with the fungus Acremonium coenophialum
(Hemkem et. a l., 1 984). Fungi i n t he genus Fusarium, Myrothecium and Stachybotrys
when ingested with contaminated hay or feed elicit necrotic dermal lesions in the skin
and mouth (Hintikka, 1977).
Solarium malacoxylon (Done et. al., 1976), Cestrum diurnum (Krook et. al., 1975) and
Trisetum flavescens (Dirksen et. al., 1974) cause calcification in various tissues including
the skin while Leucaena leucocephala causes cataract, goitre, epithelial ulceration,
atrophy of gingiva, depilation, infertility and foetal death and resorption in ruminants
(Holmes et. al., 1981; Hegarty et. al., 1976; Falvey, 1976).
2.5.12 Plant toxicants shed in milk
Many of the toxicants in plants can be shed in milk of lactating animals and by
implication be passed to the newborn or to humans thereby producing toxic effect.
Toxicants shed in milk include tremetol, a compound from Eupatorium rugostum
(Couch, 1929), pyrrolizidine alkaloids (Johnson, 1976; Dickinson and King, 1978),
piperidine alkaloids (Kubik et. al., 1980), quinolizidine alkaloids (Cheek and Shull,
1985), indolizidine alkaloids (James et. al., 1977) and Aflatoxins Mi and M2 (Allcroft
and Camaghan, 1963; Stolaff, 1980).

-15-
2.6 SOLAiNUM SPECIES
2.6.1 Solanum species other than S. incanum L
There are about 1,500 species in the genus Solanum and over 30 species of alkaloid
containing Solanum are used as human foodstuffs. Major edible Solanum species include
S. tuberosum (potato), S. melongena (eggplant), S. aviculare (kangaroo apple), S. centrale
(desert raisin) and S. aethiopicum (African scarlet eggplant or garden egg) (Facciola,
1990). Other Solanum species have, however, been shown to be toxic to animals in South
Africa and these include S. aculeastrum, S. sodomoeum, S. nigrum, S. panduriforme and
S. pseudocapsicum (Steyn, 1932; Steyn, 1949).
Solanum kwabense (bitterappel, Rooibessie) is the cause of maldronsiekte (mad-drunk-
disease) in cattle, characterized by epileptiform seizures and signs o f cerebellar
dysfunction (Menzies et. al., 1979; Pienaar et. al., 1976; Riet-Correa et. al., 1983). This
disease is characterized by atrophy of the cerebellum, which is manifested
microscopically by depletion of the Purkinje cell layer. S. dimidiatum in West Texas
(Menzies et. al., 1 979), S. fastigiatum var. fastigiatum in Brazil and S. bonariensis in
Uruguay have been associated with clinical signs of seizures and pathology similar to that
of S. kwabense (Riet-Correa et. al., 1983).
In South America, S. malacoxylon is responsible for arteriosclerosis o f the aorta and
major arteries, and metastatic calcification in various organs, such as the heart, lungs,
kidneys and tendons (Dobereiner et. al., 1971). It has also been shown that the young
bom of does fed S. malacoxylon on days 6 to 30 of gestation also develop mineralization

- 1 6 -
of soft tissues and an increase in the calcium and phosphorous levels (Gomiak et. al.,
1999). When the leaves of S. glaucophyllum are fed to rabbits on days 5, 7 and 9, the
rabbits develop loss in weight, elevation of tissue calcium levels and calcinotic lesions
(Dallorso et. al., 2001).
Studies on S. dulcamara were done in mice using ripe and unripe berries collected at
various times in the year. The mice receiving unripened bellies from early in the year had
gastrointestinal tissue changes consistent with solanine toxicity. Unripened fruit in the
latter part of the year caused behavioral changes suggestive of solanine toxicity but no
gastrointestinal lesions. The ripe fruit was completely non-toxic (Homfeldt and Collins,
1990).
Studies using Solanine, from the potato (Solatium tuberosum) have been done in animals
(Chaube and Swinyard, 1976). The LD50 of solanine in rats has been found to be
67mg/kg b.wt. (Chaube and Swinyard, 1976, Nishie et. al., 1975), and 27 mg/kg b.wt.
and 50 mg/kg b.wt in mice and rabbits, respectively. Solanine injected into rats at the rate
of 10-85 mg/kg b.wt. resulted in acute death, characterized by periorbital, nasal and oral
haemorrhage and bloody ascitic and pleuritic fluid (Chaube and Swinyard, 1976).
Injection of the same compound to pregnant rats in eight daily injections on days 5-12 of
gestation at 5-20 mg/kg resulted in foetal death and no abnormalities (Chaube and
Swinyard, 1976). Beating heart cell cultures of 1-2 day old rats when treated with alpha-
solanine (80ugm/ml) and tomatine (40ugm/ml) ceased beating within a few minutes. The

-17-
addition of alpha-solanine (40ugm/ml) and tomatine (20ugm/ml), however, resulted in an
increased contraction frequency lasting for at least 2 hours (Bergers and Alink, 1980).
2.6.2 Solatium incanum L
Solatium incanum L belongs to the family Solanaceae. It is a shrubby, prickly herb 0.6 -
1.8 meters tall. The leaves are ovate to lanceolate, with entire to lobed margins and are
covered with yellow or brown star shaped hairs, usually very velvety and 5.0 - 18.0
centimeters long. The corolla is purple or violet and the anthers are yellow. The unripe
fruits are round, green with pale blotching, but later are bright yellow in colour on
ripening and a re 1.9 - 3.8 centimeters in diameter. The prickles are present or absent
from stem and petioles.
2.6.2.1 Distribution
Solatium incanum L, commonly known as "sodom apple", is fairly abundant in several
ecological zones. In Kenya it is found around Mt. Elgon, Cherangani, Loita hills, along
the Aberdare range, Kitale, Mumias, Kisii, Narok, Baringo, Rift Valley, Magadi, Embu,
Machakos, Kajiado and Nairobi including surrounding areas of Kikuyu, Kabete and Athi
River (Agnew, 1974).
This shrub is referred to by various local names. The Abaluhya refer to the plant as
indalandalwa or maduranzura and by the Marakwet as lobotwa. The Luo name for the
plant is ochok or machoge while the Taita refer to the plant as mrong. The Digo name for
the plant is mtunguzo while that for the Kamba is mukondu or mutongu. The Kikuyu and
-18-
Meru call the plant mutongu while the Masai name for the plant is endallelei (Kokwaro,
1976)
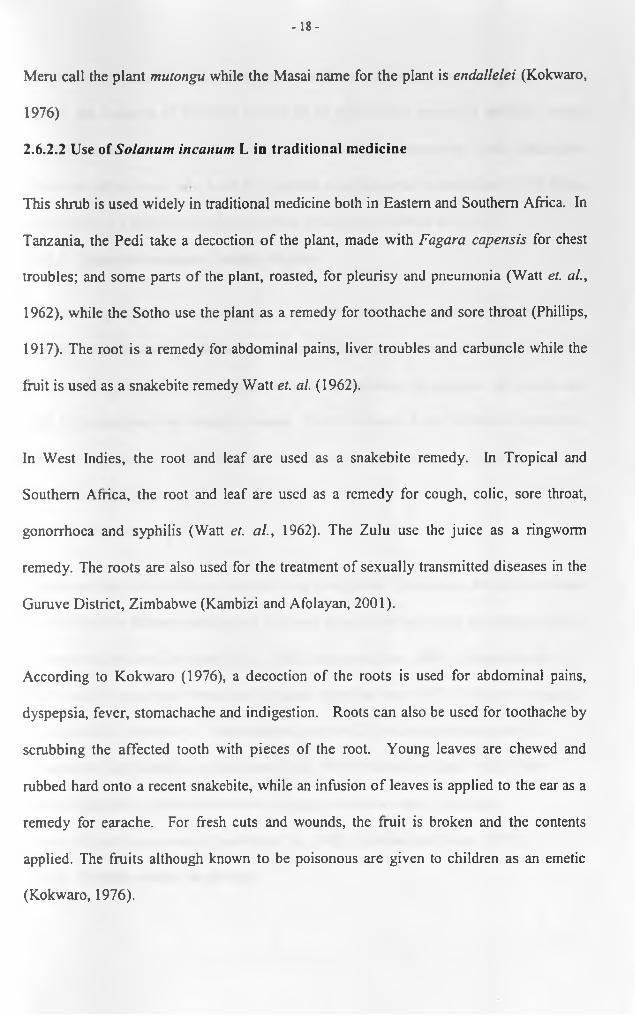
2.6.2.2 Use of Solatium incanum L in traditional medicine
This shrub is used widely in traditional medicine both in Eastern and Southern Africa. In
Tanzania, the Pedi take a decoction o f the plant, made with Fagar a capensis for chest
troubles; and some parts o f the plant, roasted, for pleurisy and pneumonia (Watt et. al.,
1962), while the Sotho use the plant as a remedy for toothache and sore throat (Phillips,
1917). The root is a remedy for abdominal pains, liver troubles and carbuncle while the
fruit is used as a snakebite remedy Watt et. al. (1962).
In West Indies, the root and leaf are used as a snakebite remedy. In Tropical and
Southern Africa, the root and leaf are used as a remedy for cough, colic, sore throat,
gonorrhoea and syphilis (Watt et. al., 1962). The Zulu use the juice as a ringworm
remedy. The roots are also used for the treatment of sexually transmitted diseases in the
Guruve District, Zimbabwe (Kambizi and Afolayan, 2001).
According to Kokwaro (1976), a decoction of the roots is used for abdominal pains,
dyspepsia, fever, stomachache and indigestion. Roots can also be used for toothache by
scrubbing the affected tooth with pieces of the root. Young leaves are chewed and
rubbed hard onto a recent snakebite, while an infusion o f leaves is applied to the ear as a
remedy for earache. For fresh cuts and wounds, the fruit is broken and the contents
applied. The fruits although known to be poisonous are given to children as an emetic
(Kokwaro, 1976).

- 19-
The fruit juice is applied into the sheep's nostrils as a cure for sheep cough (Kokwaro,
1976). An infusion of the fruit is said to be effective in removing external benign
tumours including an epithelioma on the back of a racehorse by local application;
carcinoma on the hock of a mule by injection o f an aqueous solution and half a dozen
melanomata in a horse treated the same way as the mule (Watt et. al., 1962).
2.6.2.3 Solanum incanum L toxicity in man
After oral ingestion, Solanum incanum L causes toxicity in man that is characterized by
headache, severe colic, vomiting, diarrhoea, apathy, cyanosis, accelerated weak pulse,
fever, profuse perspiration, dizziness, mydriasis, lassitude, disturbances in speech and
sight, h alternations a nd u nconsciousness. D eath i s d ue t o h eart failure o r r espiratory
paralysis (Verdcourt and Trump, 1969). The part of the plant causing these signs is not
described in the literature.
2.6.2.4 Active principle
The active principle in Solanum species is a glycoalkaloid. Solanine is the most common
glycoalkaloid in Solanum species and is several times more toxic than its corresponding
aglycone solanidine (Cheek and Shull, 1985; Morris and Lee, 1984). Glycoalkaloids
affect mainly the nervous system and the gastrointestinal tract (GIT). The nervous signs
are attributed to inhibition o f cholinesterase, and the GIT effects to the saponin-like
properties of Glycoalkaloids (Cheek and Shull, 1985; Morris and Lee, 1984). Other
steroidal alkaloids include incanumine, Solamargine, solasodine, ursolic acid,
and ursolic acid derivatives (Chun-Nan et. al., 1990, Fukuhara and Kubo, 1991))
2.6.2.5 Toxicity studies in animals

- 2 0 -
Studies on the toxicity of Solatium incanum L in animals were carried out by Steyn
(1936) who fed the ripe fruit to the goat, sheep and rabbit without effect but found that
the unripe fruit was toxic to the rabbit. A sheep was fatally poisoned within three days of
being dosed with 19 g/kg of S. incanum fruit (Shone el. al., 1965). Steyn (1936) lists the
main clinical signs o f S. incanum poisoning in animals as salivation, diarrhoea, colic,
bloat, stomatitis, tachycardia, polypnea, cramps and paralysis. Occasionally, a vesicular
exanthema may be present (Steyn, 1936). The principal necropsy features are catarrhal
enteritis (Steyn, 1936; Shone et. al., 1965), hyperaemia and oedema o f the lungs, ascites
and hydrothorax (Shone et. al, 1965).
Thaiyah, (1992) fed the unripe fruits and leaves to rats and found these materials to be
toxic. Clinically, the rats showed diarrhoea and a starry coat and had a generalized
congestion of all the organs on post mortem examination. On histopathology, there was
perivascular oedema and vacuolation of the white matter o f the brain, linear
haemorrhages on glandular stomach and haemorrhages and necrosis of the kidney. The
rats also showed lung pneumonia and degeneration of the germinal layer of the testis with
aspermia. Other lesions include coagulative necrosis in the intestines in the high dose
groups, adenocarcinomas in the low dose groups and hepatocyte hyperplasia in the low
dose groups.
From this review, no studies have been undertaken with unripe fruits o f Solanum
incanum L in goats while in sheep only limited studies have been done. Thus, this study
seeks to determine the toxic effects o f unripe fruits of S. incanum L in goats and sheep.

-21 -
CHAPTER 3
3.0 MATERIALS AND METHODS
3.1 Plant material
Unripe fruits of S. incanum L were collected from around Kabete and chopped into
pieces. The material was then dried in an oven at 5 0 C fo rth ree days. Thereafter, the
dried material was ground into a fine powder in an electric mill and the powder stored at
room temperature in appropriately labeled sealed plastic bags until use.
3.2 Experimental animals
All experimental animals (sheep and goats) were obtained from the semi-arid area of
Machakos District in Eastern Province and were housed in stalls in the large animal
compound, Department of Clinical Studies, Kabete. On arrival, a faecal sample was taken
from each animal for determination of the worm loads and the animals were then
drenched with Albendazole (ValbazenR) at 3mg/kg body weight.
All animals were allowed 28 days to acclimatize to the environment and were fed on a
ration o f good quality hay, water and a commercial salt lick, (Maclick super®, Cooper
(K) Ltd) ad. libitum. A high concentrate diet [Dairy meal, Unga (K) Ltd] was also fed
twice a day.
All experimental animals were weighed on arrival and weekly thereafter. The clinical
picture was observed before and during the experiment.

- 2 2 -
3.3 Experiment 1: Determination of acute LD50 of Solarium incanum L unripe fruits in sheep and goats after oral administration
3.3.1 Description of method used in LDSo determination
The moving average method o f determination of median effective dose (ED50) described
by Weil (1952) was applied. The LD50 was the ED50 in these studies. This method
reduces the cost and time of calculation of ED50 and its confidence interval to a minimum
without sacrificing accuracy. A group of tables had been calculated according to the
formulae presented in the original article. These published tables allow for the use of
2,3,4,5,6, or 10 animals per dose level, with 4 or more dosage levels tested (using K=3),
provided the logarithms of successive dosage levels differ by a constant factor denoted by
R and d = logarithm o f R. The LD50 refers to the least dosage expected to kill 50 percent
o f animals that received it. The moving average method of determination of median
effective dose (ED50) requires simpler calculations than other methods of determination
o f LD50 like probit analysis and other methods of curve fitting such as logistic functions
using maximum likelihood and weighted least squares.
Moving averages are widely used in mathematics and statistics in time series analysis and
its advantages are: (i) its free from assumption as to the precise type o f fundamental
curve involved but it is capable o f taking into account more of the data than other
methods that use only data from both sides of the 50% level of effectiveness, (ii) only
simple computations are involved and (iii) it replaces the fitting of complex mathematical
curves.

- 2 3 -
For one to use this method effectively, several criteria must be met which include:
(a) Dosing a constant number of animals at each level (n= number dosed per level)
(b) Spacing the dosage levels so that they are in geometric progression
(c) Dose animals on at least K+l level of dosage.
When these requirements are met, a set of mortality data (r-values in the tables) is
obtained from the animals that match one of those in the published tables for the given
value o f n and K (appendix 2). The general formula for the calculation of m, the
estimated LD50 is:
L o g m = log D a + D . (f+ 1 ) for K =3
With Log Da = log o f the lowest of the four dosages used.
In estimating the 95% confidence interval, we take that bounded by antilog [Log m ± 2.a
log m].
3.3.2 Determination of acute oral LD50 of Solatium incanum L in goats and sheep
3.3.2.1 Dose determination experiments
Dose determination experiments were first done using two goats per dosage to determine
the dosage range and observing for mortalities within 24hours. First a high dose of
15g/kg was tested resulting in both goats dying within 24 hours. Other dosages that were
tried in a descending order were 10, 8, 5, 3, and 1.5g/kg. The 1.5g/kgdosage did not
result in mortality.
Dose determination experiments were similarly done in sheep to establish the dosage
range using dosages o f 15, 10, 5 and 3g/kg. The 3g/kg dosage did not cause mortality.

-24-
3.3.2.2 Determination of the LD50 of S. incanum L in goats
Fifteen adult East African goats of both sexes were randomly divided into five groups of
three goats each. Each of the five treatment groups was randomly assigned to a dosage
level. The dosage levels were in geometric progression; the geometric factor (R) was 1.5,
with dosage levels o f 0, 1.5, 2.25, 3.38 and 5.06g/kg unripe fruit powder. The fruit
powder was administered as a drench by stomach tube and a syringe and the goats were
then observed for 24hrs and a set o f mortality data (r-value) recorded for calculation of
oral median lethal dose.
3.3.2.3 Determination of the LD50 of S. incanum L in sheep
Fifteen adult local sheep of both sexes were then similarly divided and received dosages
of 0, 3.0, 4.5, 6.8 and lO.lg/kg unripe fruit powder as a drench by stomach tube and were
observed for mortalities within 24 hours.
3.3.2.4 Clinical examination of animals in the LD50 experiment
Immediately after oral administration of the fruit powder, the sheep and goats were
critically examined for behavioral changes, survival times and clinical signs o f toxicity.
3.3.2.5 Post mortem examination of animals in the LD50 experiment
Post mortem examination was performed on all the sheep and goats that died within 24
hours after dosing with the unripe fruit powder. All animals with prolonged signs of
toxicity and showing no signs of recovery at 48 hours were also sacrificed and post
mortem examination performed. Gross pathological changes were recorded in all the
cases. The LD50 was then computed according to the method of Weil (1952).

- 25 -
3.4 Experiment 2: Determination of the prolonged toxic effects of unripe fruits of 5. incanum L. in goats
Sixteen adult East African goats were obtained and housed in stalls in the large animal
compound, Department of Clinical Studies. They were housed and fed as described
above. Body weights and blood with and without anticoagulant was taken on arrival and
weekly thereafter during the acclimatization period to obtain baseline data on packed cell
volume, haemoglobin concentration, total white cell count, total protein, bilirubin
content, creatinine and the enzymes gamma glutamyltransferase (GGT), aspartate
aminotransferase (AST), and alkaline phosphatase (AP).
The goats were randomly divided into four groups of four animals each. Groups 1, 2 and
3 received oral doses o f 0.25 LD50, 0.5 LD50 and 0.75 LD50 Solanum powder suspended
in water, respectively, each day for three months. Group 4 was set aside as the control.
3.4.1 Clinical examination of animals
The animals were observed individually every day for signs of poisoning by a complete
examination of all systems and any clinical signs were noted. Body weights of all the
animals were taken weekly.
3.4.2 Blood sampling
All animals were bled at the beginning of each week by venupunture from the jugular
vein after disinfecting the injection sites with surgical spirit. About lOmls o f blood was
withdrawn from each animal using a sterile disposable syringe and 18G disposable
needle. 2mls of blood was put in glass bijou bottles containing EDTA anticoagulant while

- 2 6 -
8mls was put in a glass universal bottle without anticoagulant. This procedure was
repeated weekly until the end o f the experiment.
3.4.3 Handling of blood samples
Blood in EDTA was immediately placed on an electric rotator to allow for thorough
mixing with anticoagulant and was analyzed in a coulter counter within 3 hours of
collection. The blood without anticoagulant was placed on the bench in the lab for 20-30
minutes to allow for clotting to occur. It was then centrifuged at l,000rpm for 20minutes
and the serum drawn out with a pipette into plastic containers for serum enzyme analysis.
The serum was stored at “ 20°C and was analyzed within 48hours.
3.4.4 Post mortem examination of dead animals
All dying animals together with those sacrificed at the end of the experiment were
subjected to a thorough necropsy and all gross lesions noted. Samples for histopathology
were taken from the gross lesions and also from the brain, liver, kidney, heart, skeletal
muscle, lungs, testicles, ovaries, rumen, abomasum, duodenum and large and small
intestines. The tissues were fixed in neutral buffered Formalin, cut at 5pm, stained with
Haematoxylin and Eosin (H&E) and observed under the light microscope.
3.5 Experiment 3: Determination of the prolonged toxic effects of unripe fruits of S. incanum L. in sheep
The experimental procedure as described above in goats was repeated using sixteen adult
local sheep. Clinical examination, blood sampling and post mortem of dead animals was
carried out as in goats

- 2 7 -
3.6 Procedures for the tests
3.6.1 Haematological examination
Blood for haematology was examined using standard protocols (Jain, 1986). Red blood
cell count (RBC), haemoglobin concentration (HB), mean corpuscular volume (MCV)
and white blood cell count (WBC) were determined electronically in a coulter counter
(coulter electronics). Differential leucocyte counts for neutrophils (N), Lymphocytes (L),
eosinophils (E) and macrophages (M) were obtained from Giemsa stained blood films.
Packed cell volume (PCV) was measured using the microhaematocrit method while total
proteins were estimated using a refractometer.
3.6.2 Serum enzyme and protein examination
The plasma parameters were measured using Boehringer Mannheim Gmbh kits
(Germany). The activity o f serum aspartate aminotransferase (AST) was determined
calorimetrically at 546nm using the principle of Reitman and Frankel (1957). The activity
o f alkaline phosphatase (AP) in serum was determined calorimetrically at 405nm,
according to the principle described by Kaneko (1989). Creatinine was assayed using the
Jaffe method with deproteinization (Seelig and Wust, 1969). Gamma glutamyl transferase
(GGT) was assayed using the optimized kinetic method recommended by the German
society for clinical chemistry (Persijn and Van der Slik, 1976). Bilirubin was assayed
using the method o f Jendrassik (1938) at 560-600nm. Total protein was assayed
calorimetrically at 546nm using the Biuret method (Weichselbaum, 1946).

-28-
3.7 Statistical analysis
Analysis of variance (ANOVA) was done using Genstat® statistical program to
determine statistical significance for differences in clinical presentation and haematology,
biochemistry and pathological observations. LD50 was computed by the method of Weil
(1952).

- 2 9 -
CHAPTER 4
4.0 RESULTS
4.1 Results of the dose determination experiment
The results of the above experiment are summarized in table 1 below. From the results
only the 1.5g/kg and 3.0g/kg dosages did not cause mortalities in goats and sheep
respectively and were selected as the baseline for the LD50 determination.
Table 1. Mortalities recorded in sheep and goats in the dose determination
experiment
Goats Sheep
Dosage g/kg No. per group No. died Dosage g/kg No. per group No. died
10.0 2 2 10.0 2 2
8.0 2 2 7.0 2 2
5.0 2 2 5.0 2 2
3.0 2 1 3.0 2 0
1.5 2 0
4.2 Result of the LD50 determination
4.2.1 LD50 determination in goats
The set of mortality data obtained in this experiment is shown in table 2. Using the
formula as given by Weil (1952) namely: Log m = log Da + d.(f+l) for K=3 and antilog
[log m ± 2.olog m] the LD50 for S. incanum L in goats was calculated to be 3.0g/kg body
weight with a 95% confidence limit o f 2.3 to 4.1g/kg body weight (appendix 1).

- 3 0 -
Table 2: Mortality data per dose group in the LD50 experiment in goats
GROUP I n III IV V
DOSAGE (g/kg) 0 1.50 2.25 3.38 5.06
SURVIVED 3 3 3 0 0
DIED 0 0 0 3 2
4.2.1.1 Clinical manifestation for goats in the LD50 experiment
Group I was set aside as the control. Groups II and III showed only bloating on
drenching. Groups IV and V had an immediate bloat followed by vomiting and muscle
shivering within lOminutes. The goats then went down onto sternal recumbency
accompanied by salivation and a dazed appearance. They then progressed to lateral
recumbency with continuous bleating before death.
4.2.I.2. Post mortem examination of goats in the LD50 experiment
On postmortem, all the treated groups showed stripped haemorrhages from distal
abomasum to proximal duodenum, lung emphysema and haemorrhagic enteritis
extending from the colon to the caecum.
4.2.2 Results of LD50 determination in sheep
The set of mortality data in this experiment is shown in table 3. Using the formula as
given by Weil (1952) namely: Log m = log Da + d.(f+l) for K=3 and antilog [log m ± 2.a

-31 -
log m] the LD50 for S. incanum L in sheep was calculated to be 4.8g/kg body weight with
a 95% confidence limit of 3.0 to 7.7g/kg body weight (appendix 1).
Table 3: Mortality data per dosage group in sheep in the LD5q experiment.
GROUP I II III IV V
DOSAGE (g/kg) 0 3.00 4.50 6.75 10.13
SURVIVED 3 3 2 0 0
DIED 0 0 1 3 3
4.2.2.1. Clinical manifestation for sheep in the LD50 experiment
Group I was set aside as the control. In all the treatment groups (group II to V) there was
an immediate bloat and defaecation. Three group II and two group III sheep did not show
further signs. One sheep in group III and all sheep in groups IV and V then developed
increased salivation with frothing at the mouth, depression, muscle shivering and
recumbency followed by death.
4.2.2.2. Postmortem examination of sheep in the LD50 experiment
On post mortem, all the treated animals showed froth in the trachea with mucosal
haemorrhages; 1 ung e mphysema; c ongestion i n t he b rain, k idneys, 1 iver a nd i ntestines;
haemorrhages and ulceration on the abomasums extending to the pyrolus; haemorrhagic
enteritis from the duodenum to the ileum.
4.3 Results of prolonged toxicity of S. incanum L in sheep and goats
4.3.1 Results of clinical manifestation

-32-
4.3.1.1 Clinical manifestation of toxicity in goats
4.3.1.1.1 Clinical manifestation in Group 3 goats
Group 3 goats exposed to 0.75 LD50 (2.25g/kg) mainly showed bloat, shivering, coughing
and colic. One goat had diarrhoea from day 3 until death at day 14. One other goat died
on day 15 of the experiment after showing signs o f coughing, anorexia, depression with
the head held low, staggering gait and continuous bleating. One goat survived to the end
o f the experiment without signs of toxicity.
4.3.1.1.2 Clinical manifestation in group 2 goats
One goat in group 2 exposed to 0.5 LD50 (1.5g/kg) showed bloat, shivering, progressive
weakness, depression, staggering gait, lateral recumbency, leg paddling movements and
continuous bleating before death on day 24 of the experiment. The three other goats did
not show signs and were euthanized after three months from the start o f the experiment.
4.3.1.1.3. Clinical manifestation in group 1 goats
No clinical signs were recorded in group 1 goats exposed to 0.25 LD50 (0.75g/kg)
4.3.1.2 Clinical manifestation of toxicity in sheep
4.3.1.2.1 Clinical manifestation in group 3 sheep
All the sheep in group 3 exposed to 0.75 LD50 (3.6g/kg) showed signs of bloat,
depression, coughing and anorexia, while one sheep also showed further signs o f frothing
at the mouth, colic, diarrhoea, staggering gait, lateral recumbency, leg paddling
movements, coma and death. The group 3 sheep died on days 2, 3, 4 and 13 of the
experiment.

-33-
4.3.1.2.2. Clinical manifestation in group 2 sheep
Three sheep in group 2 exposed to 0.5 LD50 (2.4g/kg) had signs o f bloat, increased
salivation, staggering gait, lateral recumbency and leg paddling movements before death
while o ne s heep a Iso s howed v omiting, d iarrhoea, w eakness, c oughing and d epression
before death. Two sheep died on days 4 and 14 while the other two died on day 42 of the
experiment
4.3.1.2.3 Clinical manifestation in group 1 sheep
All group 1 sheep exposed to 0.25 LD50 (1.2g/kg) had signs of bloat. In addition, one
sheep also showed weakness, staggering gait, lateral recumbency and leg paddling
movements before euthanasia at the terminal stage on day 29. Three sheep also showed
coughing. Three sheep survived and were euthanized at the end of the experiment.
The clinical signs seen per group are summarized in table 4.

-34-
Table 4. Main clinical signs recorded per species per dosage group
Goat groups Sheep groups
Clinical sign *1 2 3 4 1 2 3 4
Bloat **0/4 0/4 4/4 0/4 4/4 4/4 4/4 0/4
Shivering 0/4 0/4 4/4 0/4 0/4 0/4 0/4 0/4
Vomiting 0/4 0/4 1/4 0/4 0/4 1/4 0/4 0/4
Salivation 0/4 0/4 0/4 0/4 0/4 4/4 1/4 0/4
Diarrhoea 0/4 0/4 1/4 0/4 0/4 1/4 1/4 0/4
Weakness 0/4 1/4 1/4 0/4 1/4 1/4 0/4 0/4
Colic 0/4 0/4 4/4 0/4 0/4 0/4 1/4 0/4
Depression 0/4 1/4 1/4 0/4 0/4 1/4 4/4 0/4
Coughing 0/4 0/4 1/4 0/4 3/4 2/4 3/4 0/4
Staggering gait 0/4 1/4 1/4 0/4 1/4 3/4 1/4 0/4
Anorexia 0/4 0/4 1/4 0/4 0/4 2/4 4/4 0/4
Lateral recumbency 0/4 1/4 0/4 0/4 1/4 3/4 1/4 0/4
Leg paddling 0/4 1/4 0/4 0/4 1/4 3/4 1/4 0/4
Continuous bleating 0/4 1/4 2/4 0/4 0/4 0/4 0/4 0/4
***Death 0/4 1/4 3/4 0/4 1/4 4/4 4/4 0/4
Key: * = Group 1, 2 and 3 represent 0.25, 0 .5 ,0.75LDSO respectively. Group 4 represents the control.** = 0-4 represents the number of animals that manifested a particular clinical signs.
*** = Eight goats and three sheep survived to the end of the experiment.

-35 -
4.4 Results of change in weight in sheep and goats
The results of the change in body weight are presented in Fig. 1 and Appendix 3. In goats
(Fig. la), there was a significant difference in weight (P<0.01) between the control and
all treatment groups and also within treatments (P<0.01).
In sheep (Fig. lb) there was a significant difference between the control and groups 2
(2.4g/kg) and 3 (3.6g/kg) (P< 0.01). There was also a significant difference within
treatments (P<0.01). However, there was no difference in weight between sheep and
goats (P>0.05). Table 4 shows the ANOVA table for weighs in sheep and goats.
Table 5. ANOVA table for weights in sheep and goats
Animal groups
d.f. 1 2 3 4
Goats 3 20.1 ± 0.6a 17.4 ± 0.6ab 17.4 ± 1.0ab 15.8 ± 0.6ab
Sheep 3 18.8 ± 0.6a 15.9 ± 0.8ab 15.0 ± 1.6at5 17.8 ± 0.6b
*Means with a common superscript are statistically significant.
> o „

- 3 6 -
Figure 1. Mean weight (Kg) against time (weeks) in (a) goats and (b) sheep.
All treatment groups in goats had a slight increase in weight compared to the control, group 1 (0.25LDso) continuing to gain weight. Group 2 (0.5 LDs0) sheep had a decrease in weight to the second week remaining low thereafter.

-37-
4.5 RESULTS OF THE HAEMATOLOGICAL INVESTIGATION
4.5.1 Haematological findings in goats
The haematological findings in goats are presented in table 6 below while mean WBC
and PCV are presented in Appendix 4, and 5, respectively. All treatment groups had
higher PCV values than the control (P<0.01) (Table 6 and Fig. 2a) while group 3
(2.25g/kg) had a highly significant decrease in TP compared to the control (P<0.01).
There was a transient increase in WBC up to the second week o f the experiment (Fig. 3a)
but this was not statistically significant (P>0.05). Other haematological parameters
including lymphocytes and neutrophils were within the normal range (P>0.05).
4.5.2. Haematological findings in sheep
Haematological findings in sheep are presented in summary in table 6 below while mean
WBC and PCV are presented in Appendix 4 and 5, respectively. From the results, there
were no significant differences in the values of WBC, PCV and TP (P>0.05) between all
the groups (Table 6). The mean PCV and WBC are presented in Fig. 2b and 3b. There
was a highly significant difference in RBC between groupl (1.2g/kg) and group 2
(2.4g/kg) (P< 0.01). Group 1 sheep had a neutrophilia and lymphopaenia and these values
were significantly different (P<0.01).

- 38 -
Table 6 . Mean values of PCV, WBC, RBC and total protein in sheep and goats per
dose group
Goats Sheep
Treatment WBC/pi
RBC(xl06/pl)
PCV(%)
Totalprotein(g/dl)
WBC/pi
RBC(x 106/pl)
PCV(%)
Totalprotein(s/dl)
Group 1 9,517 4.9 ± 0.8 29.4 7.3 ± 0.2
9,931 9.0 ± 0.8
31.2±2 .0
6.6 ± 0.3
Group 2 10,235 4.7 ± 1.0 30.2 7.2 ± 0.2
10,388 11.7 ± 1.2
33.4±2 .6
6.2 ± 0.4
Group 3 12,177 4.9 ± 1.6 33.0 6.9 ± 0.2
10,840 9.6 ±2.2 33.1± 2 .4
7.1 ± 0.3
Group 4 (control)
11,008 3.8 ±0.8 26.3 7.4 ± 0.2
9,600 10.3 ± 1.0
32.1± 2 .4
6.8 ± 0.4
Normalvalues*
4,GOO- 13,000
8.0-18.0 22-38
6.0-7.5 4,GOO- 12,000
9-15 27-45
6.0-7.5
Source: Jain, N.C (1993). In: Essentials of Veterinary Haematology. Lea & Febiger, Philadelphia, Pg 7.

- 39 -
(a)
—■— 0.75g/Kg — 1.5g/Kg -«-2.25g/Kg -« -O g /K g
1,2g/Kg 2.4g/Kg Og/Kg
Figure 2. Mean packed cell volume (%) against time (weeks) for (a) goats and (b) sheepAll treatment groups in goats had a higher PCV than the control (PcO.Ol) while PCV in sheep was within the normal range (P>0.05). Sheep had higher PCV values than goats and this difference was significant (p<0.0 1).

- 40 -
(a)
— 0.75g/Kg — 1.5g/Kg -» -2 .2 5 g /K g -« -0 g /K g
16000
14000
__ 12000 j2 1000001 5o5 8000
I 6000
4000
2000
0
(b)
3 4Time (Weeks)
-1.2g/Kg — 2.4g/Kg -a -O g/K g
Figure 3. Mean white blood cell counts (/ul) against time (weeks) in (a) goats and (b) sheep.There was a leucocytosis in 2nd and 3rd weeks of the experiment in goats and sheep respectively, the values normalizing thereafter (P>0.05). There was no significant difference in the WBC counts between the two species (P>0.05).

-41 -
4.6 RESULTS OF ANALYSIS ON SERUM BIOCHEMICAL PARAMETERS
4.6.1 Serum biochemical findings in goats
The s erum b iochemistry r esults a re s ummarized i n t able 7 b elow. O n t he b iochemical
parameters, GGT values in the treatment groups were significantly decreased (PO.Ol)
compared to the control but there was no difference within the treatment groups. Total
protein was significantly decreased between the control (group 4) and group 3 (2.25g/kg)
(PO.Ol) (Fig. 4a and appendix 6) while bilirubin values were not significantly different
but there was a slight bilirubinaemia in group 1 (0.75g/kg). AST and creatinine values
were within the normal ranges (P>0.05). Group 1 (0.75g/kg) had high AP values
compared to the control (PO.O l) (Fig. 5a and appendix 7).
Table 7. Mean and standard deviation values for total protein, AP, AST, GGT,
Bilirubin and Creatinine in goats
TreatmentTotalprotein(mg/dl)
Alkalinephosphatase(u/1)
AST(U/1) GGT (u/1) Bilirubin(mg/dl)
Creatinine(mg/dl)
Group 1 (0.75g/kg)
7.2 ± 0.3 85.7 61.2 ± 8 19.5 ± 1 0.5 ±0.2 0.9 ±0.1
Group 2 (1.5g/kg)
6.6 ±0.3 58.5 60.0 ± 8.6
18.2 ± 1 0.3 ± 0.2 0.9 ±0.1
Group 3(2.25g/kg)
6.4 ±0.4 55.0 63.6 ± 13.4
17.3 ± 1.6 0.4 ±0 .4 0.8 ± 0.1
Group 4 (Og/kg)
7.1 ±0.3 57.4 74.9 ± 8 22.9 ±1 0.3 ±0 .2 0.9 ±0.1
‘Pre-exptvalues
6.9±0.9 77.1±27 68.2±8.3 19.4±3.7 0.3±0.2 0.7±0.1
^Normalvalues
4-7.0 93-387 0-0.1 1 .0-1.8
‘Pre-experimental values for goats.2Source: Kaneko, J. J. (1980). In: Clinical biochemistry of domestic animals. 3rd edition. Academic Press Inc. Orlando, San Diego, New York, London, Toronto, Montreal, Sydney and Tokyo. Pg 792-3.

-42-
4.6.2 Serum biochemical findings in sheep
The biochemical parameters are summarized in table 8 below. Total protein values were
within the normal range (p>0.05) (Fig.4b and appendix 6). Alkaline phosphatase values
were significantly decreased in groups 1 (1.2g/kg) and group 3 (3.6g/kg) compared to the
control (p<0.05) (Fig. 5b and appendix 7) and the difference was significant even within
treatments (PO.05). Groups 2 (2.4g/kg) and 3 (3.6g/kg) had a slight increase in bilirubin
but this increase was not significant (P>0.05). Creatinine values were within the normal
range.
Table 8. Mean and standard deviation values for Total Protein, Alkaline
phosphatase, Bilirubin, Creatinine and Aspartate aminotransferase in
sheep
Treatment Total protein
(mg/dl)
AP
(u/1)
Bilirubin
(mg/dl)
Creatinine
(mg/dl)
AST (u/1)
Group 1
( 1 .2g/kg)
6.6 ±0.3 53.5 0.4 ±0.3 0.9 ±0.1 60.6 ± 8
Group2
(2.4g/kg)
6.2 ±0.4 78.6 0.7 ± 0.4 1.0 ± 0.1 65.4 ± 10
Group3
(3.6g/kg)
7.1 ±0.7 37 1.26 ± 0.6 1.1 ± 0.2 51.2 ± 17
Group 4
(Og/kg)
6.8 ±0.4 92.2 0.4 ±0.3 1.1 ± 0.1 65.6 ± 9
Normal
values*
6.0-7.9 68-
387
0.1-0.42 1.0- 1.8 48-128
Source: ‘ Kaneko, J. J. (1980). In: Clinical biochemistry of domestic animals. 3rd edition. Academic P ress I nc. 0 rlando, S an D iego, N ew Y ork, London, T oronto, M ontreal, S ydney a nd Tokyo. Pg 792-3.

- 4 3 -
(a)
—■— 0.75g/Kg -* -1 .5 g /K g -« -2 .25g /K g -* -O g /K g
(b)
—■— 1.2g/Kg - a—2.4g/Kg -« -O g/K g
Figure 4. Mean total protein (mg/dl) against time (weeks) in (a) goats and (b) sheepGroup 3 (2.25g/kg) goats showed hypoproteinaemia which was significant (P<0.01) while the other groups had normal values. In sheep TP was within the normal range (P>0.05) in all groups. Overall, there was a significant difference in TP between goats and sheep (PcO.Ol).

- 4 4 -
(a)
— 0.75g/Kg -* -1 .5 g /K g -* -2 .2 5 g /K g -* -O g /K g
(b)
1.2g/Kg -* -2 .4 g /K g —K— Og/Kg
Figure 5. Mean Alkaline phosphatase (u/1) against time (Weeks) in (a) goats and (b) sheep.AP was significantly increased in group 1 goats (0.75g/kg) compared to the control (P<0.01) but the increase in groups 2 and 3 was not significant. There was a significant decrease in AP in sheep in groups I (1.2g/kg) and 3 (3.6g/kg) compared to the control (P<0.05). However, there was no difference in AP between sheep and goats (P>0.05).‘Group 3 sheep data could not be plotted due to few measurements.

- 4 5 -
4.7 RESULTS OF PATHOLOGICAL EXAMINATION
4.7.1 Pathological findings in goats.
4.7.1.1. Pathological Findings in group 3 goats.
Three group 3 goats exposed to 0.75LDso (2.25g/kg) showed generalized congestion and
emaciation with gelatinization of all fat deposits, brain congestion and oedema and
haemorrhagic enteritis from duodenum to colon. Two goats had hydropericardium,
perihepatitis, froth in the bronchi and congestion in the liver and kidney while one goat
had a good body condition, hydroperitoneum, pneumonia, emphysema and haemorrhagic
ulcers on abomasums extending to distal pyrolus.
4.7.1.2. Pathological findings in group 2 goats.
Group 2 goats exposed to 0.5LD50 (1.5g/kg) did not show significant pathology in the
lungs, intestines, brain, abomasum and liver but one goat showed fibrinous pericarditis
with hydroperitoneum and injury to the kidney on removal o f the capsule.
4.7.1.3. Pathological Findings in group 1 goats.
No significant pathology was recorded in group 1 goats exposed to 0.25LD5o(0.75g/kg).
4.7.2 Pathological findings in sheep.
4.7.2.1. Pathological Findings in group 3 sheep.
Three group 3 sheep exposed to 0.75LD<;o (3.6g/kg) showed a good body condition while
one was emaciated. All sheep in this group had pneumonia, froth in the bronchi,
emphysema and congestion in the liver and kidneys. Three sheep had perihepatitis,

- 4 6 -
haemorrhagic ulcers on distal abomasum to proximal duodenum while two sheep had
haemorrhagic enteritis from duodenum to colon.
4.7.2.2. Pathological findings in group 2 sheep.
All group 2 sheep exposed to O.5LD50 (2.4g/kg) had a good body condition, congestion in
the brain, pneumonia, froth in the bronchi, lung emphysema and haemorrhagic ulcers on
distal abomasum to proximal duodenum. Three sheep had congestion o f the kidneys and
liver and haemorrhagic enteritis from duodenum to colon.
4.7.2.3. Pathological findings in group 1 sheep.
Three group 1 sheep exposed to O.25LD50 (1.2g/kg) had a good body condition while one
had generalized emaciation with gelatinization o f all fat deposits. Three sheep had
pneumonia, froth in the bronchi, lung emphysema and congestion in the brain. Two sheep
had hepatitis and perihepatitis while one had hydroperitoneum and roughening of the
surface of the abomasums.
The results of the gross pathological findings in sheep and goats are summarized in table
9 below.

- 4 7 -
Table 9. Gross pathological findings in sheep and goats
Goat groups Sheep groups
Gross Pathological finding *1 2 3 4 1 2 3 4
Carcass in good condition **4/4 0/4 1/4 0/4 3/4 4/4 3/4 0/4
Emaciation with fat gelatinization 0/4 0/4 3/4 0/4 1/4 0/4 1/4 0/4
Increased peritoneal fluid 0/4 0/4 1/4 0/4 1/4 0/4 0/4 0/4
Increased pericardial fluid 0/4 1/4 2/4 0/4 0/4 0/4 0/4 0/4
Brain congestion 0/4 0/4 3/4 0/4 3/4 4/4 0/4 0/4
Brain oedema 0/4 0/4 3/4 0/4 0/4 0/4 0/4 0/4
Perihepatitis 0/4 0/4 2/4 0/4 2/4 0/4 3/4 0/4
Hepatitis 0/4 0/4 0/4 0/4 2/4 0/4 0/4 0/4
Heamorrhagic enteritis from duodenum to
colon
0/4 0/4 3/4 0/4 0/4 3/4 2/4 0/4
Froth in bronchi 0/4 0/4 2/4 0/4 3/4 4/4 4/4 0/4
Lung emphysema 0/4 0/4 1/4 0/4 3/4 4/4 4/4 0/4
Pneumonia 0/4 0/4 1/4 0/4 3/4 4/4 4/4 0/4
Haemorrhagic ulcers on distal abomasum
to proximal duodenum
0/4 0/4 1/4 0/4 0/4 4/4 3/4 0/4
Congestion on kidney, liver, 0/4 0/4 2/4 0/4 0/4 3/4 4/4 0/4
Key: * = Group 1, 2 and 3 represent 0.25,0.5 and 0.75 LD» respectively while Group 4 represents thecontrol.
** 0-4 = number o f animals showing a particular pathological finding.

- 4 8 -
4.8 RESULTS OF HISTOLOGICAL FINDINGS IN SHEEP AND GOATS
4.8.1 Histological findings in goats
4.8.1.1. Histological findings in group 3 in goats
All goats in group 3 exposed to 0.75LDso (2.25g/kg) had wallerian degeneration of
neurons, necrosis o f Purkinje cells and formation o f micro-thrombi in the brain (Fig. 6a);
congestion, emphysema, interstitial pneumonia and proliferation of alveolar epithelium in
the lungs; congestion and centrolobular necrosis in the liver (Fig. 7a) and congestion,
intertubular haemorrhage and tubular necrosis with hyaline cast formation in the kidneys.
Three goats showed coagulative necrosis of the epithelium infiltrated with plasma cells
and lymphocytes with areas of ulceration from duodenum to colon and skeletal muscle
necrosis. One goat did not show ulceration of the epithelia. Two goats showed ulceration
and haemorrhage in the abomasums while two had epithelial erosions on abomasums.
4.8.1.2. Histological findings in group 2 goats
One group2 goat exposed to 0.5LD50 (1.5g/kg) had congestion, mild haemorrhage,
perivascular vacuolation, central chromatolysis of neurons and necrosis of Purkinje cells
in the brain (Fig. 6c) and chromatolysis of neurons and vacuolation in the spinal cord
while the three others had mild chromatolysis of neurons and necrosis of Purkinje cells;
three goats had mild lesions in other organs which included proliferation o f alveolar
epithelium, interstitial pneumonia, congestion and oedema; mild coagulative necrosis
from duodenum to colon with hyperplasia of glands of the colon; congestion,
centrilobular necrosis and intersinusoidal haemorrhage in the liver (Fig. 7c) and
congestion, glomerular necrosis and tubular necrosis with hyaline cast formation in the
kidneys.

-49-
4.8.I.3. Histological findings in group 1 goats
The lesions in group 1 goats exposed to 0.25LDso (0.75g/kg) were lung congestion and
mild interstitial pneumonia, mild erosion o f the intestinal epithelium, mild hepatic
centrilobular necrosis (Fig 7e), mild renal tubular necrosis and cerebral congestion (Fig.
6e).
The normal liver and brain is shown in fig. 8b and d.
4.8.2 Histological findings in sheep
4.8.2.1. Histological findings in group 3 sheep
All group 3 sheep exposed to 0.75LD5O (3.6g/kg) had widespread haemorrhage (Fig 6b),
chromatolysis of neurons, slight degree of wallerian degeneration and necrosis of
Purkinje cells of the brain; lung emphysema, oedema, interstitial pneumonia and
proliferation of alveolar epithelium; haemorrhagic enteritis infiltrated with lymphocytes
and plasma cells and ulceration from duodenum to colon; haemorrhage and ulceration in
the abomasums; hepatic bile duct proliferation and necrosis around central vein with the
degenerative changes varying from cloudy swelling to pyknosis of nuclei (Fig. 7b) and
congestion, intertubular haemorrhage and coagulative necrosis of tubules with hyaline
cast formation in the kidneys. Two males showed degeneration of basement membrane of
testis with aspermia. Two female sheep had necrotic changes in the uterus and ovaries.
4.8.2.2. Histological findings in group 2 sheep
All group 2 sheep exposed to 0.5LD50 (2.4g/kg) had widespread haemorrhage,
perivascular oedema and vacuolation, chromatolysis of neurons and necrosis o f Purkinje
cells in the cerebellum and wallerian degeneration o f neurons(Fig. 6d); lung emphysema,

- 5 0 -
oedema, interstitial pneumonia and proliferation of alveolar epithelium; coagulative
necrosis with areas o f ulceration from duodenum to colon and hyperplasia o f colonic
glands; fatty degeneration o f sinusoids, intersinusoidal haemorrhage, bile duct
proliferation in the liver (Fig. 7d) and massive intertubular haemorrhage, congestion,
glomerular necrosis and widespread tubular necrosis with hyaline cast formation in the
kidneys.
4.8.2.3. Histological Findings in group 1 sheep
All groupl sheep exposed to 0.5LDjo (1.2g/kg) had widespread haemorrhage,
perivascular vacuolation, chromatolysis o f neurons (Fig. 6f), and necrosis of the Purkinje
cells of the cerebellum; lung emphysema, proliferation o f alveolar and bronchiolar
epithelium and interstitial pneumonia, centrilobular necrosis and bile duct proliferation in
the liver (Fig. 7f), epithelial erosion on duodenum and ileum, hyperplasia of glands in the
colon with epithelial erosion and widespread tubular necrosis with hyaline cast formation
and glomerular necrosis in the kidneys.
The normal brain and liver in sheep are shown in fig. 8a and c.

5
Fig. 6a. Brain tissue from a goat fed 0.75LDW *"'£• (2.25g/kg) unripe fruit powder that died on day 6 showing microthrombi (arrows) in the gray matter (H&E x 200)
Fig. 6c. Brain tissue from a goat fed 0.5LDso (1.5g/kg) unripe fruit powder that died on day 49 showing necrosis of purkinje cells of the cerebellum (H&F x 400)
Fig. 6e. brain tissue from a goat fed 0.25LD<o (0.75g/kg) unripe fruit powder that was euthanized after 3 months show ing congestion of blood vessels (H&E x 200)
6b. Brain from a sheep fed 0.75LDjo (3.6g/kg) unripe fruit powder that died on day 2 showing haemorrhage front a blood vessel (H&E x 200).
Fig. 6d. Brain from a sheep fed O.5 LD50 (2.4g/kg) unripe fruit powder that died on day 4 show ing marked haemorrhage from a blood vessel (arrow ) and wallerian degeneration of neurons (H&E x 200)
Fig. 6f. Brain tissue from a sheep fed O.2 5 ED50 (1.2g/kg) unripe fruit powder that died on day 29 show ing widespread chromatolysis of neurons (H&E x 200)

52
Fig.7a. Liver of goat fed 0.75LD50 (2.25g/kg) unripe fruit powder that died on day 6 show ing congestion (C) and hepatic necrosis
Fig. 7b. Liver of sheep fed 0.75LDso (3.6g/kg) unripe fruit pow der that died on day 2 showing congestion (C) and proliferation of bile ducts (B). (H&E x 200)
Fig ,7c. Liver from a goat fed O.5 LD50 (l-5g/kg) unripe fruit pow der that died on day 49 showing intersinusoidal haemorrhage (H)
Fig 7e. Liver from a goat fed O.25LD50 (0.75g/kg) unripe fruit powder and euthanized after three months showing bile duct proliferation (B) and hepatic necrosis (N) (H&Ex200)
Fig. 7d. Liver of sheep fed 0.5LD$o (2.4g/kg) unripe fruit powder that died on day 4 show ing fat necrosis of sinusoids and bile duct
Fig. 7f. Liver of sheep fed O.5 LD50 (1 .2 g/kg)unripe fruit pow der that died on day 29 showing bile duct proliferation (arrow) and hepatic necrosis (N). (H&E x 200)

53
Fig. 8a. Normal tissue from the cerebellum of a control sheep showing normal purkinje cells (H&E x400).
Fig 8c. Normal liver tissue from a control sheep (H&E x 4(H))
Fig. 8b. Normal tissue from cerebellum of control goat show ing normal purkinje cells (H&E x 200)
Fig. 8d. Normal liver tissue from a control goat

- 5 4 -
CHAPTER 5
5.0 DISCUSSION
The LD50 in sheep was 4.8g/kg (320mg/kg) with a 95% confidence limit o f 3.0 - 7.7
while the LD50 in goats was 3.0g/kg (200mg/kg) with a 95% confidence limit o f 2.25 -
4.13 g/kg. This shows that the plant is quite toxic to both species of animals as the LD50
falls within the range 50- 500mg/kg range (Clarke et. al., 1981). However, the toxic dose
in goats is lower than that in goats but it appears that when goats are exposed to S.
incanum L for a prolonged period of time, they appear to detoxify the materials.
The oral LD50 for solanine in rats has been recorded as 590 mg/kg (Dalvi & Bowie, 1983)
while in sheep, the LD50 of total glycoalkaloids is 500 mg/kg b.wt with toxic effects
noted at 225 mg/kg b.wt. (Jadhav et al., 1981). This LD5ois similar to the one determined
for sheep in this study where the entire fruit was used. There is, however, no literature
showing LD50 values for the other Solanum species and to date this is the first such
determination. In this experiment there was a difference in the survival o f the two
species, which was statistically significant with the goats surviving 1 onger than sheep.
Animals at the lowest dosages survived for a longer period than the other dosages.
Clinically, both groups o f animals had different clinical manifestations, which were more
severe in sheep. This is shown by the fact that all goats in groups 1 (0.75g/kg), three in
group 2 (1.5g/kg) and one in group 3 (2.25g/kg) did not show any clinical signs of
intoxication whereas similar sheep groups (1 ,2 and 3) had severe signs of intoxication.
Prior exposure of ruminal bacteria to toxic plants increases the rate o f detoxification,

- 55 -
indicating an adaptive response by the bacteria to these substrates (Carlson and Breeze,
1984). Rumen microbes from naive cattle and sheep that had not been exposed to various
alkaloids (sparteine, lupanine, cystine, atropine, quinidine, nicotine, harmaline, arecoline,
caffeine, and senecionine) were not able to degrade these alkaloids whereas animals that
were exposed degraded them (Ramon and Michael, 2005). Rumen microorganisms from
a sheep preconditioned to lupin alkaloids tolerated lupanine much better than non-
adapted microorganisms (Ramon and Michael, 2005).
Sometimes, degradation activities are related to adaptive changes in the rumen
microorganism populations, which result in an acquired resistance to specific toxins
(Duncan et al., 2000, Duncan and Milne, 1992; Newbold et al., 1997). Goats being
browsers s ometimes feed o n t he green b erries o f S. i ncanum L a nd t his c ould 1 ead t o
adaptation o f the rumen microbes to this toxin. It is, therefore, possible that some degree
of detoxification of unripe berries of S. incanum L occurs in goats through this
adaptation.
Species differences in this detoxification process have also been demonstrated by Shull
et. al., (1976) who showed that incubation of Senecio jacobaea with rumen fluid from a
steer reduced the toxicity o f the plant to rats while similar rumen fluid from a sheep did
not. The detoxification of pyrrolizidine alkaloids by rumen microbes is also documented
(Culvenor, et. al., 1962, Lanigan, 1970) and it is possible that there is detoxification of
Solatium incanum L in goats and not in sheep.

- 56 -
Steyn (1949) had listed the main clinical signs of S. incanum L poisoning in animals as
salivation, diarrhoea, colic, bloat, stomatitis, tachycardia, polypnea, cramps, paralysis and
occasionally, a vesicular exanthema. Kingsbury (1964) also reported signs of progressive
weakness leading to paralysis and unconsciousness. These signs are similar to those
recorded in this study but both species of animals also showed nervous signs of
depression, staggering gait and lateral recumbency with leg paddling movements which
had not been recorded by Steyn (1949) and Kingsbury (1964). In this experiment, sheep
did not show the continuous bleating, which was recorded in goats.
Neurological diseases in ruminants caused by ingestion of different Solanum species have
been described in South Africa, North America, South America, Australia and Western
Uruguay (Raquel et al., 2006; Verdes et al., 2006; Medeiros, et al., 2004; Porter et al.,
2003; Bourke, 1997; Summers et al., 1995; Riet-Correa et al., 1983; Menzies et al., 1979;
Pienaar et al., 1976). Solanum fastigiatum var. fastigiatum (Riet-Correa et al., 1983) and
Solanum bonariense (Verdes et al., 2006) cause a syndrome in cattle characterized by
periodic attacks of ataxia, hypermetria, opisthotonus, nystagmus and falling to the side or
backwards with animals appearing normal between episodes.
However, Solanum viarum (Porter et al., 2003) causes a syndrome similar to the one in
goats in this study, where the goats developed ataxia and head tremors, recumbency with
inability to rise and death after grazing on pastures for 6-12 months. In all these studies
including 5. incanum L, the animals exhibited signs o f cerebellar disease and the
variations in clinical manifestation may be due to species differences within the Solanum

- 5 7 -
plants. It is also important to note that rats fed Solatium incanum L unripe fruit powder
mixed with feed did not show the signs o f cerebellar degeneration (Thaiyah, 1992).
On haematology there was a transient elevation in white cell counts in the two species,
which was more marked in goats but the difference was not significant (P>0.05). Goats
also showed a lower PCV than sheep (P<0.01). Other haematological parameters were
within the normal range in both species. In Solarium viarum (Porter et al., 2003) all the
haematological parameters were within the normal range except for a moderate anaemia,
which was also recorded in goats in this study.
Serum enzyme parameters were also significantly different between the two species.
Bilirubinaemia was observed in group 2 and 3 sheep and in group 1 goats but the increase
was not significant (P>0.05). The levels of creatinine and aspartate aminotransferase
were normal in goats and sheep. Similar results were also obtained with Solatium viarum
poisoning in goats (Porter et al., 2003). This failure of serum enzymes from the liver to
increase can be associated with the hepatic protective property of Solatium incanum L.
(Chin, 1989). When crude extracts from the total Solanum incanum plant are
administered to rats poisoned with carbon tetrachloride, the elevated levels o f AST and
ALT due to carbon tetrachloride are significantly decreased (Chin, 1989). In this study
marked hypoproteinaemia was recorded ingroup 3 (2.25g/kg) goats (P<0.05) while in
sheep serum total proteins were normal. Alkaline phosphatase levels were elevated in
group 1 (0.75g/kg) goats but reduced in group l(1.2g/kg) and 3 (3.6g/kg) sheep.

- 58 -
Pathological changes were recorded in various organs of the body. Group 3 goats
(2.25g/kg) had hydroperitoneum and hydropericardium, which were also recorded in
group 1 (1.2g/kg) sheep. This fluid accumulation could be as a result of
hypoproteinaemia, which was recorded at these dosages. It is interesting to note that
gross pathology as recorded in other organs apart from the brain in sheep and group 3
(2.25g/kg) goats was not recorded with S. fastigiatum var fastigiatum in cattle (Raquel et
al., 2006; Riet-Correa et al., 1983), S. bonariense in cattle (Verdes et al., 2006), S.
viarum in goats (Porter et al., 2003), S. kwebense in cattle (Pienaar et al., 1976) and S.
cinereum in goats (Bourke, 1997). From the above literature, only the study with
Solanum bonariense (Verdes et al., 2006) indicated the use o f leaves for the poisoning
while the rest do not state the part o f the plant used.
Unripe fruits o f S. incanum L contain steroidal glycosides the major ones being solanine,
incanumine, solamargine, solasodine, ursolic acid and other ursolic acid derivatives
(Chun-Nan, 1990). It is possible that all or some of these chemical compounds could
cause gross pathological lesions observed in goats and sheep, which has not been
reported before.
Histopathological lesions were also significant. In the lungs, both sheep and goats had
severe interstitial pneumonia and emphysema and proliferation of alveolar epithelium,
which was manifested clinically by coughing. The interstitial pneumonia could have been
due to lowering of immunity by the toxin, which also produced proliferative changes in
the alveoli. In the liver, there was centrilobular necrosis and bile duct hyperplasia, which

- 59 -
was more marked in sheep. These findings are consistent with those found in other plant
poisonings affecting the liver which include plants in the genera Senecio, Heliotropium,
Amsinca, Echium, Crotalaria, Symhytum and Trichodesma spp (Adams, 1974; Hooper,
1978), Cestrum (Mugera and Nderitu, 1968b), Lantana (Gopinath and Ford, 1969),
Tribulus terrestris L (Van Tonder et. al., 1972), Brachiaria decubens (Graydon et. al.,
1991), Asaemia axillaris, Pteronia pollens, Lasiospermun bipinnatum and Galenia
africana in South Africa (Kellerman et. al., 1988). This liver pathology was more severe
in sheep than in goats and this is well indicated by the high bilirubin levels in group 2
(2.4g/kg) and 3 (3.6g/kg) sheep and this finding has not been reported before.
According to Jones and Hunt (1983) the tissue changes in S. incanum L poisoning
accounting for nervous signs have not been described and histopathological studies have
not been made. The current study fills this gap by giving detailed description of
histopathological findings in the brain namely; wallerian degeneration o f neurons in the
white matter, chromatolysis of neurons and necrosis and vacuolation of the Purkinje cell
layer. In addition, sheep showed widespread haemorrhage into nervous tissue and
depletion of the Purkinje cells. These findings were, however, not seen in rats fed
Solanum incanum L orally mixed with chicken mash, which only showed congestion and
vacuolation in nervous tissue (Thaiyah, 1992).
According to Cheeke and Shull (1985) and Morris and Lee (1984), the nervous signs in
glycoalkaloid poisoning are due to inhibition of cholinesterase. The nervous signs in this
study may also be associated with the severe pathology seen in the nervous tissue and

- 60 -
especially the cerebellum. Other studies with Solatium species have shown cerebellar
disorders (Raquel et al., 2006; Verdes et al., 2006; Medeiros, et al., 2004; Porter et al.,
2003; Bourke, 1997; Summers et al., 1995; Riet-Correa et al., 1983; Menzies et al., 1979;
Pienaar et al., 1976). It is important to note that most of the current knowledge on
Solarium poisoning has been obtained through description o f field cases except in
Solatium bonariense where fresh leaves were fed to cattle (Verdes et al., 2006). Thus for
Solatium cinereum (Bourke, in 1997) in goats, signs were only recognized after 12
months o f pasturing the animals in the field. The parts of the different Solatium plants
causing the toxicity were not documented.
This present study thus differs from the rest in that actual unripe fruits were used within a
specified period of time under controlled conditions and the results are actually
attributable to the unripe fruits of Solatium incanum L and constitute new findings. This
has not been done before. In addition, the toxin appears to have some effect on blood
capillaries in sheep resulting in haemorrhage by diapedesis.
In the kidneys, there were nephritic changes manifested by widespread tubular necrosis
with hyaline cast formation and degenerative changes in the glomeruli. In the
gastrointestinal tract the changes varied from coagulative necrosis to deep ulceration of
the mucosal lining from the abomasum to the colon with hyperplasia o f colonic glands.
Similar findings have been reported in sheep poisoned with Solatium carolinense (Upenn,
2005). In rats, however, there was also development of adenocarcinoma in the small
intestines (Thaiyah, 1992), which was not recorded in this experiment.

-61 -
This study has shown that Solanum incanum L is toxic to sheep and goats but the toxicity
was more severe in sheep as shown by clinical signs, gross pathology and histopathology.
Further studies would include the determination of the factors causing this reduced
toxicity in goats. Effect o f rumen degradation on the toxins should be evaluated and the
active principles in unripe fruits responsible for producing the effects o f toxicity should
be identified.

- 6 2 -
CHAPTER 6
6 .0 CONCLUSION
1. The LD50 was 3.0 and 4.8g/kg in goats and sheep, respectively.
2. There are differences in the clinical manifestation of S. incanum L toxicosis in
both species of animals. In sheep, the main clinical signs were bloat, vomiting,
hypersalivation, staggering gait, depression and lateral recumbency with leg
paddling movements and death and these signs are pathognomonic in sheep.
However, signs in goats were bloat, diarrhoea and shivering.
3. There are significant differences in haematological and biochemical findings
between sheep and goats as exemplified by hypoproteinaemia in group 3 goats
(2.25g/kg) and bilirubinaemia in sheep groups 2 (2.4g/kg) and 3 (3.6g/kg).
Overall sheep had higher PCV values than goats.
4. Differences in the gross pathology between the two species o f animals were
noted especially in group 1 (0.75g/kg) and 2 (1.5g/kg) goats that did not have
gross pathological signs.
5. There are differences in the histology as noted in the various organs and
especially the brain. In the brain of goats in group 1, there was only congestion
while goats in group 2 had mild necrosis of Purkinje cells in the cerebellum and
chromatolysis o f neurons in the brain. In all sheep groups, there was severe
chromatolysis o f neurons and necrosis and loss o f Purkinje cells in the
cerebellum. Overall, in the diagnosis of this poisoning, histological examination
will confirm the diagnosis using the differential lesions described above.

- 6 3 -
6. Unripe fruits of S. incanum L are toxic to both sheep and goats but the toxicity is
m ore severe in sheep. This is shown clearly by the survival pattern where goats
lived longer than sheep in all dose groups and by the clinical, pathological and
histopathological findings.

-64-
7 .0 REFERENCES
1- Adams S. E. (1974). Hepatotoxic activity of plant poisons and mycotoxins in
domestic animals. Vet. Bull. 44: 767-777.
2 . Agnew, A. D. Q. (1974). Upland Kenya wild flowers. Oxford University Press. U.
K. pp. 529.
3. Allcroft, R. and Camaghan, R. B. A. (1963). Groundnut toxicity. An estimation for
toxin in human food products from animals fed toxic groundnuts. Vet. Rec. 75:
259-263.
4 . Anderson, C. R. and Divers, T. J. (1983). Systemic granulomatous inflammation in
a horse grazing hairy vetch. J. Am. Vet. Med. Ass. 183:569-570.
5. Badru, G. (1989). Toxicity studies of Ajuga remota Benth in rats and goats. M.Sc.
Thesis, University o f Nairobi.
6 . Baker, D. C. and Keeler, R. F. (1992). Myopathy associated with Thermopsis
montana ingestion in cattle. In: James, L. F., Keeler, R. F., Bailey, E. M., Cheek, P.
R. and Hegarty, M. P. (eds). Poisonous plants: Proceedings of the 3rd inti.
Conference. IOWA State Univ. Press, Ames, IA.
7. Bergers, W. W. and Alink, G. M. (1980). Toxic effect of the glycoalkaloid solanine
and tomatine on cultured neonatal heart cells. Toxicology letters vol. 6 (1) 29-32.
8. Bourke, C.A. (1997). Cerebellar degeneration in goats grazing Solanum cinereum
(Narrawa burr). Aust. Vet. J. 75 (5) 363-365.
9. Braun, J.P., Rico, A.G., benard, P., Thouvenot, J.P. and Bonnefis, M.J. (1978).
Tissue and blood distribution o f Gamma-glutamyltransferase in the lamb and in the
ewe. Res. Vet. Sci. 25, 37-40. \
4

- 6 5 -
10. Bryson, R. W. (1982). Kikuyu grass poisoning and armyworm. J. S. Aft. Vet. Ass.
53: 161-165.
11 - Burrow, G . E . and T yrl, R . J. (1989). P lants c ausing sudden d eath i n Livestock.
V et. Clinics North Amer. Food Anim. Prac. 5: 263-287.
12. Carlson, R. J. and Breeze, R. G. (1984). Ruminal metabolism of plant toxins with
emphasis on indolic compounds. J. Anim. Sci. 58: 1040-1049.
13. Carlson, J. R. and Dickinson, E. O. (1978). Tryptophan induced pulmonary oedema
and emphysema in ruminants. In: Keeler, R. F., Van Kampen, K. R. and James L.
F. (eds). Effects of poisonous plants on livestock, Academic press, New York. Pp.
261-272.
14. Carrigan, M. J. and Gardiner, I . A. (1982). Nitrate poisoning in cattle fed sudax
(sorghum species hybrid) hay. Aust. Vet. J. 59: 155-157.
15. Chalton, K. M., Clabom, L. D. and Pierce, K. R. (1971). A neuropathy in goats
caused by experimental Coyotillo (Karwinski humboldtiana) poisoning. Am. J. Vet.
Res. 32: 1381-1389.
16. Chaube, S. and Swinyard, C. A. (1976). Teratological and toxicological studies of
alkaloidal and phenolic compounds from S. tuberosum L. Toxicol. Appl.
Pharmacol. 36, 227-237.
17. Cheek, P . R . (1990). P erspective o n h uman h ealth c oncems a rising f rom n atural
toxicants in feeds and poisonous plants. Vet. And Human Toxicol. 32: 71-75.
18. Cheek, P. R. ed (1989). Toxicants of plant origin vol. I-IV. CRC Press Inc. Boca
Raton FI. USA.

-66-
19. Cheek, P. R. and Shull, L. R. (1985). Natural toxicants in feed and poisonous
plants. AVI publishing Co. Westport C.T.
- 0 . Chin, Hui-Fen (1989). The Pharmacological and Pathological Studies on Several
Hepatic Protective Crude Drugs from Taiwan (II). The American Journal of
Chinese Medicine, Vol. 17, Nos. 1-2,17-23.
2 1 . Chun - Nan Lin, Chai-Ming Lu, Ming-Kung Cheng and Kim-Hong Gan (1990).
The cytotoxic principles of Solanum incanum. J. natural products vol 53, No. 2,
513-516.
2 2 . Clarke, M. L., Harvey, D. G. and Humphreys, D. J. (1981). In: Veterinary
toxicology. 2nd edition. Pg 8. Bailliere Tindall, London.
2 3 . Coetzer, J. A. W., Kellerman, T. S., Sadler, W. and Bath, G. F. (1963).
Photosensitivity in S. Africa V: A comparative study of the pathology of the ovine
hepatogenous photosensitivity diseases, facial eczema and geeldikkop (Tribulosis
ovis) with special reference to their pathogenesis. Onderstepoort J. Vet. Res. 50:
59-71.
24. Conn, E. E. (1978). Cyanogenesis, the production of hydrogen cyanide by plants.
In: Keeler, R. F., Van Kampen, K. R. and James L. F. (eds). Effects of poisonous
plants on livestock, Academic press, New York. Pp. 301-310.
25. Couch, J. F. (1929). Tremetol the compound that produces trembles (milk
sickness). J. Am. Chem. Soc. 51:3617.

-67-
2 6 . Culvenor, C.C.J., Dann, A.T. and Dick, A.T. (1962). Alkylation as the mechanism
b y which the hepatotoxic pyrrolizidine alkaloids act on cell nuclei. Nature, 195,
570-573.
2 7 . Dallorso, M. E., Gil, S., Pawlak, E., Lema, F., and Marquez, A. (2001). 1,25 (OH)2
Vit. D concentration in the plasma of S. glaucophyllum intoxicated rats. Aust. Vet.
J. 79: (6) 419-423.
2 8 . Dalvi, R.R. and B owie, W .C. (1983). Toxicology o f solanine: an overview. Vet.
Hum. Toxicol. Feb; 25 (1): 13-15.
2 9 . Dickinson, J.O. and King, R. R. 1978). The transfer of pyrrolizidine alkaloids from
Senecio jacobacea into the milk o f lactating cows and goats. . In: Keeler, R. F., Van
Kampen, K. R. and James, L. F. (eds). Effects of poisonous plants on livestock, pp.
201-208. Academic Press, New York, San Francisco, London.
3 0 . Dirksen, G., Plank, P., Simon, U., Hanichen, T., Daniel, P. and Speiss, A. (1974).
Uber ein enzootiche kalzinose bein Rind VII. Nachweis de kalzinogen wirkung von
Goldhafer (Trisetum flavescens L.) bein wiederkauer. Dtsch. Tierarzh Wschr 81: 1-
5.
31 . Dobereiner, J., Tokamia, C. H., Decosta, J. B. D., Campos, J. L. E. and Dayrell, M.
D. ( 1971). “ Epispichamento”, Intoxicacao d e b ovinos p or Solatium malacoxylon,
no pastoral de moto gross. Pesqui. Agropecu. Bras. Ser vet. 6: 91-117.
32. Done, S. H., Dobereiner, J. and Tokamia, C. H. (1976). Systemic connective tissue
calcification in cattle poisoned by Solatium malacoxylon, a histological study. Brit.
Vet. J. 132: 28-38.
- 6 8 -
- 3 . D uncan, A.J., Frutos, P. and Young, S. A. (2000). The effect o f rumen adaptation to
oxalic acid on selection of oxalic acid-rich plants by goats. Br. J. Nutr. 83:59-65.
34 . Duncan, A J. and Milne, J.A. (1992). Rumen microbial degradation of allyl cyanide
as a possible explanation for the tolerance o f sheep to Brassica derived
glucosinolates. J. Sci. Food Agric. 58:15-19.
35 . Evans, W. C. (1964). Bracken fem poisoning of farm animals. Vet. Rec. 76: 365-
369.
36 . Facciola, S (1990). Cornucopia: A source book of edible plants. Kampong
publishing. Vista, California, pp 207-209.
37 . Falvey, L. (1976). The effect of Leucaena leucocephala on cattle in the Northern
territory. Aust. Vet. J. 55: 243.
3 8 . Fukuhara, K. and Kubo, I. (1991). Isolation of steroidal glycoalkaloids from
Solanum incanum by two countercurrent chromatographic methods.
Phytochemistry. 30(2), 685-7.
3 9 . Gathumbi (1995). Toxicity of Primus africana and its effects on the prostrate gland
in rats. PhD thesis, University o f Nairobi.
4 0 . Geary, T. (1950). Castor bean poisoning. Vet. Rec. 62: 472-473.
4 1 . Gopinath, C. and Ford, E. J. H. (1969). The effect o f Lantana camara on the liver
in sheep. J. Path. 99: 75-85.
42 . Gomiak, S. L., Dagli, M. L., Maiorka, P. C., Raspantini, P. C. and Jerico, M. M.
(1999). Evaluation in rabbits of the fetal effects of maternal ingestion o f S.
malacoxylon. Vet. Res. Com. 23 (5) 307-316.

- 69 -
43. G raydon, R. J., Hamid, H., Zahari, P. and Gardiner, C. (1991). Photosensitization
and crystal associated cholangiohepatopathy in sheep grazing Brachiaria
decumbens. Aust. J. Vet. Res. 68: 234-236.
44. H artley, W. J. (1978a). A comparative study of darling pea (Swainsona spp.)
poisoning in Australia with locoweed (Astragalus and Oxytropis spp.) poisoning in
N . America. In: Keeler, R. F., Van Kampen, K. R. and James, L. F. (eds). Effects of
poisonous plants on livestock, pp. 391-393. Academic Press, New York, San
Francisco, London.
45. Hegarty, M. P„ Court, R. D„ Christie, G. S. and Lee, C. P. (1976). Mimosine in
Leucena leucocephala is metabolized to a goitrogen. Aust. Vet. J. 52: 490.
46. Hemkem, R. W., Jackson Jnr. J. A. and Boling, J. A. (1984). The toxic factors in
tall fescue. J. Anim. Sci. 58: 1011-1016.
47. Hintikka, E. L. (1977). Stachybotryotoxicosis as veterinary problem. In: Rodricks,
J. V., Hesseltine, C. W., Mehlman, M. A. (eds). Mycotoxins in human and animal
health. Park Forest South Illinois. Pathotox publishers.
48. Hoffmann, W.E., Renegar, W.E. and Domer, J.L. (1977a). Serum half life of
intravenously injected intestinal and hepatic alkaline phosphatase isoenzymes in the
cat. Amer. J. Vet. Res. 38, 1637-9.
49. Holmes, J. H. G., Humphrey, J. D., Walton, E. A. and O ’shea, J. D. (1981).
Cataracts, goitre and infertility in cattle grazed on an exclusive diet of Leucena
leucocephala. Aust. Vet. J. 57: 251-252.
50. Hooper, P. T. (1978). Pyrrolizidine alkaloid poisoning. Pathology with p articular
reference to differences in animals and plant species. In: Keeler, R. F., Van

- 70 -
K am pen, K. R. and James, L. F. (eds). Effects o f poisonous plants on livestock, pp.
353-361. Academic Press, New York, San Francisco, London.
51. H ooper, P. T., Susan, M. B. and Campbell, A. (1974). Axonal dystrophy in the
spinal cord o f cattle consuming the cycad palm, Cycas media. Aust. Vet. J. 50: 146-
149.
52. H om feldt, C. S. and Collins, J. E. (1990). Toxicity of nightshade bellies (S.
dulcamara') in mice. J. Toxicol. Clin. Toxicology (28) 2, 185-192.
53. Hutchinson, T. W. S. (1977). Onions as a cause of Heinz body anaemia and death
in cattle. Can. Vet. J. 18: 358-360.
54. Jadhav, S.J., Sharma, R.P. and Salunke, D.K. (1981). Naturally occurring toxic
alkaloids in foods. Crit. Rev. Toxicol 9: 21-104.
55. Jain, N.C (1993). In: Essentials o f Veterinary Haematology. Lea & Febiger,
Philadelphia, Pg 7.
56. Jain, W . C. (1986). Schalm’s Veterinary Haematology. 4Ul Ed. Lea and Febiger,
Philadelphia.
57. James, L.F., Nielson, D.B., Panter, K. E. (1992a). Impact o f poisonous plants on
livestock industry. J. Range Mgt. 45: 3-8.
58. James, L. F., Panter, K. E., Nielson, D.B. and Molyneux, R. J. (1992b). The effects
o f natural toxins on reproduction in Livestock. J. Anim. Sci. 70: 1573-1579.
59. James, L. F. (1978). Oxalate poisoning in Livestock. In: Keeler, R. F., Van
Kampen, K. R. and James, L. F. (eds). Effects of poisonous plants on livestock, pp.
139-145. Academic Press, New York, San Francisco, London.

60- J a m e s , L. F., Forte, W., Mye, W. and Hartley, W. J. (1977). Effects of milk from
a nixnals fed on locoweed on kittens, calves and lambs. Am. J. Vet. Res. 38: 1263-
1265 .
61- Jendrassik , L. Ecoll (1938). Verinfachte Photometrische Methoden Zur Bestimung
D e s Blutbilirubins. Biochem Z. 297: 81.
62. Johnson , A. E. (1976). Changes in calves and rats consuming milk from cows fed
chronic lethal doses o f Senecio jacobaea (tansy ragwort). Am. J. Vet. Res. 37: 107-
110.
63. Jones, T.C. and Hunt, R.D. (1983). In: Veterinary pathology; Diseases due to
extraneous poisons, pg. 913. 5lh ED. Lea and Febiger. Philadelphia.
64 . K am au, J. A. (1973). Senecio moorei and Adenia volkensii toxicosis in animals.
M .Sc Thesis, University o f Nairobi.
65 . Kambizi, L and Afolayan, A. J. (2001). An ethnobotanical study of plants used in
the treatment o f sexually transmitted diseases (njovhera) in Guruve District,
Zimbabwe. J. o f Ethnopharmacologv, Vol.77, issue 1, 5-9.
66. Kaneko, J. J. Ed. (1989). Clinical biochemistry of domestic animals. 4lh Ed.
Academic Press. San Diego, New York, Berkely, Boston, London, Sydney, Tokyo,
Toronto.
67. Kellerman, T. S., Prozesky, L., Shultz, R. A., Rabie, C. J., Van Ark, H., Maartens,
B. P. and Lubben, A. (1991). Perinatal mortality in lambs o f ewes exposed to
cultures of Diplodia maydis (Stenocarpella maydis) during gestation. Onderstepoort
-71-
J. Vet. Res. 58: 297-308.

-72-
J~ • K ellerm an, T. S., Coetzer, J. A. W. and Naude, T. W. (1988). Plant poisoning and
mycotoxicoses o f Livestock in Southern Africa. Oxford University Press, Cape
Tow n.
69. Kellerman, T. S., Adelaar, T. F. and Minne, J. A. (1972). The toxicity o f pollen
beetle Astylus atromaculatus Blanch. J. S. Afr. Vet. Ass. 43: 377-381.
Kingsbury, J.M. (1964). Poisonous plants o f the United States and Canada.
Eaglewood Cliffs, New Jersey: Prentice-Hall Inc.
71. Kiptoon, J. C., Mugera, G. M. and Waiyaki, P. G. (1982). Haematological and
biochemical changes in cattle poisoned with Gnidia latifolia syn. Lasiosiphon
latifolius (Thymeleceae). Toxicol. 25: 129-139.
~2. Kiptoon, J. C. (1981). Toxicological investigation o f Gnidia /atifolia (Meisn), a
plant commonly used in traditional medicine. PhD thesis. University of Nairobi.
~:3. Kirk, J. H. and Bulgin, M.S. (1979). Effects of feeding cull domestic onions
(Allium cepa) to sheep. Am. J. Vet. Res. 40: 397-399.
74. Kokwaro, J. O. (1976). Medicinal plants of East Africa. East African Literature
Bureau, Kampala, Nairobi, Dar-es-salaam.
75. Krook, L., Wesserman, R. H., Shively, J. N. and Tashjian, J. F. (1975).
Hypercalcemia and calcinosis in Florida horses. Implication o f the shrub Cestrum
diumum as the causative agent. Cornell Vet. 65: 26-56.
76. Kubik, M., Ames, M. M., Powis, P., Moertel, C. G., Hahn, R. G. and Creagon, E.
T. (1980). Outbreak o f hemlock poisoning in cattle. Veterinarstui 30: 157.
77. Lanigan, G.W., Payne, A.E. and Frahn, J.L. (1976). Origin o f toxicity in parasitized
annual ryegrass (Lorium rigidum). Aust. Vet. J. 52: 244-246.

- 73 -
L a ru g a n , G.W. (1970) Metabolism of pyrrolizidine alkaloids in the ovine rumen. II.
S o m e factors affecting rate o f alkaloid breakdown by rumen fluid in vitro. Aust. J.
A g ric . Res. 21, 633-640.
L in co ln , S. D., Howell, M. E., Comb, J. J. and Hinman, D. D. (1992). Hemolytic
e ffe c ts and feeding performance in cattle fed cull domestic onions (Allium cepa). J.
A m er. Vet. Med. Ass. 200: 1090-1094.
SO. M arasas, W. F. O., Kellerman, T. S., Pienaar, J. G. and Naude, T. W. (1976).
Leucoencephalomalacia: A mycotoxicosis o f equidae caused by Fusarium
m oniliform e Sheldon. Onderstepoort J. Vet. Res. 43: 113-122.
81 . M cIntosh, G. H. and Thomas, M. R. (1967). Toxicity o f parasitized Wimmera
ryegrass, Lorium rigidum, for sheep and cattle. Aust. Vet. J. 43: 349-353.
82 . M edeiros, R.M.t., Guilherme, R.F., Riet-Correa, F (2004). Experimental poisoning
b y Solarium paniculatum (jurubeba) in cattle. Pesq. Vet. Bras. 24 (suppl): 41.
83. M enzies, J. S., Bridges, C. H. and Bailey, E. M. (1979). A neurological disease of
cattle associated with S. dimidiatum. Southwestern Vet. 32: 45-49.
84. M orris, S. C. and Lee, T. H. (1984). The toxicity and teratogenicity o f Solanaceae
Glycoalkaloids particularly those o f the potato Solanum tuberosum. A review. Food
Technology in Australia 36: 118-124.
85. Muchiri, D. J. (1987). Studies on some pharmacologic and toxic properties of
Peddiae volkensii gilg and Scutia myrtina. PhD Thesis, University of Nairobi.
86. Mugera, G. M. (1970). Toxic and medicinal plants of East Africa. Part II. Bull.
Epiz. Dis. Aff. 18: 399-403.

- 7 4 -
^ ' B u g e r a , G. M. and Nderitu, P. (1968b). Cestrum poisoning in Kenyan Livestock.
B u l l . Epiz. Dis. Air. 16: 501-506.
N e s e r , J. A., Coetzer, J. A. W., Boomker, J. and Cable, H. (1982). Oak (Quercus
r o b u r ) poisoning in cattle. J. S. Afr. Vet. Ass. 53: 151-153.
S9. iN ew bold, C.J., El-Hassan, S.M., Wang, J., Ortega, M.E. and Wallace, R.J. (1997).
In fluence o f foliage from African multipurpose trees on activity o f rumen protozoa
a n d bacteria. Br. J. Nutr. 78:237-249.
90 . N ew sholm e, S. J. and Coetzer, J. A. W. (1984). Myocardial pathology o f domestic
anim als in Southern Africa. J. S. Afr. Vet. Ass. 55: 89-96.
91. Newsholme, S. J., Kellerman, T. S., Van der Westhuizen, G. C. A. and Soley, T.
(1983). Intoxication o f c attle o n K ikuyu grass following a rmyworm ( Spodoptera
exampta) invasion. Onderstepoort J. Vet. Res. 50: 157-167.
92. N ishie, K., Norred, W.P. and Swain, A.P. (1975). Pharmacology and toxicology of
chaconine and tomatine. Res. Commun. Chem. Pathol. Pharmacol., 12: 657-668
93. N jiro, S. M. (1984). Chemical and biological properties of Spirostachys venenifera
Pax methanol extract. PhD thesis, University o f Nairobi.
94. Olson, C. (1978). Selenium in plants as a cause of Livestock poisoning. In: Keeler,
R. F., Van Kampen, K. R. and James, L. F. (eds). Effects o f poisonous plants on
livestock, pp. 121-133. Academic Press, New York, San Francisco, London.
95. Panter, K. E., Keeler, R. F., James, L. F. and Bunch, T. D. (1992). Impact o f plant
toxins on fetal and neonatal development: a review. J. Range Mgt. 45: 52-57.
96. Persijn, J.P. and Van der Slik, W. (1976). A new method for determination of
gamma glutamyl transferase in serum. J. Clin. Chem. Clin. Biochem. 14:421.

- 7 5 -
97 - P h il lip s , E. P. (1917). In: Medicinal and poisonous plants o f Southern and East
A frica . 2nd Edition. E and S Livingstone, 1962.
98. P ien aar, J. G., Kellerman, T. S., Basson, P. A., Jenkins, W. L. and Vahrmeijer, J
(1 9 7 6 ). Maldronsiekte in cattle: A neuropathy caused by Solarium kwabense N.E.
O nderstepoort J. Vet. Res. 43: 67-74.
99. P orter, M.B., Mackay, R.J., Elizabeth Uhl, Platt, S.R. and Alexander de Lahunta
(2003). Neurologic disease putatively associated with ingestion o f Solarium viarum
in goats. JAVMA, Vol. 223, No. 4, august 15: 501-504.
100. Prozesky, L., Kellerman, T. S., Jordaan, P. and Welman Wilhelmina, G. (1986). An
ovine hepatotoxicosis caused by the plant Hertia pollens (Asteraceae) Kuntze.
Onderstepoort J. Vet. Res. 52: 233-238.
101. RAPhs, M. H. (1992). Continued food aversion. Training livestock to avoid eating
poisonous plants. J. Range mgt. 45: 46-51.
102. Ramon, A and Michael, W. (2005). Do naive ruminants degrade alkaloids in the
rumen? J. Chemical Ecology, vol. 31. No. 4, April, 761-787.
103. Raquel R. Rech, Daniel R. Rissi, Aline Rodrigues, Felipe Pierezan, Jose V.M.
Piazer, Glaucia D. Kommers, Claudio S.L. Barros (2006). Poisoning by Solatium
fastigiatum (Solanaceae) in cattle: epidemiology, clinical signs and morphometry of
cerebellar lesions. Pesq. Vet. Bras. July/Sept. 2006, vol.26, no.3:183-189.
104. Reitman, S. and Frankel, S. (1957). A calorimetric method for the determination of
serum glutamic oxaloacetic and glutamate pyruvate transaminases. Am. J. Clin.
Path. 28: 56-63.
I
- 76 -
105. Riet-Correa, F., Del Carmen Mendez, M., Schild, A. L„ Summers, B. A. and
O liveira, J. A. (1983). Intoxication by S. as a cause of
cerebellar degeneration in cattle. Cornell Vet. 73, 240-256.
106. Schneider, D. J. (1981). First report of annual ryegrass toxicity in the republic of
South Africa. Onderstepoort J. Vet. Res. 48: 251-255.
107. Schneider, D. J. (1978). Fatal ovine nephrosis caused by Anagallis arvensis. J. S.
Afr. Vet. Ass. 49: 321-324.
108. Schulz, R. A., Naude, T. W. and Pretorius, P. J. (1975). Cardiac glocosides
poisoning in animals. S. Afr. Med. J. 49: 285-286.
109. Seeling, H and W ust, S. (1969). A m i. Lab., 15:34. [cited in pamphlet of
biochemical kits].
n o . Shone, D. K. and Drummond, R. B. (1965). Poisonous plants o f Rhodesia.
Rhodesia Agric. J. 62, 7-64.
m . Smith, R. H. (1980). Kale poisoning. The Brassica anaemia factor. Vet. Rec. 107
12-15.
112. Summers, B.A., Cummings, J.F. and de Lahunta, A. (1995). Degenerative diseases
o f the central nervous system. In: veterinary neuropathology, degenerative diseases
o f the central nervous system. Pp 216, 264-265. Mosby-year, USA.
113. Steyn, D. G. (1949). Vergiftiging van die mens en dier. Pretona. Van Schai
114. Steyn, D. G. (1936). Recent investigations into the toxicity of known and unknown
poisons in the union o f S. Afnca. Onderstepoort J. Vet. Sci. and Anim. Industry. 7:
169-178.

- 77 -
-15. S tey n , D. G. (1932). Known poisonous plants in the union o f S. Africa. J. S. Afr.
V et. M ed. Ass. 3&4, 178-189.
116. S to laff, L. (1980). Aflatoxin M in perspective. J. Food Protection 43: 226-230.
-17. Terblanche, M., Adelaar, T. F. and Van Straten, A. M. S. (1966). Euphorbia
m auritanica L. as a poisonous plant in South Africa. J. S. Afr. Vet. Med. Ass. 37:
311-315.
118- Thaiyah, A. G. (1992). Toxicity studies o f Cassia didymobotrya Fres. and Solarium
incanum L. in rats (Rattus rattus). M.Sc Thesis, University o f Nairobi.
119. T oit, J. T., Provenza, F. D. and Nastis, A. (1992). Conditioned taste aversion: How
sick must ruminants get before it learns about toxicity in foods. Applied Animal
Behaviour Science 30: 35-46.
120. U niversity o f Pennsylvania (upenn) (2005). In: Poisonous plants of Pennsylvania..
www.cal.vet.upenn.edu/poison/agbook/robina.htm#Solanum.
121. V an derr Luht, J. J. and Van Heerdan, J. (1993). Experimental Vermeersiekte
(Geigeria ornvativa O. Hoffm.) poisoning in sheep II: Histological and
ultrastructural lesions. J. S. Afr. Vet. Ass. 64: 82-88.
122. Van Kampen, K. R. and James, L. F. (1969). Pathology o f locoweed poisoning in
sheep. Pathologica Veterinaria 6: 413-423.
123. Van Tonder, E. M., Basson, P. A. and Van Rensburg, I. B. J. (1972). “Geeldikkop”.
Experimental induction by feeding the plant Tribulis terrestris L. (Zygophyllaceae).
J. S. Afr. Vet. Med. Ass. 43: 363-376.
124. Verdcourt, B and Trump, E. C. (1969). Common poisonous plants o f East Africa.
London. Collins.

- 78 -
V erdes, J.M., Morana, A., Gutierrez, F., Battes, D., Fidalgo, L.E. and Guerrero, F.
(2006). Cerebellar degeneration in cattle grazing Solanum bonariense
(“Naranjillo”) in western Uruguay. J. Vet. Diagn. Invest. 18: 299-303.
126 . \e rh o e ff , J., Hajer, R. and Van den Ingh, T. (1985). Onion poisoning in young
cattle. Vet. Rec. 117: 497-498.
127 . W att, J. M. and Breyer-Brandwijk, M. G. (1962). The medicinal and poisonous
plants o f Southern and East Africa. 2nd Ed, E&S. Livingstone Ltd. Edinburgh and
London.
1 2 8 . Weichselbaum, T. E. (1946). Determination of plasma proteins - Biuret method.
Am. J. Clin. Path. 16: 40.
129 . W eil, C . S . (1952). T ables for c onvenient c alculation o f m edium e ffective d ose
(LD50 or ED50) and instructions on their use. Biometrics, 249-255.
130. Williams, M. C. (1990). The pathology of experimental Lasiospermum bipinnatum
(Thumb) Druce (Asteraceae) poisoning in sheep II. Pulmonary and miscellaneous
lesions. Onderstepoort J. Vet. Res. 57: 263-268.
131. Wilson, B. J., Garst, J. E., Linnabary, R. D. and Dorster, A. R. (1978). Pulmonary
toxicity of naturally occurring 3-substituted furans. In: Keeler, R. F., Van Kampen,
K. R. and James, L. F. (eds). Effects o f poisonous plants on livestock, pp. 311-323.
Academic Press, New York, San Francisco, London.
132. Yager, J. A. and Scott, D. W. (1985). The skin and appendages. In: Jubb, K. V. F.,
Kennedy, p. C. and Palmer, N. (eds). Pathology o f Domestic Animals. 3rd Ed. Vol.
I. Orlando, Florida, USA. Academic Press.

- 79 -
? 0 L IS T O F APPENDICES
A p p en d ix 1: Calculation o f LDsoin goats and sheep (Weil, 1952)
.V). C a lcu la tio n of LDsoin goats
T h e LD so is the median lethal dose that will kill 50% of the population and is calculated
b y th e m ethod o f Weil (1952) as follows:
T h e g en era l formula for this calculation is:
L o g M = Log Da + d. (f + 1 ) for K = 3 (for n=3, the number of animals dosed per level)
W here:
L D 50 = antilog M
L o g D a is the log of lowest dosage used. In this experiment the lowest dose used was
l .S g 'k g and therefore, Log 1.5 = 0.17609.
K. is a constant and for 3 dosage levels and above, K-3.
d is the log of the constant ratio between the dosages. In this experiment d—1.5 and log
1.5 =0.17609.
F value is obtained from the tables already calculated (appendix 2) and for mortalities in
the range 0,0,3,2 mortalities, the F value = 0.75.
Then:
Log M = 0.17609+ 0.17609(0.75 + 1)
= 0.17609 + 0.30815
= 0.4842
LD 50 = antilog 0.4842
= 3.049 ~ 3.0g/kgm
To calculate the 95% confidence limits for the LDsothe following formula is used:

- 8 0 -
3 5 % con fidence interval = log M ± 2 x o iog m = 2d x a f
where, CTlogm= d x o f
= 0 .3 7 5 0 0 (appendix 2)
2 d x o f = 2(0.17609) x 0.375
= 0.1321
T h e confidence interval for the LD50 = 0.4842 ±0.1321
= 0.6163 to 0.3521
T h e L D 50 for S. incanum L in goats is 3.0g/kg with a 95% confidence level of 2.25 to
4 .1 3 g/kg.
B ). C alculation of LD5o in sheep
T h e LD 50 for S. incanum L in sheep was similarly calculated using the same formulae
a n d procedure:
L o g M = Log Da + d. (f + 1) for K = 3 (for n=3, the number of animals dosed per level)
W here n = 3 (number of animals per dosage group).
K = constant for 3 dosage levels and above =3.
L og Da = log o f lowest dosage used. In this experiment Da = 3 .. Log 3 - 0.47712
4, the log of constant ratio between the dosages was 1.5 and log 1.5 - 0.17609.
The mortality figures obtained were 0,1,3,3 and the the f value - 0.16667 (appendix 2)
Log M = log Da + d • (f + 1),
Log M = 0.47712 + 0.17609(0.16667 + 1) = 0.68256
The LDso = antilog M = 4.815g/kg body weight
= 4.8g/kg
The 95% confidence interval was also calculated using the same formula, which is.

-81 -
,og M ± 2 x a iogm= 2d x a f
v h e re ,
2 d x a f = 2(0.17609) x 0.57735
= 0.20333
95°/o con fidence limit = 0.68255 ± 0.20333
=0.88589 to 0.47922.
T h e ca lcu la ted LD50 for S. incanum L in sheep is 4.8g/kg with a 95% confidence interval
o f 3 .0 — 7.7 g/kg.

-82-
A p p en d ix 2. Extract of table from biometrics: Tables for convenient calculation of medium e ffective d ose (LD5o o r E Dso) a nd i nstructions o n t heir u se. Biometrics, 249-255.
r-values F a f
0 ,0 , 2,3 0.83333 0.57735
0 ,0 ,3,3 0.50000 0.00000
0 , 1, 1,3 0.83333 0.81650
0 , 1, 2,3 0.50000 0.81650
0 , 1, 3,3 0.16667 0.57735
0 ,2 , 2,3 0.16667 0.81650
1,0 , 2,3 0.75000 0.51539
1,0 , 3,3 0.25000 0.37500
1, 1, 1,3 0.75000 0.71807
U , 2,3 0.25000 0.80039
2 ,0 ,2,3 0.50000 1.11803
0 ,0 ,3,2 0.75000 0.37500
0 , 1,2,2 0.75000 0.80039
0 , 1,3,2 0.25000 0.51539
0 ,2 ,2,2 0.25000 0.71807
0 , 1,3,1 0.5000 1.11803

- 83 -
A p p e n d ix 3 : M e a n w e ig h t (k g ) o v e r t im e (w e e k s) in g o a ts a n d s h e e p
Goats groups Sheep groups
Time
(weeks)
1 2 3 4 1 2 3 4
1 19.0 16.3 17.0 16.2 19.6 18.3 15.6 17.5
2 19.8 15.3 16.0 16.1 18.8 15.7 13.0 17.4
3 19.7 15.8 17.2 15.4 19.3 14.8 “ 17.9
4 19.2 17.4 17.0 15.3 19.1 15.1 - 18.1
5 19.9 16.9 17.2 15.0 20.5 14.8 19.5
6 19.9 17.8 17.8 15.9 19.7 14.8 “ 18.4
7 20.1 18.7 18.3 15.7 18.2 “ “ 18.1
8 20.4 18.7 18.5 16.4 18.3 - “ 18.2
9 20.7 19.0 19.0 16.1 17.4 “ “ 16.3
10 21.1 19.2 18.8 16.3 18.2 " 17.8

A p p e n d ix 4 : M e a n w h i t e b lo o d ce lls ( /p i) a g a in s t tim e ( w e e k s ) in g o a ts a n d sh e e p
Goat groups Sheep groups
Time (weeks) 1 2 3 4 1 2 3 4
1 10,240 13,500 11,400 12,875 10,875 9,500 10,575 8,500
2 10,975 10,675 13,850 12,825 9,200 10,450 12,475 8,433
3 9,133 9,050 20,950 11,775 12,100 13,700 - 9,700
8,825 9,875 9,000 9,525 10,050 9,750 “ 9,567
5 8,125 6,767 6,100 9,475 8,900 9,600 - 11,067
6 8,825 8,033 12,000 7,975 8,800 10,150 8,733
7 8,950 8,167 8,800 12,525 - -
8 10,500 11,533 8,600 11,500 - “ - -
'9 10,000 13,800 10,000 10,600 - “ - “

Appendix 5: Mean packed cell volume (%) against time (weeks) in goats and sheep
Goat groups Sheep groups
Time (weeks) 1 2 3 4 1 2 3 4
1 33.2 35.8 37.3 31.3 30.5 32.5 35.0 37.7
2 36.3 36.3 32.5 29.8 36.0 33.3 30.0 30.3
3 32.3 32.5 33.5 27.3 35.0 37.5 “ 32.3
4 27.3 29.5 30.0 26.0 30.8 28.5 - 29.3
5 24.5 31.3 29.0 27.8 30.3 33.0 “ 31.7
27.5 26.3 27.0 21.5 26.7 37.0 “ 31.7
7 27.8 26.7 28.0 24.8 - - “ “
8 28.3 27.3 29.0 23.0 - - • •
9 27.3 28.7 29.0 25.3 • “

- 86 -
Appendix 6: Mean total protein (mg/dl) against time (weeks) in goats and sheep
Goat groups Sheep groups
Time (weeks) 1 2 3 4 1 2 3 4
1 7.6 6.8 5.9 7.3 7.1 6.6 7.2 6.7
2 6.7 6.5 5.9 5.1 5.9 6.0 7.6 5.9
3 7.2 6.3 2.7 6.6 6.9 5.5 7.3
*4 6.6 6.0 2.7 6.6 6.3 7.0 “ 6.6
5 7.6 5.6 3.8 7.5 6.1 6.0 • 6.7
6 8.1 5.5 3.7 7.5 7.1 6.1 “ 7.1
7 6.7 4.7 3.0 7.0 “ - “ “
8 7.1 5.1 3.0 7.4 - - "
9 7.4 5.4 2.9 7.7 - •

- 87 -
A p p e n d i x 7 : M e a n a lk a l in e p h o s p h a ta s e (u/1) a g a in s t t im e (w e e k s ) in g o a ts a n d
s h e e p
Goat groups Sheep groups
Time (weeks) 1 2 3 4 1 2 3 4
1 95.3 71.0 76.5 65.5 37.3 64.3 37.8 75.3
2 97.8 63.5 56.0 78.0 52.5 66.7 34.8 77.7
3 96.8 73.3 57.0 73.0 53.8 80.5 “ 86.0
hr- 110.0 65.5 58.0 56.3 59.5 95.0 - 87.3
5 71.0 38.7 28.0 35.5 48.3 76.5 112.0
6 71.8 51.3 30.0 42.3 68.7 109 " 132.7
7 67.5 44.3 36.0 42.5 - - “ “
8 75.8 47.0 33.0 66.5 - “ “
S r^ 7 %S V