experimental investigation of corrosion of coated …
TRANSCRIPT

Southern Illinois University Carbondale Southern Illinois University Carbondale
OpenSIUC OpenSIUC
Theses Theses and Dissertations
5-1-2020
EXPERIMENTAL INVESTIGATION OF CORROSION OF COATED EXPERIMENTAL INVESTIGATION OF CORROSION OF COATED
CAST IRON ROTORS IN THE AUTOMOTIVE INDUSTRY CAST IRON ROTORS IN THE AUTOMOTIVE INDUSTRY
Prabin Parajuli Southern Illinois University Carbondale, [email protected]
Follow this and additional works at: https://opensiuc.lib.siu.edu/theses
Recommended Citation Recommended Citation Parajuli, Prabin, "EXPERIMENTAL INVESTIGATION OF CORROSION OF COATED CAST IRON ROTORS IN THE AUTOMOTIVE INDUSTRY" (2020). Theses. 2711. https://opensiuc.lib.siu.edu/theses/2711
This Open Access Thesis is brought to you for free and open access by the Theses and Dissertations at OpenSIUC. It has been accepted for inclusion in Theses by an authorized administrator of OpenSIUC. For more information, please contact [email protected].
EXPERIMENTAL INVESTIGATION OF CORROSION OF COATED CAST IRON ROTORS
IN THE AUTOMOTIVE INDUSTRY
by
Prabin Parajuli
B.E., Kathmandu University, 2015
A Thesis
Submitted in Partial Fulfillment of the Requirements for the
Master of Science Degree
Department of Mechanical Engineering and Energy Processes
in the Graduate School
Southern Illinois University Carbondale
May 2020

THESIS APPROVAL
EXPERIMENTAL INVESTIGATION OF CORROSION OF COATED CAST IRON ROTORS
IN THE AUTOMOTIVE INDUSTRY
by
Prabin Parajuli
A Thesis Submitted in Partial
Fulfillment of the Requirements
for the Degree of
Master of Science
in the field of Mechanical Engineering
Approved by:
Dr. Ian Ivar Suni, Chair
Dr. Peter Filip
Dr. Sabrina Nilufar
Graduate School
Southern Illinois University Carbondale
March 25, 2020
i
AN ABSTRACT OF THE THESIS OF
PRABIN PARAJULI, for the Master of Science degree in MECHANICAL ENGINEERING,
Presented on March 25, 2020, at Southern Illinois University Carbondale.
TITLE: EXPERIMENTAL INVESTIGATION OF CORROSION OF COATED CAST IRON
ROTORS IN AUTOMOTIVE INDUSTRY.
MAJOR PROFESSOR: Dr. Ian Ivar Suni
Electric and hybrid vehicles uses regenerative braking, where application of the brake
triggers the electric motor to work as a generator to produce electricity, which in turn charges the
battery. This results in much less use of the friction brake, changing the corrosion and wear
behavior of the rotor surface. There is a need for research on this topic, since fully electric or
hybrid vehicles are replacing combustion engines due to concerns about global warming and
climate change. Here the corrosion behavior of coated cast iron vehicle rotors in 3.5wt% NaCl is
studied. The corrosion study has been performed using electrochemical methods such as cyclic
voltammetry (CV) and electrochemical impedance spectroscopy (EIS). All the coated samples
were provided by Pure Forge Rotors. Based on the results from SEM and EDX, the coating is
atomic forge proprietary coating, and the base material is gray cast iron. Our primary objective is
to study the corrosion behavior of coated, non-coated and friction-tested samples. CV
experiments indicate a shift in the corrosion potential and corrosion current density due to
changes in the nature of the exposed surface. Cross-sectional SEM showed the thickness of the
coating to be 16-23 µm. After friction testing, the friction layer created by rubbing the brake pad
over the rotor plays a role in corrosion resistance, but this depends on the type of brake pad
material (i.e. semi-metallic, non-asbestos organic and low metallic). Results showed that friction
film that forms after testing against non-asbestos organic pads provides the highest corrosion
resistance amongst the three brake pad materials.

ii
Keywords: regenerative braking, friction tested rotors, coating, scanning electron microscopy,
energy dispersive x-ray analysis.

iii
ACKNOWLEDGEMENTS
I am immensely indebted to my academic advisor Dr. Ian Ivar Suni, for his constant support
and guidance throughout the project. I would also like to thank Dr. Peter Filip for providing helpful
materials and guiding me during my research.
I would like to thank my committee member, Dr. Sabrina Nilufar for her support and
guidance. I would also like to thank my lab mates Hannah Giang and Omair Adil for sharing their
knowledge with me. Special thanks to my family and friends for their love and encouragement.

iv
TABLE OF CONTENTS
CHAPTER PAGE
ABSTRACT ..................................................................................................................................... i
ACKNOWLEDGEMENTS ........................................................................................................... iii
LIST OF FIGURES ........................................................................................................................ v
LIST OF TABLES ........................................................................................................................ vii
CHAPTERS
CHAPTER 1 - INTRODUCTION ...................................................................................... 1
CHAPTER 2 - LITERATURE REVIEW ........................................................................... 3
CHAPTER 3 - STATEMENT OF OBJECTIVES.............................................................. 5
CHAPTER 4 - THEORETICAL BACKGROUND ........................................................... 6
CHAPTER 5 - EXPERIMENTAL ................................................................................... 13
CHAPTER 6 - RESULTS AND DISCUSSION .............................................................. 20
CHAPTER 7 - CONCLUSION ........................................................................................ 32
REFERENCES ............................................................................................................................. 33
VITA ............................................................................................................................................. 35

v
LIST OF FIGURES
FIGURE PAGE
Figure 1: Schematic picture of a typical Disc Brake [1] ................................................................. 2
Figure 2: Corrosion process shown by cyclic voltammetry [21] .................................................... 7
Figure 3: Analysis of CV plot. Scan rate: 10mV/s ......................................................................... 8
Figure 4: Picture of full scale automotive brake dynamometer (source: asimcoglobal.com) ...... 11
Figure 5: Picture of universal mechanical tester (UMT), Dr. Filip’s lab ...................................... 12
Figure 6: Test sample lot-1. Coated-non-friction tested samples. ................................................ 14
Figure 7: Picture of coated-friction tested rotors. (a) Rotor exposed to brake pad material ......... 15
Figure 8: (a) Sample preparation for electrochemistry experiments (b) Teflon sleeve and
sample prepared for experiment. ............................................................................. 16
Figure 9: Test sample after mechanical polishing ........................................................................ 17
Figure 10: Sample for cross-sectional SEM ................................................................................. 18
Figure 11: CV plot of coated non-friction tested and non-coated non-friction tested
(polished) samples. Scan rate: 10mV/s. The two curves in solid/dashed line
represents two successive experiments on same sample. Potential is swept across
the range -700mV to 100mV. .................................................................................... 21
Figure 12: CV plot of coated non-friction tested and coated-friction tested samples .................. 23
Figure 13: Nyquist plots of coated-friction tested samples, friction testing materials Type A, ... 24
Figure 14: Surface morphology of the coating, Left: scale 50 µm, Right: scale 10 µm ............... 25
Figure 15: EDX analysis of coated non-friction tested sample [22] ............................................. 26
Figure 16: Surface morphology of the non-coated non-friction tested sample.
Left: scale 50 µm, Right: scale 10 µm ....................................................................... 27

vi
Figure 17: EDX of non-coated non-friction tested sample ........................................................... 28
Figure 18: Cross sectional SEM of the coating. Left: scale 50 µm, Right: scale 20 µm .............. 29
Figure 19: Cross sectional SEM of the coating describing thickness of the coating.
Left: scale 20 µm, Right: scale 20 µm ....................................................................... 30
Figure 20: Elemental analysis of coating using EDX ................................................................... 31

vii
LIST OF TABLES
TABLE PAGE
Table 1: Corrosion current and corrosion potential of coated-non-friction tested and
non-coated non-friction tested (polished) sample 1. ....................................................... 20
Table 2: Electrochemical measurements of friction tested samples from sample lot 2. ............... 22

1
CHAPTER 1
INTRODUCTION
In a traditional braking system the brake pads rub against the rotors, producing friction
which slows or stops the vehicle. The forward motion of the vehicle (kinetic energy) is
transformed into heat energy via friction, so energy is lost. In order to save this energy and
convert it into electricity to recharge the vehicle battery, regenerative braking can be used. This
kind of braking system is available in fully electric cars such as the Tesla Roadster or in hybrid
vehicles such as the Toyota Prius. Regenerative braking occurs after pressing the brake pedal in
an electric-hybrid vehicle, causing the electric motor to work in reverse, acting as an electric
generator that produces electricity and charges the battery. As is well known, when an electric
motor turns in one direction it converts electrical energy into mechanical energy, but when it
turns in the opposite direction it converts mechanical energy into electrical energy. This
electrical energy can be used to charge electric vehicle batteries. However, electric and hybrid
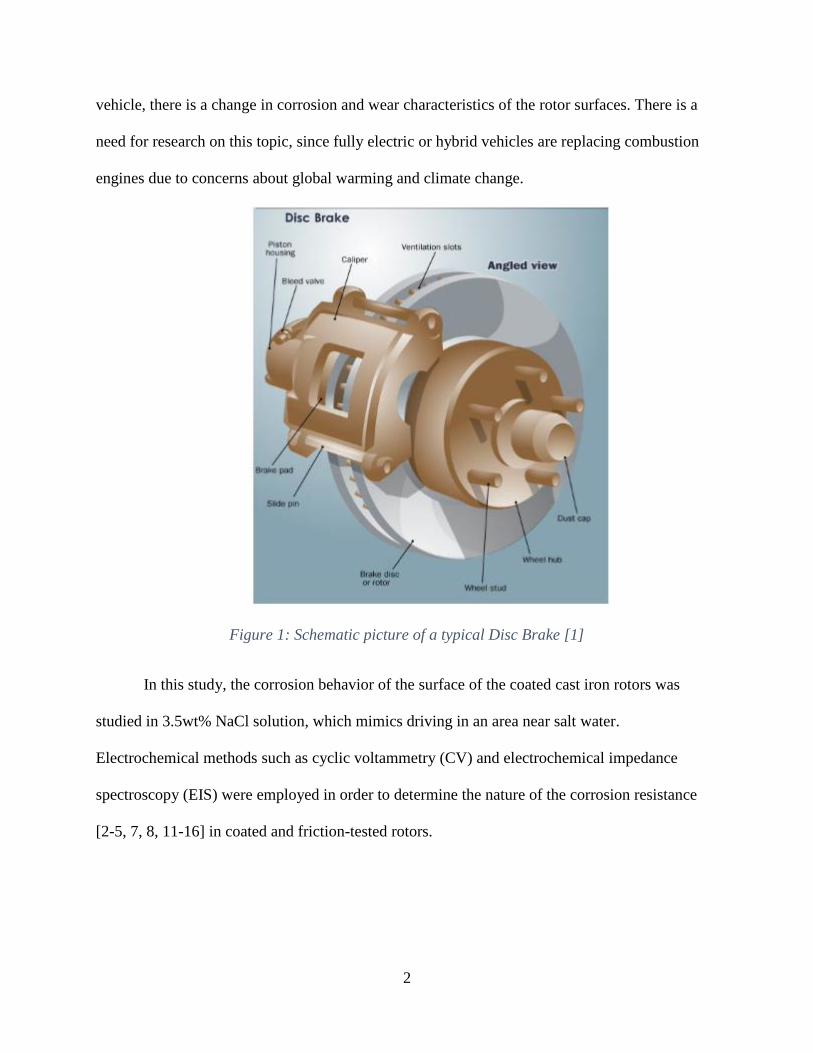
vehicles still contain friction brakes (shown in figure 1) as a backup when regenerative braking
isn’t adequate.
Vehicles with combustion engines utilize friction brakes only. Conversion of kinetic
energy into heat energy via friction leads to loss of both pad and rotor materials due to brake
engagement and disengagement. In addition, the surface of the rotor, which is generally made
from cast iron, corrodes in the environment due to humidity and high temperature, and friction
removes this corrosion layer during braking. The particles present in the corrosion layer are
harmful for the environment. However, since regenerative braking involves reduced usage of
friction brakes, so fewer particles are released into the environment.
Due to reduced use of friction braking relative to regenerative braking in electric-hybrid
2
vehicle, there is a change in corrosion and wear characteristics of the rotor surfaces. There is a
need for research on this topic, since fully electric or hybrid vehicles are replacing combustion
engines due to concerns about global warming and climate change.
Figure 1: Schematic picture of a typical Disc Brake [1]
In this study, the corrosion behavior of the surface of the coated cast iron rotors was
studied in 3.5wt% NaCl solution, which mimics driving in an area near salt water.
Electrochemical methods such as cyclic voltammetry (CV) and electrochemical impedance
spectroscopy (EIS) were employed in order to determine the nature of the corrosion resistance
[2-5, 7, 8, 11-16] in coated and friction-tested rotors.

3
CHAPTER 2
LITERATURE REVIEW
Corrosion is a natural process whereby a metal is converted by environmental reactions
to a more chemically oxide, hydroxide or sulfide. This involves gradual metal destruction by
chemical or electrochemical reaction with the environment, such as the corrosion of mild steel in
salt water (i.e. aqueous NaCl). Cast iron has been widely used in the automotive and other
industries and is exposed to harsh environments, so corrosion protection of cast iron is an
important issue [2]. Kosugi et al. studied the effect of adding molybdenum (Mo) on the corrosion
resistance of zinc iron plating. By comparison, zinc nickel plating is much more corrosion
resistant, however nickel may cause allergies. Therefore, zinc iron plating is preferred, but its
corrosion resistance needs to be improved by adding Mo into the zinc iron plating [2]. Mohebbi
et al. studied the long-term corrosion behavior of three ex-service cast iron pipes in order to
develop models for corrosion-induced deterioration of the pipes to predict their remaining
service life. They found that the microstructure of cast iron is a key factor that affects the
corrosion behavior of these pipes, and that localized corrosion is the primary form of corrosion
[3]. Another study compared cast iron with two different coatings, SAN/PANI/FLG (polymeric
based) and ZnO/GO (ceramic based), exposed to corrosive environments. From this study, they
found that corrosion protection was higher for polymer-based coatings relative to ceramic-based
coatings using DC polarization and electrochemical impedance spectroscopy methods [4]. The
corrosion behavior of cast iron has been widely studied, but to the best of our knowledge, little
research has been reported on the corrosion behavior of cast iron rotors, both coated and
uncoated.
In this study, 3.5wt% NaCl is chosen as the test medium to mimic the moist and/or salty

4
environment the brake rotors are exposed to [5-10]. Mousa May studied corrosion of mild steel
in NaCl, and found that as the NaCl concentration increase from 5-10%, the corrosion rate
decreases due to an increase in the solution viscosity, which reduces the ion mobility [9].
Alhazaa et al studied galvanic corrosion of magnesium alloy AZ31 coupled with Ni in 3.5wt%
NaCl solutions after different bonding times. This paper studies the corrosion behavior of Mg
alloy AZ31 (composition: 96% Mg, 3 % Al and 1% Zn) with and without Ni in 3.5wt% NaCl
solution. They use electrochemical techniques including cyclic potentiodynamic polarization
(CPP) and electrochemical impedance spectroscopy (EIS) [10].
Song et al. studied the influence of graphene oxide content on the Zn-Gr composite layer
prepared by pulse reverse electroplating where they demonstrated that adding 0.5 g/L graphene
oxide (GO) in the electrolyte increases the corrosion resistance (lowest current density) in
comparison to other graphene oxide (GO) concentrations [17].

5
CHAPTER 3
STATEMENT OF OBJECTIVES
The objective of this research is to study the corrosion of cast iron rotor surface, both coated
and non-coated. Similar approach is applied to study rotors after simulated friction tests. The
primary objectives of this research are:
1. To study surface corrosion of coated cast iron rotors
2. To compare coated, non-coated and friction-tested cast iron rotors

6
CHAPTER 4
THEORETICAL BACKGROUND
Corrosion involves two simultaneous electrochemical processes, oxidation at anodic sites
and reduction at cathodic sites, and can be studied by many different methods.
4.1 Weight loss methods
In this method, the mass of the test coupon (metal), before and after immersion into
corrosive media, is measured to determine the corrosion rate. Weight loss can be converted to
average corrosion rate (r) by using equation 1 below [18],
𝑟 = 0.129𝑖∗𝑎
𝑛∗𝐷 (𝑖𝑛 𝑚𝑝𝑦) (1)
where, a= atomic weight (g)
i=current density (µA/cm2)
n= the number of equivalents exchanged
D=density (g/cm3)
This is the best method to measure corrosion rates, since the process of interest is measured
directly. However, this method requires thin coupon samples, whereas rotor samples are bulky.
Therefore, electrochemical methods were selected over weight loss method.
4.2 Electrochemical methods
Electrochemistry is a powerful tool to investigate electron transfer reactions [19]. All
experiments are performed using a GAMRY instruments Reference 600
potentiostat/Galvanostat/ZRA, which is a three-electrode potentiostat. These potentiostat
measures and controls the potential difference between the non-current carrying reference
electrode and the working electrode, and measures and controls the current flow between the
working and counter electrodes. The response current is used to develop a model of the samples’

7
corrosion behavior.
4.2.1 Cyclic Voltammetry (CV)
This is an electrochemical technique which investigates the oxidation and reduction of
molecular species [19]. In a CV scan, the potential is repeatedly swept back and forth across a
potential range, and the current is measured. From this plot we are able to determine the
corrosion potential (Ecorr) and corrosion current density (icorr), as shown in figure 2. The potential
where the total anodic current equals the total cathodic current is the corrosion potential. The
corrosion current is the intersection between the extrapolated cathodic current and extrapolated
anodic current, according to the Tafel equation.
Figure 2: Corrosion process shown by cyclic voltammetry [21]
Figure 3 shows the analysis of a CV plot where we can see the cathodic domain, anodic
domain, Ecorr and icorr. The metal or the test sample is oxidized in the anodic domain. Here, icorr
and Ecorr refers to corrosion current and corrosion potential respectively. The X-axis represents

8
the potential applied, and the Y-axis is the measured current density at that potential. In this plot
we look for shift in the corrosion potential (Ecorr) and/or the corrosion current density (icorr)
between different samples, and under different conditions. During the CV scan, the scan rate
used is 10 mV/s [19].
Figure 3: Analysis of CV plot. Scan rate: 10mV/s
4.2.2 Electrochemical Impedance Spectroscopy (EIS)
Impedance is a measure of the ability of a circuit to resist the flow of electrical current,
and is quantified by applying an AC potential to an electrochemical cell and measuring the
current through the cell. EIS studies the system response over a range of frequencies, and is a
powerful technique to study corrosion, and the effect of coatings. During EIS, the higher the
impedance, the lower the corrosion rate [13]. EIS results are usually presented as a Nyquist plot,

9
where the real component of the impedance is plotted on the x-axis and the imaginary
component on the y-axis, and the frequency is distributed along the curve. Nyquist plots often
exhibit a semicircular shape [20], where the diameter corresponds to the polarization resistance.
The larger the diameter, the larger the polarization resistance, and likewise the corrosion
resistance.
4.3 Sample characterization methods
To study the morphology of the coated and non-coated samples we use scanning electron
microscopy (SEM) to examine the sample microstructure [3]. SEM produces sample images by
scanning the surface with focused electron beam, which interacts with atoms in the sample,
producing signals that contain information about the surface topography and composition of the
sample. Energy Dispersive X-ray (EDX) analysis is used for the chemical characterization of the
sample. Energy dispersive x-ray spectroscopy (EDX) probes the surface composition (top 5 μm).
4.4 Friction brake
A friction brake is a mechanical device that reduces the vehicle velocity by converting
the kinetic energy into heat energy, which is lost into the environment. The two main brake types
used in passenger vehicles are, drum brakes and disc brakes. In disc brakes, braking occurs by
pressing together two friction pads on the sides of the vehicle rotor. Similarly, drum brakes work
by pressing the brake shoes against the inside surface of the drum assembled with the wheel hub.
This research focuses on disc brake (as shown in figure 1), since they are the most common
brakes in present automotive vehicles, since they dissipate heat more efficiently in comparison to
drum brakes [1].
The effectiveness of braking is highly dependent on the material composition of brake
pads. Brake pads can be classified into three types: are low-metallic (LM), semi-metallic (SM)

10
and non-asbestos organic (NAO). In general, non-asbestos brake pads (i.e. TRIBCO) are made
up of organic materials such as glass, rubber and Kevlar; semi-metallic pads (i.e. Type A)
contain 30-65% of metals and rest organic materials; and low-metallic brake pads (i.e. Type B)
contains less than 30% steel [1].
4.5 Friction testing methodology
Once the brake pads are manufactured, they must be tested to evaluate their friction
properties. Initially, the tests are performed in the laboratory, but the final tests are performed on
the full-size vehicle. These friction and wear testing procedures apply an empirical approach to
testing. For example, SAE J2522 and FMVSS 135 all provide conditions for assessment of
brake performance in passenger cars using automotive brake dynamometers, as shown in figure
4.

11
Figure 4: Picture of full scale automotive brake dynamometer (source: asimcoglobal.com)
These procedures for laboratory tests are followed to have a testing scenario as close as
possible to on-field tests. However, friction tests on dynamometer are expensive relative to a
bench-top system. Bench-top testing applies a “proper scaling-down philosophy” where the
brake size is reduced to fit the system. The results from bench-top testing correlate well with the
tests performed on Dynamometer, which is a full scale laboratory test [1]. An example of bench-
top testing is a universal mechanical tester (UMT), as shown in figure 5. All samples were

12
friction-tested on the UMT using a FMVSS 135 friction-testing methodology.
Figure 5: Picture of universal mechanical tester (UMT), Dr. Filip’s lab

13
CHAPTER 5
EXPERIMENTAL
5.1 Test Sample
The following samples will be studied in this research.
Coated, non-friction tested sample
Non-coated, non-friction tested (polished) sample
Coated, friction-tested sample
Coated and friction tested, exposed to low metallic brake pad material such as
Type B
Coated and friction tested, exposed to semi-metallic pad such as Type A
Coated and friction tested, exposed to non-asbestos organic pad such as TRIBCO
Friction tests are performed in a bench-top universal mechanical tester (UMT), using
FMVSS 135 testing methodology.
5.1.1 Sample lot-1
I received six test samples from Pure Forge, as shown in figure 6, in the form of a
cylinder with 18 mm height and 12 mm diameter. The test samples are expected to be gray cast
iron, with the ends coated.

14
Figure 6: Test sample lot-1. Coated-non-friction tested samples.
5.1.2 Sample lot-2
I received three coated and friction-tested rotors, reduced in size for testing in the UMT.
During friction testing, these coated rotors were exposed to three different brake pad materials:
Type A, Type B and TRIBCO. The coated, friction-tested rotor is circular in shape with 97 mm
diameter and 12 mm thickness, as shown in figure 7. This rotor was cut to numerous small
cylinders of 13 mm diameter and 9 mm height for electrochemistry experiments, as shown in
figure 8 (b). Before us, samples are cleaned ultrasonically with ethyl alcohol for 5 min to remove
any unwanted grease, metal dust, etc.

15
Figure 7: Picture of coated-friction tested rotors. (a) Rotor exposed to brake pad material
Type A (b) Rotor exposed to brake pad material TRIBCO (c) Rotor exposed to brake pad
material Type B.
(a) (b)
(c)
Coated surface
Friction tested
ring

16
Figure 8: (a) Sample preparation for electrochemistry experiments (b) Teflon sleeve and sample
prepared for experiment.
5.2 Test Sample preparation
Coated cast iron samples can be analyzed as-received or after mechanical polishing.
Mechanical polishing is done for some samples to remove the coating, which allows comparison
of the corrosion behavior of the coating and underlying substrate. The surface roughness is a
complication, since the real surface area may be much higher than the geometric surface area.
Polishing the sample helps reduce this ambiguity. Samples are polished in an ECOMET 5 (two
speed grinder and polisher) under 8 lbs. of polishing force was applied. The complete polishing
procedure is:
1. Polish with #180 grit size SiC papers for 2 minute. Examine the surface visually, it
should look clean and reflective. If not, then repeat procedure.
2. Before changing to next grit size, rinse the sample with water and ethanol then dry
with hot air blower.
3. Use grit sizes #240, #320, #600, and #1200 for 1 min, rinsing and drying before
(a)
(b)
Teflon sleeve
Test Sample

17
changing to the next grit size.
4. The metal sample is polished with 0.05 microns aluminum oxide powder for 1 min,
with a typical result shown in the figure 9.
5. The final step is to sonicate in ethyl alcohol for 5 min to remove traces of aluminum
oxide in the sample.
Figure 9: Test sample after mechanical polishing

18
A similar process is followed to prepare sample for cross-sectional SEM. Samples for
cross-sectional SEM are sealed with epoxy resin to hold the sample during mechanical polishing,
as shown in figure 10. The sample is stored in a desiccator to prevent contact with moisture.
Cross-sectional SEM allows thickness measurement of the coating, and point-by-point
compositional analysis with EDX.
Figure 10: Sample for cross-sectional SEM
5.3 Electrochemical Measurements
Before the electrochemical analysis, the coated, uncoated and friction-tested cast iron
samples were rinsed with deionized water. These samples were embedded into a Teflon sleeve as
shown in figure 9, and copper tape is used to make electrical connection. The test medium in this
experiment is 3.5wt% NaCl. The electrochemical measurements were performed in a standard
three-electrode cell, with an Ag/AgCl reference electrode, Pt counter electrode, and test sample
Epoxy
Cross-sectional
SEM performed
on this part
19
as the working electrode. Initially, CV is performed on all samples over the potential range of -
700 mV to 100 mV at the scan rate of 10 mV/s to study their corrosion behavior. EIS was
performed over the frequency range of 10 mHz- 1 kHz with an AC probe amplitude of 10 mV to
gain further insight into corrosion. All experiments were performed at room temperature (25ºC ±
0.5ºC).

20
CHAPTER 6
RESULTS AND DISCUSSION
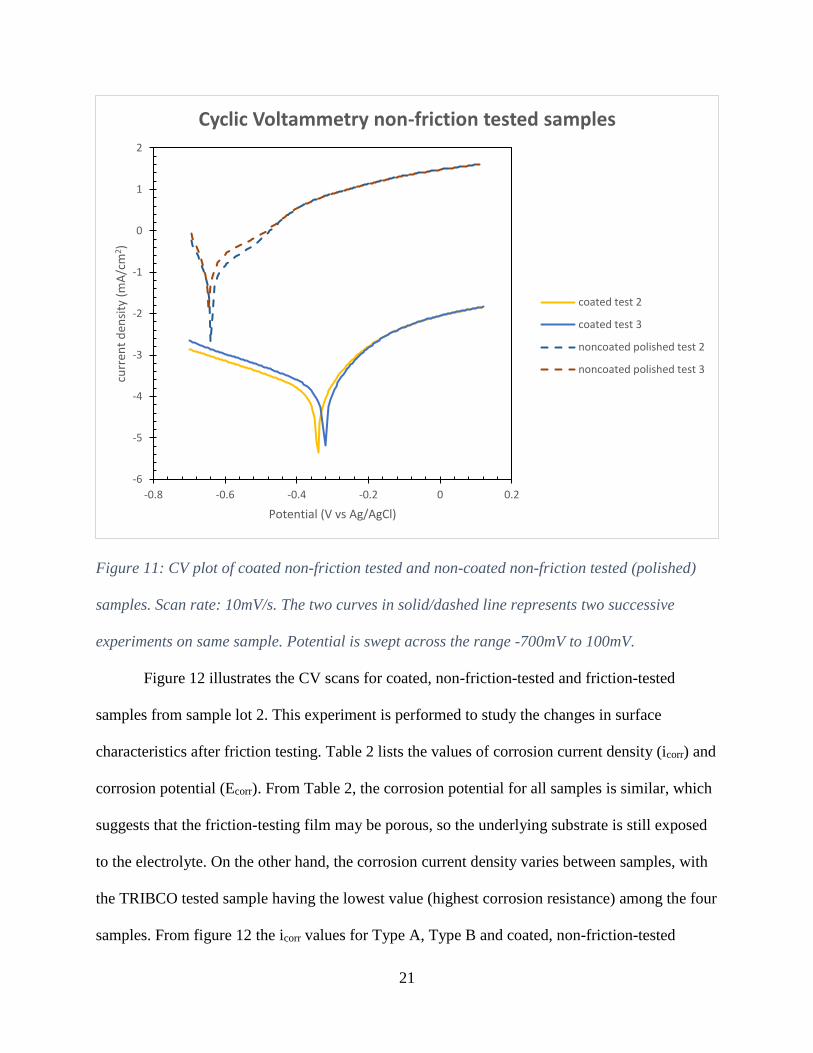
Figure 11 illustrates the CV of coated, non-friction-tested and uncoated, non-friction
tested (polished) samples from sample lot-1 in 3.5wt% NaCl solution. Table 1 lists the values of
the corrosion current density (icorr) and corrosion potential (Ecorr). After polishing the sample, the
corrosion potential shifted in cathodic direction as shown in figure 11. In addition, the corrosion
current density of the coated sample is almost three orders of magnitude lower than the uncoated
sample. Of course, that lower the current density, higher the corrosion resistance. Three
successive experiments were performed on the same sample, but figure 11 only shows the results
for two experiments.
Table 1: Corrosion current and corrosion potential of coated-non-friction tested and non-coated
non-friction tested (polished) sample 1.
S.N. Description
Diameter
(cm)
Surface area
(cm2)
icorr
(mA/cm2)
Ecorr (mV)
1
Coated non-friction tested
sample 1
1 0.7854 5.525E-6 -330.00
2
Non-coated non-friction
tested sample 1
1 0.7854 7.085E-3 -643.00
21
Figure 11: CV plot of coated non-friction tested and non-coated non-friction tested (polished)
samples. Scan rate: 10mV/s. The two curves in solid/dashed line represents two successive
experiments on same sample. Potential is swept across the range -700mV to 100mV.
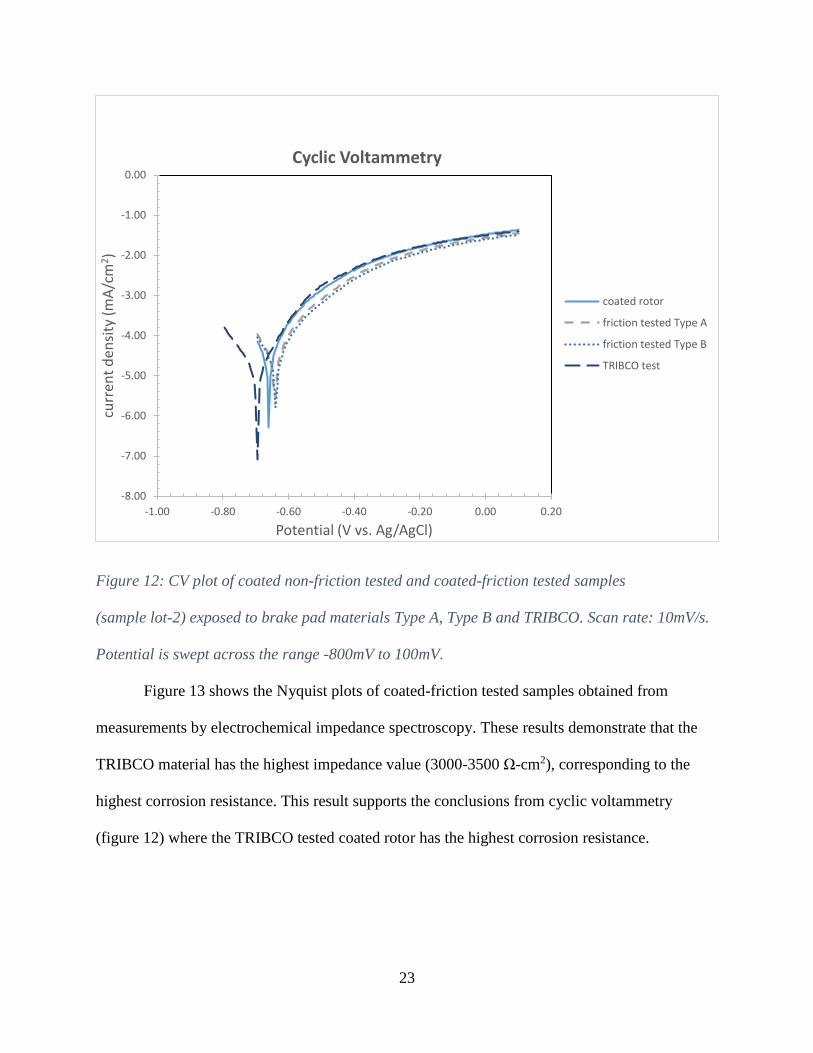
Figure 12 illustrates the CV scans for coated, non-friction-tested and friction-tested
samples from sample lot 2. This experiment is performed to study the changes in surface
characteristics after friction testing. Table 2 lists the values of corrosion current density (icorr) and
corrosion potential (Ecorr). From Table 2, the corrosion potential for all samples is similar, which
suggests that the friction-testing film may be porous, so the underlying substrate is still exposed
to the electrolyte. On the other hand, the corrosion current density varies between samples, with
the TRIBCO tested sample having the lowest value (highest corrosion resistance) among the four
samples. From figure 12 the icorr values for Type A, Type B and coated, non-friction-tested
-6
-5
-4
-3
-2
-1
0
1
2
-0.8 -0.6 -0.4 -0.2 0 0.2
curr
ent
den
sity
(m
A/c
m2)
Potential (V vs Ag/AgCl)
Cyclic Voltammetry non-friction tested samples
coated test 2
coated test 3
noncoated polished test 2
noncoated polished test 3

22
samples are similar, with similar corrosion behavior.
Table 2: Electrochemical measurements of friction tested samples from sample lot 2.
S.N. Description
Diameter
(cm)
Surface area
(cm2)
icorr
(mA/cm2)
Ecorr (mV)
1
Coated, non-friction-
tested sample 2
1 0.7854 5.11E-07 -660.00
2
Coated, friction-tested,
Type A sample 2
1.1 0.95 3E-06 -640.00
3
Coated, friction-tested,
Type B sample 2
1.117 0.98 1.63E-06 -640.00
4
Coated, friction-tested,
TRIBCO sample 2
1.075 0.91 8.24E-08 -695.00
23
Figure 12: CV plot of coated non-friction tested and coated-friction tested samples
(sample lot-2) exposed to brake pad materials Type A, Type B and TRIBCO. Scan rate: 10mV/s.
Potential is swept across the range -800mV to 100mV.
Figure 13 shows the Nyquist plots of coated-friction tested samples obtained from
measurements by electrochemical impedance spectroscopy. These results demonstrate that the
TRIBCO material has the highest impedance value (3000-3500 Ω-cm2), corresponding to the
highest corrosion resistance. This result supports the conclusions from cyclic voltammetry
(figure 12) where the TRIBCO tested coated rotor has the highest corrosion resistance.
-8.00
-7.00
-6.00
-5.00
-4.00
-3.00
-2.00
-1.00
0.00
-1.00 -0.80 -0.60 -0.40 -0.20 0.00 0.20
curr
ent
den
sity
(m
A/c
m2)
Potential (V vs. Ag/AgCl)
Cyclic Voltammetry
coated rotor
friction tested Type A
friction tested Type B
TRIBCO test

24
Figure 13: Nyquist plots of coated-friction tested samples, friction testing materials Type A,
Type B and TRIBCO in 3.5wt% NaCl. EIS measurements were performed over the frequency
range of 10 mHz- 1 kHz with an AC probe amplitude of 10 mV.
0
500
1000
1500
2000
2500
3000
3500
4000
4500
0 500 1000 1500 2000 2500 3000 3500 4000 4500
-Z"
(Ω-c
m2 )
Z" (Ω-cm2)
EIS friction tested sample
Type A expt 1
Type A expt 2
TRIBCO expt 1
TRIBCO expt 2
Type B expt 1
Type B expt 2

25
Figures 14 and 15 illustrate the surface morphology and chemical composition of a coated, non-friction-tested sample using
SEM and EDX. From the EDX analysis, we found that the coating is atomic forge proprietary coating [22].
Figure 14: Surface morphology of the coating, Left: scale 50 µm, Right: scale 10 µm

26
Figure 15: EDX analysis of coated non-friction tested sample [22]

27
Figure 16 and 17 illustrates the surface morphologies and chemical composition of non-coated, non-friction-tested samples
using SEM and EDX. Figure 16 shows the SEM image of the sample which is a microstructure of gray cast iron with evidence of long
graphite flakes (black lines in figure 16). The EDX analysis indicates that the surface contains iron, carbon, nitrogen, oxygen, silicon,
sulphur, chromium and manganese. The percent of the detected iron on the surface is 66 wt% and for carbon it recorded 29 wt%.
Figure 16: Surface morphology of the non-coated non-friction tested sample. Left: scale 50 µm, Right: scale 10 µm

28
Figure 17: EDX of non-coated non-friction tested sample

29
Figure 18 shows the cross-sectional SEM of the coating. The thickness of the coating is in the range of 16-23 µm, as shown in
figure 19. Elemental analysis using EDX (figure 20) confirms the coating to be atomic forge proprietary coating [22]. However, traces
of alumina were observed which was due to the usage of alumina powder while polishing the sample.
Figure 18: Cross sectional SEM of the coating. Left: scale 50 µm, Right: scale 20 µm
Epoxy
Cast iron
Coating

30
Figure 19: Cross sectional SEM of the coating describing thickness of the coating. Left: scale 20 µm, Right: scale 20 µm

31
Figure 20: Elemental analysis of coating using EDX

32
CHAPTER 7
CONCLUSION
1. The coating is atomic forge proprietary coating [22].
2. The base material is gray cast iron.
3. The friction tested layer is porous.
4. Friction tested samples have similar or better corrosion resistance in comparison to coated,
non-friction-tested samples.
5. The brake pad material TRIBCO (non-asbestos organic material) provides highest corrosion
resistance in comparison to coated, non-friction-tested and other coated-friction tested
samples.
6. The thickness of the coating was found to be in the range of 16-23 µm.

33
REFERENCES
[1] Kancharla, S. (2018). Effect of Humidity and testing strategy on Friction Performance of
model brake pads containing Nano-additives. OpenSIUC, 58.
[2] Kosugi, D., Hagio, T., Kamimoto, Y., & Ichino, R. (2017). Effect of the Addition of
Molybdenum on the structure and Corrosion Resistance of Zinc-Iron Plating. coatings,
14.
[3] Mohebbi, H., & Li, C. Q. (2011). Experimental Investigation on Corrosion of Cast Iron
Pipes. International Journal of Corrosion, 17.
[4] Ahmed, M. K., Shahid, M., Khan, Z. A., & Ammar, A. U. (2018). Electrochemical
Comparison of SAN/PANI/FLG and ZnO/GO Coated Cast Iron Subject to Corrosive
Environments. materials, 15.
[5] Falola, B. D., Krishnamurthy, A., Radhakrishnan, R., & Suni, I. I. (2013). Galvanic
Deposition of Mo Atop Al 6061 Alloy. ECS, D37-D39.
[6] Han, G., Jiang, P., Wang, J., & Yan, F. (2016). Effects of NaCl concentration on wear-
corrosion behavior of SAF 2507 super duplex stainless steel. RSC Advances, 111261-
111268.
[7] Wang, C., Jiang, F., & Wang, F. (2004). The characterization and corrosion resistance of
cerium chemical conversion coatings for 304 stainless steel . CORROSION SCIENCE,
75-89.
[8] Dec, W., Mosialek, M., Socha, R. P., & Jaworska-Kik, M. (2016). The effect of sulphate-
reducing bacteria biofilm on passivity and development of pitting on 2205 duplex
stainless steel. Electrochimica Acta, 225-236.
[9] May, M. (2016). Corrosion behavior of mild steel immersed in different concentrations of
NaCl solutions. Journal of Sebha University-(pure and applied sciences), 12.
[10] AlHazaa, A., Sherif, E.-S. M., & Abdo, H. S. (2015). Galvanic Corrosion in 3.5wt% NaCl
solutions of Magnesium alloy AZ31 Coupled with Ni after different Bonding Periods of
time. International Journal of ELECTROCHEMICAL SCIENCE, 5420-5433.
[11] Falola, B. D., & Suni, I. I. (2014). Galvanic Deposition of Ti atop Al 6061 Alloy. ECS,
D107-D110.
[12] Kong, J.-Z., Hou, T.-J., Wang, Q.-Z., Yin, L., Zhou, F., Zhou, Z.-F., & Li, L. K.-Y. (2016).
Influence of titanium or aluminum doping on the electrochemical properties of CrN
coatings in artificial seawater. Surface and Coatings Technology, 118-124.
[13] Guan, X., Wang, Y., Zhang, G., Xin, J., Wang, L., & Xue, Q. (2016). A novel duplex
PDMS/CrN coating with superior corrosion resistance for marine applications. RSC
Advances, 87003-87012.
[14] Kucuk, I., & Sarioglu, C. (2015). CORROSION OF CrN-COATED STAINLESS STEEL
IN A NaCl SOLUTION (w=3%). Materials and technology, 19-26.

34
[15] Marin, E., Lekka, M., Andreatta, F., Fedrizzi, L., Itskos, G., Moutsatsou, A., . . .
Kouloumbi, N. (2012). Electrochemical study of Aluminum-Fly Ash composites obtained
by powder metallurgy. MATERIALS CHARACTERIZATION, 16-30.
[16] Li, Z., Zhang, C., & Liu, L. (2015). Wear behavior and corrosion properties of Fe-based thin
film metallic glasses. Journal of Alloys and compounds, 127-135.
[17] Song, G., Li, S., Liu, G., Fu, Q., & Pan, C. (2018). Influence of graphene oxide content on
the Zn-Gr composite layer prepared by pulse reverse electro-plating. Journal of the
Electrochemical Society, D501-D510.
[18] Jones, D. A. (1996). Principles and Prevention of CORROSION. New York: Prentice Hall.
[19] Elgrishi, N. R., McCarthy, B. D., Rountree, E. S., & Eisenhart, T. T. (2017). A Practical
Beginner's Guide to Cyclic Voltammetry. JOURNAL OF CHEMICAL EDUCATION,
197-206.
[20] Falola, B. D., Wiltowski, T., & Suni, I. I. (2016). Electrodeposition of MoS2 for charge
storage in electrochemical supercapacitors. Journal of the Electrochemical Society,
D568-D574.
[21] Instruments, G. (2018, May 10). Getting started with Electrochemical Corrosion
Measurement. Retrieved from Gamry Application notes:
https://www.gamry.com/application-notes/corrosion-coatings/basics-of-electrochemical-
corrosion-measurements/
[22] Filip, P., & Meckel, N. K. (2019). United States of America Patent No. 10,197,121.

35
VITA
Graduate School
Southern Illinois University
Prabin Parajuli
Kathmandu University,
Bachelor of Engineering in Mechanical Engineering,
December 2015.
Thesis Paper Title:
Experimental investigation of corrosion of coated cast iron rotors in the automotive
industry.
Major Professor: Dr. Ian Ivar Suni.