experimental evidence for the functional relevance of ... · experimental evidence for the...
TRANSCRIPT

© 2010 Macmillan Publishers Limited. All rights reserved.
S1
Experimental evidence for the functional relevance of anion- interactions
Ryan E. Dawson,1,5 Andreas Hennig,1,5 Dominik P. Weimann,2 Daniel Emery,1 Velayutham
Ravikumar,1 Javier Montenegro,1 Toshihide Takeuchi,1 Sandro Gabutti,3 Marcel Mayor,3,4 Jiri
Mareda,1 Christoph A. Schalley2 & Stefan Matile1*
1Department of Organic Chemistry, University of Geneva, Geneva, Switzerland. 2Institut für
Chemie und Biochemie der Freien Universität, Berlin, Germany. 3Department of Chemistry,
University of Basel, Basel, Switzerland. 4Institute of Nanotechnology, Karlsruhe Institute of
Technology, Germany. 5These two authors contributed equally to the study.
*To whom correspondence should be addressed. E-mail: [email protected]
Supplementary Information
Table of Content
1. Materials and methods S2
2. Supplementary text S4
2.1. Synthesis S4
2.1.1. Synthesis of O-NDI rods S4
2.1.2. Synthesis of monomeric NDIs S7
2.1.3. Synthesis of O-NDI cyclophanes S12
2.1.4. Synthesis of NDI hydrazones S12
2.2. ESI-FTICR-MS-MS experiments S15
2.3. Charge-transfer complex formation S16
2.4. Anion transport S19
2.4.1. Vesicle preparation S19
2.4.2. Determination of transport activity with the HPTS assay S21
2.4.3. Determination of transport activity with the CF assay S22
2.4.4. Determination of transport activity with the lucigenin assay S23
SUPPLEMENTARY INFORMATIONdoi: 10.1038/nchem657
nature chemistry | www.nature.com/naturechemistry 1
© 2010 Macmillan Publishers Limited. All rights reserved.
S2
2.4.5. Determination of ion selectivity with the HPTS assay S24
2.4.6. AMFE Measurements with the HPTS assay S25
2.5. Computational models S25
3. Supplementary figures S28
4. Supplementary tables S47
5. Supplementary references S52
1. Materials and methods
As in refs. S1-S3, Supplementary Information. Briefly, reagents for synthesis were purchased
from Fluka and Aldrich, amino acid derivatives from Novabiochem and Bachem, HATU from
Applied Biosystems, buffers and salts of the best grade available from Fluka or Sigma-Aldrich and
used as received. 8-Hydroxy-1,3,6-pyrenetrisulfonate (HPTS) was from Fluka. Egg yolk
phosphatidylcholine (EYPC) and a Mini-Extruder used for vesicle preparation were from Avanti
Polar Lipids. All reactions were performed under N2 or argon atmosphere. Unless stated otherwise,
column chromatography was carried out on silica gel 60 (Fluka, 40-63 m). Analytical (TLC) and
preparative thin layer chromatography (PTLC) was performed in silica gel 60 (Fluka, 0.2 mm) and
silica gel GF (Analtech, 1000 m), respectively. HPLC was performed using a Jasco HPLC system
(PU-980, UV-970, FP-920), [ ]20D values were recorded on a Jasco P-1030 Polarimeter, melting
points (m.p.) on a heating table from Reichert (Austria). IR spectra were recorded on a Perkin
Elmer Spectrum One FT-IR spectrometer (ATR, Golden Gate, unless stated otherwise) and are
reported as wavenumbers in cm-1 with band intensities indicated as s (strong), m (medium), w
(weak). ESI-MS for the characterization of new compounds was performed on a Finnigan MAT
SSQ 7000 instrument or a ESI API 150EX and are reported as mass-per-charge ratio m/z (intensity
in %, [assignment]). Accurate mass determinations using ESI (HR ESI-MS) were performed on a
2 nature chemistry | www.nature.com/naturechemistry
SUPPLEMENTARY INFORMATION doi: 10.1038/nchem657

© 2010 Macmillan Publishers Limited. All rights reserved.
S3
Sciex QSTAR Pulsar mass spectrometer. Anion binding studies were conducted with an Ionspec
QFT-7 FT-ICR mass spectrometer (Varian Inc., Lake Forest, CA), equipped with a 7 T
superconducting magnet and a Micromass Z-Spray electrospray ionization (ESI) source (Waters
Co., Saint-Quentin, France). 1H and 13C spectra were recorded (as indicated) either on a Bruker 300
MHz, 400 MHz or 500 MHz spectrometer and are reported as chemical shifts ( ) in ppm relative to
TMS ( = 0). Spin multiplicities are reported as a singlet (s), doublet (d), triplet (t), quartet (q) and
quintet (quint) with coupling constants (J) given in Hz, or multiplet (m). Broad peaks are marked as
br. 1H and 13C resonances were assigned with the aid of additional information from 1D & 2D
NMR spectra (H,H-COSY, DEPT 135, HSQC and HMBC). UV-Vis spectra were recorded on a
JASCO V-650 spectrophotometer equipped with a stirrer and a temperature controller (25 ºC) and
are reported as maximal absorption wavelength in nm (extinction coefficient in mM-1cm-1).
Fluorescence measurements were performed with a FluoroMax-2 spectrofluorometer (Jobin-Yvon
Spex) equipped with a stirrer and a temperature controller. All measurements were performed at 25
°C.
Abbreviations. ACN: Acetonitrile; AcOH: Acetic acid; Alloc: Allyloxycarbonyl; AMFE:
Anomalous mole fraction effect; Boc: t-Butoxycarbonyl; calcd: Calculated; Cbz:
(Benzyloxy)carbonyl; CF: 5(6)-Carboxyfluorescein; DCM: Dichloromethane; DMAc: N,N-
Dimethylacetamide, DMF: N,N-Dimethylformamide; DMSO: Dimethylsulfoxide; DTBP: Di-t-
Bu-pyridine; EDC: N-(3-Dimethylaminopropyl)-N -ethylcarbodiimide; EYPC: egg yolk
phosphatidylcholine; Fmoc: N-(9-Fluorenylmethoxycarbonyl); Glu: L-Glutamic acid; Gly:
Glycine; HATU: O-(7-Azabenzotriazol-1-yl)-N,N,N’,N’-tetramethyluronium hexafluorophosphate;
HBTU: O-(Benzotriazol-1-yl)-N,N,N’,N’-tetramethyluronium hexafluorophosphate; Hepes: N-(2-
hydroxyethyl)piperazine-N’-(2-ethanesulfonic acid); HPTS: 8-hydroxy-1,3,6-pyrenetrisulfonate;
nature chemistry | www.nature.com/naturechemistry 3
SUPPLEMENTARY INFORMATIONdoi: 10.1038/nchem657

© 2010 Macmillan Publishers Limited. All rights reserved.
S4
HRMS: High resolution mass spectrometry; LUVs: large unilamellar vesicles; LG: Lucigenin;
NDA: 1,4,5,8-Naphthalenedianhydride; NDI: 1,4,5,8-Naphthalenediimide; NMP: N-Methyl-2-
pyrrolidinone, NTE: 1,4,5,8-Naphthalenetetraester; RPHPLC: Reverse phase high performance
liquid chromatography; rt: Room temperature; sh: Shoulder; TEA: Triethylamine; TFA:
Trifluoroacetic acid; TFE: 2,2,2-Trifluoroethanol; THF: Tetrahydrofuran.
2. Supplementary text
2.1. Synthesis
2.1.1. Synthesis of O-NDI rods (fig. S1)
Compound 2c. This compound was prepared from the commercially available starting
materials 2a and 2b as previously reportedS1.
Compound 2d. This compound was prepared from compound 2c as previously reportedS1.
Compound 2e. This compound was prepared from compound 2d and 2b as previously
reportedS1.
Compound 2f. This compound was prepared from compound 2e as previously reportedS1.
Compound 2h. A solution of the amine 2f (220 mg, 0.35 mmol) and the anhydride 2g (69.8
mg, 0.70 mmol) was stirred in THF (10 ml) at rt under a nitrogen atmosphere and in the absence of
4 nature chemistry | www.nature.com/naturechemistry
SUPPLEMENTARY INFORMATION doi: 10.1038/nchem657

© 2010 Macmillan Publishers Limited. All rights reserved.
S5
light. After 4 h the reaction mixture was evaporated to dryness and the resultant residue was
purified by column chromatography (DCM/MeOH 9:1) to afford the acid 2h as a colorless semi-
solid (247 mg, 97%). Rf (DCM/MeOH 9:1): 0.31; [ ]20D = -31.7 (c = 0.18 M in MeOH); IR (neat):
3278 (m), 2982 (m), 2933 (m), 1721 (s), 1623 (s), 1532 (m), 1367 (m), 1318 (m), 1272 (m), 1249
(m), 1148 (s), 1019 (m), 1005 (m), 952 (m), 849 (m), 707 (m); 1H NMR (400 MHz, CD3OD): 4.41-
4.36 (m, 1H), 4.35-4.29 (m, 2H), 2.70-2.45 (m, 6H), 2.45-2.29 (m, 6H), 2.20-2.02 (m, 3H), 2.00-
1.83 (m, 3H), 1.47 (s, 9H), 1.45 (s, 27H); 13C NMR (100 MHz, CD3OD): 176.0 (s), 174.4 (s), 174.4
(s), 174.3 (s), 174.2 (s), 174.1 (s), 172.2 (s), 83.5 (s), 82.3 (s), 82.3 (s), 54.8 (t), 54.3 (d), 52.7 (d),
33.2 (t), 33.1 (t), 33.0 (t), 32.3 (t), 31.5 (t), 30.6 (t), 28.9 (q), 28.8 (q), 28.7 (t), 28.5 (t), 28.3 (t); MS
(ESI, -ve): 729 (100, [M]-); HR-MS (ESI, -ve): Calcd for C35H58O13N3: 728.3975, found:
728.3904.
Compound 2k. To water (1.3 l), the anhydride 2i (6.51 g, 24.3 mmol) and 1 M KOH (130 ml)
were added at rt. The solution was briefly stirred at rt before the pH was adjusted to 6.4 with 1 M
H3PO4. To the resulting mixture the amine 2j (2.36 g, 12.2 mmol) was added and the pH was
readjusted to 6.4 with 1 M H3PO4. The mixture was then stirred at reflux for 15 h. After the
cooling to rt, AcOH was added until the product precipitated. The solid was filtered and dried under
vacuum to give 2k (4.25 g, 76%) as a yellow solid. Analytical and spectroscopic data were as
previously reportedS2.
NDI 2m. This compound was prepared from compounds 2i and 2l as previously reportedS1.
O-NDI 2n. The anhydride 2k (1.70 g, 3.83 mmol) and the amine 2m (204 mg, 0.36 mmol)
were suspended in dry DMAc (40 ml) with 5 Å molecular sieves under an atmosphere of nitrogen.
nature chemistry | www.nature.com/naturechemistry 5
SUPPLEMENTARY INFORMATIONdoi: 10.1038/nchem657
© 2010 Macmillan Publishers Limited. All rights reserved.
S6
The mixture was stirred at 135 °C for 22 h. The reaction mixture was then allowed to cool to rt and
the solvent was removed in vacuo. The residue was suspended in DCM (100 ml) and subjected to
centrifugation. The filtrate was collected and the extraction and centrifugation process with DCM
was repeated a further two times (2 100 ml). The combined DCM extracts were washed with 1M
KHSO4 (2 100 ml), dried over Na2SO4 and evaporated to dryness. The residue was then
suspended in MeOH (100 ml) and subjected to centrifugation before the supernatant was discarded.
The step was repeated until the supernatant was colorless (5 times). The residue was then purified
by column chromatography (DCM/MeOH 90:1) to afford the O-NDI 2n as a yellow solid (284 mg,
56%). Analytical and spectroscopic data were as previously reportedS1.
O-NDI 2o. This compound was prepared from compound 2n as previously reportedS1.
O-NDIs 2p, 2q and 2r. This mixture of compounds was prepared from compound 2n as
previously reportedS1.
O-NDI 2s. This compound was prepared from the mixture of compounds 2p, 2q and 2r as
previously reportedS1.
O-NDI 2t. A solution of the peptide 2h (88.8 mg, 0.121 mmol), HATU (45.6 mg, 0.121 mmol)
and TEA (57.6 µl, 0.408 mmol) in freshly distilled DMF (1.5 ml) was stirred under an atmosphere
of nitrogen for 15 min at rt. 0.5 ml of the peptide solution was then added to a solution of the O-
NDI 2s (20 mg, 0.014 mmol) and TEA (5.8 µl, 0.040 mmol) in DMF (0.5 ml). After 1.5 h a further
0.5 ml of the peptide solution was added to the reaction mixture. After a further 1.5 h the final 0.5
ml portion of the peptide solution was added to the reaction mixture. After a total reaction time of 4
6 nature chemistry | www.nature.com/naturechemistry
SUPPLEMENTARY INFORMATION doi: 10.1038/nchem657
© 2010 Macmillan Publishers Limited. All rights reserved.
S7
h the reaction mixture was evaporated to dryness and the residue was purified by PTLC
(DCM/MeOH 15:1) to afford the O-NDI 2t (8.9 mg, 30% (36% based on recovered starting
material)) as a yellow solid. Mp: >230 °C; HPLC (YMC-Pack SIL 10 x 250 mm, DCM/MeOH
9:1, 2 ml/min): Rt = 6.8 min; UV/vis (CHCl3): 382 (41.0), 361 (32.0); IR (DCM): 1712 (s), 1676
(s), 1604 (w), 1582 (m), 1520 (m), 1451 (m), 1369 (m), 1335 (s), 1154 (m), 846 (m); 1H NMR (400
MHz, CDCl3): 8.97-8.91 (m, 4H), 8.89-8.83 (m, 4H), 8.80-8.74 (m, 4H), 7.82-7.73 (m, 3H), 7.65-
7.58 (m, 2H), 7.46-7.39 (m, 3H), 7.36-7.30 (m, 2H), 7.29-7.18 (m, 2H), 6.74 (t, 3J(H,H) = 4.0 Hz,
1H), 6.60-6.55 (m, 1H), 5.30-5.23 (m, 1H), 4.52-4.20 (m, 9H), 4.00-3.91 (m, 1H), 3.81-3.60 (m,
8H) 2.75-1.90 (m, 40H), 1.47-1.39 (m, 36H); MS (ESI, -ve): 2252 (100, [M + OAc]-), 2193 (100,
[M]-).
O-NDI 2. A solution of the O-NDI 2t (7.9 mg, 0.0036 mmol) in TFA (1 ml) was stirred for 75
min at rt. The solvent was removed in vacuo and the residue was suspended in n-hexane (7.5 ml).
The suspension was centrifuged and the supernatant discarded. Centrifugation another two times
with n-hexane (2 7.5 ml) afforded the O-NDI 2 as a light brown solid (7.1 mg, quant.). 1H NMR
(400 MHz, CDCl3/CD3OD (6:1) + 1% TFA-d): 8.92-8.85 (m, 4H), 8.83-8.75 (m, 4H), 8.70 (dd,
3J(H,H) = 7.6 Hz, 3J(H,H) = 18.8 Hz, 4H), 7.71 (d, 3J(H,H) = 7.2 Hz, 2H), 7.55 (d, 3J(H,H) = 7.2
Hz, 2H), 7.32 (t, 3J(H,H) = 7.2 Hz, 2H), 7.25-7.20 (m, 2H), 4.40-4.30 (m, 7H), 4.16 (t, 3J(H,H) =
7.2 Hz, 1H), 3.81-3.50 (m, 10H), 2.60-1.88 (m, 40H); MS (ESI, -ve): 1968 ([M]-).
2.1.2. Synthesis of monomeric NDIs (fig. S2)
NDI 3. NDA 3a (300 mg, 1.12 mmol) and 2,4,6-trimethylaniline 13 (454 mg, 3.36 mmol) were
added to dimethylacetamide (50 ml) and heated to 135 °C for 16 h. After cooling of the reaction
nature chemistry | www.nature.com/naturechemistry 7
SUPPLEMENTARY INFORMATIONdoi: 10.1038/nchem657

© 2010 Macmillan Publishers Limited. All rights reserved.
S8
mixture, the solvent was removed in vacuo, and the residue was vigorously stirred with CHCl3 (100
ml). Insoluble material was removed by filtration and the organic phase was washed with H2O (2 x
50 ml) and 1 M KHSO4 (2 x 50 ml). The organic phase was dried over Na2SO4 and the solvent
removed by rotary evaporation. Purification by recrystallization from MeOH/ CHCl3 5:1 gave pure
3 (196 mg, 35%) as a colorless solid. Mp: >300 °C; Rf (CH2Cl2): 0.32; 1H NMR (400 MHz,
CDCl3): 8.93 (s, 4H), 7.13 (s, 4H), 2.44 (s, 6H), 2.17 (s, 12H); 13C NMR (125 MHz, CDCl3): 162.3
(s), 139.1 (s), 134.9 (s), 131.5 (d), 130.4 (s), 129.6 (d), 127.6 (s), 126.9 (s), 21.2 (q), 17.7 (q); IR
(neat): 3373 (w), 3271 (w), 2918 (w), 1713 (m), 1676 (s), 1667 (s), 1608 (w), 1578 (m), 1486 (w),
1449 (m), 1438 (m), 1339 (s), 1305 (m), 1198 (m); MS (ESI, MeOH/CHCl3 9:1): 504 (100, [M +
H]+).
NDI 4. NDA 3a (300 mg, 1.12 mmol) and aniline 4a (336 mg, 3.36 mmol) were added to
dimethylacetamide (30 ml) and heated to 135 °C for 20 h. After cooling of the reaction mixture, the
solvent was removed in vacuo, and the residue was vigorously stirred with CHCl3 (100 ml).
Insoluble material was removed by filtration and the organic phase was washed with H2O (2 x 50
ml) and 1 M KHSO4 (2 x 50 ml). The organic phase was dried over Na2SO4 and the solvent
removed by rotary evaporation. Purification by flash column chromatography on silica gel
(CH2Cl2/MeOH 99.5:0.5) gave pure 4 (81 mg, 17%) as a colorless solid. Mp: >300 °C; Rf
(CH2Cl2/MeOH 99:1): 0.40; 1H NMR (400 MHz, CDCl3): 8.86 (s, 4H), 7.63-7.52 (m, 6H), 7.37-
7.34 (m, 4H); 13C NMR (125 MHz, CDCl3/TFA-d 7:3): 165.0 (s), 133.3 (s), 133.0 (d), 130.7 (d),
130.5 (d), 128.3 (d), 127.5 (s), 127.0 (s); IR (neat): 3086 (w), 3058 (w), 1710 (m), 1663 (s), 1580
(m), 1489 (m), 1447 (m), 1344 (s), 1243 (s), 1196 (s); MS (ESI, MeOH/CHCl3 9:1): 419 (100, [M +
H]+).
8 nature chemistry | www.nature.com/naturechemistry
SUPPLEMENTARY INFORMATION doi: 10.1038/nchem657

© 2010 Macmillan Publishers Limited. All rights reserved.
S9
Br,Br-NDA 12. This compound was obtained as a mixture of bromination products following
previously reported proceduresS3.
Br,Br-NDI 14. A mixture of NDI bromination products including Br,Br-NDA 12 (1.0 g, <2.36
mmol) and 2,4,6-trimethylaniline 13 (1.32 ml, 9.44 mmol) in AcOH (50 ml) was heated at 80 ºC for
12 h. The reaction mixture was filtered and the remaining precipitate was washed with AcOH (5
ml). The crude product was purified by silica gel chromatography (CH2Cl2 / petroleum ether 7:3, Rf
(EtOAc / petroleum ether 3:2): 0.35) to give 14 (460 mg, >28%) as a yellow solid. Mp: > 220 °C;
IR: 2916 (m), 1716 (s), 1672 (s), 1561 (m), 1412 (s), 1224 (s), 886 (m); 1H NMR (400 MHz,
CDCl3): 9.16 (s, 2H), 7.13 (s, 4H) 2.43 (s, 6H), 2.15 (s, 12 H); 13C NMR (100 MHz, CDCl3): 160.3
(s), 160.2 (s), 139.6 (d), 139.4 (s), 134.8 (s), 130.2 (s), 129.7 (d), 128.6 (s), 128.6 (s), 125.7 (s),
124.5 (s), 21.2 (q), 17.8 (q); MS (ESI, +ve): 661/663 (100, [M + H]+).
CN,CN-NDI 5. A mixture of 14 (100 mg, 0.15 mmol) and CuCN (136 mg, 1.52 mmol) in NMP
(10 ml) was stirred at 100 oC for 5 h. The reaction mixture was concentrated in vacuo and purified
by a silica gel chromatography (CH2Cl2/MeOH 99:1; Rf (CH2Cl2): 0.20) to give 5 (52 mg, 63%) as
a yellow solid. Mp: >220 ºC; IR: 3388 (m), 2918 (m), 2234 (m), 1719 (s), 1675 (s), 1590 (s), 1434
(s), 1232 (s), 923 (m); 1H NMR (400 MHz, CD2Cl2): 9.18 (s, 2H), 7.15 (s, 4H) 2.44 (s, 6H), 2.14 (s,
12 H); 13C NMR (125 MHz, CD2Cl2): 160.1 (s), 159.7 (s), 136.8 (s), 135.4 (s), 130.0 (d), 129.8 (s),
129.2 (s), 128.7 (s), 127.8 (s), 117.6 (s), 115.9 (s), 21.2 (q), 17.8 (q); MS (ESI, +ve): 575 (7, [M +
NH4]+), 553 (100, [M + H]+).
Br,Br-NDI 15. Br,Br-NDA 12 (1.00 g, 2.34 mmol, mixture of brominated products) was
suspended in AcOH (20 ml) with NH4OAc (3.62 g, 47.0 mmol) and stirred at reflux for 1 h. The
nature chemistry | www.nature.com/naturechemistry 9
SUPPLEMENTARY INFORMATIONdoi: 10.1038/nchem657

© 2010 Macmillan Publishers Limited. All rights reserved.
S10
reaction mixture was allowed to cool to rt and the precipitate was filtered and washed with AcOH
(50 ml) and diethyl ether (100 ml) to afford 15 (0.77 g, 77%) as a mixture of its brominated isomers.
MS (ESI, +ve): 423 (100, [M(15, diBr) + H]+), 345 (47, [M(monoBr) + H]+), 265 (71, [M(noBr)
+ H]+).
CN,CN-NDI 6. A mixture of 15 (666 mg, 1.57 mmol) and CuCN were suspended in NMP (120
ml) and stirred at 100 °C for 1 h. The solvent was then removed in vacuo and the residue was
washed with 10% NH4OH (6 200 ml). The obtained crude 16, a brown solid, was carried over to
the next step without further purification. The crude 16, boronic acid 17 (1.15 g, 9.4 mmol),
Cu(OAc)2 (1.14 g, 6.3 mmol)S4 and TEA (1.3 ml, 9.4 mmol) were suspended in DMAc (125 ml)
containing 4 Å molecular sieves. The reaction mixture was purged with oxygen and then stirred at
55 °C for 2 d. Further equivalents of the boronic acid 17 (1.15 g, 9.4 mmol), Cu(OAc)2 (1.14 g, 6.3
mmol) and TEA (1.3 ml, 9.4 mmol) were then added with DMAc (25 ml). After a total reaction
time of 5 d, the reaction mixture was evaporated to dryness and the residue was filtered through a
pad of silica and flushed with 25:1 DCM/MeOH (500 ml). The collected filtrate was concentrated,
absorbed to silica and then purified by column chromatography (DCM and then DCM/acetone
100:1 and finally 50:1). Fractions containing the desired product were concentrated, absorbed to
silica and purified again by column chromatography (DCM/acetone 50:1) to afford the NDI 6 (31
mg, 4.2%) as a pale yellow solid. Mp: >230 °C; Rf (DCM/MeOH 100:1): 0.11; UV/vis (DMSO):
393 (9.0), 360 (11.0), 261 (41.0); IR (neat): 2231 (w), 1717 (m), 1672 (s), 1587 (w), 1486 (m),
1438 (m), 1377 (w), 1330 (s), 1243 (s), 1197 (w), 1162 (w), 1138 (w), 950 (m), 914 (m), 845 (m),
794 (m), 723 (s), 691 (m), 654, (m); 1H NMR (400 MHz, CDCl3): 9.25 (s, 2H), 7.67-7.61 (m, 6H),
7.38-7.33 (m, 4H); 13C NMR (75 MHz, CDCl3/TFA-d 1:1): 161.9 (s), 161.2 (s), 137.2 (d), 132.5
(s), 131.1 (d), 130.7 (d), 129.9 (s), 128.6 (s), 128.1 (d), 114.3 (s); MS (ESI, -ve): 468 (100, [M]-);
10 nature chemistry | www.nature.com/naturechemistry
SUPPLEMENTARY INFORMATION doi: 10.1038/nchem657

© 2010 Macmillan Publishers Limited. All rights reserved.
S11
HR-MS (ESI, -ve): Calcd for C28H12O4N4: 468.0864, found: 468.0883.
NDI 18. NDA 3a (500 mg, 1.86 mmol) and 2,6-dimethylaniline 18a (685 mg, 5.66 mmol) were
added to acetic acid (10 ml) and heated under microwave irradiation at 140 °C for 20 min. After
cooling of the reaction mixture, CHCl3 (100 ml) was added, the suspension was filtered and the
remaining precipitate was washed twice with CHCl3 (50 ml). The combined organic phases were
washed with H2O (2 x 50 ml), sat NaHCO3 (2 x 50 ml) and 1 M KHSO4 (2 x 50 ml), dried over
Na2SO4. The solvent was removed by rotary evaporation to give pure 18 (125 mg, 14%) as a
colorless solid. Mp: >300 °C; Rf (CH2Cl2/MeOH 99:1): 0.47; IR (neat): 3376 (w), 3016 (w), 2983
(w), 2926 (w), 2860 (w), 1709 (s), 1666 (s), 1580 (m), 1469 (m), 1448 (m), 1336 (s), 1243 (s), 1194
(s); 1H NMR (400 MHz, CDCl3): 8.90 (s, 4H), 7.37-7.42 (m, 2H), 7.30-7.32 (m, 4H), 2.18 (s, 12H);
13C NMR (125 MHz, CDCl3/TFA-d 7:3): 164.2 (s), 135.7 (s), 133.3 (d), 131.6 (s), 130.7 (d), 129.6
(d), 127.9 (s), 127.0 (s), 17.3 (q); MS (ESI, MeOH/CHCl3 9:1): 475 (100, [M + H]+).
NDI 19. This compound was prepared from NDA 3a (500 mg, 1.86 mmol) and 3,5-
dimethylaniline 19a (685 mg, 5.66 mmol) as described for regioisomer 18. The reaction was not
optimized because 19 was inactive in transport experiments (see below).
O,O-NTE 20a. This compound was obtained following previously reported procedures (NTE,
1,4,5,8-Naphthalenetetraester)S3.
O,O-NDI 20. O,O-NTE 20a (337 mg, 0.67 mmol) was suspended in 10 ml 1 M KOH in i-
propanol and heated for 18 h at 85 °C. After cooling of the reaction mixture, the solvent was
removed in vacuo and acetic acid (12 ml) and 2,4,6-trimethylaniline 13 (270 mg, 2.0 mmol) were
nature chemistry | www.nature.com/naturechemistry 11
SUPPLEMENTARY INFORMATIONdoi: 10.1038/nchem657

© 2010 Macmillan Publishers Limited. All rights reserved.
S12
added to the crude product. The reaction mixture was heated to 120 °C for 24 h. After cooling of
the reaction mixture, CHCl3 (50 ml) were added and the organic phase was washed with H2O (2 x
20 ml) and sat. NaHCO3 (2 x 20 ml). The combined organic phases were dried with MgSO4 and the
solvent was removed by rotary evaporation. The crude product was purified by flash column
chromatography on silica gel (CH2Cl2/MeOH 99.5:0.5) to afford 20 (364 mg, 92%) as a yellow
solid. Mp: >300 ºC; Rf (CH2Cl2): 0.32; 1H NMR (400 MHz, CDCl3): 8.62 (s, 2H), 7.10 (s, 4H),
4.54 (q, 3J = 6.9 Hz, 4H), 2.41 (s, 6H), 2.16 (s, 12H), 1.65 (t, 3J = 6.9 Hz, 6H); 13C NMR (125 MHz,
CDCl3): 161.9 (s), 160.5 (s), 138.7 (s), 135.0 (s), 130.9 (s), 129.5 (d), 127.6 (s), 120.3 (d), 111.3 (s),
66.5 (t), 21.2 (q), 17.9 (q), 14.8 (q); IR (neat): 2990 (w), 2943 (w), 2911 (w), 1707 (s), 1668 (s),
1574 (s), 1478 (m), 1436 (s), 1408 (m), 1378 (m), 1355 (m), 1331 (s), 1307 (s), 1217 (s), 1206 (s).
MS (ESI, MeOH/CHCl3 9:1): 614 (10, [M + Na]+), 592 (100, [M + H]+).
2.1.3. Synthesis of O-NDI cyclophanes
O-NDI 8 was prepared following literature proceduresS5.
2.1.4. Synthesis of NDI hydrazones (fig. S3)
NDIs 9a and 9b. A mixture of NDA 3a (707 mg, 2.64 mmol) and EDC (200 mg, 1 mmol) in
DMF (5 ml) was stirred for 5 min at 120 °C under an atmosphere of argon. The amine 4a (155 mg,
1.67 mmol) was added and the mixture was stirred for a further 2 h. The solvent was removed in
vacuo and the residue was then purified by column chromatography (DCM/MeOH 100:1, then 5:1
(+ 3% AcOH) to afford a brown solid (1.5 g) that contained residues of AcOH. A portion of the
crude product (1.3 g) was suspended in AcOH (2 ml) with NH4OAc (1.87 g, 24.3 mmol) and stirred
12 nature chemistry | www.nature.com/naturechemistry
SUPPLEMENTARY INFORMATION doi: 10.1038/nchem657

© 2010 Macmillan Publishers Limited. All rights reserved.
S13
at reflux for 1 h. The reaction mixture was allowed to cool to rt and the precipitate was filtered and
washed with AcOH (10 ml) and diethyl ether (50 ml) to afford a 4:1 mixture of the NDIs 9a and 9b
as a peach solid (212 mg, 36% of 9a, 5% of 9b (based on 1H NMR of 9a relative to 9b)); 1H NMR
(400 MHz, d6-DMSO): 12.16 (s, 1H, 9a), 12.11 (s, 2H, 9b), 8.66 (dd, 3J(H,H) = 7.6 Hz, 3J(H,H) =
12.8 Hz, 4H, 9a), 8.60 (s, 4H, 9b), 7.58-7.42 (m, 5H, 9a); MS (ESI, +ve): 703 (38, [2M(9a) +
NH4]+), 360 (53, [M(9b) + NH4]+), 343 (100, [M(9a) + H]+).
NDI 9. Under an atmosphere of nitrogen, the imide mixture 9a and 9b (50 mg, 0.122 mmol of
9a, 0.031 mmol of 9b), the boronic acid 9c (123 mg, 0.822 mmol), Cu(OAc)2 (100 mg, 0.548
mmol) and TEA (0.11 ml, 0.822 mmol) were suspended in DMAc containing 4 Å molecular sieves.
The reaction mixture was purged with oxygen and then stirred at 55 °C for 22 h. The reaction
mixture was then evaporated to dryness and the residue was purified by column chromatography
(DCM then DCM/acetone 20:1). Fractions containing the desired product were concentrated,
absorbed to silica and purified again by column chromatography (DCM/acetone 20:1) to afford 9
(47 mg, 86%) as a pale yellow solid. Mp: >230 °C; Rf (DCM/acetone 4:1): 0.76; UV/vis (DMSO):
382 (21.0), 362 (21.0), 258 (19.0); IR (neat): 3063 (w), 1705 (m), 1660 (s), 1580 (m), 1490 (w),
1448 (w), 1345 (m), 1241 (s), 1197 (s), 978 (m), 887 (w), 829 (m), 788 (w), 768 (s), 732 (s), 707
(m); 1H NMR (400 MHz, d6-DMSO): 10.12 (s, 1H), 8.74 (s, 4H), 8.12 (d, 3J(H,H) = 8.4 Hz, 2H),
7.74 (d, 3J(H,H) = 8.4 Hz, 2H), 7.60-7.47 (m, 5H); 13C NMR (100 MHz, d6-DMSO): 192.7 (d),
163.0 (s), 162.9 (s), 141.0 (s), 136.1 (s), 135.6 (s), 130.6 (d), 130.5 (d), 130.2 (d), 129.1 (d), 128.6
(d), 127.2 (s), 126.9 (s), 126.7 (s); MS (ESI, +ve): 447 (100, [M + H]+); HR-MS (ESI, +ve): Calcd
for C33H39O11N4+: 689.2429, found: 689.2469.
Hydrazones 10, 11, 21-23. Hydrazines/hydrazides 10a, 11c or 21a-23a (7.5 mM) in DMSO
nature chemistry | www.nature.com/naturechemistry 13
SUPPLEMENTARY INFORMATIONdoi: 10.1038/nchem657

© 2010 Macmillan Publishers Limited. All rights reserved.
S14
(50 l) and HCl (0.5 M) in water (2 l) were added to 9 (5 mM) in DMSO (75 l). After incubation
at 60 °C for 2 h, the mixture was cooled to rt, and NaOH (0.5 M) in water (2 l) was added. In-situ
prepared hydrazones 10, 11 and 21-23 could be used without further work-up and purification.
Compound 11b. HBTU (1082 mg, 2.85 mmol) and DIEA (2.44 ml, 14.25 mmol) were
sequentially added to a solution of Boc-Gly (500 mg, 2.85 mmol) in CH2Cl2 (25 ml) under N2. The
solution was stirred for 5 min and a solution of tert-butylcarbazate (377 mg, 2.85 mmol) in DCM (5
ml) was added dropwise. The reaction mixture was stirred at room temperature for 1h. The
reaction mixture was poured into a separation funnel containing CH2Cl2 (15 ml) and KHSO4 1 M
(35 ml). The aqueous phase was extracted with CH2Cl2 (2 x 15 ml). The organic layer was washed
with HCl 1M (35 ml), NaHCO3 saturated aqueous solution (35 ml), water (35 ml) and brine (35 ml)
and dried over Na2SO4. After filtration and removal of solvent under vacuum, the residue was
purified by silica gel column chromatography (CH2Cl2/MeOH, 9:1) to give 11b (742 mg, 90%) as a
colorless solid. Mp: 49-50 ºC; IR (neat): 3285 (m), 2979 (w), 1684 (s), 1140 (s); 1H NMR (400
MHz, CDCl3): 8.69 (s, 1H), 7.47-6.80 (m, 1H), 5.78-5.30 (m, 1H), 4.01-3.90 (m, 2H), 1.48 (s, 9H),
1.47 (s, 9H); 13C NMR (100 MHz, CDCl3): 169.8 (s), 156.3 (s), 155.6 (s), 81.7 (s), 42.7 (t), 28.3
(q), 28.2 (q); MS (ESI, MeOH): 602 (30, [2M+Na]+), 597 (12, [2M+H2O]+), 312 (83, [M+Na]+),
307 (43, [M++H2O] +), 290 (36, [M+H]+), 256 (43), 234 (45), 178 (100); HRMS: Calculated for
C12H23N3O5Na: 312.1529; found: 312.1527.
Compound 11c. HCl (1 M in Et2O, 10 ml) was added to a solution of 11b (250 mg, 0.86
mmol) in CH2Cl2 (5 ml) under N2. The reaction mixture was stirred under reflux for 12h. The
resulting suspension was then sonicated for 10 min. and stirred again under reflux for 8 h. Solvent
was removed under vacuum and the white solid formed was dissolved in MeOH (0.5 ml) and Et2O
14 nature chemistry | www.nature.com/naturechemistry
SUPPLEMENTARY INFORMATION doi: 10.1038/nchem657
© 2010 Macmillan Publishers Limited. All rights reserved.
S15
(20 ml) was added to obtain a white precipitate. The resulting suspension was centrifuged for 20
minutes and the solvent was discharged. The precipitate was washed with Et2O (2 x 15 ml) and
dried under high vacuum to afford the 11c (119 mg, 86% (hydrochloric salt)) as a colorless solid.
Mp: 199-200 ºC; IR (neat): 3005 (s), 2936 (s), 2849 (s), 2661 (s), 1708 (s); 1H NMR (400 MHz,
D2O): 3.93 (s, 2H); 13C NMR (100 MHz, D2O): 165.9 (s), 39.3 (t); MS (ESI, MeOH): 178 (89,
[2M+H]+), 134 (59), 99 (100), 90 (49, [M+H])+, 55 (71).
2.2. ESI-FTICR-MS-MS Experiments
All gas-phase experiments described herein were conducted with an Ionspec QFT-7 FT-ICR
mass spectrometer (Varian Inc., Lake Forest, CA), equipped with a 7 T superconducting magnet and
a Micromass Z-Spray electrospray ionization (ESI) source (Waters Co., Saint-Quentin, France).
The samples were introduced into the source as 50 µM solutions of NDI and the corresponding
anion in acetonitrile at flow rates of 1-2 µL/min. A constant spray and highest intensities were
achieved with a capillary voltage of 3000-3800 V – depending on the used NDI and anion – at a
source temperature of 40°C. The parameters for sample cone (20-45 V) and extractor cone voltage
(8-10 V) were optimized for maximum intensitites of the desired complexes (see fig. S4 for an
example). Multiple scans (20-50) were recorded and averaged for each spectrum in order to
improve the signal-to-noise ratio. After accumulation and transfer into the instrument’s FTICR
analyzer cell, the ions were detected by a standard excitation and detection sequence. The results of
these measurements are summarized in table S1 (see fig. S4 and S5 for example spectra). These
relatively simple MS experiments unravel a much higher ability to bind anions for the macrocyclic
NDI dimer 8 - also towards weakly coordinating anions - as well as the ability to form dimeric
complexes for both receptors (3 and 8).
nature chemistry | www.nature.com/naturechemistry 15
SUPPLEMENTARY INFORMATIONdoi: 10.1038/nchem657

© 2010 Macmillan Publishers Limited. All rights reserved.
S16
The formation of dimers was used for gas-phase competition experiments with NDI monomers
3-5 and 20. Since chloride proved to show the highest affinity to 3, this anion was used for the
competition experiments. To determine a ranking of binding strengths, equimolar solutions of each
pair of NDIs with 1 eq. NEt4Cl were electrosprayed and the corresponding heterodimer was isolated
and fragmented by irradiation with a 25 W IR laser (Fig. 3 and figs. S6 and S7). Although these
experiments are not at all trivial to perform because of the rather low parent ion intensities, a clear
order of binding strengths to chloride can be extracted from the data: 5 >> 20 > 4 > 3 (Table 1,
entries 1-3). A direct comparison of 4 and 5 was not possible, because the intensity of the
corresponding heterodimer was too low for the tandem MS experiment. We therefore chose 20 as a
"relay" and compared both 4 and 5 separately with 20. Comparison with transport data was possible
only for 3-5, because 20 was not reliably accessible for solution studies due to solubility problems.
The anion affinity of 20 was high despite comparably low active-site decrowding and -acidity.
This behavior is counter-intuitive given the electron-donating character of the two ethoxy
substituents. However, the polarizability of the substituents is a second effect that needs to be taken
into account. It may even overcompensate the electron-donating effects.
Different to the more qualitative results from simple day-to-day ESI MS measurements,
intensities found in tandem ESI MS relate to true gas phase experiments and can thus be used
directly to determine anion affinity sequences quantitativelyS6,S7. These results from tandem ESI
MS were thus of highest importance because they secured direct experimental evidence for anion
binding to minimalist NDI models, as well as their anion selectivity.
2.3. Charge-transfer complex formation
In general, determination of anion binding in solution proved to be challenging owing to the
16 nature chemistry | www.nature.com/naturechemistry
SUPPLEMENTARY INFORMATION doi: 10.1038/nchem657

© 2010 Macmillan Publishers Limited. All rights reserved.
S17
overall very low solubility of NDIs preventing an extensive solvent screening in NMR and the
presumably very low binding constants, which call for very high concentrations. Solvents capable
of solubilizing NDIs sufficiently were either anion coordinating (in case of chloroform, a hydrogen
bond donor; strong shifts of the chloroform signal occur in the presence of TBAX) or could be
expected to efficiently shield the -acidic surface (in case of toluene/acetonitrile). Therefore, the
anyway very low binding affinity would be further diminished. On the other hand, it was not
obvious if significant shifts could be expected theoretically upon anions binding to NDIs. They
should be much smaller than with H-bonding anion complexes (ring current effects?). Pertinent CT
literature does not report NMR titrations.
ITC was also not feasible because the very low binding constants call for very high
concentrations. The resulting very high heat of dilution during addition of tetrabutylammonium
salts exceeds any expected heat of binding by far. In fact the instruments detector was saturated in
an attempt to determine binding constants with ITC. Reduction of the concentrations to reduce the
heat of dilution also reduces the heat of binding and thus does not solve the problem. Ultimately,
UV proved to be the only way to investigate anion binding by minimalist NDIs in solution.
Titrations were carried out in mixtures of acetonitrile, freshly distilled dry THF and chloroform.
Tetrabutylammonium iodide (TBAI) was recrystallized from 1 mM Na2S2O3 prior to use to remove
traces of iodine. Background spectra with tetrabutylammonium halides were recorded before each
measurement. For core-unsubstituted NDIs, only the combination of TBAI in acetonitrile afforded
significant changes in absorption spectra (see Fig. 3e for TBAI with NDI 3).
The position of the band is in qualitative agreement with the Mulliken correlation reported by
Kochi and co-workersS8, i.e. the CT band of tetracyanopyrazine (Ered 0.2 V) with iodide has been
reported around 570 nm. Since core-unsubstituted NDIs have a significantly lower reduction
potential (Ered 0.4 to 0.5 V) the CT band is expected to lie at higher energy, which is in fact the
nature chemistry | www.nature.com/naturechemistry 17
SUPPLEMENTARY INFORMATIONdoi: 10.1038/nchem657

© 2010 Macmillan Publishers Limited. All rights reserved.
S18
case ( max 470 nm). In further agreement with the Mulliken correlation, CT bands with bromide
or chloride are presumably too far blue-shifted to be observed owing to the overlap with the very
strong NDI absorption (note that the absorbance is 9(!) for 300 M NDI and = 30 mM 1cm 1).
Dicyano NDI 5 with tetrabutylammonium bromide gave charge transfer band at max 510 nm
(fig. S8). This suggested a reduction potential of around +0.1 to +0.3 V (note that the CT
absorption is very broad and weak), when interpolated with the Mulliken correlation reported by
KochiS8, which is in agreement with a reported reduction potential of +0.08 V vs. SCE for dicyano-
naphthalenedioctylimide by WasielewskiS9.
As can be seen from Figure 3e, it was not possible to get full titration curves (solubility for
TBAI is ca. 1.3 M) and therefore a conventional nonlinear curve fitting was not possible. Therefore,
the Rose-Drago methodS10, which was also applied by Kochi and co-workers, has been triedS8. The
most general form of the Rose-Drago equation can be seen in (S1), in which the only unknowns are
the extinction of the complex c and the binding constant Ka. The observed absorbance Aobs is
measured and the extinctions g, h and concentrations [G]0, [H]0 of the binding partners G and H
are determined independently.
[ ] [ ][ ] [ ]( )
[ ] [ ][ ] [ ]00
0000
001 GHGHA
GHGHA
K ghobs
ghc
ghc
ghobs
a
++= (S1)
The idea of Rose and Drago was to set-up a graph which displays 1/Ka for all possible c. If this
is done for more than one combination of [G]0 and [H]0 the line graphs should intersect at the true
values of 1/Ka and c. This is the graphical version of setting up systems of linear equations for all
individual [G]0,n and [H]0,n and solving them. For the analytical version, an Excel spreadsheet has
been developed, which provides c and 1/Ka for all combinations investigated. The range of values
18 nature chemistry | www.nature.com/naturechemistry
SUPPLEMENTARY INFORMATION doi: 10.1038/nchem657

© 2010 Macmillan Publishers Limited. All rights reserved.
S19
for the extinction coefficient obtained was in qualitative agreement with that of typical charge
transfer bands (500-5000 M 1cm 1), while Ka ~ 0.2-0.4 M 1 was as low as expected for monomeric
NDIs and weakly binding anions such as I- and Br- (Ka = 1/KD, KD = dissociation constant).
Further evidence for the CT character of the new absorption band of NDI 3 with TBAI was
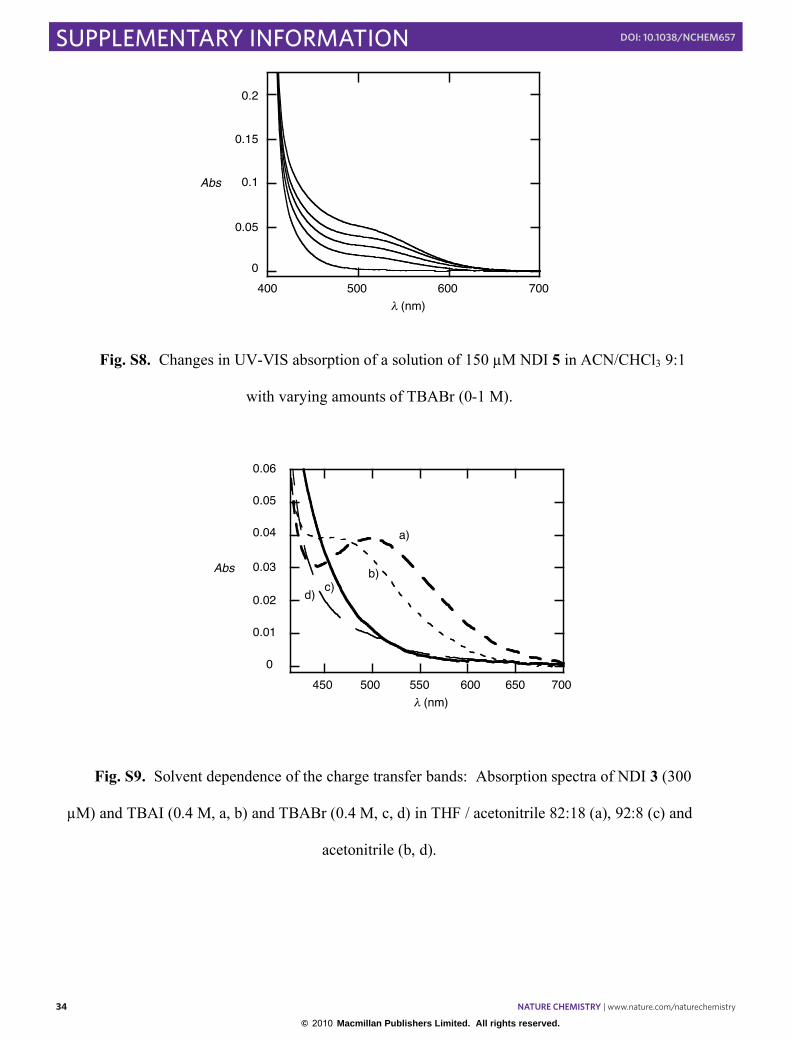
found when THF with 20% ACN was used instead of pure ACN (fig. S9). The less polar solvent
presumably destabilized the polar ground state to a larger extent than the less polar excited state,
which lead overall to a smaller energy gap and thus a bathochromic shift. This observation was
common for polar ground and unpolar excited statesS11. The solvent exchange experiments also
suggested that a small shoulder, which appears with bromide in ACN or THF could be attributed to
the corresponding CT band (fig. S9). Multiple, very strong bands were observed for dicyano NDI 5
with iodide and for core-unsubstituted NDIs with fluoride (fig. S10). In the former case, reduction
of dicyano NDI 5 (+0.08 V vs. SCE for dicyano-naphthalenedioctylimideS9) by iodide (+0.29 V vs.
SCE) was perhaps possibleS12,S13, while in the latter a case the formation of a Meisenheimer
complex, i.e. nucleophilic addition, might be responsible for the appearance of the absorption
bandsS13.
2.4. Anion transport
2.4.1. Vesicle preparation
EYPC-LUVs HPTSS1,S2,S14. A thin lipid film was prepared by evaporating a solution of 25
mg EYPC in 1 ml MeOH/CHCl3 (1:1) on a rotary evaporator (40 °C) and then in vacuo overnight.
After hydration (> 30 min) with 1.0 ml buffer (10 mM Hepes, 100 mM NaCl, 1 mM HPTS, pH 7.0),
the resulting suspension was subjected to >5 freeze-thaw cycles (liquid N2, 40 °C water bath), and
nature chemistry | www.nature.com/naturechemistry 19
SUPPLEMENTARY INFORMATIONdoi: 10.1038/nchem657

© 2010 Macmillan Publishers Limited. All rights reserved.
S20
>15 times extruded through a polycarbonate membrane (pore size 100 nm). Extravesicular
components were removed by size exclusion chromatography (Sephadex G-50, Sigma-Aldrich)
with 10 mM Hepes, 100 mM NaCl, pH 7.0. Final conditions: ~2.5 mM EYPC; inside: 10 mM
Hepes, 100 mM NaCl, 1 mM HPTS, pH 7.0; outside: 10 mM Hepes, 100 mM NaCl, pH 7.0.
EYPC-LUVs CFS14,S15. A thin lipid film was prepared by evaporating a solution of 25 mg
EYPC (25 mg) in CHCl3/MeOH (1:1, 1 ml) on a rotary evaporator (40 °C) and then overnight in
vacuo. After hydration (> 30 min) with 1 ml buffer (1 ml; 10 mM Hepes, 10 mM NaCl, 50 mM CF,
pH 7.0), the resulting suspension was subjected to >5 freeze-thaw cycles (liquid N2; 40 °C, water
bath), and >15 times extruded through a polycarbonate membrane (pore size 100 nm).
Extravesicular components were removed by size exclusion chromatography (Sephadex G-50) with
10 mM Hepes, 100 mM NaCl, pH 7.0. Final conditions: ~2.5 mM EYPC; inside: 10 mM Hepes,
10 mM NaCl, 50 mM CF, pH 7.0; outside: 10 mM Hepes, 100 mM NaCl, pH 7.0.
EYPC-LUVs LGS16-S19. A thin lipid film was prepared by evaporating a solution of 25 mg
EYPC (25 mg) in CHCl3/MeOH (1:1, 1 ml) on a rotary evaporator (40 °C) and then overnight in
vacuo. After hydration (> 30 min) with buffer (1 ml; 1 mM LG, 10 mM Hepes, 100 mM NaNO3,
pH 7.0), the resulting suspension was subjected to >5 freeze-thaw cycles (liquid N2; 40 °C, water
bath), and >15 times extruded through a polycarbonate membrane (pore size 100 nm).
Extravesicular components were removed by size exclusion chromatography (Sephadex G-50) with
10 mM Hepes, 100 mM NaNO3, pH 7.0. Final conditions: ~2.5 mM EYPC; inside: 10 mM Hepes,
100 mM NaNO3, 1 mM LG, pH 7.0; outside: 10 mM Hepes, 100 mM NaNO3, pH 7.0.
20 nature chemistry | www.nature.com/naturechemistry
SUPPLEMENTARY INFORMATION doi: 10.1038/nchem657

© 2010 Macmillan Publishers Limited. All rights reserved.
S21
2.4.2. Determination of transport activity with the HPTS assay
To 1950 l gently stirred, thermostated buffer (10 mM Hepes, 100 mM NaCl, pH 7.0) in a
disposable plastic cuvette, 25 l EYPC-LUVs HPTS were added. The time-dependent change in
fluorescence intensity ( em = 510 nm) was monitored at two excitation wavelengths simultaneously
( t,450: exc = 450 nm, It,405: exc = 405 nm) during the addition of base (20 l 0.5 M NaOH) at t = 50
s, NDI (see table S2 for details) at t = 100 s, and 20 l 100 M gramicidin A in DMSO at t = 300 s.
Time courses of fluorescence intensity It were obtained by first, ratiometric analysis (R = It,450 /
It,405) and second, normalization according to equation S2,
If = (Rt R0) / (R R0) (S2),
where R0 = Rt before addition of transporter and R = Rt after addition of gramicidin A (fig.
S11). If at 300 s just before addition of gramicidin A was defined as transmembrane activity Y, and
analyzed with the Hill equation S3 to give effective concentration EC50 and the Hill coefficient n,
Y = Y + (Y0 – Y ) / (1 + c / EC50)n) (S3),
where Y0 is Y in absence of NDI, Y is Y with excess NDI, and c is the NDI concentration.
Complete results for all NDIs are shown in table S3.
Comments beyond the ones made in the manuscript: In general, Hill coefficients n > 1
demonstrate the presence of unstable supramolecules, n 1 demonstrate that of active monomers or
stable supramoleculesS14. Saturation behavior with n < 1 suggested precipitation of the hydrophobic
NDIs 5 and 8 at high concentrations after addition of highly concentrated stock solutions (table S2)
nature chemistry | www.nature.com/naturechemistry 21
SUPPLEMENTARY INFORMATIONdoi: 10.1038/nchem657

© 2010 Macmillan Publishers Limited. All rights reserved.
S22
before reaching the membrane. n > 1 suggested that charged NDIs 2, 10, 11, 22 and 23 act
cooperatively as unstable supramolecules. n ~ 1 suggested that neutral NDIs 3, 4, 6 and 9 act as
supramolecules that are stable but soluble enough to avoid precipitation at high concentration, or as
monomers. The change from n ~ 1 to n > 1 with the addition of charges demonstrated that charge
repulsion gives destabilized active suprastructures. In the case of extreme solubility / delivery
problems (18-20) or inactivity even at high concentrations (23, 6 in CF assay), dose response curves
could not be completed and EC50 and n not determined (n.a. in table S3). Inactivity of trianionic 23
but not singly charged 10, 11 and 18-20 suggested that more than one charge per NDI is needed to
either fully destabilize the active suprastructure or inhibit the (auto-mediated) transmembrane
translocation needed to form the dimeric bundles (Fig. 1d).
2.4.3. Determination of transport activity with the CF assay
EYPC-LUVs CF (25 l, inside: 10 mM Hepes, 10 mM NaCl, 50 mM CF, pH 7.0) were added
to 1975 l gently stirred, thermostated buffer (10 mM Hepes, 100 mM NaCl or NaClO4, pH 7.0) in
a disposable plastic cuvette. The time-dependent changes in fluorescence intensity It ( exc = 492
nm, em = 517 nm) were monitored during the addition of NDIs (see table S2 for stock solutions) at
t = 0 min, and addition of triton X-100 (40 l 1.2 % aq) at the end of every experiment. Time
courses of It were normalized to fractional intensities If using equation S4,
If = (It – I0) / (I – I0) (S4),
where I0 = It before pore addition and I = It after lysis (fig. S12). If at 200 s after the start of
the experiment just before lysis was defined as transmembrane activity Y, and Hill analysis (eq S3)
22 nature chemistry | www.nature.com/naturechemistry
SUPPLEMENTARY INFORMATION doi: 10.1038/nchem657
© 2010 Macmillan Publishers Limited. All rights reserved.
S23
was applied to determine EC50 and n (table S3).
Comments: Inactivation of active NDIs 4, 5, and 9 by external chloride to perchlorate exchange
suggested that activity in this case originates from CF/anion antiport rather than from leakage,
although other explanations are conceivable (inactivation of delivery/active structure by perchlorate,
fig. S12). EC50 (HPTS) < EC50 (CF) for 2 and 6 indicated that the organization of the active
suprastructures is high enough to exclude non-specific CF transport without losses in specific anion
transport. The appearance of nitrate selectivity with EC50 (HPTS) < EC50 (CF) supports the
supramolecular origin of nitrate recognition.
2.4.4. Determination of transport activity with the lucigenin assay
EYPC-LUVs LGS16-S20 (25 l, inside: 1 mM LG, 10 mM Hepes, 100 mM NaNO3, pH 7.0)
were added to 1975 l gently stirred, thermostated buffer (10 mM Hepes, 100 mM NaCl, pH 7.0) in
a disposable plastic cuvette. The time-dependent changes in fluorescence intensity It ( ex = 372 nm,
em = 504 nm) were monitored during the addition of NDIs (see table S2 for stock solutions) at t =
50 s and triton X-100 (40 l 1.2 % aq) at the end of every experiment. Time courses of It were
normalized following refs. S12-S15. It / I0, were calibrated for I0 = It before pore addition (fig. S13,
left). Addition of triton-X 100 and calibration to the final fluorescence intensity I = It after lysis
introduces undesirable uncertainties as discussed previouslyS13. EC50 and n were determined by Hill
analysis of dose response curves as described above (fig. S13, right).
Comments: The EC50 = 0.75 M obtained for NDI 6 was in excellent agreement with results
from the CF assay, and demonstrated, according to pertinent reports in the literatureS16-S19 and
combined with inactivity in the CF assay, that NDI 6 mediates the influx of chloride into intact
vesicles (table S3).
nature chemistry | www.nature.com/naturechemistry 23
SUPPLEMENTARY INFORMATIONdoi: 10.1038/nchem657

© 2010 Macmillan Publishers Limited. All rights reserved.
S24
2.4.5. Determination of ion selectivity with the HPTS assay
EYPC-LUVs HPTS (25 l) prepared as described above were added to 1950 l gently stirred,
thermostated buffer (10 mM Hepes, 100 mM M+Cl (M+ = Li+, Na+, K+, Rb+, Cs+) or 100 mM
Na+X (X = F , OAc , Cl , NO3 , Br , I , SCN , ClO4 , SO42 (66 mM), pH 7.0) in a disposable
plastic cuvette. The time-dependent change in fluorescence intensity was monitored and analyzed
as described above to obtain the fractional transmembrane activity Y dependent on the externally
added cation or anion (figs. S14-S24).
Data analysis was performed as described above and R0 was defined as R just before addition of
base. Fractional activities were plotted as a function of anion dehydration energies (figs. S14-S24).
Sulfate is very negative, e.g. 1059 kJ/molS20 (note the break in the x-axis) and the absolute value
seems quite correct (e.g. 1145 kJ/mol in another report)S21. Nitrate has been reported with two
different positions in the series: (Br > NO3 > I)S16 and (F > NO3 > Cl)S21, whereby the former with
344 kJ/mol as a rough estimate fits nicely to our data.
Control experiments were carried out in which the addition of transporter and base has been
reversed, i.e. NDI was added at t = 50 s, and base (20 l 0.5 M NaOH) at t = 100 s (figs. S14-S24,
; normal addition as in fig. S11: ). It was apparent that the most active transporters (4, 5)
respond much less significantly towards reversed addition, which suggested that in these cases
membrane partitioning and X /Cl exchange are complete before X /OH exchange occurs. Overall,
the NDIs were consistently more anion than cation selective (see manuscript text). Regarding
cation selectivity, high activities were observed with lithium for the trimethylaryl derivatives 3 and
5, which may stem from binding to the -basic mesityl substituents (similar for cyclophane 8). In
24 nature chemistry | www.nature.com/naturechemistry
SUPPLEMENTARY INFORMATION doi: 10.1038/nchem657
© 2010 Macmillan Publishers Limited. All rights reserved.
S25
addition, favorable interactions like C=O M+ ion-dipole interactions may contribute to the
observed increase in activity with Li+.
2.4.6. AMFE measurements with the HPTS assay
25 l EYPC-LUVs HPTS prepared as described above were added to a mixtures of a l
buffer A and b l buffer B in a disposable plastic cuvette to give the indicated mole fractions x (figs.
S25-S28). The time-dependent change in fluorescence intensity was monitored and analyzed as
described above (final concentration as described for ion selectivity measurements) to obtain the
fractional activity Y.
Two combinations of anions were selected for 4 and 5: ClO4 /Cl and I /Cl . The more
challenging combination of iodide and chloride showed a significant AMFE for NDI 5 only (fig.
S26). In addition, the combination of perchlorate and chloride shows also a most pronounced
AMFE for NDI 5, which further corroborates the importance of anion- interactions.
2.5. Computational models
The geometries of the NDI-anion complexes were optimized at the PBE1PBE/6-311G** level
of theoryS22,S23 using the DFT methods of the Gaussian 03 programS24. Full geometry optimizations
without any restriction led to series of C1 minima listed in table S4. In addition, the NDI-anion
complexes 3, 4 and 7 were optimized with the Cs-symmetry constraint. The interaction energies of
the C1 and Cs complexes were computed with diffuse functionsS25,S26 at the PBE1PBE/6-
311++G**//PBE1PBE/6-311G** level of theory and corrected for the basis set superposition error
(BSSE) using the counterpoise methodS27. Separately, we undertook a comparative study for a
nature chemistry | www.nature.com/naturechemistry 25
SUPPLEMENTARY INFORMATIONdoi: 10.1038/nchem657

© 2010 Macmillan Publishers Limited. All rights reserved.
S26
limited test-set of anion-NDI complexes to confirm that in our specific case the inclusion of diffuse
functions would not modify the optimized geometries in a significant manner. To verify that the C1-
symmetry structures correspond to minima, vibrational analysis was also performed with the
PBE1PBE/6-311G** method. Table S4 lists, for each C1 complex, the number of imaginary
frequencies (NIMEG) issued from the frequency calculations, which for the minimum has to be
null.
The relative energies Erel listed in the Table S4, indicate, for chlorides and bromides, that the C1
complexes are systematically lover in energy when compared to conformers, which are restricted to
the Cs-symmetry point group. However, for the nitrate complexes the situation is quite different, as
the structures optimized without any geometry restriction adopt quasi Cs symmetric structure (table
S4, entry 19 - 27). Consequently only a minute energy differences between Cs and C1 point group
conformers are obtained together with very small variations in geometry parameters.
The computed BSSE-corrected binding energies of chloride anionic complexes decrease on one
hand with the increasing steric hindrances, while on the other hand they increase with the higher -
acidity of the NDI surface (table S4). Not surprisingly, the affinity sequence for bromide 1:1
complexes is, like chloride, decreasing according to similar rules. Indeed, a poorer fit of the larger
bromide anion into the confined binding site on the pyridinedione surface, results in binding
energies which are systematically inferior to chloride by some 12 kJ mol-1. The binding energies for
nitrates compared to chlorides and bromides are still lower. Such weakening is also found for
complexes 6 and 7, where the , -interactions between the flat nitrate anion and NDI are
maximized. This suggests that , -interactions contribute to anion binding, not only in nitrates, but
also in halides. As expected from experimental results, the anion binding by cyclophane 8 is
stronger than in 3 and 4, but nevertheless remain inferior to cyano substituted 1:1 complexes.
In case of N-aryl substituted NDI-anion complexes 3 - 8, the position of the anion with respect
26 nature chemistry | www.nature.com/naturechemistry
SUPPLEMENTARY INFORMATION doi: 10.1038/nchem657

© 2010 Macmillan Publishers Limited. All rights reserved.
S27
to the NDI core is controlled in a more or less subtle way. Due to the steric hindrance from the
ortho substituent of the N-aryl group, the anion is displaced from the optimal pyridinedione binding
site with the concomitant weakening of anion- interactions. Thus the distance between the NDI
plane and anion is increased (Re, table S4). While the steric interference has a major negative
impact on the binding and modifies the conformation of complexes, it is however partially
compensated by stabilizing C–H • • •X- interactionsS1b,S28,S29, witnessed by certain number of short
contacts between anion and atoms in ortho position (dx, table S4). In addition to the subtle balance
between these interactions, both the longitudinal (along N,N axes), as well as the transversal
displacements of the anion, respectively dlong and dtransv in table S4, are also correlated with the
orientation of aryl groups. In most cases the aryls are not perpendicular with respect to the NDI
planes in C1-symmetry complexes (figs. S29 and S30). Indeed, the dihedral angle controlling the
orientation of the aryl groups is variable, depending on parameters such as the position of anion, its
nature, as well as the type of the ortho substituent. Variations of anion location with respect to the
-surface of the NDI core as well as other conformational changes can also be appreciated in the
optimized structures of chloride (fig. S29) and nitrate (fig. S30) anionic complexes.
nature chemistry | www.nature.com/naturechemistry 27
SUPPLEMENTARY INFORMATIONdoi: 10.1038/nchem657

© 2010 Macmillan Publishers Limited. All rights reserved.
S28
3. Supplementary figures
N
N
O O
HNO
O O
NHFmoc
N
N
O O
O O
N
N
O O
HNO
O O
NHO
O
2t: R = tBu
2: R = H
HN
ONH
O
ORRO
O
OHN
OOR
O
OR
N
N
O O
HNO
O O
NHR2
N
N
O O
O O
N
N
O O
HNO
O O
NHR1
2h
m)
l)
OHO
OHN
ONH
O
OtButBu O
O
OHN
OOtBu
O
OtBu
N
N
O O
RHN
O O
N
N
O O
O O
N
N
O O
RHN
O O
k)
j)2p: R1 = Boc, R2 = Boc2q: R1 = Fmoc, R2 = Fmoc 2r: R1 = Boc, R2 = Fmoc
2s: R1 = H, R2 = Fmoc
2n: R = Z
2o: R = Hi)
NH2
N
N
O O
O O
NH2
2m
N
HO
O O
ZHN
O O
NH2ZHN
O
O
O O
O O
NH2
NH2
OH
2k
h)
f)2j
g)2i
2l
RHN
ONH
O
OtButBu O
O
OHN
OOtBu
O
OtBu
2e: R = Fmoc
2f: R = Hd)
OO O
2g
e)
NHRtBu O
O
OHN
OOtBu
O
OtBu
2c: R = Fmoc
2d: R = Hb)
c)
FmocHN
OOH
O
OtBu
2b
ClH3N
OOtBu
O
OtBu
a)
FmocHN
OOH
O
OtBu
2b
2a
Fig. S1. a) HBTU, TEA, DCM, 0 ºC to rt, 3 h, 79% (ref. S1: 88%); b) piperidine, DMF, rt, 3 h, 95%
(ref. S1: 85%); c) HBTU, TEA, DCM, 0 ºC to rt, 3 h, 78% (ref. S1: 84%); d) piperidine, DMF, rt, 20 h,
68% (ref. S1: 70%); e) THF, rt, 4 h, 97%; f) H2O, 1 M KOH, 1 M H3PO4, pH 6.4, reflux, 15 h, 76%
(ref. S1: 88%); g) DMAc, 135 ºC, 15 h, 90% (ref. S1: 90%); h) DMAc, 5 Å MS, 135 ºC, 16 h, 56%
(ref. S1: 57%); i) TFA, pentamethylbenzene, thioanisole, HBr in AcOH, rt, 1 h, quant. (ref. S1: 89%);
j) 1.1 eq. Fmoc-Gly-OH, 1.1 eq. Boc-Gly-OH, HBTU, TEA, DMF, rt, 1 h, 85% (ref. S1: 60%); k)
TFA/DCM 1:1, rt, 1 h, 94% (ref. S1: 95%); l) HATU, TEA, DMF, rt, 4 h, 30% (36% conversion); m)
TFA, rt, 75 min, quant.
28 nature chemistry | www.nature.com/naturechemistry
SUPPLEMENTARY INFORMATION doi: 10.1038/nchem657

© 2010 Macmillan Publishers Limited. All rights reserved.
S29
O O
OO
O
O
O O
O O
N
N
OO
OO
CN
NC
6
N
N
OO
OO
Br
Br
14
d)
O
O
OO
OO
Br
Br
12
HN
NH
O O
O O
NC
CN
16
NH
HN
OO
OO
Br
Br
15
g)
13
17
f)
HOBOH
N
N
OO
OO
4
b)
O
O
OO
OO
3a
NH2
4a
N
N
O O
O O
3
a)
NH2
13c)
N
N
OO
OO
CN
NC
5
e) h)
N
N
O O
O O
18
i)
NH2
18a
k)
N
N
O O
O O
20
l)
NH2
13
O
O
20a
N
N
OO
OO
19
j)
NH2
19a
Fig. S2. a) DMAc, 135 °C, 16 h, 35%; b) DMAc, 135 °C, 20 h, 17%; c) dibromocyaniruc acid, used as
mixture of bromination productsS3; d) AcOH, 80 °C, 12 h, >28%; e) CuCN, NMP, 100 °C, 5 h, 63%; f)
NH4OAc, AcOH, reflux, 1 h, 77%; g) CuCN, NMP, 100 ºC; h) Cu(OAc)2, TEA, DMAc, 4.2% (2 steps);
i) AcOH, 140 °C, 20 min, MW, 14%; j) as in i; k) EtI, EtOH,K2CO3, 24% from 3aS3; l) 1. KOH, i-PrOH,
85 °C, 18 h, 1. KOH, i-PrOH, 85 °C, 18 h, 2. 13, AcOH, 120 °C, 24 h, 92% (2 steps).
nature chemistry | www.nature.com/naturechemistry 29
SUPPLEMENTARY INFORMATIONdoi: 10.1038/nchem657

© 2010 Macmillan Publishers Limited. All rights reserved.
S30
4a
NH2
NH
HN
OO
OO
9b
a)
O
O
OO
OO
3a
N
N
O O
O O
N
NH
-O3S
10
N
N
OO
OO
O
9
N
N
O O
O O
N
NH
+H3N
O
11
NH2
NH
-O3S
10a
NH2
NH
+H3N
O
11c
HOBOH
O
9c
b)
c)
c)
e)
NHBoc
NH
BocHN
O
11b
d)
OH
BocHN
O
11a
N
N
O O
O O
N
NH
HN
O
21
c)
NH2+H2N
NH2
NH
HN
O
NH2+H2N
21a
c)
N
N
O O
O O
N
NH
-OOC
22
NH2
NH
-OOC
22a
c)
SO3–
SO3–
–O3S
HN
O
O
N
N
O O
O O
N
23
SO3–
SO3–
–O3S
HN
O
O
NH2
23a
N
HN
OO
OO
9a
+
Fig. S3. a) 1. 4a, EDC, DMF, 2h, 2. NH4OAc, AcOH, reflux, 1 h, 36% (9a, 5% 9b); b) Cu(OAc)2,
TEA, DMAc, 55 ºC, 22 h, 86%; c) 1. HCl, DMSO, 50 ºC, 2 h; 2. NaOH, quant; d) NH2-NHBoc, HBTU,
DIEA, DCM, rt, 90%; e) 1 M HCl (Et2O), DCM, reflux, 86%; f) 1. HCl, DMSO, 50 ºC, 2 h; 2. NaOH,
quant.
30 nature chemistry | www.nature.com/naturechemistry
SUPPLEMENTARY INFORMATION doi: 10.1038/nchem657
© 2010 Macmillan Publishers Limited. All rights reserved.
S31
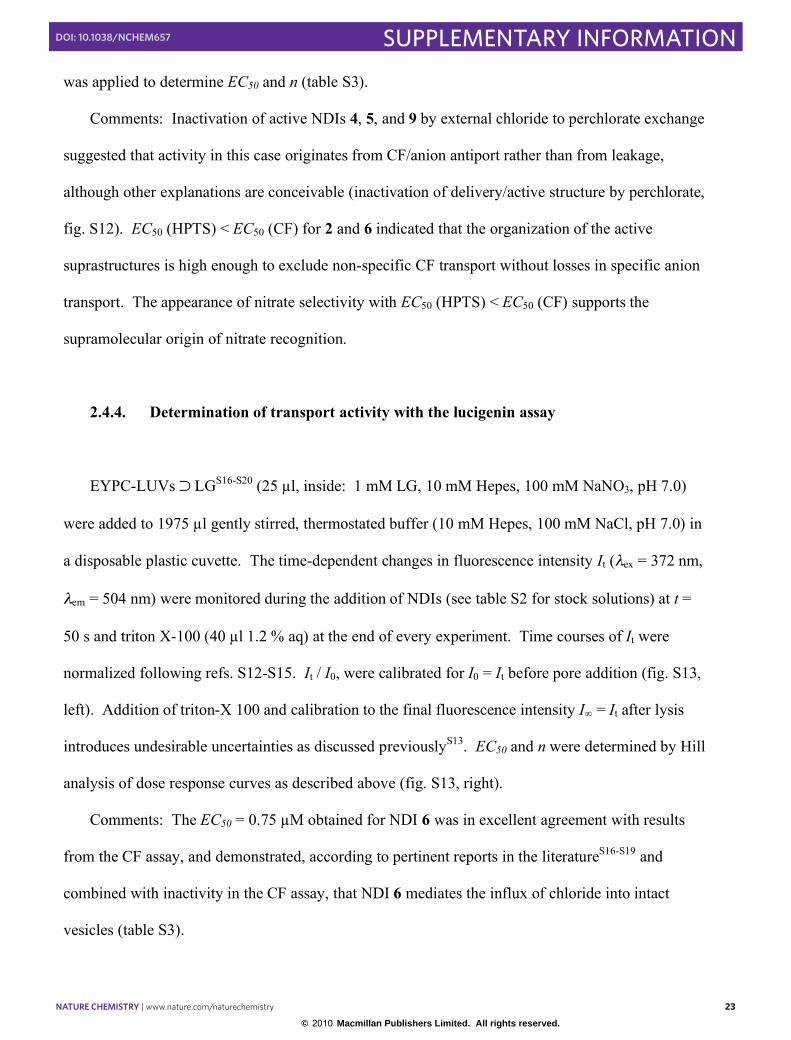
Fig. S4. ESI-MS of an equimolar solution of 3 and NEt4Cl.
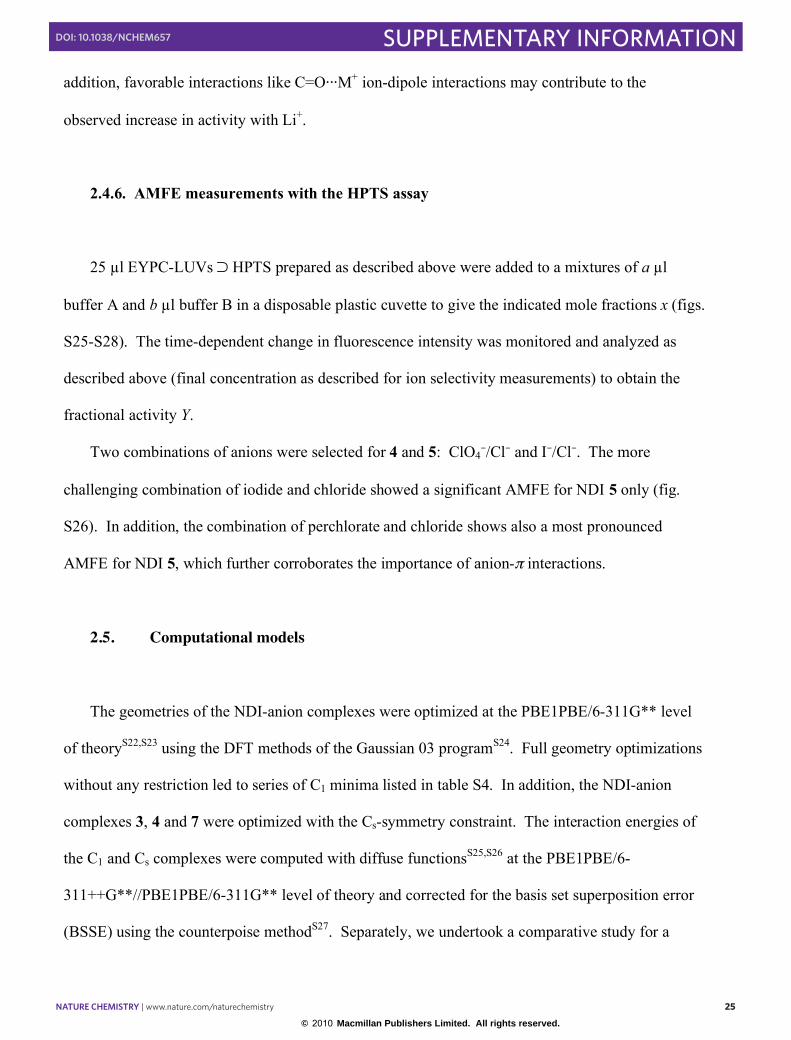
Fig. S5. ESI-MS of an equimolar solution of 8 and AgNO3. The silver salt is advantageous here,
because it helps to suppress signals that are caused by binding of background chloride.
nature chemistry | www.nature.com/naturechemistry 31
SUPPLEMENTARY INFORMATIONdoi: 10.1038/nchem657

© 2010 Macmillan Publishers Limited. All rights reserved.
S32
a
b
c
d
Fig. S6. Laser-induced fragmentation of mass selected 4+20+Cl- (a, b) and 5+20+Cl- (c, d). (a) The
heterodimer 4+20+Cl- after mass-selection. (b) IRMPD experiment for 4+20+Cl-. The somewhat
higher intensity of 20+Cl- indicates 20 to bind slightly better to the chloride ion than 4. (c) The
heterodimer 5+20+Cl- after mass-selection. (d) IRMPD experiment for 5+20+Cl-. No signal for 20+Cl-
is observed, indicating 5 to bind significantly better to the chloride ion than 20 and thus also 4.
Interestingly, the 5•- anion-radical is also formed. This points to the ability of 5 to even reduce the
chloride ion in the gas phase.
32 nature chemistry | www.nature.com/naturechemistry
SUPPLEMENTARY INFORMATION doi: 10.1038/nchem657

© 2010 Macmillan Publishers Limited. All rights reserved.
S33
Fig. S7. Laser-induced fragmentation of mass selected 5+6+Cl-. (a) The heterodimer after
mass-selection. (b) IRMPD experiment with 250 ms laser pulse. (c) IRMPD experiment with 500
ms laser pulse. Stronger signals for 6+Cl- than for 5+Cl- are observed, indicating 6 to bind better to
the chloride ion than 5.
nature chemistry | www.nature.com/naturechemistry 33
SUPPLEMENTARY INFORMATIONdoi: 10.1038/nchem657
© 2010 Macmillan Publishers Limited. All rights reserved.
S34
(nm)
500 600 700
0.05
0
Abs 0.1
0.15
0.2
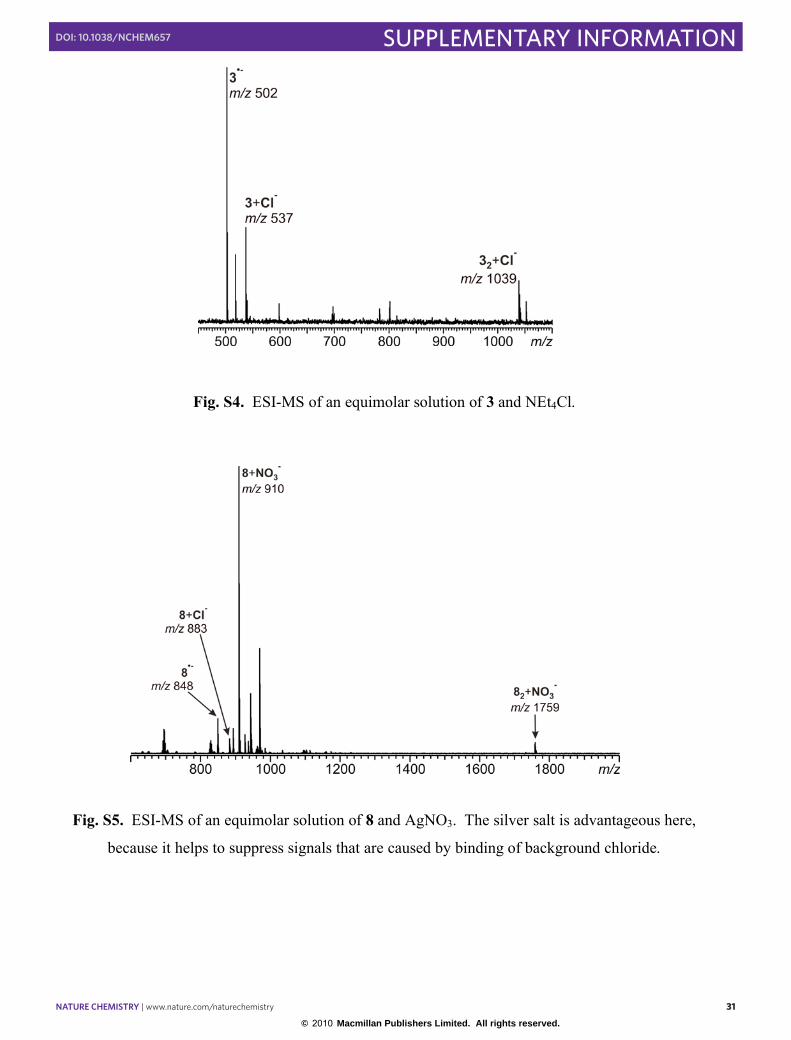
400
Fig. S8. Changes in UV-VIS absorption of a solution of 150 M NDI 5 in ACN/CHCl3 9:1
with varying amounts of TBABr (0-1 M).
(nm)
450 500 600 700
0.01
0
Abs
550 650
0.02
0.03
0.04
0.05
0.06
a)
b)c)
d)
Fig. S9. Solvent dependence of the charge transfer bands: Absorption spectra of NDI 3 (300
M) and TBAI (0.4 M, a, b) and TBABr (0.4 M, c, d) in THF / acetonitrile 82:18 (a), 92:8 (c) and
acetonitrile (b, d).
34 nature chemistry | www.nature.com/naturechemistry
SUPPLEMENTARY INFORMATION doi: 10.1038/nchem657

© 2010 Macmillan Publishers Limited. All rights reserved.
S35
1.5
(nm)
400 500 600 700
1.0
0.5
Abs
Fig. S10. Absorption spectrum of 150 M NDI 5 in ACN/CHCl3 9:1 with 0.5 M TBAI.
1.0
If
t (s)
0 50 100 150 200 250
0.8
0.6
0.4
0.2
300
0
NDI
base
gramicidin A
Fig. S11. Activity of NDI 5 in the HPTS assay. Ratiometric changes in fluorescence intensity
of HPTS ( ex,1 = 405 nm, ex,2 = 450 nm, em = 510 nm) are shown during the addition of base (5
mM NaOH) at 50 s, 5 (0.03 to 90 M final concentration) at 100 s and 1 M gramicidin A at 300 s
to EYPC-LUVs HPTS (1 mM HPTS, 10 mM Hepes, 100 mM NaCl, pH 7.0).
nature chemistry | www.nature.com/naturechemistry 35
SUPPLEMENTARY INFORMATIONdoi: 10.1038/nchem657

© 2010 Macmillan Publishers Limited. All rights reserved.
S36
1.0
If
t (s)
0 50 100 150 200 250
0.8
0.6
0.4
0.2
300
0
NDI
detergent
a)
b)
c)
d-f)
Fig. S12. Activity of NDIs 4 (b, e), 5 (a, d) and 9 (c, f) in the CF assay with external chloride
(a-c) and perchlorate (d-f). Changes in fluorescence intensity of CF ( ex = 492 nm, em = 517 nm)
are shown during the addition of NDIs (20 M final concentration) at 50 s and excess triton X-100
(40 l 1.2% aq) at 250 s to EYPC-LUVs CF (inside: 10 mM Hepes, 10 mM NaCl, 50 mM CF, pH
7.0; outside: 10 mM Hepes, NaCl (a-c) or NaClO4 (d-f), pH 7.0).
1.1
I /I0
t (s)
0 40 80 120 160 200
0.9
0.8
0.7
0.6
1.0
0.7
0.65
0.6
c (µM)
Y
1 10 100
0.75
0.10.010.001
EC50 = 750 nM
Fig. S13. Activity of NDI 6 in the LG assay. Changes in fluorescence intensity of LG ( ex =
372 nm, em = 504 nm) are shown after the addition of NDI 6 (20 l in DMSO) at 50 s and excess
triton X-100 (40 l 1.2% aq) at 250 s to EYPC-LUVs LG (1 mM lucigenin, 10 mM Hepes, 100
mM NaNO3, pH 7.0, in 10 mM Hepes, 100 mM NaCl, pH 7.0).
36 nature chemistry | www.nature.com/naturechemistry
SUPPLEMENTARY INFORMATION doi: 10.1038/nchem657

© 2010 Macmillan Publishers Limited. All rights reserved.
S37
Br-
I-
Cl-
F-
0.4
0.2
0.5
0.3
NO3-
0.7
0.8
0.6
SO42-
ClO4-OAc-
-500 -400 -300
Y
Ghyd (kJ/mol)
Li+
Na+K+
Rb+
Cs+
0.4
0.2
0.5
0.3
0.7
0.8
0.6
-500 -400 -300
Y
Ghyd (kJ/mol)
Fig. S14. Fractional activity of O-NDI rod 2 (constant concentration, adjusted to Y ~ 0.6 with NaCl)
in the HPTS assay in response to external cation exchange (left, MCl) and to external anion exchange
(right, NaX), with NDI addition after base pulse (fig. S11).
Br-
I-
Cl-
F-
0.4
0.2
0.5
0.3
NO3-
0.7
0.1
0.6
SO42-
ClO4-
OAc-
-500 -400 -300
Y
Ghyd (kJ/mol)
Li+
Na+ K+ Rb+
Cs+
-500 -400 -300
Ghyd (kJ/mol)
SCN-0.4
0.2
0.5
0.3
0.7
0.1
0.6
Y
Fig. S15. Fractional activity of NDI 3 (constant concentration at maximal Y ~ 0.3 with NaCl) in the
HPTS assay in response to external cation exchange (left, MCl) and to external anion exchange (right,
NaX), with NDI addition after ( , fig. S11) and before ( ) base pulse.
nature chemistry | www.nature.com/naturechemistry 37
SUPPLEMENTARY INFORMATIONdoi: 10.1038/nchem657

© 2010 Macmillan Publishers Limited. All rights reserved.
S38
Br-
I-
Cl-F-
0.4
0.2
0.5
0.3
NO3-
0.0
0.1
0.6
SO42-
ClO4-
OAc-
-500 -400 -300
Y
Ghyd (kJ/mol)
Li+
Na+ K+
Rb+Cs+
-500 -400 -300
Ghyd (kJ/mol)
SCN-0.4
0.2
0.5
0.3
0.0
0.1
0.6Y
Fig. S16. Fractional activity of NDI 4 (constant concentration adjusted to Y ~ 0.5 with NaCl) in the
HPTS assay in response to external cation exchange (left, MCl) and to external anion exchange (right,
NaX), with NDI addition after ( , fig. S11) and before ( ) base pulse.
Br-
I-
Cl-
F-0.4
0.2
0.5
0.3
NO3-
0.0
0.1
0.6
SO42-
ClO4-
OAc-
-500 -400 -300
Y
Ghyd (kJ/mol)
Li+
Na+ K+ Rb+
Cs+
-500 -400 -300
Ghyd (kJ/mol)
SCN-
0.4
0.2
0.5
0.3
0.0
0.1
0.6Y
Fig. S17. Fractional activity of NDI 5 (constant concentration adjusted to Y ~ 0.5 with NaCl) in the
HPTS assay in response to external cation exchange (left, MCl) and to external anion exchange (right,
NaX), with NDI addition after ( , fig. S11) and before ( ) base pulse.
38 nature chemistry | www.nature.com/naturechemistry
SUPPLEMENTARY INFORMATION doi: 10.1038/nchem657

© 2010 Macmillan Publishers Limited. All rights reserved.
S39
Br-
I-
Cl-
F-
0.4
0.2
0.5
0.3
NO3-
0.7
0.1
0.6
SO42-
ClO4-
OAc-
-500 -400 -300
Y
Ghyd (kJ/mol)
Li+ Na+K+
Rb+
Cs+
-500 -400 -300
Ghyd (kJ/mol)
0.4
0.2
0.5
0.3
0.0
0.1
0.6Y
Fig. S18. Fractional activity of NDI 6 (constant concentration adjusted to Y ~ 0.5 with NaCl) in the
HPTS assay in response to external cation exchange (left, MCl) and to external anion exchange (right,
NaX), with NDI addition after base pulse (fig. S11).
Br-Cl-
F-
0.4
0.2
0.5
0.3
NO3-
0.0
0.1
0.6
SO42-
OAc-
-500 -400 -300
Y
Ghyd (kJ/mol)
Li+
Na+ K+Rb+ Cs+
-500 -400 -300
Ghyd (kJ/mol)
0.4
0.2
0.5
0.3
0.0
0.1
0.6Y
SCN-
ClO4-
Fig. S19. Fractional activity of cyclic O-NDI 8 (constant concentration adjusted to the maximal
accessible Y ~ 0.2 with NaCl) in the HPTS assay in response to external cation exchange (left, MCl)
and to external anion exchange (right, NaX), with NDI addition after ( , fig. S11) and before ( )
base pulse.
nature chemistry | www.nature.com/naturechemistry 39
SUPPLEMENTARY INFORMATIONdoi: 10.1038/nchem657
© 2010 Macmillan Publishers Limited. All rights reserved.
S40
Br-Cl-F-
0.4
0.2
0.5
0.3
NO3-
0.0
0.1
0.6
SO42-
OAc-
-500 -400 -300
Y
Ghyd (kJ/mol)
Li+Na+ K+
Rb+ Cs+
-500 -400 -300
Ghyd (kJ/mol)
0.4
0.2
0.5
0.3
0.0
0.1
0.6Y
SCN-
ClO4-
I-
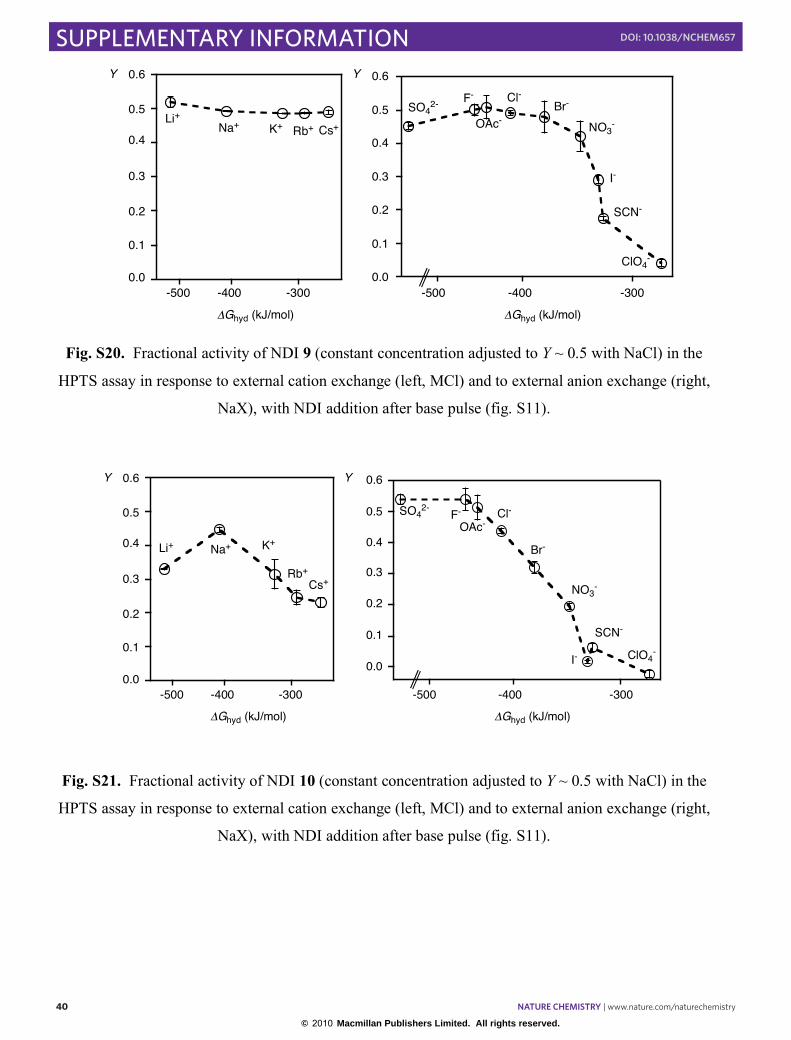
Fig. S20. Fractional activity of NDI 9 (constant concentration adjusted to Y ~ 0.5 with NaCl) in the
HPTS assay in response to external cation exchange (left, MCl) and to external anion exchange (right,
NaX), with NDI addition after base pulse (fig. S11).
Br-
Cl-F-
0.4
0.2
0.5
0.3
NO3-
0.0
0.1
0.6
SO42-
OAc-
-500 -400 -300
Y
Ghyd (kJ/mol)
Li+ Na+ K+
Rb+
Cs+
-500 -400 -300
Ghyd (kJ/mol)
0.4
0.2
0.5
0.3
0.0
0.1
0.6Y
SCN-
ClO4-
I-
Fig. S21. Fractional activity of NDI 10 (constant concentration adjusted to Y ~ 0.5 with NaCl) in the
HPTS assay in response to external cation exchange (left, MCl) and to external anion exchange (right,
NaX), with NDI addition after base pulse (fig. S11).
40 nature chemistry | www.nature.com/naturechemistry
SUPPLEMENTARY INFORMATION doi: 10.1038/nchem657

© 2010 Macmillan Publishers Limited. All rights reserved.
S41
Br-
Cl-
F-
0.4
0.2
0.5
0.3NO3
-
0.0
0.1
0.6
SO42-
OAc-
-500 -400 -300
Y
Ghyd (kJ/mol)
Li+ Na+
K+
Rb+
Cs+
-500 -400 -300
Ghyd (kJ/mol)
0.4
0.2
0.5
0.3
0.0
0.1
0.6Y
SCN-
ClO4-
I-
Fig. S22. Fractional activity of NDI 11 (constant concentration adjusted to Y ~ 0.5 with NaCl) in the
HPTS assay in response to external cation exchange (left, MCl) and to external anion exchange (right,
NaX), with NDI addition after base pulse (fig. S11).
Br-
Cl-
F-
0.4
0.2
0.5
0.3
NO3-
0.0
0.1
0.6
SO42-
OAc-
-500 -400 -300
Y
Ghyd (kJ/mol)
Li+ Na+ K+
Rb+
Cs+
-500 -400 -300
Ghyd (kJ/mol)
0.4
0.2
0.5
0.3
0.0
0.1
0.6Y
SCN-
ClO4-
I-
Fig. S23. Fractional activity of NDI 21 (constant concentration adjusted to Y ~ 0.4 with NaCl) in the
HPTS assay in response to external cation exchange (left, MCl) and to external anion exchange (right,
NaX), with NDI addition after base pulse (fig. S11).
nature chemistry | www.nature.com/naturechemistry 41
SUPPLEMENTARY INFORMATIONdoi: 10.1038/nchem657

© 2010 Macmillan Publishers Limited. All rights reserved.
S42
Br-
Cl-
F-
0.4
0.2
0.5
0.3
NO3-
0.0
0.1
SO42-
OAc-
-500 -400 -300
Y
Ghyd (kJ/mol)
Li+
Na+
K+ Rb+
Cs+
-500 -400 -300
Ghyd (kJ/mol)
0.4
0.2
0.5
0.3
0.0
0.1
0.6Y
SCN-
ClO4-
I-
Fig. S24. Fractional activity of NDI 22 (constant concentration adjusted to Y ~ 0.3 with NaCl) in the
HPTS assay in response to external cation exchange (left, MCl) and to external anion exchange (right,
NaX), with NDI addition after base pulse (fig. S11).
0.3
0.1
0.2
0.0
0 0.2 1
Y
[Cl] / ([Cl] + [ClO4])
0.4 0.6 0.8
0.4
0.36
0.32
0.38
0.34
0.28
0.30
0 0.2 1
Y
[Cl] / ([Cl] + [I])
0.4 0.6 0.8
0.40
Fig. S25. AMFE of NDI 4. Fractional activity of NDI 4 (constant concentration adjusted to Y ~ 0.4
with NaCl) in the HPTS assay in the presence of mixtures of external NaCl and NaI (left) and of
mixtures of external NaCl and NaClO4 (right), with NDI addition after base pulse (fig. S11).
42 nature chemistry | www.nature.com/naturechemistry
SUPPLEMENTARY INFORMATION doi: 10.1038/nchem657
© 2010 Macmillan Publishers Limited. All rights reserved.
S43
0.3
0.1
0.2
0 0.2 1
Y
[Cl] / ([Cl] + [ClO4])
0.4 0.6 0.8
0.4
0.35
0.25
0.40
0.30
0.20
0 0.2 1
Y
[Cl] / ([Cl] + [I])
0.4 0.6 0.8
0.45
Fig. S26. AMFE of NDI 5. Fractional activity of NDI 5 (constant concentration adjusted to Y ~ 0.4
with NaCl) in the HPTS assay in the presence of mixtures of external NaCl and NaI (left) and of
mixtures of external NaCl and NaClO4 (right), with NDI addition after base pulse (fig. S11).
0.3
0.1
0.2
0 0.2 1
Y
[Cl] / ([Cl] + [ClO4])
0.4 0.6 0.8
0.4
0.5
0.0
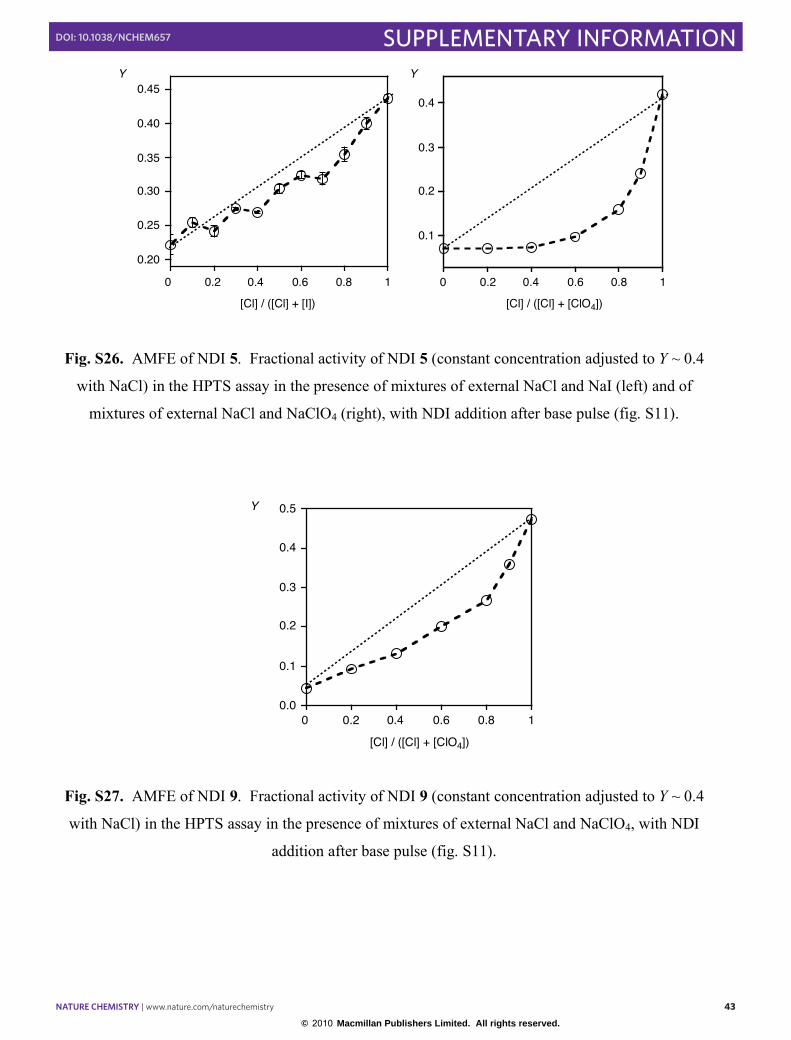
Fig. S27. AMFE of NDI 9. Fractional activity of NDI 9 (constant concentration adjusted to Y ~ 0.4
with NaCl) in the HPTS assay in the presence of mixtures of external NaCl and NaClO4, with NDI
addition after base pulse (fig. S11).
nature chemistry | www.nature.com/naturechemistry 43
SUPPLEMENTARY INFORMATIONdoi: 10.1038/nchem657

© 2010 Macmillan Publishers Limited. All rights reserved.
S44
0.3
0.1
0.2
0 0.2 1
Y
[Cl] / ([Cl] + [ClO4])
0.4 0.6 0.8
0.4
0.0
Fig. S28. AMFE of NDI 10. Fractional activity of NDI 10 (constant concentration adjusted to Y ~
0.4 with NaCl) in the HPTS assay in the presence of mixtures of external NaCl and NaClO4, with
NDI addition after base pulse (fig. S11).
44 nature chemistry | www.nature.com/naturechemistry
SUPPLEMENTARY INFORMATION doi: 10.1038/nchem657

© 2010 Macmillan Publishers Limited. All rights reserved.
S45
Fig. S29. PBE1PBE/6-311G** optimized structures (C1-symmetry) of anionic complexes 3–8
between NDI and chloride shown in top view of ball and stick (atom color coding, anion green)
representations together with the longitudinal displacement of anions (in Å).
3–Cl- 4–Cl-
5–Cl- 6–Cl-
7–Cl-
1.49 1.12
1.62 1.36
1.52 1.71
8–Cl-
nature chemistry | www.nature.com/naturechemistry 45
SUPPLEMENTARY INFORMATIONdoi: 10.1038/nchem657
© 2010 Macmillan Publishers Limited. All rights reserved.
S46
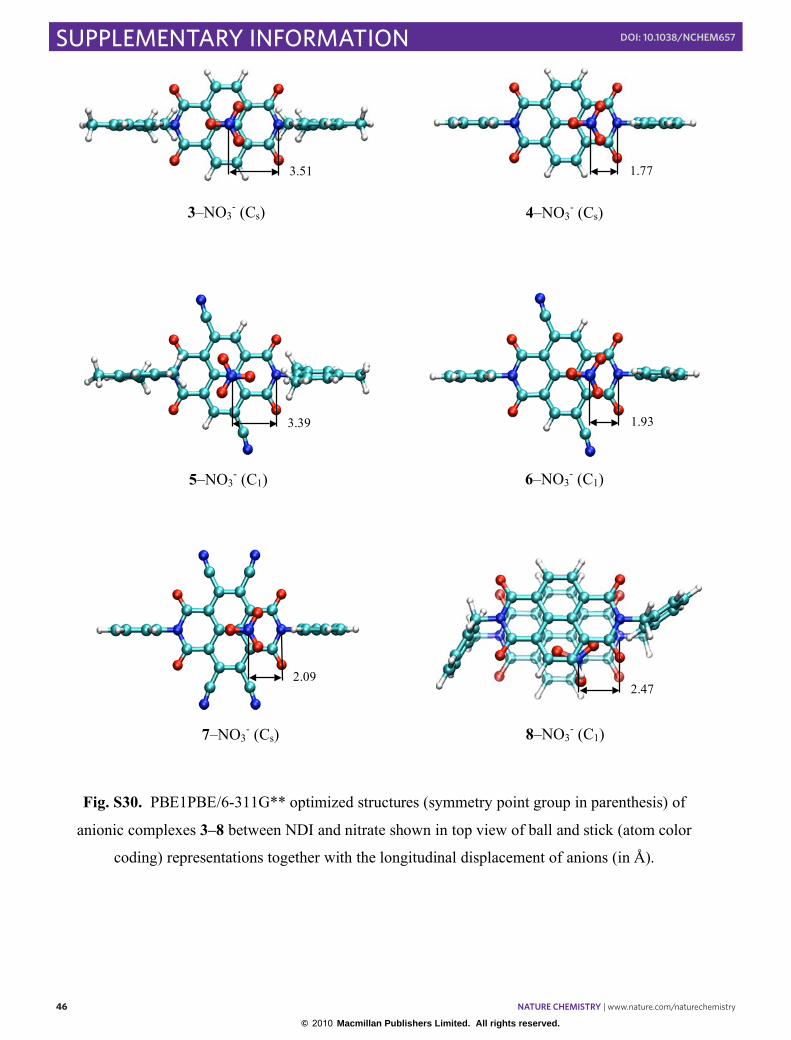
Fig. S30. PBE1PBE/6-311G** optimized structures (symmetry point group in parenthesis) of
anionic complexes 3–8 between NDI and nitrate shown in top view of ball and stick (atom color
coding) representations together with the longitudinal displacement of anions (in Å).
3–NO3- (Cs) 4–NO3
- (Cs)
5–NO3- (C1) 6–NO3
- (C1)
7–NO3- (Cs) 8–NO3
- (C1)
2.47
3.39 1.93
3.51 1.77
2.09
46 nature chemistry | www.nature.com/naturechemistry
SUPPLEMENTARY INFORMATION doi: 10.1038/nchem657

© 2010 Macmillan Publishers Limited. All rights reserved.
S47
4. Supplementary tables
Table S1. Anion binding to naphthalene diimide systems (X = no complex observed).
Anion NDI 3 NDI 8
1 Cl- 3+Cl- & 32+Cl- 8+Cl- & 82+Cl-
2 Br- 3+Br- & 32+Br- &3+Cl- & 32+Cl- 8+Br- & 82+Br-
3 I- X 8+I-
4 OTf- X 8+OTf-
5 H2PO4- X 8+H2PO4
-
6 BF4- X 8+BF4
- (very weak)
7 BPh4- - X
8 PF6- X X
9 CH3COO- X 8+CH3COO-
(very weak)
10 NO3- 3+NO3
- 8+NO3- & 82+NO3
-
11 MnO4- - X
12 ClO4- - 8+ClO4
-
13 SO42- - X
14 Cl- & I- - 8+Cl- & 8+I- (~ 10:1) (+82+Cl-)
nature chemistry | www.nature.com/naturechemistry 47
SUPPLEMENTARY INFORMATIONdoi: 10.1038/nchem657

© 2010 Macmillan Publishers Limited. All rights reserved.
S48
Table S2. Organic solvents used for membrane delivery.
NDI solvent injection volume ( l) precautions
1 3 DMSO 60 none
2 4 DMSO 20 none
3 5 DMF 60 stock solutions stored at 4 °C in the dark
4 6 DMF 20 stock solutions stored at 4 °C in the dark
5 2 DMSO 20 none
6 8 DMAc 60 stock solution was kept above 15 °C
7 9 DMSO 20 none
8 10 DMSOa 20 none
9 11 DMSOa 20 none aFor high concentrations the derivatization solution (containing ca. 3% 0.5 M NaCl) was injected
(cf. 2.1.4). Dilutions for the lower concentrations were made with neat DMSO.
48 nature chemistry | www.nature.com/naturechemistry
SUPPLEMENTARY INFORMATION doi: 10.1038/nchem657

© 2010 Macmillan Publishers Limited. All rights reserved.
S49
Table S3. Activity of NDI transporters in HPTS and CF assay.a
NDI EC50 (HPTS) ( M) n (HPTS) EC50 (CF) ( M) n (CF)
1 2 22 ± 2 1.5 ± 0.1 95 ± 8 1.2 ± 0.1
2 3 150 ± 20 1.0 ± 0.1 >100 n.a.
3 4 27 ± 1 1.2 ± 0.1 17 ± 2 1.6 ± 0.3
4 5 37 ± 2 0.72 ± 0.04 10 ± 1 1.6 ± 0.1
5 6 0.33 ± 0.03 1.0 ± 0.1 >100 n.a.
6 8 110 ± 20 0.49 ± 0.03 n.d. n.d.
7 9 32 ± 1 1.3 ± 0.1 8.0 ± 0.7 2.0 ± 0.3
8 10 7.8 ± 0.7 2.2 ± 0.3 4.5 ± 0.1 2.4 ± 0.1
9 11 8.7 ± 1.4 1.2 ± 0.1 8.2 ± 0.2 2.7 ± 0.2
10 18 n.a. n.a. n.a. n.a.
11 19 n.a. n.a. n.a. n.a.
12 20 n.a. n.a. n.a. n.a.
13 21 6.1 ± 0.3 1.8 ± 0.2 7.0 ± 0.3 2.4 ± 0.3
14 22 6.6 ± 0.2 2.6 ± 0.2 2.1 ± 0.1 4.0 ± 0.5
15 23 n.a. n.a. n.a. n.a.
aFor original data, see figs. S11 and S12, for structures, see figs. S1-S3. n.a.: Not applicable; data
not determinable, usually because precipitation after addition of more concentrated stock solutions
caused precipitation (3, 6, 18-20).
nature chemistry | www.nature.com/naturechemistry 49
SUPPLEMENTARY INFORMATIONdoi: 10.1038/nchem657

© 2010 Macmillan Publishers Limited. All rights reserved.
S50
Table S4. Energy and geometry data of NDI anion complexes computed at PBE1PBE/6-
311++G**//PBE1PBE/6-311G** level of theory.
Entry NDI Anion Symmetry Erel. a Eint.
b Rec dX
d dlong. e dtransv.f NIMEG g
1 3 Cl Cs 0.0 -76.2 2.98 3.50 1.71 0.00 N.A.
2 3 Cl C1 -3.8 -83.3 2.86 3.60 (2.53) 1.49 0.91 0
3 4 Cl Cs 0.0 -87.5 2.96 2.62 1.21 0.00 N.A. 4 4 Cl C1 -0.6 -92.1 2.85 2.65 1.12 0.93 0
5 5 Cl C1 -136.4 2.70 3.68 (2.63) 1.62 0.91 0
6 6 Cl C1 -142.7 2.63 2.84 1.36 0.94 0 7 7 Cl Cs 0.0 -169.9 2.71 2.90 1.50 0.00 N.A. 8 7 Cl C1 -6.6 -188.8 2.50 3.00 1.52 1.04 0
3.01 1.71 0.90 9 8 Cl C1 -121.0 3.02 2.48 1.75 0.86 0
10 3 Br Cs 0.0 -65.3 3.19 3.66 1.90 0.00 N.A.
11 3 Br C1 -2.0 -72.0 3.06 3.75 (2.69) 1.50 0.93 0
12 4 Br Cs 0.0 -76.2 3.14 2.77 1.27 0.00 N.A. 13 4 Br C1 -0.6 -79.9 3.05 2.79 1.18 0.88 0
14 5 Br C1 -123.1 2.88 3.82 (2.76) 1.70 0.88 0
15 6 Br C1 -129.8 2.80 2.96 1.40 0.89 0 16 7 Br Cs 0.0 -156.5 2.89 3.01 1.53 0.00 N.A. 17 7 Br C1 -6.0 -173.7 2.69 3.08 1.54 1.01 0
3.18 1.75 1.07 18 8 Br C1 -104.6 3.15 2.64 1.73 1.07 0
19 3 NO3 Cs 0.0 -69.5 2.97 4.39 3.51 0.00 N.A. 20 3 NO3 C1 +0.4 -69.9 2.97 4.41 3.43 0.02 0 21 4 NO3 Cs 0.0 -69.1 2.87 2.91 1.77 0.00 N.A. 22 4 NO3 C1 +0.3 -69.5 2.87 2.90 1.80 0.04 0 23 5 NO3 C1 -110.9 2.86 4.43 3.39 0.02 0 24 6 NO3 C1 -110.1 2.79 3.01 1.93 0.12 0 25 7 NO3 Cs 0.0 -144.0 2.74 3.07 2.09 0.00 N.A. 26 7 NO3 C1 +0.5 -143.6 2.74 3.09 2.08 0.06 0
2.93 2.47 1.45 27 8 NO3 C1 -95.4 2.93 3.31 2.48 1.42 0
aRelative energy of the C1-symmetry complex compare to the associate CS complex in kJ/mol. bInteraction energy in kJ/mol with BSSE correction for NDI anion complexes computed with the
PBE1PBE/6-311++G** method on PBE1PBE/6-311G** optimized geometries. cEquilibrium
distance between anion and NDI plane in Å. dDistance between anion (nitrogen atom for nitrate) and
carbon in mesityl substituted NDI or hydrogen in phenyl substituted NDI in Å. Value in parenthesis
50 nature chemistry | www.nature.com/naturechemistry
SUPPLEMENTARY INFORMATION doi: 10.1038/nchem657

© 2010 Macmillan Publishers Limited. All rights reserved.
S51
refer to the distance between anion and hydrogen in mesityl substituted NDI. eLongitudinal
displacement of the anion relative to the nitrogen atom of the imide function in Å. fTransversal
displacement of the anion relative to the center of the NDI in Å. gNumber of imaginary eigenvalue
calculated at the PBE1PBE/6-311G** level.
nature chemistry | www.nature.com/naturechemistry 51
SUPPLEMENTARY INFORMATIONdoi: 10.1038/nchem657

© 2010 Macmillan Publishers Limited. All rights reserved.
S52
5. Supplementary references
S1. (a) Gorteau, V., Julliard, M. D. & Matile, S. J. Membr. Sci. 321, 37-42 (2008). (b)
Gorteau, V., Bollot, G., Mareda, J. & Matile, S. Org. Biomol. Chem. 5, 3000-3012 (2007).
(c) Gorteau, V., Bollot, G., Mareda, J., Perez-Velasco, A. & Matile, S. J. Am. Chem. Soc.
128, 14788-14789 (2006).
S2. Perez-Velasco, A., Gorteau, V. & Matile, S. Angew. Chem. Int. Ed. 47, 921-923 (2008).
S3. Kishore, R. S. K., Ravikumar, V., Bernardinelli, G., Sakai, N. & Matile, S. J. Org. Chem.
73, 738 (2008).
S4. Chernick, E. T., Ahrens, M. J., Scheidt, K. A. & Wasielewski, M. R. J. Org. Chem. 70,
1486 (2005).
S5. Gabutti, S., Knutzen, M., Neuburger, M., Schull, G., Berndt, R. & Mayor, M. Chem.
Commun. 2370-2372 (2008).
S6. Kogej, M. & Schalley, C. A. Mass spectrometry and gas phase chemistry of
supramolecules. In Analytical Methods in Supramolecular Chemistry, Schalley, C. A., Ed.;
Wiley, Weinheim, 2007, 104-162.
S7. Cooks, R. G., Patrick, J. S., Kotiaho, T. & McLuckey, S. A. Mass Spectrom. Rev. 13, 287-
339 (1994).
S8. Rosokha, Y. S., Lindeman, S. V., Rosokha, S. V. & Kochi, J. K. Angew. Chem. Int. Ed. 43,
4650-4652 (2004).
S9. Jones, B. A., Facchetti, A., Marks, T. J. & Wasielewski, M. R. Chem. Mater. 19, 2703-
2705 (2007).
S10. Hirose, K. Determination of binding constants. In Analytical Methods in Supramolecular
Chemistry, Schalley, C. A., Ed.; Wiley, Weinheim, 2007, p 33f.
S11. Reichardt, C. Solvents and Solvent Effects in Organic Chemistry; Wiley-VCH, Weinheim,
2002.
S12. Sun, D., Rosokha, S. V. & Kochi, J. K. J. Phys. Chem. B 111, 6655-6666 (2007).
S13. Butler, A. R. J. Chem. Soc., Perkin I 1975, 1557-1558 (1975).
S14. Matile, S. & Sakai, N. The characterization of synthetic ion channels and pores. In
Analytical Methods in Supramolecular Chemistry, Schalley, C. A., Ed.; Wiley, Weinheim,
2007, 391-418.
52 nature chemistry | www.nature.com/naturechemistry
SUPPLEMENTARY INFORMATION doi: 10.1038/nchem657

© 2010 Macmillan Publishers Limited. All rights reserved.
S53
S15. Hennig, A., Gabriel, G. J., Tew, G. N. & Matile, S. J. Am. Chem. Soc. 130, 10338-10344
(2008).
S16. McNally, B. A., O'Neil, E. J., Nguyen, A. & Smith, B. D. J. Am. Chem. Soc. 130, 17274-
17275 (2008).
S17. McNally, B. A., Koulov, A. V., Smith, B. D., Joos, J.-B. & Davis, A. P. Chem. Commun.
1087-1089 (2005).
S18. Seganish, J. L. & Davis, J. T. Chem. Commun. 5781-5783 (2005).
S19. Seganish, J. L., Santacroce, P. V., Salimian, K. J., Fettinger, J. C., Zavalij, P. & Davis, J. T.
Angew. Chem. Int. Ed. 45, 3334-3338 (2006).
S20. Smith, D. W. J. Chem. Educ. 54, 540-542 (1977).
S21. Clarke, R. J. & Lüpfert, C. Biophys. J. 76, 2614-2624 (1999).
S22. Perdew, J. P., Burke, K. & Ernzerhof, M. Phys. Rev. Lett. 77, 3865-3868 (1996).
S23. Ernzerhof, M. & Scuseria, G. E. J. Chem. Phys. 110, 5029-5036 (1999).
S24. Frisch, M. J., Trucks, G. W., Schlegel, H. B., Scuseria, G. E., Robb, M. A., Cheeseman, J.
R., Montgomery, Jr., J. A., Vreven, T., Kudin, K. N., Burant, J. C., Millam, J. M., Iyengar,
S. S., Tomasi, J., Barone, V., Mennucci, B., Cossi, M., Scalmani, G., Rega, N., Petersson,
G. A., Nakatsuji, H., Hada, M., Ehara, M., Toyota, K., Fukuda, R., Hasegawa, J., Ishida,
M., Nakajima, T., Honda, Y., Kitao, O., Nakai, H., Klene, M., Li, X., Knox, J. E.,
Hratchian, H. P., Cross, J. B., Bakken, V., Adamo, C., Jaramillo, J., Gomperts, R.,
Stratmann, R. E., Yazyev, O., Austin, A. J., Cammi, R., Pomelli, C., Ochterski, J. W.,
Ayala, P. Y., Morokuma, K., Voth, G. A., Salvador, P., Dannenberg, J. J., Zakrzewski, V.
G., Dapprich, S., Daniels, A. D., Strain, M. C., Farkas, O., Malick, D. K., Rabuck, A. D.,
Raghavachari, K., Foresman, J. B., Ortiz, J. V., Cui, Q., Baboul, A. G., Clifford, S.,
Cioslowski, J., Stefanov, B. B., Liu, G., Liashenko, A., Piskorz, P., Komaromi, I., Martin,
R. L., Fox, D. J., Keith, T., Al-Laham, M. A., Peng, C. Y., Nanayakkara, A., Challacombe,
M., Gill, P. M. W., Johnson, B., Chen, W., Wong, M. W., Gonzalez, C. & Pople, J. A.
Gaussian 03, Revision C.02, Gaussian, Inc., Wallingford CT (2004).
S25. Clark, T., Chandrasekhar, J., Spitznagel, G. W. & Schleyer, P. v. R. J. Comp. Chem. 4,
294-301 (1983).
S26. Frisch, M. J., Pople, J. A. & Binkley, J. S. J. Chem. Phys. 80, 3265-3269 (1984).
S27. Boys, S. F. & Bernardi, F. Mol. Phys. 19, 553-566 (1970).
S28. Hobza, P. & Havlas, Z. Chem. Rev. 100, 4253–4264 (2000).
nature chemistry | www.nature.com/naturechemistry 53
SUPPLEMENTARY INFORMATIONdoi: 10.1038/nchem657

© 2010 Macmillan Publishers Limited. All rights reserved.
S54
S29. Kryachko, E. S. & Zeegers-Huyskens, T. J. Phys. Chem. A 106, 6832–6838. (2002).
54 nature chemistry | www.nature.com/naturechemistry
SUPPLEMENTARY INFORMATION doi: 10.1038/nchem657