experimental evaluation of the performance of available backover
TRANSCRIPT

U.S. Department of Transportation National Highway Traffic Safety Administration
DOT HS 810 634 September 2006 Experimental Evaluation of the Performance of Available Backover Prevention Technologies This document is available to the public from the National Technical Information Service, Springfield, Virginia 22161.

ii
DISCLAIMER
This publication is distributed by the U.S. Department of Transportation, National Highway
Traffic Safety Administration, in the interest of information exchange. The opinions,
findings, and conclusions expressed in this publication are those of the author(s) and not
necessarily those of the Department of Transportation or the National Highway Traffic
Safety Administration. The United States Government assumes no liability for its contents
or use thereof. If trade or manufacturers’ names or products are mentioned, it is because
they are considered essential to the object of the publication and should not be construed
as an endorsement. The United States Government does not endorse products or
manufacturers.
iii
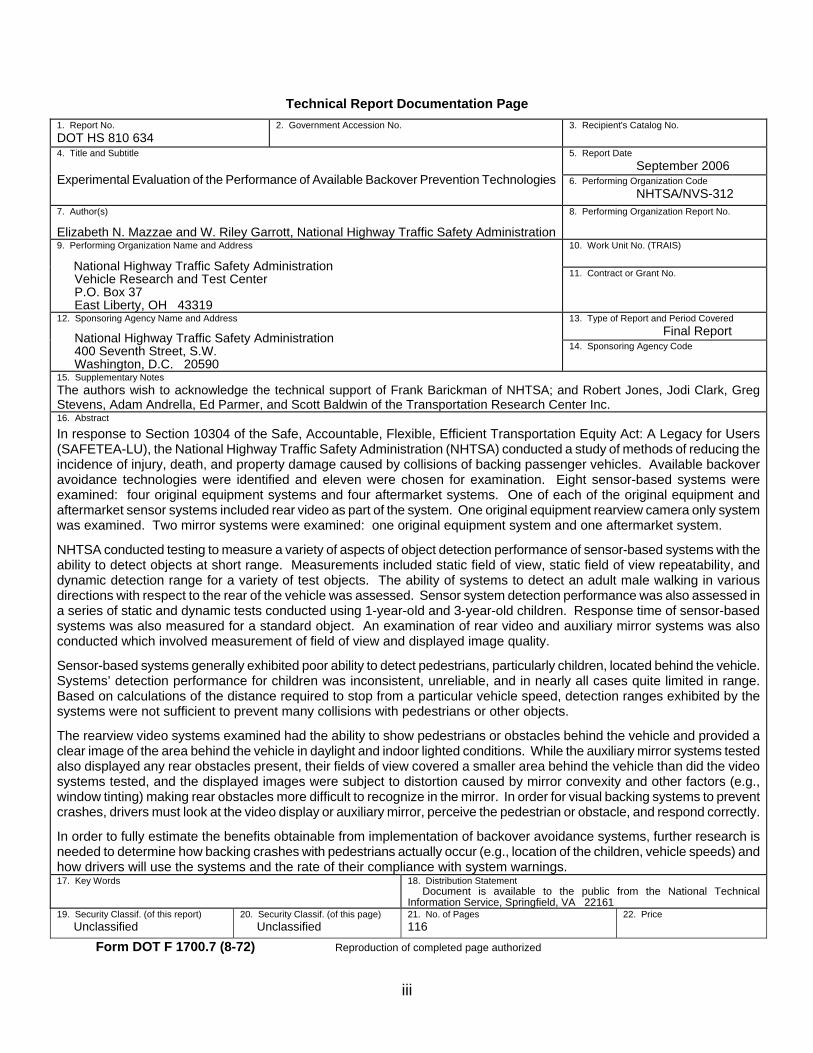
Technical Report Documentation Page 1. Report No. DOT HS 810 634
2. Government Accession No. 3. Recipient's Catalog No.
5. Report Date September 2006
4. Title and Subtitle Experimental Evaluation of the Performance of Available Backover Prevention Technologies
6. Performing Organization Code NHTSA/NVS-312
7. Author(s) Elizabeth N. Mazzae and W. Riley Garrott, National Highway Traffic Safety Administration
8. Performing Organization Report No.
10. Work Unit No. (TRAIS) 9. Performing Organization Name and Address National Highway Traffic Safety Administration Vehicle Research and Test Center P.O. Box 37 East Liberty, OH 43319
11. Contract or Grant No.
13. Type of Report and Period Covered Final Report
12. Sponsoring Agency Name and Address National Highway Traffic Safety Administration 400 Seventh Street, S.W. Washington, D.C. 20590
14. Sponsoring Agency Code
15. Supplementary Notes The authors wish to acknowledge the technical support of Frank Barickman of NHTSA; and Robert Jones, Jodi Clark, Greg Stevens, Adam Andrella, Ed Parmer, and Scott Baldwin of the Transportation Research Center Inc. 16. Abstract
In response to Section 10304 of the Safe, Accountable, Flexible, Efficient Transportation Equity Act: A Legacy for Users (SAFETEA-LU), the National Highway Traffic Safety Administration (NHTSA) conducted a study of methods of reducing the incidence of injury, death, and property damage caused by collisions of backing passenger vehicles. Available backover avoidance technologies were identified and eleven were chosen for examination. Eight sensor-based systems were examined: four original equipment systems and four aftermarket systems. One of each of the original equipment and aftermarket sensor systems included rear video as part of the system. One original equipment rearview camera only system was examined. Two mirror systems were examined: one original equipment system and one aftermarket system.
NHTSA conducted testing to measure a variety of aspects of object detection performance of sensor-based systems with the ability to detect objects at short range. Measurements included static field of view, static field of view repeatability, and dynamic detection range for a variety of test objects. The ability of systems to detect an adult male walking in various directions with respect to the rear of the vehicle was assessed. Sensor system detection performance was also assessed in a series of static and dynamic tests conducted using 1-year-old and 3-year-old children. Response time of sensor-based systems was also measured for a standard object. An examination of rear video and auxiliary mirror systems was also conducted which involved measurement of field of view and displayed image quality.
Sensor-based systems generally exhibited poor ability to detect pedestrians, particularly children, located behind the vehicle. Systems’ detection performance for children was inconsistent, unreliable, and in nearly all cases quite limited in range. Based on calculations of the distance required to stop from a particular vehicle speed, detection ranges exhibited by the systems were not sufficient to prevent many collisions with pedestrians or other objects.
The rearview video systems examined had the ability to show pedestrians or obstacles behind the vehicle and provided a clear image of the area behind the vehicle in daylight and indoor lighted conditions. While the auxiliary mirror systems tested also displayed any rear obstacles present, their fields of view covered a smaller area behind the vehicle than did the video systems tested, and the displayed images were subject to distortion caused by mirror convexity and other factors (e.g., window tinting) making rear obstacles more difficult to recognize in the mirror. In order for visual backing systems to prevent crashes, drivers must look at the video display or auxiliary mirror, perceive the pedestrian or obstacle, and respond correctly.
In order to fully estimate the benefits obtainable from implementation of backover avoidance systems, further research is needed to determine how backing crashes with pedestrians actually occur (e.g., location of the children, vehicle speeds) and how drivers will use the systems and the rate of their compliance with system warnings. 17. Key Words
18. Distribution Statement Document is available to the public from the National Technical Information Service, Springfield, VA 22161
19. Security Classif. (of this report) Unclassified
20. Security Classif. (of this page) Unclassified
21. No. of Pages 116
22. Price
Form DOT F 1700.7 (8-72) Reproduction of completed page authorized
iv
TABLE OF CONTENTS
EXECUTIVE SUMMARY .................................................................................................................. 1
1.0 INTRODUCTION................................................................................................................... 8 1.1. Objectives .............................................................................................................................. 8 1.2. Prior NHTSA Backover Avoidance System Research ........................................................... 9
2.0 AVAILABLE VEHICLE-BASED BACKING CRASH COUNTERMEASURE TECHNOLOGIES................................................................................................................ 12
2.1. Description of Technologies for Aiding Drivers in Detecting Rear Obstacles ...................... 12 2.2. Installation Issues ................................................................................................................ 17 2.3. Systems Tested ................................................................................................................... 17
3.0 METHOD............................................................................................................................. 29 3.1. Test Objects......................................................................................................................... 29 3.2. Test Grid .............................................................................................................................. 32 3.3. Apparatus for Controlled-Speed Dynamic Testing............................................................... 33 3.4. Apparatus for Sensor System Response Time Testing ....................................................... 33 3.5. Instrumentation .................................................................................................................... 34 3.6. Vehicle Preparation Procedure ............................................................................................ 35
4.0 SYSTEM TESTING AND RESULTS................................................................................... 36 4.1. Static Tests .......................................................................................................................... 36 4.2. Dynamic Tests ..................................................................................................................... 66 4.3. System Response Time....................................................................................................... 74 4.4. Video System Viewable Area............................................................................................... 75 4.5. Auxiliary Mirrors Viewable Area ........................................................................................... 78 4.6. Vehicle Rear Visibility .......................................................................................................... 81
5.0 DISCUSSION...................................................................................................................... 83 5.1. Coverage Comparison ......................................................................................................... 85 5.2. Adequacy of Sensor System Detection Ranges .................................................................. 92 5.3. Factors Affecting System Performance ............................................................................... 96 5.4. Drivers’ Compliance with Warnings ..................................................................................... 97
6.0 FINDINGS ......................................................................................................................... 100
7.0 NHTSA’s FUTURE PLANS FOR BACKOVER PREVENTION RESEARCH .................... 104
8.0 REFERENCES.................................................................................................................. 105
9.0 Appendix A: Video Clips Documenting Trials of Interest.................................................. 107
v
LIST OF FIGURES
Figure 1. Steps to detecting and avoiding rear objects as a function of system type.................13
Figure 2. Example of an ultrasonic sensor .................................................................................14
Figure 3. Example of a radar sensor ..........................................................................................15
Figure 4. BMW 330i sensor locations and graphical display......................................................20
Figure 5. Nissan Quest sensor locations....................................................................................21
Figure 6. Poron sensors and LED distance visual display .........................................................22
Figure 7. Guardian Alert sensors and visual display ..................................................................23
Figure 8. Lincoln Navigator sensor locations .............................................................................24
Figure 9. Cadillac Escalade sensor and camera locations and visual displays .........................25
Figure 10. Audiovox system sensor and camera locations and rearview mirror video display ....26
Figure 11. Infiniti FX35 camera location and video display ..........................................................27
Figure 12. Rear pillar mirrors on Toyota 4Runner (photo from Toyota web site) .........................28
Figure 13. ScopeOut mirror system (SUV version) ......................................................................28
Figure 14. ISO Pole behind the Nissan Quest test vehicle. .........................................................30
Figure 15. Photographs of ATDs used in testing..........................................................................31
Figure 16. Hoist and boom apparatus with 3-year-old ATD on indoor test grid ...........................32
Figure 17. Pulley system used for controlled speed dynamic tests..............................................33
Figure 18. Response time fixture (down) .....................................................................................34
Figure 19. Response time fixture (deployed) ...............................................................................34
Figure 20. Sensor system object detection performance results: 12-inch traffic cone .................38
Figure 21. Sensor system object detection performance results: 18-inch traffic cone .................40
Figure 22. Sensor system object detection performance results: 28-inch traffic cone .................42
Figure 23. Sensor system object detection performance results: 36-inch traffic cone .................44
Figure 24. Sensor system object detection performance results: 20-inch PVC pole ...................46
Figure 25. Sensor system object detection performance results: 40-inch PVC pole ...................48
Figure 26. Sensor system object detection performance results: 1-year-old ATD .......................50
Figure 27. Sensor system object detection performance results: 3-year-old ATD .......................52
Figure 28. Sensor system object detection performance results: 1-year-old child.......................54
Figure 29. Sensor system object detection performance results: 3-year-old child.......................56
Figure 30. Sensor system object detection performance results: adult male standing- indoors ..58

vi
Figure 31. Sensor system object detection performance results: adult male standing - outdoors59
Figure 32. Sensor system detection results for the adult male laying on the ground...................61
Figure 33. Sensor system detection zone repeatability: BMW 330i results .................................62
Figure 34. Sensor system detection zone repeatability: Escalade results ...................................63
Figure 35. Sensor system detection zone repeatability: Navigator results...................................63
Figure 36. Sensor system detection zone repeatability: Quest results ........................................63
Figure 37. Sensor system detection zone repeatability: Audiovox results ...................................64
Figure 38. Sensor system detection zone height results..............................................................65
Figure 39. Numbered walking paths for “Adult Waking Diagonally” Trials ...................................70
Figure 40. Photograph of toy car outdoor dynamic test trial.........................................................71
Figure 41. Photograph of car backing to a car scenario...............................................................73
Figure 42. Video System Field of View: Cadillac Escalade..........................................................76
Figure 43. Video System Field of View: Infiniti FX35 ...................................................................76
Figure 44. 3-year-old ATD at 2 feet from rear bumper as displayed by Cadillac Escalade (left) and Infiniti FX35 (right) rear video systems. ..................................................................77
Figure 45. 3-year-old ATD at 10 feet from rear bumper as displayed by Cadillac Escalade (left) and Infiniti FX35 (right) rear video systems. ..................................................................77
Figure 46. Locations at which a 28-inch cone is visible to a 5 foot 6 inch-tall driver using noted mirror systems. .................................................................................................................79
Figure 47. Locations at which a 36-inch cone is visible to a 6 foot 1 inch-tall driver using noted mirror systems. .................................................................................................................79
Figure 48. Locations at which a 28-inch cone is visible to a 5 feet 10 inch tall driver and a 4 feet 10 inch tall driver using Toyota 4Runner rear pillar mirrors.........................................80
Figure 49. Crash Avoidance Scenario Steps Timeline for Sensor-Based Systems ....................84
Figure 50. Crash Avoidance Scenario Steps Timeline for Video-Based Systems .......................84
Figure 51. System coverage areas and non-visible areas (via direct glance or center rearview mirror) for 28-inch-tall traffic cone (2007 Cadillac Escalade) .................................86
Figure 52. System coverage areas and non-visible areas (via direct glance or center rearview mirror) for 28-inch-tall traffic cone (2006 BMW 330i).............................................87
Figure 53. System coverage areas and non-visible areas (via direct glance or center rearview mirror) for 28-inch-tall traffic cone (2005 Nissan Quest) ........................................88
Figure 54. System coverage areas and non-visible areas (via direct glance or center rearview mirror) for 28-inch-tall traffic cone (2005 Lincoln Navigator) ..................................89
Figure 55. System coverage areas and non-visible areas (via direct glance or center rearview mirror) for 28-inch-tall traffic cone (2005 Infiniti FX35) ...........................................90

vii
Figure 56. Cross-View mirror coverage areas (for 10 foot by 10 foot area behind vehicle) and non-visible areas (via direct glance or center rearview mirror) for 28-inch-tall traffic cone (2003 Toyota 4Runner) ..........................................................................................91

viii
LIST OF TABLES
Table 1. Backover Avoidance Systems/Test Vehicles ..............................................................19
Table 2. Sensor Test Objects and Test Type – Indoor Testing.................................................29
Table 3. Sensor Test Objects and Test Type – Outdoor Testing..............................................30
Table 4. ATD Weight and Height Information ...........................................................................31
Table 5. Coding Scheme for Static Sensor System Detection Zone Area Data Plots. .............37
Table 6. Sensor System Detection Range (ft) – Dynamic: Non-Human Test Objects ..............67
Table 7. Sensor System Detection Range (ft) – Dynamic: Human Subjects ...........................68
Table 8. Sensor System Detection Area Width for Adult Walking Longitudinally......................69
Table 9. Sensor System Detection Range (ft) – Dynamic Toy Car Trials .................................72
Table 10. Sensor System Detection Range – Outdoor Tests with Vehicle Moving ....................74
Table 11. Sensor System Response Time Results.....................................................................75
Table 12. Sight Distance: 28-inch cone for 5’10” Driver (ft) ........................................................82
Table 13. Sight Distance: 28-inch cone for 4’10” Driver (ft) ........................................................82
Table 14. Distance in Which Drivers Could Brake To A Stop in Response to Backing System Warning ..................................................................................................................93
Table 15. Maximum Speeds For Braking To A Stop – 3-year-old Child .....................................94
Table 16. Maximum Speeds For Braking To A Stop – 40-Inch ISO Pole ...................................94
Table 17. Natural Backing Speeds For Selected Vehicles..........................................................95

1
EXECUTIVE SUMMARY
Backover crashes, in which people or objects are struck by a vehicle in the act of backing up, are a tragic problem. Frequently, the victims of backing crashes are young children. Backover crashes are not usually counted in databases of the National Highway Traffic Safety Administration (NHTSA) because they most commonly occur in private drives and parking lots rather than on a roadway.
Section 10304 of the Safe, Accountable, Flexible, Efficient Transportation Equity Act: A Legacy for Users (SAFETEA-LU) directed NHTSA to do the following:
1. Conduct a study of effective methods of reducing the incidence of injury and death outside of backing passenger vehicles
2. Identify, evaluate, and compare the available backover avoidance technologies for detecting people or objects behind a passenger vehicle for their accuracy, effectiveness, cost, and feasibility for installation
3. Estimate the cost savings that would result from widespread use of backover prevention devices (injuries, fatalities, vehicle and property damage)
The Senate Appropriations Report No. 109-109 requested a similar report with additional requirements to identify methods to quantify the backover safety problem and to consumer information and education in relation to the backover safety problem.
The research described in this report was performed to address the second of the SAFETEA-LU requirements listed above. By identifying and assessing existing backover avoidance technologies, NHTSA could determine whether current systems are effective in reducing backover crashes (thus addressing the first requirement). The research data generated will assist NHTSA in performing the third requirement, e.g., estimating the cost savings that would result from widespread use of backover prevention devices.
Evaluation of Systems
Information was gathered regarding available technologies for notifying drivers of the presence of objects located behind the vehicle at short range. Technologies with the ability to detect and/or display images of obstacles behind the vehicle were identified to include electronic sensor systems based on ultrasonic and radar technology, rearview video systems, and auxiliary mirror systems. Systems were chosen for evaluation to provide a representative sample of each type of technology. To the extent possible, given time and available funding, systems from different automotive manufacturers were included to provide a balance of brands as well as to observe any differences that might be present in terms of how different manufacturers implement a particular sensor technology (e.g., ultrasonic). Similar vehicle types (namely, SUV and minivan) were sought to provide some consistency of platform allowing for isolation of system and sensor performance factors. A set of vehicles meeting these criteria was identified. Suitable vehicles present in NHTSA’s existing fleet were chosen first. To complete the set, two vehicles equipped with unique

2
backing systems were acquired (one purchased, one leased) for testing. The resulting set of eleven systems selected for examination included:
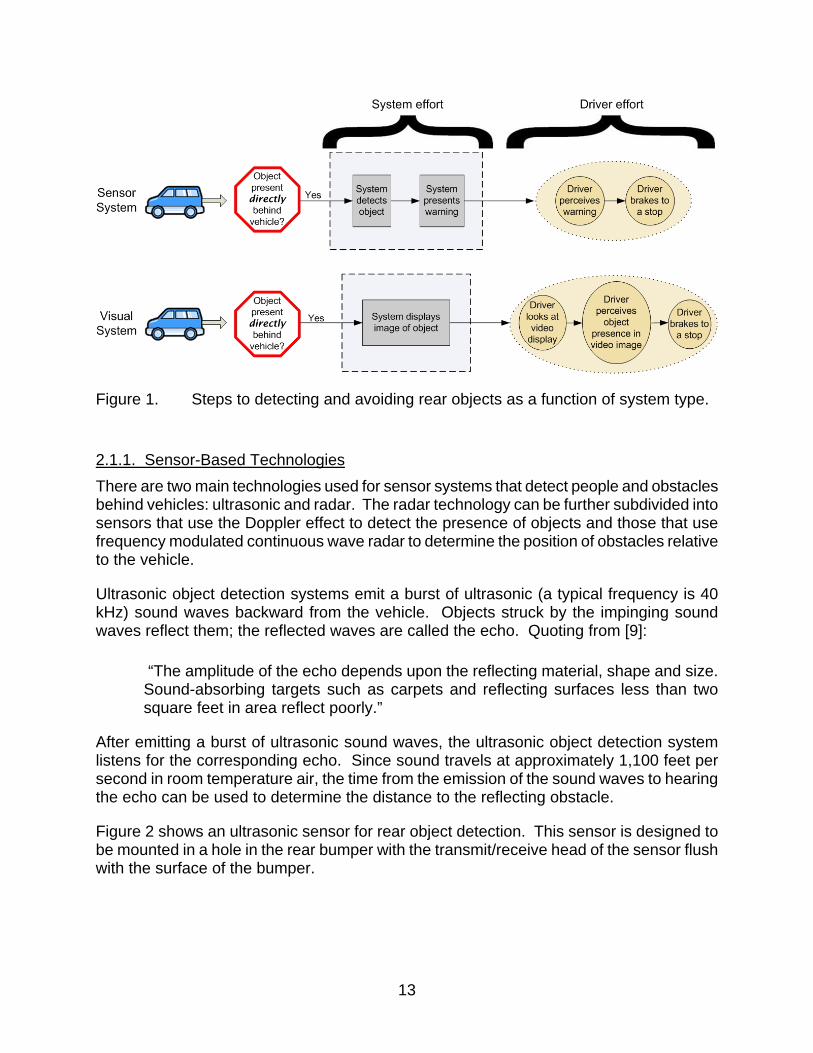
• Eight sensor-based systems: o Four original equipment (OE) “parking aid” systems (one included rearview
video) o Four aftermarket systems (one included rearview video)
• Three visual-only systems: o One rearview video (“RearView Monitor”) OE system o One OE auxiliary mirror system o One aftermarket auxiliary mirror system
In surveying the various technologies available, it was noted that all systems offered by original equipment (OE) manufacturers were advertised as “parking aids” rather than safety systems, while aftermarket systems were marketed as safety systems with the ability to warn drivers of children present behind backing vehicles. While the OE parking aid systems do not purport to detect pedestrians, they were still included in this testing to fully address the congressional directive that asked for an examination of “available technologies for detecting people or objects behind a motor vehicle.” Furthermore, examining available parking aids allows NHTSA to inform consumers about their capabilities and permits comparison of their performance with aftermarket systems utilizing similar technology.
A variety of “test objects” were used to measure the detection capabilities of sensor-based parking aid and backover avoidance systems. Objects included: 1-year-old and 3-year-old children, an adult male, 1 and 3-year-old crash test dummies (clothed like real children), a PVC pole specified by the International Standards Organization in their standard ISO 17386, and various sizes of traffic cones. Static tests consisted of placing objects in various locations behind the vehicle and recording the response of the system. The area over which a system could detect objects is referred to as its “detection zone.” Measurements included static detection zone, detection repeatability, dynamic detection range with a subset of test objects, and response time. Dynamic tests also included those in which the child subjects walked, ran, or rode toys behind the stationary, secured vehicles.
Sensor-Based System (including “Parking Aid”) Findings
Findings relating to the eight sensor-based systems examined include:
• Sensor-based systems generally exhibited poor ability to detect pedestrians, particularly children, located behind the vehicle. Systems’ detection performance for children was inconsistent, unreliable, and in nearly all cases quite limited in range. Testing showed that, in most cases, the detection zones of sensor-based systems contained a number of “holes” in which a standing child was not detected. The size
3
of the pedestrian did seem to affect detection performance, as adults elicited better detection response from the sensor systems than did 1 or 3-year-old children.
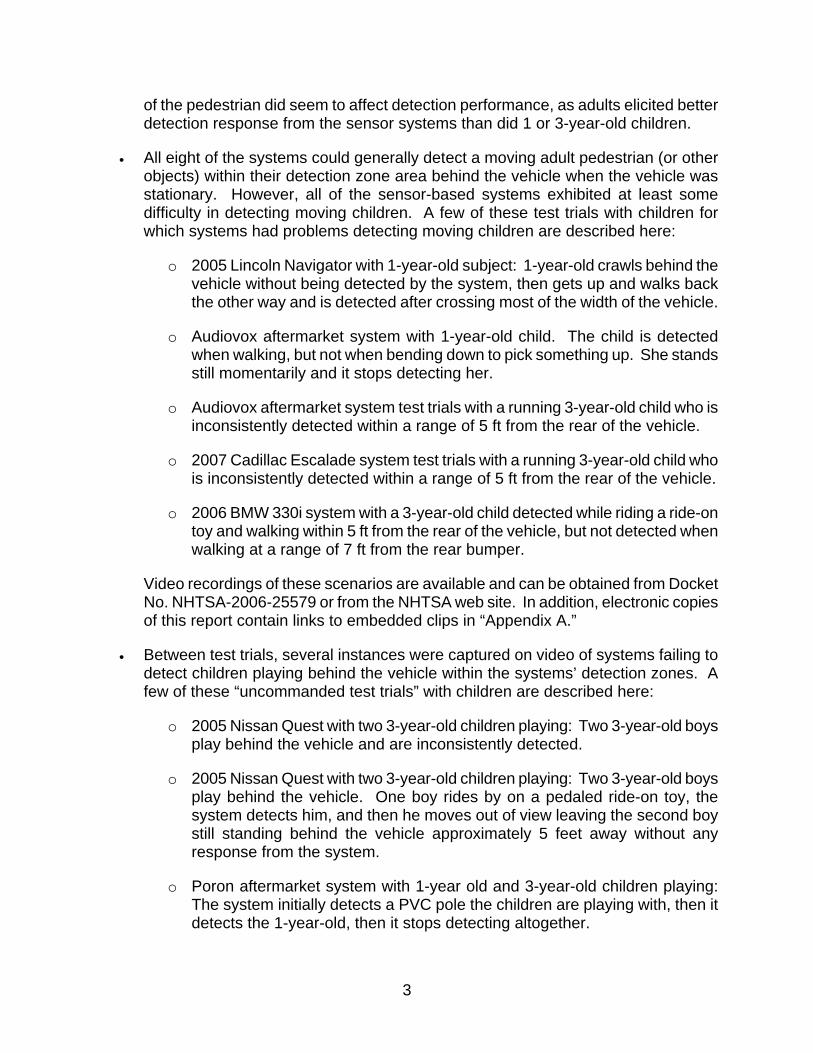
• All eight of the systems could generally detect a moving adult pedestrian (or other objects) within their detection zone area behind the vehicle when the vehicle was stationary. However, all of the sensor-based systems exhibited at least some difficulty in detecting moving children. A few of these test trials with children for which systems had problems detecting moving children are described here:
o 2005 Lincoln Navigator with 1-year-old subject: 1-year-old crawls behind the vehicle without being detected by the system, then gets up and walks back the other way and is detected after crossing most of the width of the vehicle.
o Audiovox aftermarket system with 1-year-old child. The child is detected when walking, but not when bending down to pick something up. She stands still momentarily and it stops detecting her.
o Audiovox aftermarket system test trials with a running 3-year-old child who is inconsistently detected within a range of 5 ft from the rear of the vehicle.
o 2007 Cadillac Escalade system test trials with a running 3-year-old child who is inconsistently detected within a range of 5 ft from the rear of the vehicle.
o 2006 BMW 330i system with a 3-year-old child detected while riding a ride-on toy and walking within 5 ft from the rear of the vehicle, but not detected when walking at a range of 7 ft from the rear bumper.
Video recordings of these scenarios are available and can be obtained from Docket No. NHTSA-2006-25579 or from the NHTSA web site. In addition, electronic copies of this report contain links to embedded clips in “Appendix A.”
• Between test trials, several instances were captured on video of systems failing to detect children playing behind the vehicle within the systems’ detection zones. A few of these “uncommanded test trials” with children are described here:
o 2005 Nissan Quest with two 3-year-old children playing: Two 3-year-old boys play behind the vehicle and are inconsistently detected.
o 2005 Nissan Quest with two 3-year-old children playing: Two 3-year-old boys play behind the vehicle. One boy rides by on a pedaled ride-on toy, the system detects him, and then he moves out of view leaving the second boy still standing behind the vehicle approximately 5 feet away without any response from the system.
o Poron aftermarket system with 1-year old and 3-year-old children playing: The system initially detects a PVC pole the children are playing with, then it detects the 1-year-old, then it stops detecting altogether.

4
Video recordings of these scenarios are available and can be obtained from Docket No. NHTSA-2006-25579 or from the NHTSA web site. In addition, electronic copies of this report contain links to embedded clips in “Appendix A.”
• The reliability (i.e., ability of systems to work properly without an unreasonable failure rate) of sensor-based systems as observed during testing was good, with the exception of one aftermarket, ultrasonic system that malfunctioned after only a few weeks, rendering it unavailable for use in remaining tests. In examining consistency of system detection performance, it was noted that all of the sensor-based systems tested exhibited at least some degree of day-to-day variability in their detection zone patterns. Results of static sensor-based system detection zone repeatability showed a range of performance quality. Inconsistency in detection was usually seen in the periphery of the detection zones and typically was not more than 1 foot in magnitude.
• Sensor-based systems typically have detection zone areas that only cover the area directly behind the vehicle. However, not all crashes involve pedestrians located directly behind the vehicle.
• A majority of systems tested were unable to detect test objects of less than 28 inches in height.
• While ultrasonic systems can detect stationary obstacles behind the vehicle when the vehicle is stationary, Doppler radar-based sensors, by design, cannot. Doppler radar-based sensors also cannot detect objects moving at the same speed and direction as the vehicle on which they are mounted.
• None of the systems tested had large enough detection zones to completely cover the blind spot behind the vehicle on which they were mounted. The sensor with the longest range of those tested could detect a 3-year-old child out to a range of 11 feet (along a 3-5 ft wide strip. The closest distance behind any of the six vehicles tested at which a child-height object could be seen by the driver, either by looking over their shoulder or in the center rearview mirror, was 16 feet.
• Response times of sensor-based systems ranged from 0.18 to 1.01 seconds. International Standards Organization (ISO) 17386 [1] contains a recommended maximum system response time of 0.35 seconds (measured using a PVC pole that enters the detection zone from above). Only three of the seven systems tested met the ISO limit. Given the observed sensor system response times, the ranges at which systems tested were able to detect children were insufficient to allow time to brake the vehicle to a stop prior to many collisions (assuming typical backing speeds; Huey, et al. [2] stated that only about 50 percent of the vehicles that back into pedestrians are traveling at speeds below 2.0 mph). Based on the analysis in that report [2], a system must have a range great enough to provide for a median maximum backing speed of at least 5 mph to provide sufficient time for braking to a stop before a collision.
5
• In order for sensor-based backover avoidance systems to assist in preventing collisions, the driver must perceive the warning generated by the system and respond quickly and apply sufficient force to the brake pedal to bring the vehicle to a stop. Time was not available in the context of this research to perform the complex human factors experimentation necessary to assess drivers’ tendency to respond appropriately to backing system warnings. However, a study sponsored by General Motors [3] raises questions as to whether the driver will respond quickly and with sufficient force applied to the brake pedal to bring the vehicle to a stop in response to a warning.
Visual System (Rearview Cameras and Auxiliary Mirrors) Findings
NHTSA also examined visual systems including rearview video camera systems and auxiliary mirror systems designed to augment driver rearward visibility. The examination of these systems included assessment of their field of view and potential to provide drivers with information about obstacles behind the vehicle. Based upon this research, the following observations relating to the rearview video systems and auxiliary mirrors examined were made:
• Rearview video systems provided a clear image of the area behind the vehicle in daylight and indoor lighted conditions. The video systems showed pedestrians or obstacles behind the vehicle within a range of 15 or more feet and displayed a wider area than was covered by the detection zones of sensor-based systems tested in this study. The range and height of the viewable area differed significantly between the two OE systems examined. In addition to the limited field of view, the limited view height of one system seemed to complicate the judgment of the distance to rear objects.
• In order for rearview video systems to assist in preventing backing collisions, the driver must look at the video display, perceive the pedestrian or object in the video screen, and respond quickly and with sufficient force applied to the brake pedal to bring the vehicle to a stop. The true efficacy of rearview video systems cannot be known without assessing drivers’ use of the systems and how they incorporate the information into their visual scanning patterns. Determining typical drivers’ interactions with rearview video systems would require complex human factors testing. Sufficient time was not available to perform such testing in the context of this research. However, two studies sponsored by General Motors raise questions regarding whether rearview video is adequate to prevent drivers from colliding with pedestrians or obstacles behind the vehicle.
• The examination of rearview auxiliary mirror systems revealed that neither of the two systems tested fully showed the area directly behind the vehicle. Both mirror systems had substantial areas directly behind the vehicle in which pedestrians or objects could not be seen.
6
• Visually detecting a 28-inch-tall traffic cone behind the car using the rearview auxiliary mirrors proved to be challenging for drivers. The convexity mirror of the mirrors caused significant image distortion making reflected objects difficult to discern. Concentrated glances were necessary to identify the nature of rear obstacles. A hurried driver making quick glances prior to initiating a backing maneuver might not allocate sufficient dwell time to allow them to recognize an obstacle presented in the mirror.
Summary of Findings
In summary, results showed that the performance of ultrasonic and radar parking aid and aftermarket backing systems in detecting child pedestrians behind the vehicle was typically poor, inconsistent, and limited in range. Based on calculations of the distance required to stop from a particular vehicle speed, detection ranges exhibited by the systems tested were not sufficient to prevent collisions with pedestrians or other objects for vehicle’s backing at many typical speeds [18]. While the sensor-based systems tested showed some deficiencies, particularly in detecting small pedestrians, it may be possible to improve system performance and detection range.
Visual systems, which simply display what is behind the vehicle, rather than detecting and report on any obstacles, had the ability to display objects behind the vehicle within a range of 15 or more feet. The rearview video systems examined displayed pedestrians or obstacles behind the vehicle clearly in daylight and indoor lighted conditions. While the auxiliary mirror systems tested also displayed any rear obstacles present, their fields of view covered a smaller area than did the video systems tested, and the displayed images were subject to distortion caused by mirror convexity and other factors (e.g., window tinting) making rear obstacles more difficult to recognize in the mirror.
Regardless of the type of technology used, to accurately estimate the effectiveness of backover avoidance systems in reducing backing crashes would require additional information in a few areas. For example, details regarding how backing crashes with pedestrians actually occur (e.g., location of the child struck, vehicle speeds) is needed to ensure that backing systems correctly address the problems that lead to crashes (e.g., ensure that detection zones cover the critical areas). In addition, information regarding how drivers would use the systems and the rate of drivers’ compliance with any system warnings would be needed, since even a system with the ability to consistently detect pedestrians will provide no benefit if it is ignored or misused by the driver. Rearview video systems, in particular, would require drivers to change their normal backing behavior by incorporating the new source of information (i.e., video display) into their visual scanning pattern. Research examining drivers’ use of these systems would provide insight into the potential for systems to reduce crashes.
7
Future Research Plans
This testing showed that, while current rear-object sensing technologies may perform adequately as parking aids, none of the sensor technologies examined, in their current forms, seemed adequately capable of preventing backover crashes with pedestrians. Rearview video systems display objects behind the vehicle, but require effort from the driver to check the visual display and discern whether any obstacles are present. Additional research and development is needed to develop an effective pedestrian backover countermeasure system. To this end, NHTSA plans to continue to investigate ways to reduce the incidence of backover crashes and to encourage industry to continue its research and development activities in this area. NHTSA’s efforts will include further examination of crashes, investigation of technology improvements, investigation of the feasibility of development of objective tests and technology-neutral performance specifications for backing safety systems, and assessment of drivers’ use of backing system technologies (e.g., rearview video systems).
8
1.0 INTRODUCTION
1.1. OBJECTIVES
Section 10304 of the Safe, Accountable, Flexible, Efficient Transportation Equity Act: A Legacy for Users (SAFETEA-LU) directed the National Highway Traffic Safety Administration (NHTSA) to do the following:
1. Conduct a study of effective methods of reducing the incidence of injury and death outside of backing passenger vehicles
2. Identify, evaluate, and compare the available backover avoidance technologies for detecting people or objects behind a passenger vehicle for their accuracy, effectiveness, cost, and feasibility for installation
3. Estimate the cost savings that would result from widespread use of backover prevention devices (injuries, fatalities, vehicle and property damage)
The impetus for this directive was based on consumer groups requesting Congress to mandate backover avoidance systems as standard equipment on vehicles. Consumers Union has initiated a petition [4] to ask Congress “to pass bi-partisan legislation that will establish basic safety regulations and hold automakers accountable, ensuring safety devices like rear-detection and auto-reversing windows become mandatory features in all new cars. In regards to these systems and other new technologies, Automotive News in May of 2006 [5] stated, “Safety gear exists; we must use it.” While, indeed, aftermarket systems are being sold that purport to address the safety problem of children and others being unintentionally struck by backing vehicles, the performance of such systems and their potential safety benefits must be assessed before they can be considered for inclusion as required equipment.
Thus, the research described in this report was performed to address the first two of the SAFETEA-LU requirements listed above. By identifying and assessing existing backover avoidance technologies, NHTSA could determine whether current systems are effective in reducing backover crashes (thus addressing the first requirement). The research data generated will assist NHTSA in performing the third requirement, e.g., estimating the cost savings that would result from widespread use of backover prevention devices.
For this research, NHTSA performed objective testing of existing, commercially-available, systems designed to reduce the incidence of injury and death outside of backing passenger vehicles. The goal of this testing was to determine the performance capabilities of these systems. Looking at the list of things in the second requirement, above, that NHTSA is to study, this research evaluated and compared the accuracy of available backover avoidance technologies. It also made a partial examination of system effectiveness. Note that a complete examination of backover avoidance system effectiveness would require that complex human factors testing be performed. There was not enough time prior to the required date for submission of a report to the Congress on this topic for such testing to be performed.

9
The following testing was performed for this research:
1. Static field-of-view measurements for selected backover avoidance systems based upon radar and/or ultrasonic sensors using a wide variety of test objects.
2. Repeatability of static field-of-view measurements for selected backover avoidance systems based upon radar and/or ultrasonic sensors using three test objects.
3. Dynamic range measurements for selected backover avoidance systems based upon radar and/or ultrasonic sensors using a limited set of test objects.
4. Response time measurements for selected backover avoidance systems based upon radar and/or ultrasonic sensors.
5. Field-of-view measurements for selected rearward pointing video cameras.
6. Field-of-view measurements for selected auxiliary mirrors designed to augment driver rearward visibility.
7. Measurements of the blind spot behind the vehicle for selected contemporary vehicles.
1.2. PRIOR NHTSA BACKOVER AVOIDANCE SYSTEM RESEARCH
During the 1990’s, NHTSA performed two studies that examined the performance capabilities of commercially-available systems designed to reduce the incidence of injury and death outside of backing vehicles. The first of these studies examined systems designed for use with commercial motor vehicles (medium and heavy trucks) while the second study tested systems meant for use with passenger vehicles.
The first of the 1990’s studies was performed in response to Section 6057 of the Intermodal Surface Transportation Efficiency Act (ISTEA) of 1991. This section of ISTEA required NHTSA to conduct a study to evaluate the then existing technology for two types of electronics-based object detection and warning systems for commercial vehicle application: those sensing the presence of objects to the rear of the vehicle, and those sensing the presence of objects on the right side of the vehicle. The resulting study will be called the 6057 Study.
The 6057 Study [6] tested six commercially available backover avoidance systems (referred to as Rear Object Detection Systems during the study): five ultrasonic systems and one rear video system. Note that none of these systems were installed in the vehicle as original equipment; they were all aftermarket add-ons. Quoting the most significant and relevant 6057 Study result from [6]:
“For rear object detection systems, the drivers were helped by the device when backing slowly to a loading dock and for warning of pedestrians. However, the low
10
[adult] pedestrian detection rate found for some systems, the limited coverage area of all systems, and the variability of detection performance suggests that drivers cannot solely rely on these systems to back up safely under all situations.”
The second of the 1990’s studies was performed as part of NHTSA’s Intelligent Transportation Systems research. This study, which will be referred to as the Performance Specification Study [7], was performed collaboratively by TRW Space Systems and NHTSA’s Vehicle Research and Test Center.
The Performance Specification Study evaluated, along with side-facing sensors, the performance of two commercially-available ultrasonic backover avoidance systems and two commercially- available rear video systems for passenger cars. Note that again none of these systems were installed in the vehicle as original equipment; they were all aftermarket add-ons.
There were two significant and relevant conclusions from the Performance Specification Study [7] for ultrasonic backing systems. This study found that, with respect to the detection zones of the two ultrasonic systems examined:
“With respect to the functional goals of a backing system, neither of these two systems meets any of the requirements. Even for near zone detection both systems have a maximum range of about 3m, not the 5m called for [in another report on this study.] ; …simulations have shown that systems with range out to 5m can achieve a crash avoidance potential in excess of 90%.”
For the detection sensitivity and false positives of the two ultrasonic systems examined, [7] summarizes this study’s results with:
“[Ultrasonic backing systems] were found to be extremely sensitive and prone to false alarms. Backing systems suffer from orthogonal requirements. On the one hand one doesn’t want the system to go off all the time, while on the other hand one would like to be sensitive to small targets, such as children, in an environment with a large amount of ground return.”
For rear video systems, [7] states:
“The two video systems tested appear to be quite capable of extending the drivers’ field of regard. The contrast compression may obscure some targets under certain lighting conditions, but such a condition was not observed during these tests. The field of view of both systems provided adequate coverage toward the rear of the vehicle. These two systems are quite capable of satisfying the target detection functional goal. Obviously, they cannot satisfy the warning requirement.”
NHTSA acknowledges that the two studies discussed above are now somewhat out of date. Testing the 6057 Study was performed during 1993 while testing for the Performance Specification Study was done in 1994. In the twelve years that have passed since the Performance Specification Study was performed, the rapid pace of development of electronics may have significantly changed the capabilities of current, commercially-

11
available, backover avoidance systems. Therefore, the current research was performed to update NHTSA’s information on the performance capabilities of backover avoidance systems.

12
2.0 AVAILABLE VEHICLE-BASED BACKING CRASH COUNTERMEASURE TECHNOLOGIES
The objective of this effort was to “identify, evaluate and compare the available backover avoidance technologies for detecting people or objects behind a passenger vehicle.” A variety of technologies exist which have the potential to detect objects behind a vehicle including sensor-based and visual systems. This section outlines available technologies and describes the specific systems examined in this research.
2.1. Description of Technologies for Aiding Drivers in Detecting Rear Obstacles According to a recent NHTSA-sponsored effort to document advanced technologies for passenger vehicles [8], in 2006 there were thirty-one vehicle manufacturers (vehicle makes) and 100 different model lines offering object detection systems sold as “parking aid” systems and/or rearview cameras in the U.S. market. Twenty-six of the model lines offer a parking aid system and/or rearview camera as standard equipment. These systems are intended to aid drivers in performing low-speed (typically at or below 3 mph) backing and parking maneuvers by providing some form of signal (typically an auditory tone) to indicate the presence of, and distance to, obstacles behind the vehicle.
In surveying the various technologies available, it was noted that all systems offered by original equipment (OE) manufacturers were advertised as “parking aids” rather than safety systems, while aftermarket systems were marketed as safety systems with the ability to warn drivers of children present behind backing vehicles. While the OE parking aid systems do not purport to detect pedestrians, they were still included in this testing to fully address the Congressional directive that asked for an examination of “available technologies for detecting people or objects behind a motor vehicle.” Furthermore, examining available parking aids allows NHTSA to inform consumers about their capabilities and permits comparison of their performance with aftermarket systems utilizing similar technology.
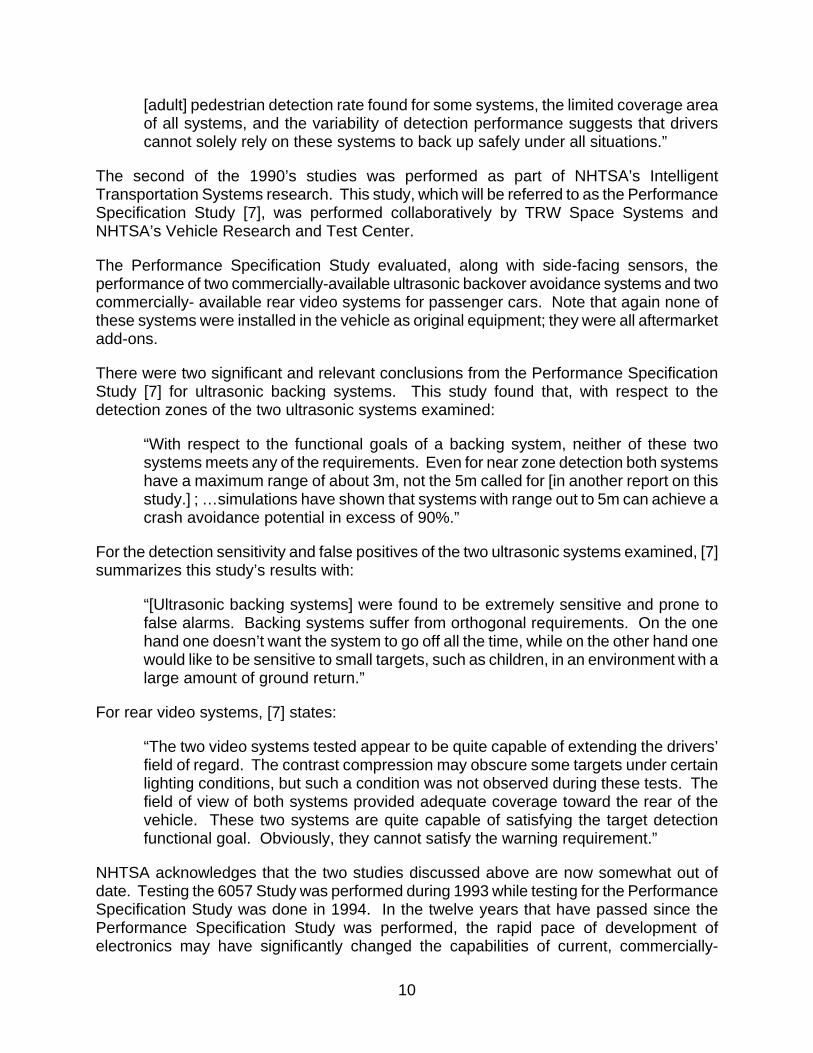
Both sensor-based systems and visual systems require the attention and the appropriate response of the driver in order to succeed in achieving crash avoidance. Systems that are purely visual are passive, in that the driver has to look at the display, perceive the object(s) displayed in it, and then take action to avoid backing into the object. Sensor systems are somewhat active in that they draw the driver’s attention to the presence of an object behind the vehicle that they might not have seen. Systems can be designed to be even more active using automatic braking to slow the vehicle if a rear obstacle is present. Thus, the different types of systems can require different levels of effort from the driver to avoid a crash. Figure 1 illustrates in a timeline fashion the steps in detecting and avoiding a rear obstacle as a function of system type.
13
Figure 1. Steps to detecting and avoiding rear objects as a function of system type.
2.1.1. Sensor-Based Technologies There are two main technologies used for sensor systems that detect people and obstacles behind vehicles: ultrasonic and radar. The radar technology can be further subdivided into sensors that use the Doppler effect to detect the presence of objects and those that use frequency modulated continuous wave radar to determine the position of obstacles relative to the vehicle.
Ultrasonic object detection systems emit a burst of ultrasonic (a typical frequency is 40 kHz) sound waves backward from the vehicle. Objects struck by the impinging sound waves reflect them; the reflected waves are called the echo. Quoting from [9]:
“The amplitude of the echo depends upon the reflecting material, shape and size. Sound-absorbing targets such as carpets and reflecting surfaces less than two square feet in area reflect poorly.”
After emitting a burst of ultrasonic sound waves, the ultrasonic object detection system listens for the corresponding echo. Since sound travels at approximately 1,100 feet per second in room temperature air, the time from the emission of the sound waves to hearing the echo can be used to determine the distance to the reflecting obstacle.
Figure 2 shows an ultrasonic sensor for rear object detection. This sensor is designed to be mounted in a hole in the rear bumper with the transmit/receive head of the sensor flush with the surface of the bumper.

14
Figure 2. Example of an ultrasonic sensor
Ultrasonic object detection systems are available as original equipment on a large range of vehicles. They are also available as an aftermarket product at prices ranging from approximately $56 to $400 (equipment only, installation would be an added expense). The system for a vehicle will consist of two to six ultrasonic sensors, a driver interface, and the necessary wiring.
Radar sensors, noted by Consumer Reports [10] as suited “best for a parking aid to help drivers avoid denting fenders and bumpers,” come in two varieties for short-range, vehicle-based applications. One type of radar sensor uses the Doppler effect to detect the presence of objects behind the vehicle that are moving with respect to the vehicle (i.e., if the vehicle is stationary, then the object must be moving to be detected, if the vehicle is moving then the object must either be stationary or moving at a different velocity than the vehicle to be detected). The difference in relative velocities changes the frequency of the reflected radar waves. The amount of frequency shift is proportional to the relative velocity difference. Note that Doppler effect radar systems cannot, in general, detect stationary objects while the vehicle is stationary. Doppler radar can determine relative velocities with high accuracy.
Doppler radar can also determine the distance to objects behind the vehicle. This can be done by changing the frequency of the emitted radar waves (the technique used by the Doppler radar sensor studied during this research) or by emitting multiple bursts of radar waves.

15
Figure 3 shows a Doppler radar sensor. This sensor has multiple mounting options – inside the bumper (for bumpers that are transparent to radar, outside the bumper, or on a trailer hitch.
Figure 3. Example of a radar sensor
Doppler radar object detection systems are available for aftermarket installation at prices ranging from approximately $200 to $300. The system for a vehicle will consist of a Doppler radar sensor, a driver interface, and the necessary wiring.
A second type of radar sensor uses frequency modulated continuous wave radar to determine the position of obstacles relative to the vehicle. This technology can detect objects that are not moving relative to the vehicle and gives a more accurate measurement of distance to an object than does Doppler radar. The ability to detect objects that are not moving relative to the vehicle is both an advantage and a disadvantage; it is advantageous in that it gives the ability to detect stationary objects behind the vehicle when the vehicle is not moving (think of a bicycle parked behind the vehicle) but a drawback in that the field of view of the system must be such as to avoid objects that are not a problem (e.g., the concrete of the driveway). Having to avoid objects that are not a problem tends to leave holes in the detection zone in which objects that should be detected will not be seen.
Frequency modulated continuous wave radar object detection systems are available as original equipment on a number of vehicles. The system for a vehicle will consist of one radar sensor, a driver interface, and the necessary wiring.
16
For both types of radar sensors, the detectability of objects within their field of view depends upon their radar cross section; the larger the radar cross section the more likely an object in the field of view is to be detected. (For Doppler effect sensors, detectability also depends upon whether the object is moving relative to the sensor. Objects that are stationary relative to the sensor will not be detected.) The radar cross section of an object depends upon its size, geometry, and material composition. For example, large, angular, metallic objects have very large radar cross sections. On the other hand, some geometries and materials are virtually invisible to radar.
2.1.2. Visual Technologies Visual technologies for detecting people and objects behind a backing vehicle include rear camera systems, convex mirrors, and Fresnel lenses. These systems show the driver what is behind the vehicle, but unless coupled with sensor technology, do not alert the driver to any unseen obstacles.
Several models of aftermarket video backing aid systems were found to be sold on the internet for prices ranging from approximately $400 - $600 or more. These rear camera systems often came with small LCD displays that required a mounting location on the dashboard, while a few were offered that included the LCD display as part of a replacement rearview mirror. Another aftermarket rear video system tested offered a rearview mirror display embedded in a replacement rearview mirror that could be mounted over top of the face of the original rearview mirror.
An alternative, inexpensive method of increasing the area a driver can view behind the vehicle is the use of a Fresnel lens. A Fresnel lens is a wide-angle lens that uses a series of concentric grooves, molded into the surface of a thin, lightweight plastic sheet to concentrate light. These small, rectangular lenses simply adhere to the rear window of the vehicle by static cling. They operate similarly to convex mirrors in that they permit the driver to see a concentrated view of an area not otherwise viewable. Consumer Reports [10] stated that the lens works only with vertical rear windows and it may interfere with normal rear visibility. They also stated that the lens can be blocked by rear passengers or cargo and that it is subject to reflections.
Rear-mounted convex mirrors, frequently called “cross-view mirrors” are available which seek to provide improved indirect side and rear visibility. The implementation examined during this study is one in which these mirrors are mounted at the inside, rear corners of the vehicle and face toward the centerline of the vehicle. These mirrors were found on one vehicle, a 2003 Toyota 4Runner, in which they were mounted at each rearmost pillar. An aftermarket convex mirror system called, “ScopeOut”, was examined as part of this study. The ScopeOut system literature stated that mirrors provided rear visibility by looking forward into the vehicle’s center rearview mirror, thus giving the driver additional information about what may be in the vicinity of the rear of the vehicle without having to turn around to look. Since aftermarket systems mount to the rear window glass, they do block a bit of the rearward view near the top of the window. These aftermarket convex mirrors are fairly inexpensive and are easy to install. The aftermarket convex mirrors system acquired for this study used adhesive tape to position the mirrors on the rear window of an SUV or the rear trunk lid of a sedan. Another implementation of rear-mounted convex mirrors,

17
which is more commonly used for medium duty trucks (such as delivery trucks), is that of a single convex mirror mounted diagonally out from the left rear corner of the vehicle using an overhead bracket.
2.2. Installation Issues Original equipment backing systems use some combination of sensors, cameras, or mirrors. Original equipment sensor systems examined in this study used 3 or 4 sensors mounted in the rear bumper. Camera-based systems used small video cameras mounted at the top of the recessed area containing the license plate. Visual displays for sensor and video systems were typically installed in the center console area. The primary installation issue for an original equipment system would likely be the challenge for the manufacturer to identify and allocate physical space in the vehicle that can be occupied by a visual display.
Sensor systems typically used one or more sensors mounted on or in the rear bumper. The aftermarket radar system tested in this program could also be installed on the inside face of the rear bumper or in the vehicle’s trailer hitch (if present). Ultrasonic sensors mounted in the bumper of the vehicle required the use of a hole saw to allow them to be set into the bumper. Adhesive tape could also be used to mount ultrasonic sensors to the rear bumper; however this would likely not be a rugged installation method. Aftermarket camera-based systems use small video cameras that mount on the rear of the vehicle. Cameras with a rugged, weather-proof housing can be screwed into a body panel, while others require using a hole saw to make a hole for the camera to be embedded in a rear-facing body panel. Installation of all sensor and camera systems requires electrical wiring skills. For aftermarket systems with a visual display, a location on or near the dashboard of the vehicle had to be allocated for mounting of the display.
A sensor-based backing system with an automatic braking function would require additional hardware and cost.
2.3. Systems Tested Systems were chosen for evaluation to provide a representative sample of each type of technology. To the extent possible given time and available funding, systems from different automotive manufacturers were included to provide a balance of brands as well as to observe any differences that might be present in terms of how different manufacturers implement a particular sensor technology (e.g., ultrasonic). Similar vehicle types (namely, SUV and minivan) were sought to provide some consistency of platform allowing for isolation of system and sensor performance factors. A set of vehicles meeting these criteria was identified. Suitable vehicles present in NHTSA’s existing fleet were chosen first. To complete the set, two vehicles equipped with unique backing systems were acquired (one purchased, one leased) for testing. The resulting set of eleven systems selected for examination included:
• Eight sensor-based systems: o Four original equipment (OE) “parking aid” systems (one included rear video)
18
o Four aftermarket systems (one included rearview video)
• Three visual-only systems: o One rearview video (“RearView Monitor”) OE system o One OE auxiliary mirror system o One aftermarket auxiliary mirror system
In surveying the various technologies available, it was noted that all systems offered by original equipment (OE) manufacturers were advertised as “parking aids” rather than safety systems. However, while most aftermarket systems have similar names implying the ability to aid drivers in backing, such as “reverse sensing system,” their web sites frequently claim the systems have the ability to warn drivers of children present behind backing vehicles. Many include photographs of children playing behind backing vehicles. While the OE parking aid systems do not purport to detect pedestrians, they were still included in this testing to fully address the Congressional directive that asked for an examination of “available technologies for detecting people or objects behind a motor vehicle.” Furthermore, examining available parking aids allows NHTSA to inform consumers about their capabilities and permits comparison of their performance with aftermarket systems utilizing similar technology.
Table 1 lists these systems and presents a summary of their characteristics.

19
Table 1. Backover Avoidance Systems/Test Vehicles
System Type
System Name
Sensor Technology
Number of Sensors
Display Type Manufacturer Vehicle
Year/Model
Park Distance Control Ultrasonic 4 sensors
LCD color graphical display,
auditory alert
BMW 2006 330i Single-Technology
Sensor Rear Sonar System Ultrasonic 4 sensors Auditory
alert Nissan 2005 Quest
Extended Rear Park
Assist
Ultrasonic/ Radar
2 ultrasonic,
1 radar
Auditory alert Lincoln 2005
Navigator
Multiple Technology
Ultrasonic Rear Parking Assist, Rear
Vision Camera
Ultrasonic/ Video
(integrated) 4 sensors
LCD color video,
3 LEDs, auditory alert
Cadillac 2007 Escalade
RearView Monitor Video 1 camera LCD color
video Infiniti 2005 FX35
OEM
Visual N/A Convex
mirrors 2 mirrors Located at rearmost
pillars Toyota 2003
4Runner
Mini3 LV Car Reversing Aid Ultrasonic 3 sensors
LED distance display,
auditory alert
Poron
Guardian Alert
Doppler Radar, X-Band
1 sensor LED, 3 colors
Sense Technologies
Single-Technology
Sensor
Guardian Alert
Doppler Radar, K-Band
2 sensors LED, 3 colors
Sense Technologies
Multiple Technology
Reverse Sensing
System, Rear Observation
System*
Ultrasonic, Mini-CCD camera*
4 sensors; 1 camera*
3-inch LCD display in rearview
mirror
Audiovox
After-market
Visual ScopeOut Convex mirrors 2 mirrors
Mounted to inside of rear
window
Sense Technologies
(Aftermarket systems
installed on a 2003 Toyota
4Runner)
*Note: Audiovox video system component was not examined due to insufficient time.
All aftermarket systems were installed per the manufacturer’s specifications.
2.3.1. Single-Technology Sensor Systems Two original equipment single-technology sensor systems were examined.

20
The “Park Distance Control” system in BMW’s 2006 330i sedan used ultrasonic technology to detect objects and presented alerts via a graphical display showing an overhead view of the vehicle and colored areas to indicate objects to the rear. The system provides staged visual and auditory warnings to alert the driver of rear obstacles. The system was offered as optional equipment at a cost of $300. The visual display for the system tested did not appear, regardless of shifting the vehicle into reverse gear, until the navigation system warning message was acknowledged by pressing the “accept” button. The rear sensor locations and stages of the visual display are picture in Figure 4.
Figure 4. BMW 330i sensor locations and graphical display
21
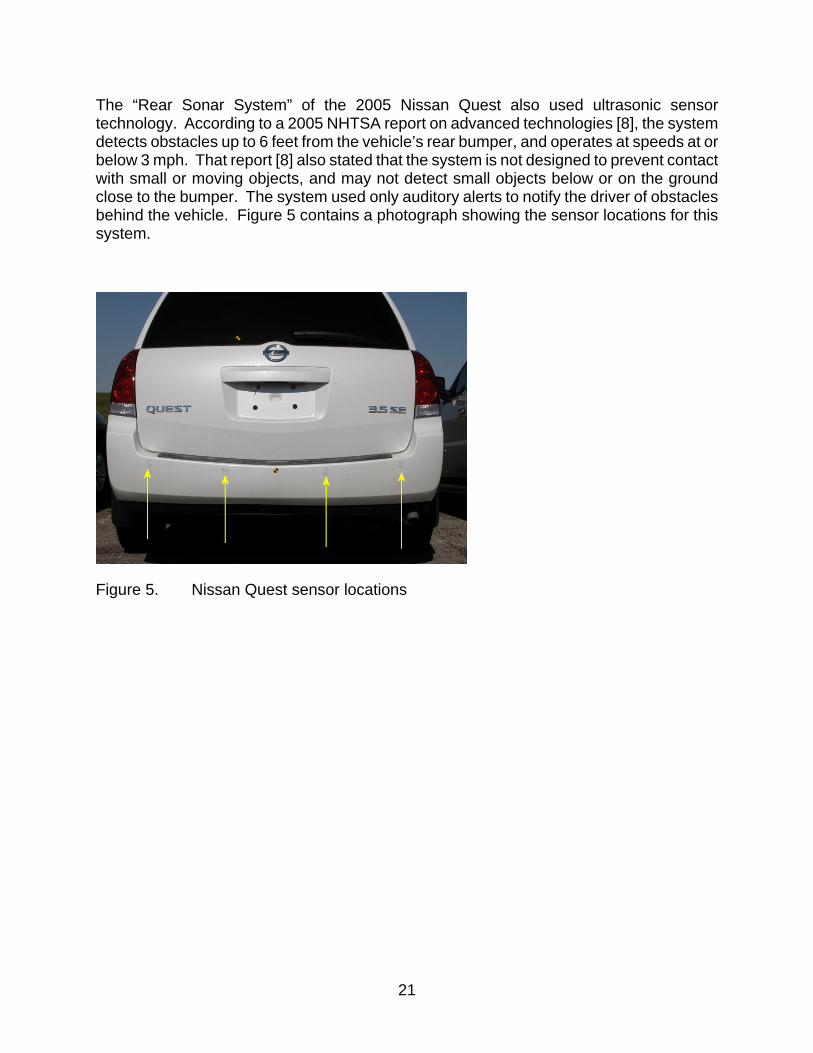
The “Rear Sonar System” of the 2005 Nissan Quest also used ultrasonic sensor technology. According to a 2005 NHTSA report on advanced technologies [8], the system detects obstacles up to 6 feet from the vehicle’s rear bumper, and operates at speeds at or below 3 mph. That report [8] also stated that the system is not designed to prevent contact with small or moving objects, and may not detect small objects below or on the ground close to the bumper. The system used only auditory alerts to notify the driver of obstacles behind the vehicle. Figure 5 contains a photograph showing the sensor locations for this system.
Figure 5. Nissan Quest sensor locations

22
Three aftermarket single-technology sensor systems were examined.
Poron’s “Mini3 LV Car Reversing Aid” is a commercially available system that was found for sale on the internet. This system is very similar to a system sold by the name of “Tail Gauge”. The system used ultrasonic technology and indicated the presence of rearward obstacles using an auditory alert and an LED display showing the distance to the detected object. The maximum detecting distance for this system was stated to be 8.2 feet. Figure 6 shows the location of the Poron ultrasonic sensors and its visual display. This system ceased to work properly after a short time and thus could not be run through the complete set of sensor system performance tests.
Figure 6. Poron sensors and LED distance visual display

23
Two versions of the Guardian Alert system by Sense Technologies were examined: an X-band Doppler radar system and a K-band Doppler effect radar sensors. The Guardian Alert system used auditory alerts and colored LEDs to indicate the presence of obstacles behind the vehicle. The Guardian Alert system price was $200. The photograph in Figure 7 shows both the K-band and X-band Guardian Alert Sensors. This system is marketed as a companion product to the “ScopeOut” mirror system, which is described in Section 2.2.3. However, for the purposes of this test program, the sensor system and mirror system were examined separately.
Figure 7. Guardian Alert sensors and visual display
Note: (X-band sensor in center, K-band sensors outboard)
24
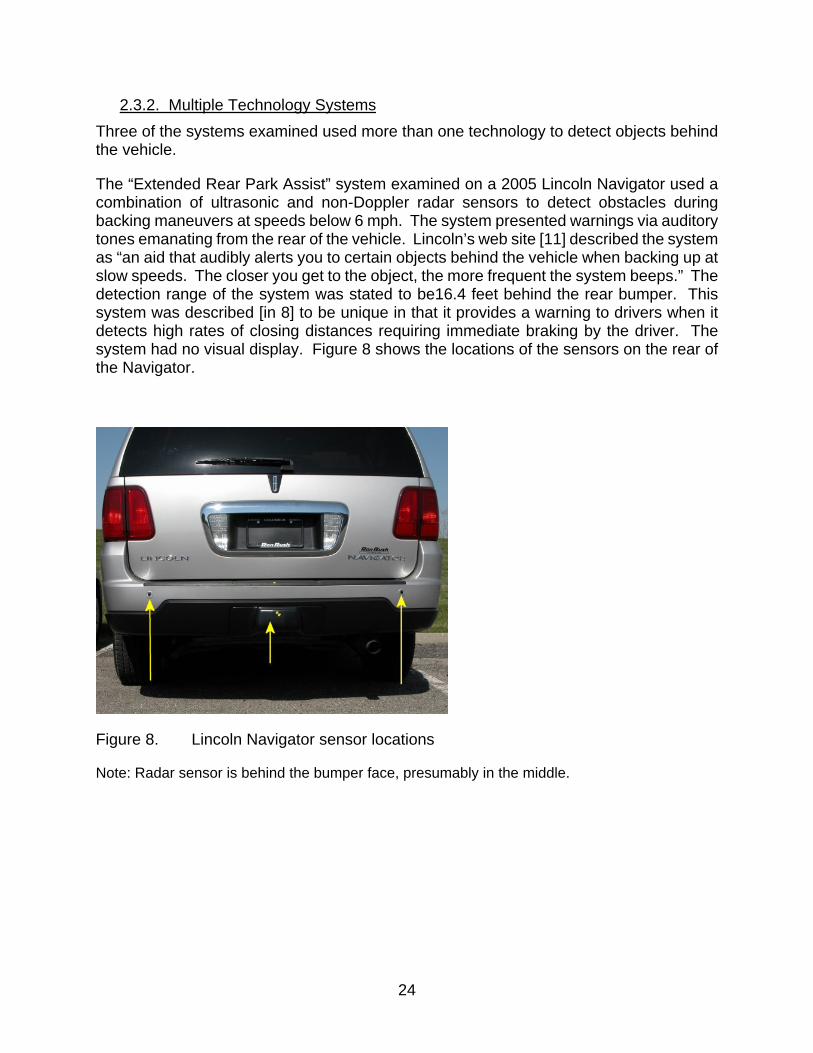
2.3.2. Multiple Technology Systems Three of the systems examined used more than one technology to detect objects behind the vehicle.
The “Extended Rear Park Assist” system examined on a 2005 Lincoln Navigator used a combination of ultrasonic and non-Doppler radar sensors to detect obstacles during backing maneuvers at speeds below 6 mph. The system presented warnings via auditory tones emanating from the rear of the vehicle. Lincoln’s web site [11] described the system as “an aid that audibly alerts you to certain objects behind the vehicle when backing up at slow speeds. The closer you get to the object, the more frequent the system beeps.” The detection range of the system was stated to be16.4 feet behind the rear bumper. This system was described [in 8] to be unique in that it provides a warning to drivers when it detects high rates of closing distances requiring immediate braking by the driver. The system had no visual display. Figure 8 shows the locations of the sensors on the rear of the Navigator.
Figure 8. Lincoln Navigator sensor locations
Note: Radar sensor is behind the bumper face, presumably in the middle.

25
The 2007 Cadillac Escalade examined was equipped with an “Ultrasonic Rear Parking Assist” system and “Rear Vision Camera.” This system presented warning information via three LEDs mounted at the passenger-side rearmost pillar, auditory alerts, and a “danger” symbol overlaid on the video screen to indicate the approximate location of rearward obstacles. Report [8] stated that the system provides staged warnings using audible tones and the visual display when the vehicle is traveling under 3 mph. The manual cautions that the system does not detect objects beyond 5 feet away. Figure 9 contains photographs of the Escalade system, including the rear camera location, video display monitor, and rear pillar LED display.
Figure 9. Cadillac Escalade sensor and camera locations and visual displays

26
Audiovox offers both a “Reverse Sensing System” using ultrasonic sensors ($101) and a “Rear Observation System” ($525) which uses a video camera and video display embedded in a replacement rearview mirror. Both of these systems were installed and examined as a single system. However, time was not available to perform field-of-view measurements for the camera system. Figure 10 contains photographs of the Audiovox ultrasonic sensors and rearview mirror display tested here.
Figure 10. Audiovox system sensor and camera locations and rearview mirror video display
27
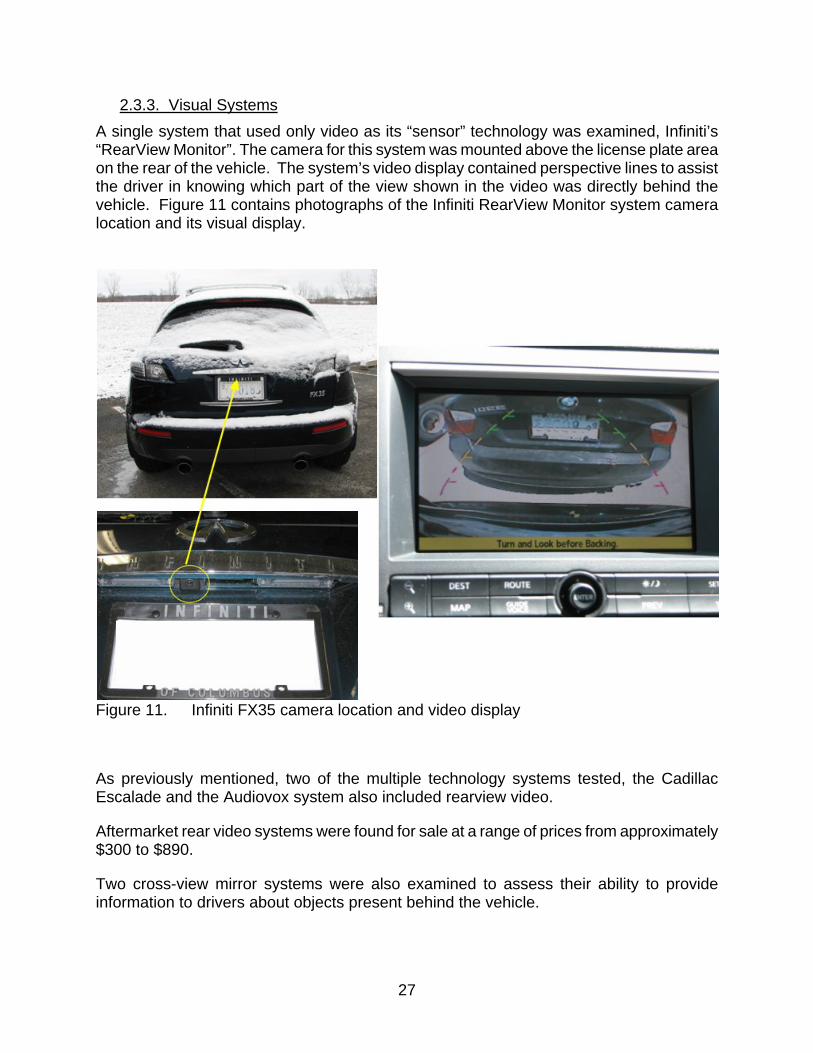
2.3.3. Visual Systems A single system that used only video as its “sensor” technology was examined, Infiniti’s “RearView Monitor”. The camera for this system was mounted above the license plate area on the rear of the vehicle. The system’s video display contained perspective lines to assist the driver in knowing which part of the view shown in the video was directly behind the vehicle. Figure 11 contains photographs of the Infiniti RearView Monitor system camera location and its visual display.
Figure 11. Infiniti FX35 camera location and video display
As previously mentioned, two of the multiple technology systems tested, the Cadillac Escalade and the Audiovox system also included rearview video.
Aftermarket rear video systems were found for sale at a range of prices from approximately $300 to $890.
Two cross-view mirror systems were also examined to assess their ability to provide information to drivers about objects present behind the vehicle.

28
One mirror system tested as original equipment was a set of rear-pillar mounted mirrors available on the Toyota 4Runner. The Toyota mirrors are pictured in Figure 12.
Figure 12. Rear pillar mirrors on Toyota 4Runner (photo from Toyota web site)
ScopeOut mirror system is an aftermarket mirror system which consisted of a set of rectangular convex mirrors mounted on the inside of the rear SUV window or on the rear trunk lid of a sedan. The ScopeOut mirror system is sold as a companion system to the Guardian Alert radar system also examined as part of this work. The ScopeOut mirror system is intended to allow drivers to see objects approaching the area behind their vehicle from a perpendicular direction (e.g., such as when backing out of a parking space when a vehicle is driving down the same aisle). The cost of the system is less than $100. While the primary focus of this work was to assess technologies that help the driver know what may be directly behind the vehicle, these mirrors were examined to determine whether any portion of the area to the rear of the vehicle was included in the area covered by the mirrors’ fields-of-view. These mirrors are pictured in Figure 13.
Figure 13. ScopeOut mirror system (SUV version)

29
3.0 METHOD
This section describes equipment used and test procedures that were applied to all of the different types of tests conducted. Section 4.0 describes the details and procedures for individual test scenarios.
3.1. TEST OBJECTS
How well a sensor system can detect a particular object depends on a variety of factors including the composition of the object, its shape, size, and distance from the sensor. The object detection capabilities of sensor-based parking aid and backover avoidance systems were measured using a variety of “test objects”. Test objects (e.g., traffic cones) of various heights, diameters, and shapes were chosen to assess the size of the detection zone. These objects were comprised of a range of cross-sections that represent obstacles that a backing system may need to sense in the real world.
Human subjects, including 1-year-old and 3-year-old children as well as an adult male, also participated as “test objects.” Protocols involving human subjects were approved by an independent institutional review board. Vehicles were stationary and secure during all test trials with pedestrians. All test trials involving children were conducted with a parent or guardian, as well as at least 2 research staff members, present.
Table 2 presents the complete list of objects used in sensor performance testing conducted indoors and indicates whether the object was presented statically or dynamically. Table 3 presents similar information for tests conducted outdoors. All tests were conducted with the test objects oriented in an upright orientation (e.g., standing), except where noted.
Table 2. Sensor Test Objects and Test Type – Indoor Testing TEST OBJECT STATIC DYNAMIC
12, 18, 28, 36-inch traffic cone X 20-inch PVC pole X 40-inch PVC pole (as per ISO 17386) X 2, 3, 4 mph 20-feet PVC pole, positioned horizontally X (vertical test) Parking curb, plastic X Hybrid III 3-year-old crash dummy (210-0000) X 2, 3, 4 mph CRABI 12-month-old crash dummy (921022-0000) X 2, 3, 4 mph Child, 3 years old X Walking, running, riding toy Child, 1 year old X Walking, riding toy
Adult, male (6’ 1”, 190 lbs) X (also laying on ground)
Walking (laterally, longitudinally, diagonally with respect to vehicle)

30
Table 3. Sensor Test Objects and Test Type – Outdoor Testing TEST OBJECT STATIC DYNAMIC
Car backing straight to a 36-inch traffic cone Slow (<5 mph) Car backing straight to a car (Toyota Camry sedan) Slow (<5 mph) Car backing straight to a mild grass slope Slow (<5 mph) Car backing straight to a 17% concrete slope Slow (<5 mph) Cozy coupe (toy car) 2, 3 mph
Adult, male (6’ 1”, 190 lbs) X Walking (laterally, longitudinally, diagonally with respect to vehicle)
Traffic cones and poles were chosen as test objects since their conical and cylindrical shapes, when positioned vertically upright, present the same appearance to the sensors despite any rotation about their vertical axis. This quality renders them likely to achieve a more repeatable response in objective testing. This is likely the reason that a PVC pole was recommended as a test object in the International Standard’s Organization’s (ISO) Standard 17386, “Transport information and control systems – Maneuvering Aids for Low Speed Operation (MALSO) – Performance requirements and test procedures” [1]. The 40-inch “ISO pole” (pictured in Figure 14) was included in this testing to assess the performance of systems in detecting this object.
Figure 14. ISO Pole behind the Nissan Quest test vehicle.
Another goal in test object selection was to investigate whether any object could be identified that would have a similar sensor system detection pattern to that of a child’s. Identifying such an object would be useful in the development of any possible future performance standard for backover avoidance systems. Since conducting research involving human subjects requires detailed review and approval of protocols for data

31
collection and personal information protection, the availability of a suitable surrogate test object for a child would prove quite useful and more convenient. To this end, Anthropometric Test Devices (ATDs), or crash dummies were used to assess sensor system responses to them. The particular ATDs used in this testing included the Hybrid III Three-Year-Old child (H-III3C) dummy and the Child Restraint/Air Bag Interaction (CRABI) dummy. The crash dummies are constructed from steel and rubber with fiberglass heads surrounded by polyurethane skins. Table 4 contains some basic data about these devices. For testing, the crash dummies were dressed in long-sleeved knit shirts and long knit pants typically worn for crash testing. Crash dummies were also fitted with knit hats to simulate hair, and the 3-year-old ATD was fitted with shoes. Photographs of these ATDs are presented below. Children participating in testing also wore long sleeved shirts, long pants, and shoes.
Table 4. ATD Weight and Height Information CRABI 12-month-old ATD Hybrid III 3-year-old ATD Weight (lbs) 22.0 34.2 Standing Height (inch) 29.4 37.2 Sitting Height (inch) 18.9 21.5
Figure 15. Photographs of ATDs used in testing

32
Test objects that were too heavy to be moved repeatedly by hand or that were not self-supporting were suspended from above using a modified engine hoist and boom fixture. The hoist was also used to suspend and stabilize movement of the ISO pole during dynamic testing. Monofilament line of 75 pound test was used to suspend objects from the boom. Figure 16 shows a photograph of this fixture with the 3-year-old ATD suspended.
Figure 16. Hoist and boom apparatus with 3-year-old ATD on indoor test grid
3.2. TEST GRID
Dimensioned floor grids facilitated measurement of the horizontal area in which objects were detected by sensors systems. The grids were comprised of 1 foot squares. The indoor grid was created using colored vinyl tape and was 60 by 50 feet. The 20 by 25 foot outdoor grid was painted on level, asphalt pavement. Figure 16 shows a portion of the indoor test grid.
33
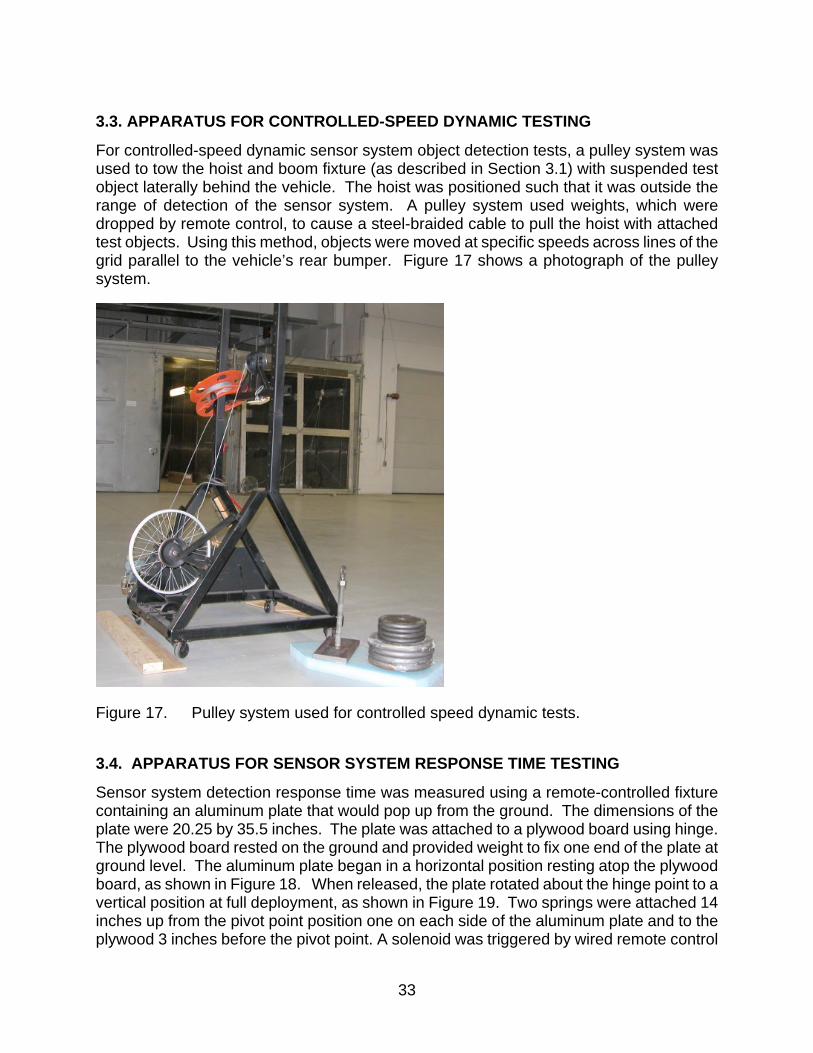
3.3. APPARATUS FOR CONTROLLED-SPEED DYNAMIC TESTING
For controlled-speed dynamic sensor system object detection tests, a pulley system was used to tow the hoist and boom fixture (as described in Section 3.1) with suspended test object laterally behind the vehicle. The hoist was positioned such that it was outside the range of detection of the sensor system. A pulley system used weights, which were dropped by remote control, to cause a steel-braided cable to pull the hoist with attached test objects. Using this method, objects were moved at specific speeds across lines of the grid parallel to the vehicle’s rear bumper. Figure 17 shows a photograph of the pulley system.
Figure 17. Pulley system used for controlled speed dynamic tests.
3.4. APPARATUS FOR SENSOR SYSTEM RESPONSE TIME TESTING
Sensor system detection response time was measured using a remote-controlled fixture containing an aluminum plate that would pop up from the ground. The dimensions of the plate were 20.25 by 35.5 inches. The plate was attached to a plywood board using hinge. The plywood board rested on the ground and provided weight to fix one end of the plate at ground level. The aluminum plate began in a horizontal position resting atop the plywood board, as shown in Figure 18. When released, the plate rotated about the hinge point to a vertical position at full deployment, as shown in Figure 19. Two springs were attached 14 inches up from the pivot point position one on each side of the aluminum plate and to the plywood 3 inches before the pivot point. A solenoid was triggered by wired remote control
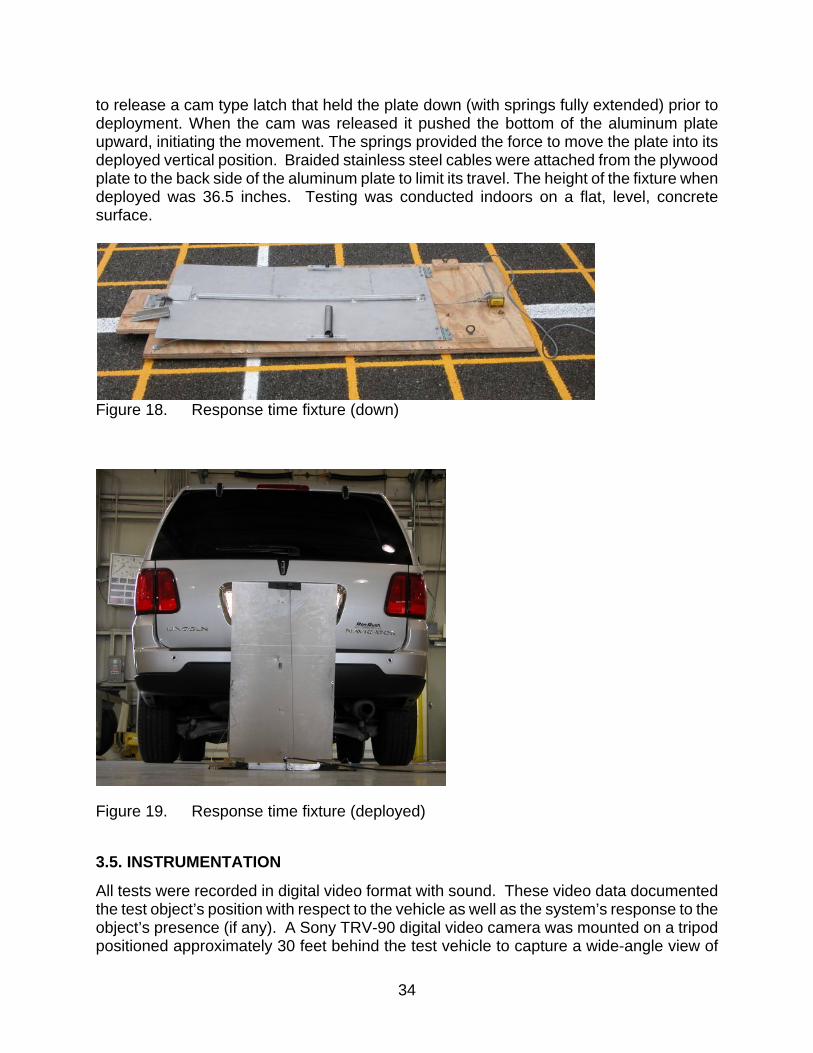
34
to release a cam type latch that held the plate down (with springs fully extended) prior to deployment. When the cam was released it pushed the bottom of the aluminum plate upward, initiating the movement. The springs provided the force to move the plate into its deployed vertical position. Braided stainless steel cables were attached from the plywood plate to the back side of the aluminum plate to limit its travel. The height of the fixture when deployed was 36.5 inches. Testing was conducted indoors on a flat, level, concrete surface.
Figure 18. Response time fixture (down)
Figure 19. Response time fixture (deployed)
3.5. INSTRUMENTATION
All tests were recorded in digital video format with sound. These video data documented the test object’s position with respect to the vehicle as well as the system’s response to the object’s presence (if any). A Sony TRV-90 digital video camera was mounted on a tripod positioned approximately 30 feet behind the test vehicle to capture a wide-angle view of
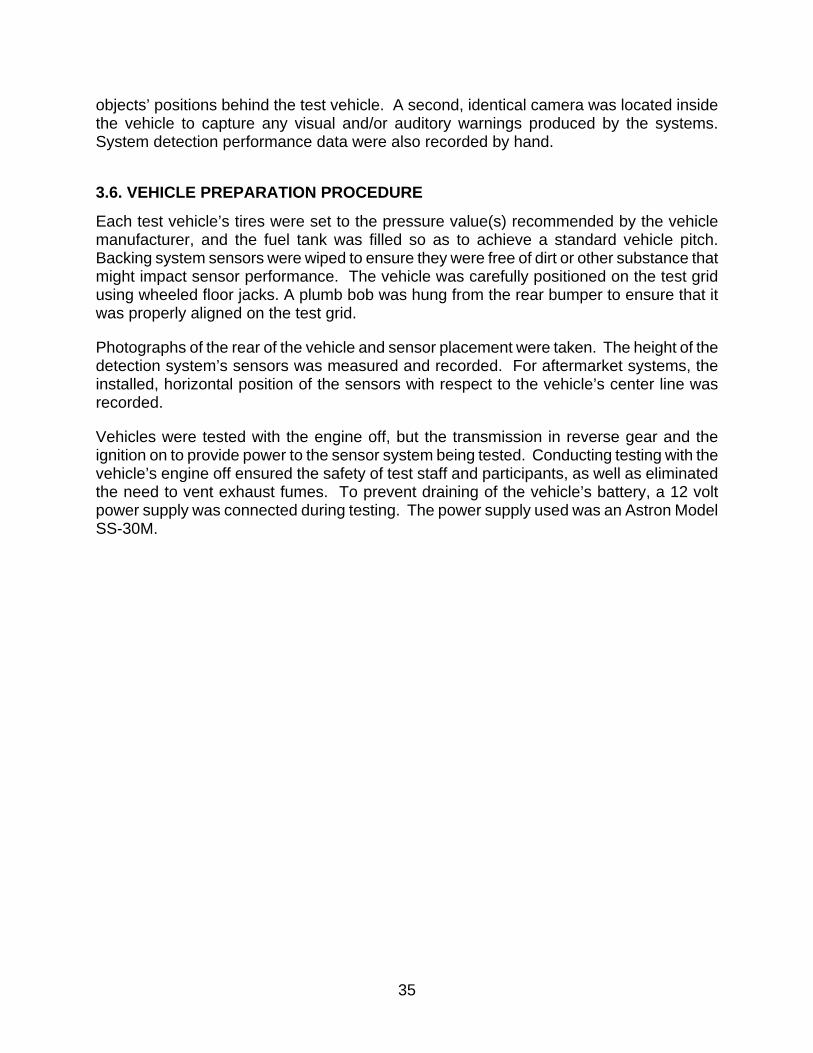
35
objects’ positions behind the test vehicle. A second, identical camera was located inside the vehicle to capture any visual and/or auditory warnings produced by the systems. System detection performance data were also recorded by hand.
3.6. VEHICLE PREPARATION PROCEDURE
Each test vehicle’s tires were set to the pressure value(s) recommended by the vehicle manufacturer, and the fuel tank was filled so as to achieve a standard vehicle pitch. Backing system sensors were wiped to ensure they were free of dirt or other substance that might impact sensor performance. The vehicle was carefully positioned on the test grid using wheeled floor jacks. A plumb bob was hung from the rear bumper to ensure that it was properly aligned on the test grid.
Photographs of the rear of the vehicle and sensor placement were taken. The height of the detection system’s sensors was measured and recorded. For aftermarket systems, the installed, horizontal position of the sensors with respect to the vehicle’s center line was recorded.
Vehicles were tested with the engine off, but the transmission in reverse gear and the ignition on to provide power to the sensor system being tested. Conducting testing with the vehicle’s engine off ensured the safety of test staff and participants, as well as eliminated the need to vent exhaust fumes. To prevent draining of the vehicle’s battery, a 12 volt power supply was connected during testing. The power supply used was an Astron Model SS-30M.
36
4.0 SYSTEM TESTING AND RESULTS
Tests were conducted to characterize the performance of available backover avoidance technologies in detecting objects and people. This section describes the details and procedures for individual test scenarios and summarizes the test results.
Due to the timeline in which this research had to be conducted, a majority of this testing was conducted indoors during the winter months. Subsequently, a subset of tests was conducted outdoors to asses whether any environmentally-based performance differences might be observable.
4.1. STATIC TESTS
Sensor-based systems were tested to measure their performance in detecting a set of objects in a static scenario, when both the vehicle and the test object are stationary.
Five systems were subjected to static testing: five ultrasonic systems and one radar-ultrasonic hybrid system. The Guardian Alert K-Band and X-Band Doppler radar systems were not tested statically since they are not designed to detect static objects.
4.1.1. Sensor detection zone area, original measurements Sensor system detection zone area was measured by placing test objects in the center of individual grid squares behind the vehicle and recording the response of the system to the object. All objects were oriented in an upright (vertical) position for all grid locations aft of the bumper. The 12-inch cone (upright) and 1-year-old ATD (lying on the ground) were also positioned under the bumper in some cases.
Testing began with objects being placed in a grid square near a rear corner of the vehicle within the 12-inch area closest to the vehicle’s bumper. The object would be moved to the next square to the right or left until the system ceased to detect the test object. After completing one row of the grid, the object would be moved to the next row of grid squares further away from the rear of the vehicle and the process was repeated. This continued until the sensor system ceased to detect the object.
For each location at which the test object was placed, a data point was manually recorded to reflect whether the system did or did not detect the presence of the object. To the extent possible, the level of warning emitted was also recorded. Some systems presented multiple stages of warnings, while others used continuously increasing frequency of audible beeps to indicate the imminence of collision. Thus, to simplify the presentation of sensor system object detection performance results the coding scheme shown in Table 5 was used for data presentation to indicate whether the object was detected in a particular location and to describe the approximate level of warning provided by the system. A system’s response was considered an “inconsistent warning” if the system produced a sporadic or occasional visual or auditory alert in response to the object’s presence.
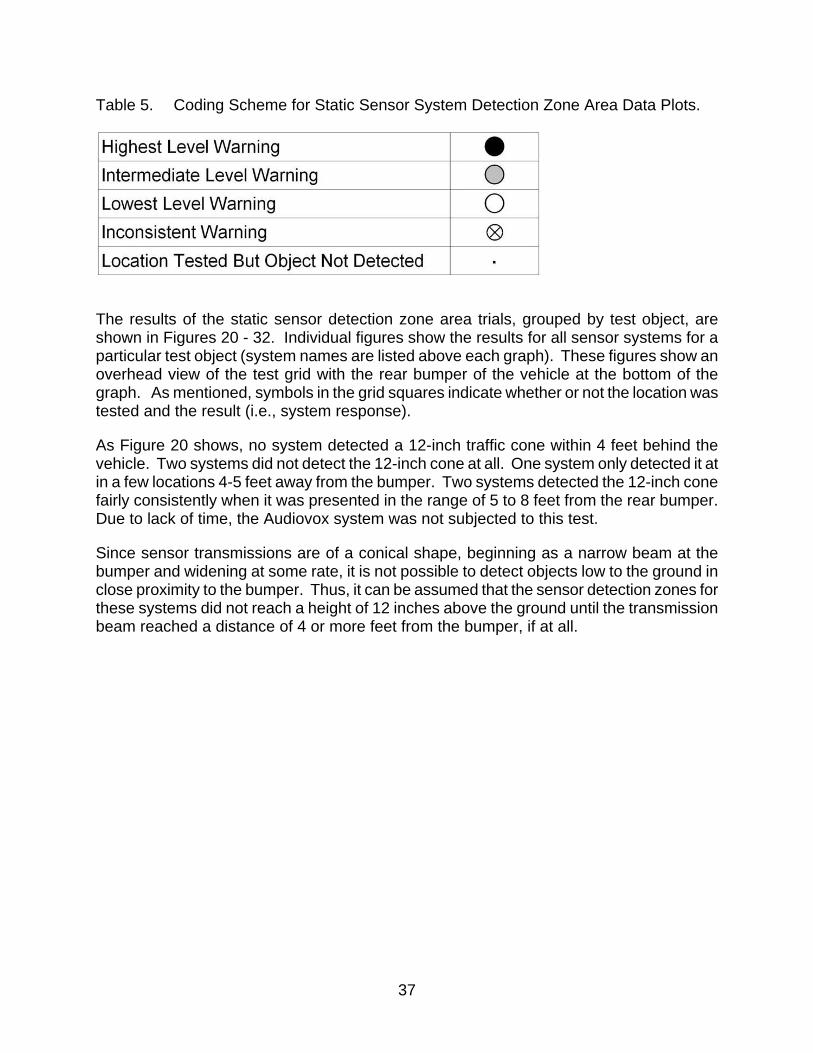
37
Table 5. Coding Scheme for Static Sensor System Detection Zone Area Data Plots.
The results of the static sensor detection zone area trials, grouped by test object, are shown in Figures 20 - 32. Individual figures show the results for all sensor systems for a particular test object (system names are listed above each graph). These figures show an overhead view of the test grid with the rear bumper of the vehicle at the bottom of the graph. As mentioned, symbols in the grid squares indicate whether or not the location was tested and the result (i.e., system response).
As Figure 20 shows, no system detected a 12-inch traffic cone within 4 feet behind the vehicle. Two systems did not detect the 12-inch cone at all. One system only detected it at in a few locations 4-5 feet away from the bumper. Two systems detected the 12-inch cone fairly consistently when it was presented in the range of 5 to 8 feet from the rear bumper. Due to lack of time, the Audiovox system was not subjected to this test.
Since sensor transmissions are of a conical shape, beginning as a narrow beam at the bumper and widening at some rate, it is not possible to detect objects low to the ground in close proximity to the bumper. Thus, it can be assumed that the sensor detection zones for these systems did not reach a height of 12 inches above the ground until the transmission beam reached a distance of 4 or more feet from the bumper, if at all.
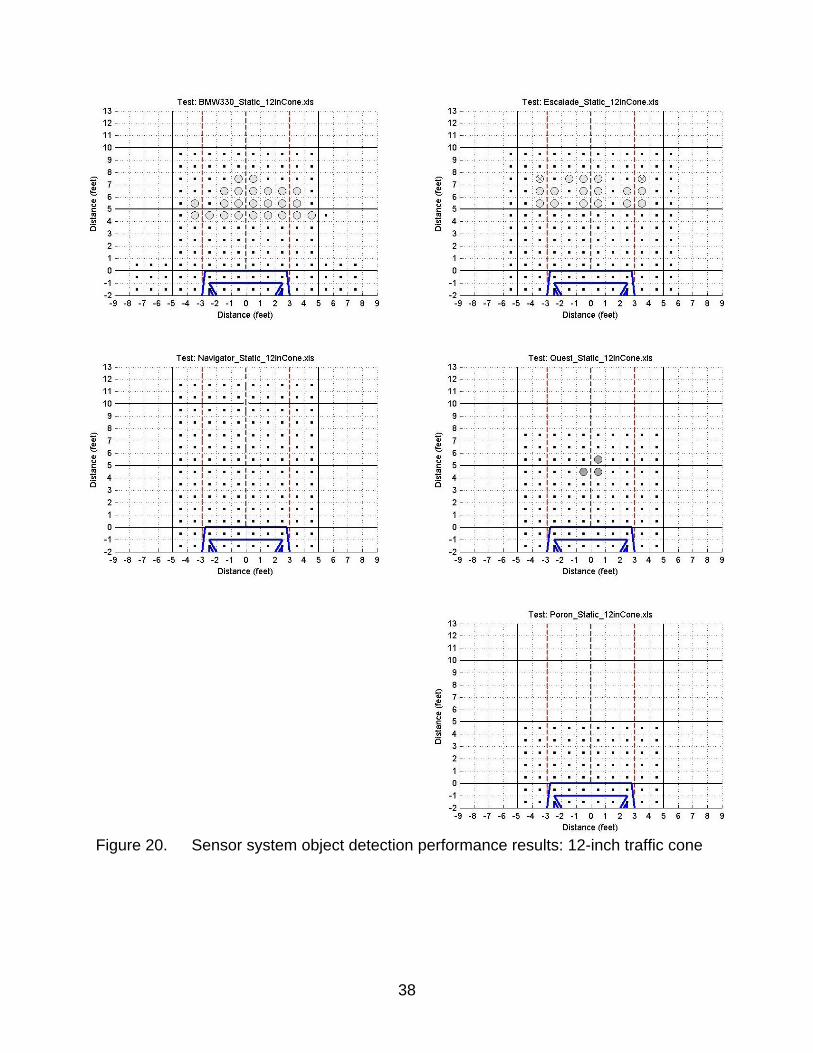
38
Figure 20. Sensor system object detection performance results: 12-inch traffic cone

39
The 18-inch cone was detected by the systems somewhat better than the 12-inch cone, supporting the assumption noted above that the 12-inch cone was simply not tall enough to reach the lower edge of the sensor beam and be detected. As shown in Figure 21, all systems detected the 18-inch cone in at least some locations. The broad detection area shown for the BMW 330i demonstrates that the 18-inch cone is a detectable object. These graphs suggest that the detection beam of the Escalade, Poron, and Navigator systems are probably aimed higher than those of the BMW 330i and Audiovox systems.

40
Figure 21. Sensor system object detection performance results: 18-inch traffic cone

41
The 28-inch cone was detected fairly well by all systems within a 5 feet range, as shown in Figure 22. This object was the first to show systems producing defined detection areas for all systems, as opposed to sporadic detection spots. The ability of the BMW system to detect the test object at the rear corners of the vehicle, forward of the bumper could prove to be a beneficial aspect of system performance. Note the Poron system’s lack of detection of the 28-inch cone in the 1 foot space directly aft of the rear bumper. Figure 22 shows the BMW 330i and Cadillac Escalade to have had the broadest detection range, while the Lincoln Navigator had the longest range, as might be expected with radar technology.

42
Figure 22. Sensor system object detection performance results: 28-inch traffic cone

43
Figure 23 shows that the 36-inch cone was detected well by all systems within distances ranging from 5 feet from the rear bumper for the Poron system to 11 feet for the Navigator. As with the 28-inch cone, the 36-inch cone was not detected by the Poron system within the 12-inch area directly behind the vehicle’s bumper. The BMW system was again seen to be the only system capable of detecting the test object at the rear corners of the vehicle, forward of the bumper.

44
Figure 23. Sensor system object detection performance results: 36-inch traffic cone

45
The 20-inch PVC pole was included in the set of test objects to provide additional height and shape combination information. The subtleties of shape differences are highlighted when comparing the results for the 20-inch pole to the 18-inch cone. The 20-inch pole was nearly not detected at all by four of the systems, as shown in Figure 24. The BMW system detected the 20-inch pole only about half as well as the 18-inch cone, despite the similar height of the objects. It is possible that the shape of the cone with its sloped sides may have allowed more of the sensor’s detection beam to be reflected back to the receiver. Given that the shape of the pole is not similar to that of a human, this object provides information related to detectability of objects a driver might encounter in a parking lot.

46
Figure 24. Sensor system object detection performance results: 20-inch PVC pole

47
The 40-inch PVC pole, specified by ISO in its 17386 procedure, was well detected over a broad area by the systems on both the BMW 330i and the Cadillac Escalade demonstrating the high reflectivity of this test object for ultrasonic systems. The narrow hole in the detection zone of the Navigator system, also observable for the 28-inch cone, was likely due to a gap in coverage between the system’s two ultrasonic sensors. Again, the Poron aftermarket ultrasonic system failed to detect the test object within 1 foot directly behind the vehicle. Results for sensor system performance in detecting the 40-inch pole are presented in Figure 25.
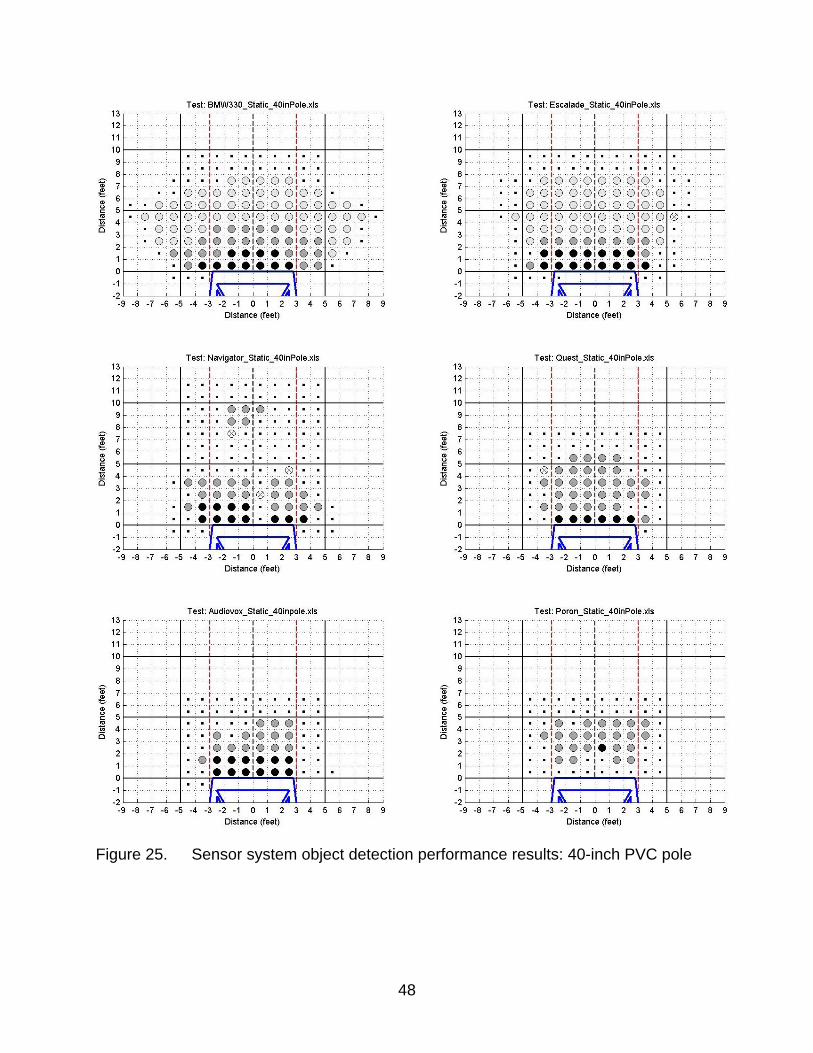
48
Figure 25. Sensor system object detection performance results: 40-inch PVC pole
49
The 29.4-inch tall 1-year-old ATD was detected by all systems to at least some degree. The systems on the BMW 330i and Cadillac Escalade both detected the ATD consistently across the width of the vehicle out to a range of 5 to 6 feet. The Nissan Quest system also detected the ATD consistently across the width of the vehicle, but only to a range of 3 feet. The Lincoln Navigator system was able to detect the 1-year-old ATD out to a range of 11 feet, but with sporadic holes in the detection zone and cases of “inconsistent detection”. The static detection zones exhibited by both aftermarket systems for this test object generally showed less thorough coverage than the OEM systems for this test object.

50
Figure 26. Sensor system object detection performance results: 1-year-old ATD

51
The 3-year-old ATD was detected by two of the ultrasonic systems to a range of approximately 5 feet, by the radar/ultrasonic system to a range of up to 11 feet, and to a lesser range for the other systems. This, ATD, approximately 37.5 inches in height, was found to be generally less reflective to all systems than was an object of similar height, the 36-inch-tall cone. While this ATD is approximately 8 inches taller than the 1-year-old ATD, there was not a noticeable difference in the systems’ detection performance results across the two test objects. The BMW system was again seen to be the only system capable of detecting the test object at the corners of the vehicle forward of the rear bumper.

52
Figure 27. Sensor system object detection performance results: 3-year-old ATD
53
Figure 28 summarizes sensor system object detection performance for a 1-year-old, female child (30-inch-tall). Detection data are somewhat less complete than those for other objects due to the difficulty involved in encouraging a 1-year-old child to stand in specific locations. It should be noted that while these tests conducted with children are characterized as tests in which the test object is stationary, the children did not tend to stand motionless very well. Experimenters would instruct the child to stand still in a particular location and wait for the child to be still for at least a couple of seconds and the system response to stabilize. Even subtle motion (e.g., arm moving), in most cases, appeared to increase the likelihood that the sensor system would detect the child. Despite the fact that the possibility of slight movement of the child during data collection can complicate the characterization of the data as that of a “stationary child,” it can be said that the test results are realistic examples of sensor systems’ ability to detect children.
Overall, the data in Figure 28 show that the systems had difficulty detecting a 1-year-old child standing still. The BMW 330i system was the only one to consistently detect the child across the width of the vehicle, but only to a range of 4 feet. The system on the Lincoln Navigator detected the child at 11 feet; however it appears that the child was more likely to be detected when standing toward one side of the vehicle than the other.

54
Figure 28. Sensor system object detection performance results: 1-year-old child

55
Results for sensor system detection of a 3-year-old, male child (40-inch-tall) are presented in Figure 29. The Navigator system, with extended range radar, succeeded in detecting the 3-year-old child to a range of 11 feet, but left several holes in the detection area in which the child was not detected. The systems on the BMW and Cadillac, as well as the Audiovox aftermarket system were able to detect the 3-year-old child across most of the width of the vehicle to a distance of 5 feet. The Nissan Quest system only detected the child out to a range of 3 feet and the Poron system only detected the child in a few, sporadic locations. While these data show somewhat better system detection performance than that seen for the 1-year-old child, the systems’ detection zone for this object contained numerous “holes” in which the child was not detected.

56
Figure 29. Sensor system object detection performance results: 3-year-old child

57
Figure 30 shows the results for sensor system detection performance of the adult male subject.
System detection zone areas were also measured outdoors using an adult male as the test object. Again, the person stood in the center of individual grid squares behind the vehicle with his body facing the vehicle. These “adult standing outdoors” trials were conducted toward the end of testing which occurred in the spring of 2006 in central Ohio. Thus, temperatures during this testing were in the 60 to 70 degree range. Outdoor results for the Poron system are not included since the system had malfunctioned. Figure 31 presents results for the adult male standing outdoors.
Detection results for the adult subject measured statically indoors were generally similar for all systems to those obtained outdoors. The adult male was detected well for all systems, both indoors and outdoors, except for some inconsistent detection in various locations throughout the detection zone for the system on the Lincoln Navigator. Detection range was a minimum of 5 feet for the Audiovox and Poron systems and a maximum of 11 feet for the Lincoln Navigator system.

58
Figure 30. Sensor system object detection performance results: adult male standing- indoors

59
Figure 31. Sensor system object detection performance results: adult male standing - outdoors

60
The final static test involved the adult male laying on the ground. This test provided some information as to whether or not a human in this position (e.g., a child playing in a driveway) could be detected. While an adult was more likely to be detected by the systems (due to their size) than a child would, it was decided not to encourage child subjects to lie behind the car, even for the purposes of this testing.
For each trial, the adult male subject laid parallel to the bumper of the system-equipped vehicle. For each lateral row of the grid, three locations were tested with the subject: laying centered 3 feet left of the vehicle centerline, centered on the vehicle centerline, and centered 3 feet right of the vehicle centerline.
Figure 32 contains the results of these trials. Most systems were found to detect the adult male in sporadic locations only. The Cadillac Escalade detected him in a consistent band (across all three lateral positions) from approximately 4 to 7 feet from the vehicle’s bumper. The Audiovox system detected the adult male laying on the ground in the most locations between 2 and 7 feet to the rear of the vehicle’s bumper.
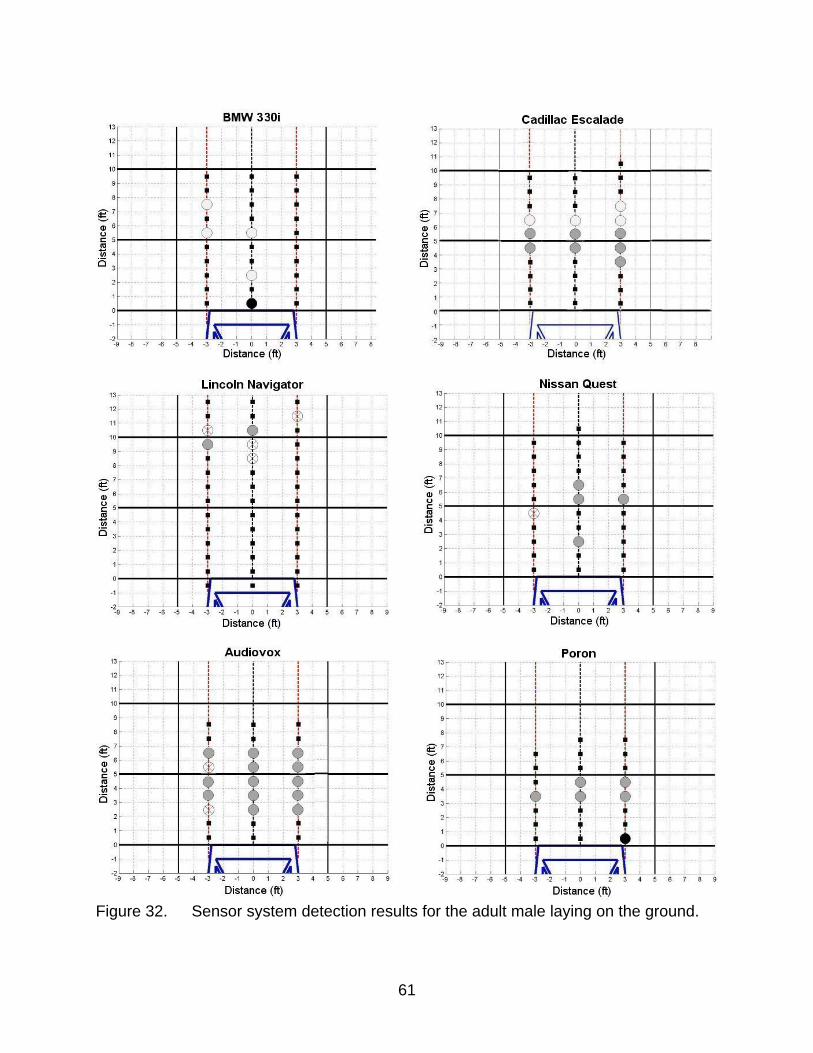
61
Figure 32. Sensor system detection results for the adult male laying on the ground.
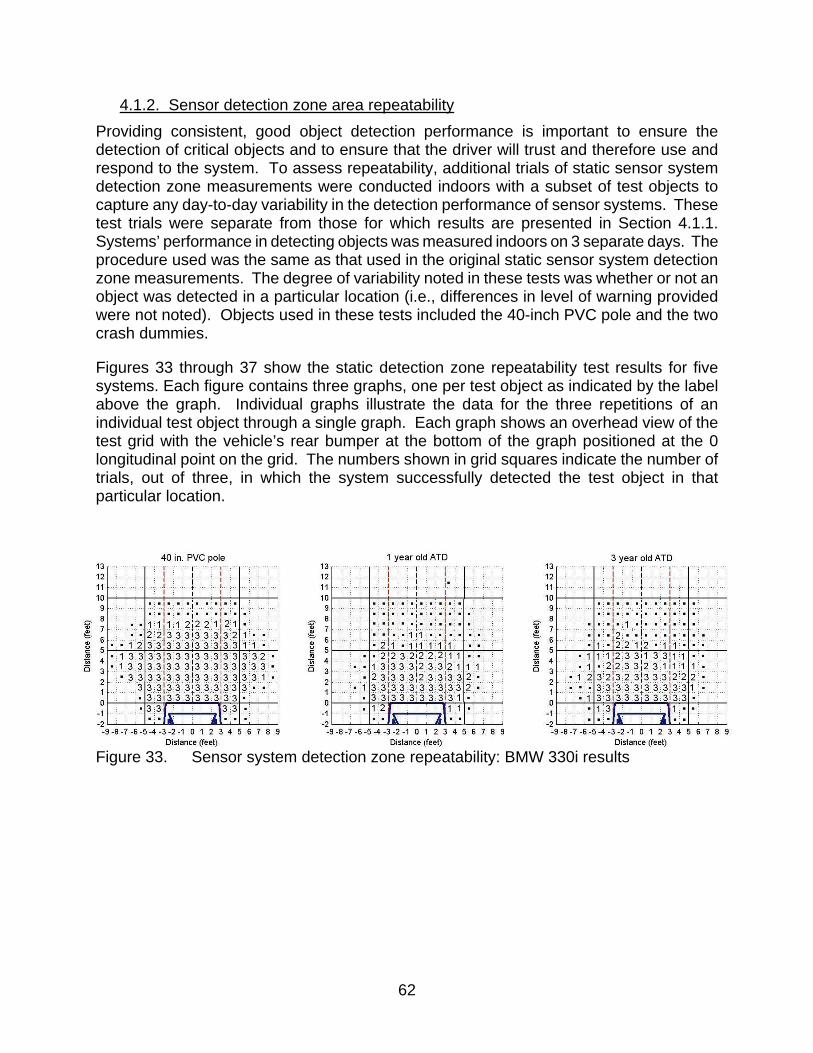
62
4.1.2. Sensor detection zone area repeatability Providing consistent, good object detection performance is important to ensure the detection of critical objects and to ensure that the driver will trust and therefore use and respond to the system. To assess repeatability, additional trials of static sensor system detection zone measurements were conducted indoors with a subset of test objects to capture any day-to-day variability in the detection performance of sensor systems. These test trials were separate from those for which results are presented in Section 4.1.1. Systems’ performance in detecting objects was measured indoors on 3 separate days. The procedure used was the same as that used in the original static sensor system detection zone measurements. The degree of variability noted in these tests was whether or not an object was detected in a particular location (i.e., differences in level of warning provided were not noted). Objects used in these tests included the 40-inch PVC pole and the two crash dummies.
Figures 33 through 37 show the static detection zone repeatability test results for five systems. Each figure contains three graphs, one per test object as indicated by the label above the graph. Individual graphs illustrate the data for the three repetitions of an individual test object through a single graph. Each graph shows an overhead view of the test grid with the vehicle’s rear bumper at the bottom of the graph positioned at the 0 longitudinal point on the grid. The numbers shown in grid squares indicate the number of trials, out of three, in which the system successfully detected the test object in that particular location.
Figure 33. Sensor system detection zone repeatability: BMW 330i results

63
Figure 34. Sensor system detection zone repeatability: Escalade results
Figure 35. Sensor system detection zone repeatability: Navigator results
Figure 36. Sensor system detection zone repeatability: Quest results
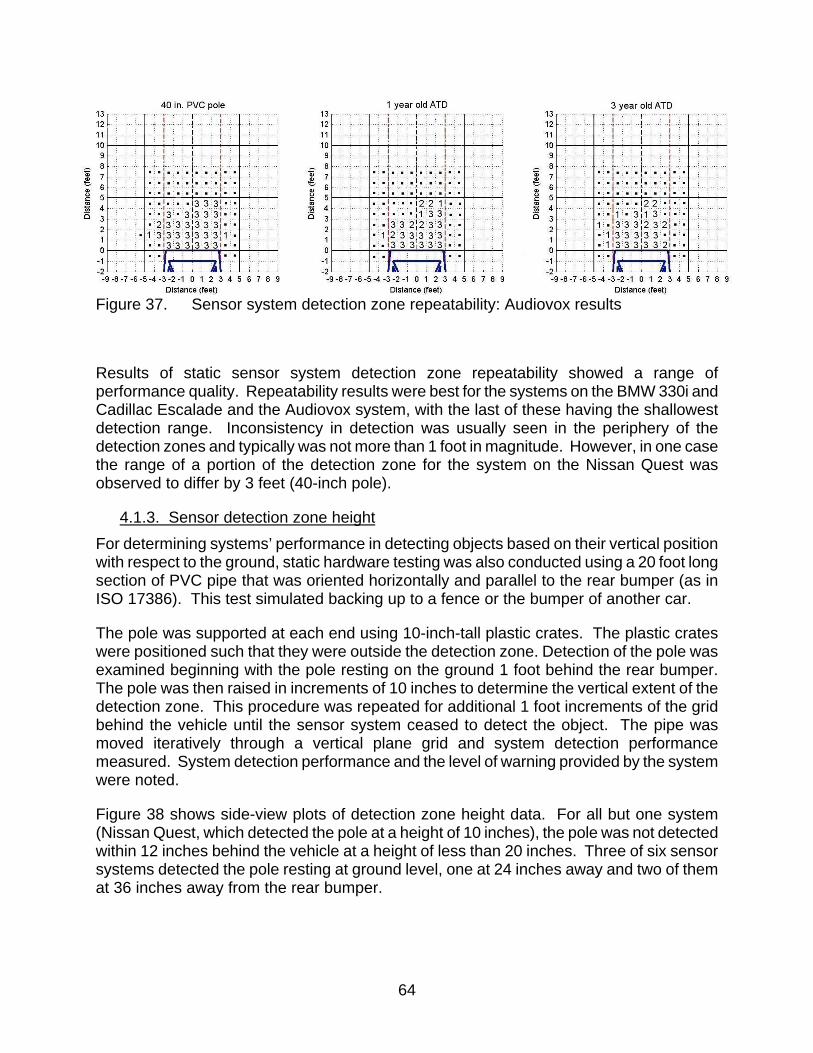
64
Figure 37. Sensor system detection zone repeatability: Audiovox results
Results of static sensor system detection zone repeatability showed a range of performance quality. Repeatability results were best for the systems on the BMW 330i and Cadillac Escalade and the Audiovox system, with the last of these having the shallowest detection range. Inconsistency in detection was usually seen in the periphery of the detection zones and typically was not more than 1 foot in magnitude. However, in one case the range of a portion of the detection zone for the system on the Nissan Quest was observed to differ by 3 feet (40-inch pole).
4.1.3. Sensor detection zone height For determining systems’ performance in detecting objects based on their vertical position with respect to the ground, static hardware testing was also conducted using a 20 foot long section of PVC pipe that was oriented horizontally and parallel to the rear bumper (as in ISO 17386). This test simulated backing up to a fence or the bumper of another car.
The pole was supported at each end using 10-inch-tall plastic crates. The plastic crates were positioned such that they were outside the detection zone. Detection of the pole was examined beginning with the pole resting on the ground 1 foot behind the rear bumper. The pole was then raised in increments of 10 inches to determine the vertical extent of the detection zone. This procedure was repeated for additional 1 foot increments of the grid behind the vehicle until the sensor system ceased to detect the object. The pipe was moved iteratively through a vertical plane grid and system detection performance measured. System detection performance and the level of warning provided by the system were noted.
Figure 38 shows side-view plots of detection zone height data. For all but one system (Nissan Quest, which detected the pole at a height of 10 inches), the pole was not detected within 12 inches behind the vehicle at a height of less than 20 inches. Three of six sensor systems detected the pole resting at ground level, one at 24 inches away and two of them at 36 inches away from the rear bumper.

65
Figure 38. Sensor system detection zone height results

66
4.1.4. Parking Curb Detection Sensor-based systems were tested to measure their performance in detecting a parking curb. This test scenario would provide information about whether parking curbs or other low to the ground objects, which some might consider a nuisance alarm since the driver should already be aware of its presence or not be too concerned with it, are typically detected by backing systems.
The parking curb used was composed of plastic and had dimensions 70 inches long by 5 7/8 inches wide by 3 5/8 inches tall. Five systems (four ultrasonic systems and one radar-ultrasonic hybrid system; this test was not performed with the Poron) were subjected to this test. The curb was placed on the ground parallel to the vehicle’s rear bumper and center on the vehicle’s centerline. The curb was first placed 1 foot from the bumper, then moved back in 1 foot increments and the system’s response to the curb in each location was noted. All systems detected the parking curb at one or more locations between 3 and 7 feet aft of the vehicle’s rear bumper. All systems detected the curb in at least two locations except for the Lincoln Navigator, which only detected it at a distance of 4 feet from the bumper.
4.2. DYNAMIC TESTS
Sensor system detection performance was also measured in controlled dynamic test scenarios. A majority of these tests were performed with the vehicle stationary and the test object moving, using a subset of test objects as well as human subjects. The remaining few tests involved the system-equipped vehicle backing at a slow speed toward a stationary test object.
4.2.1. Dynamic Tests with the Vehicle Stationary: Non-Human Test Objects Test objects (non-human) included the ISO pole and 1-year-old and 3-year-old crash dummies. Test objects were moved horizontally across the lines of the test grid, parallel to the vehicle’s rear bumper, using the apparatus described in Section 3.3.
Dynamic test object speeds were chosen to span a range of pedestrian walking speeds. Information on average human walking speed was found to primarily relate to signalized intersection crosswalk timing. The Manual on Uniform Traffic Control Devices (MUTCD) [12] suggests 4 feet per second (2.73 mph) as a normal walking speed value for use in coordinating traffic signal timing. A study by Milazzo et al [13] noted average walking speeds at unsignalized intersections to be 5.7 feet per second (3.89 mph) for young pedestrians, 4.9 feet per second (3.34 mph) for middle-aged pedestrians, and 3.8 feet per second (2.59 mph) for elderly pedestrians. Another study by Chou et al [14] found the walking velocity of normal 5-year-old children was 101 cm/s, or 2.26 mph. Based on these references, tests were conducted with the objects moving at 2, 3, and 4 mph for these test objects.
Table 6 summarizes the results of dynamic test trials for non-human test objects.

67
Table 6. Sensor System Detection Range (ft) – Dynamic: Non-Human Test Objects
40-inch Pole ATD 1 yr old ATD 3 yr old
2
mph 3
mph 4
mph 2
mph 3
mph 4
mph 2
mph 3
mph 4
mph 2006 BMW 330i 7 8 8 7 7 7 6 5 6 2007 Cadillac Escalade 7 8 8 6 4 2 2 2 2 2005 Lincoln Navigator 3 3 3 10 10 10 10 10 10 2005 Nissan Quest 6 6 6 2 2 ND ND 1 1 Audiovox 7 6 N/A 6 5 N/A 5 4 N/A Guardian Alert, X-band 4 3 5 4 5 4 5 6 5 Guardian Alert, K-band 9 9 N/A 9 9 N/A 11 11 N/A Poron 4 4 4 2 2 ND 2 ND ND Note: ND indicates “Not Detected”; N/A indicates that the test was not run for that system.
Dynamic sensor system detection performance testing showed that all systems detected the 40-inch tall PVC pole within their stated detection ranges. Dynamic detection ranges for the 40-inch pole generally matched those seen in static testing for all systems. Speed did not seem to noticeably impact detection range for this object. The Guardian Alert K-band radar system detected this object at the greatest measured dynamic range of 9 feet.
The BMW and Audiovox systems detected the 1-year-old ATD at somewhat greater range in the dynamic trials than they had in the static trials. Conversely, the Escalade, Quest, and Poron systems exhibited shorter detection ranges when the 1-year-old ATD was moving than they had when it was stationary. Given that each of the systems just mentioned used ultrasonic sensor technology, it is not clear what the source of the disparity in detection range performance may be. The 2 feet dynamic detection range exhibited for this object by the Poron system was particularly poor. The Nissan Quest and Poron systems did not detect the 1-year-old ATD in the 4 mph (object speed) test trials. The Lincoln Navigator ultrasonic-radar hybrid system detected this object at the greatest measured dynamic range of 10 feet.
For the 3-year-old ATD, the Lincoln Navigator and Audiovox systems exhibited dynamic detection ranges that matched their static results. Like the 1-year-old ATD, the dynamic range observed was greater for the BMW 330i and less for the Cadillac Escalade than their corresponding static test range results. The Nissan Quest had exhibited worse performance in detecting the 3-year-old ATD than it had for the 1-year-old ATD, which is contrary to expectation given the size difference between the two objects. For this test object, the Nissan Quest did not detect the object at 2 mph and the Poron systems did not detect the 3-year-old ATD in the 3 or 4 mph test trials. The Guardian Alert K-band radar system detected this object at the greatest measured dynamic range of 11 feet.
4.2.2. Dynamic Tests with the Vehicle Stationary: Human Subjects Trials with human test objects involved an adult male (6 feet 1 in, 190 lbs), and 3-year-old and 1-year-old children. All trials with children were conducted indoors, while trials involving the adult male were conducted both indoors and outdoors for comparison

68
purposes. Trials involving the subjects walking were conducted at self-selected, “comfortable” speeds. All walking trials were conducted with the subject walking laterally with respect to the rear of the vehicle, except for the adult male who also walked longitudinally and diagonally. Three-year-old child subjects also participated in trials in which they ran at a self-selected speed behind the vehicle. Both the 3-year-old and 1-year-old children participated in trials in which they rode a non-powered “ride-on toy” behind the vehicle. The 3-year-old children used a pedaled ride-on toy (e.g., “Big Wheel”) and in most cases pushed with their feet to move the toy forward due to their short legs. The 1-year-olds rode a slightly smaller toy and were pulled behind the system-equipped test vehicle by a member of the test staff pulling the toy vehicle with a string. While a total of two 1-year-old children and three 3-year-old children participated in the testing, data reported are for one child of each age for which a complete set of data for all tests was obtained over multiple days.
Results for dynamic test trials with human subjects are presented in Table 7.
Table 7. Sensor System Detection Range (ft) – Dynamic: Human Subjects Child 1 yr old Child 3 yr old Adult Walking
Walk Pushed
Ride-On Toy Walk Run
Pedaled Ride-On
Toy Indoor Outdoor 2006 BMW 330i 6 8 6 5 7 6 7 2007 Cadillac Escalade 4 7 5 2 7 5 7
2005 Lincoln Navigator 11 11 11 11 11 11 11
2005 Nissan Quest 3 7 2 ND 7 3 5 Audiovox 6 7 5 5 6 7 7 Guardian Alert, X-band 4 4 4 3 3 9 9
Guardian Alert, K-band 7 6 10 10 9 10 8
Poron 2 N/A (Malfunction) 2 2 5 N/A
(Malfunction) N/A
(Malfunction) Note: ND indicates “Not Detected”; N/A indicates that the test was not run for that system.
Results for the 1-year-old child dynamic detection range tests matched their corresponding static test results, except for the BMW and Audiovox systems for which the dynamic detection ranges were slightly larger in the dynamic tests. Dynamic detection ranges for the 1-year-old child were from 2 to 4 feet for half of the systems. The Lincoln Navigator ultrasonic-radar hybrid system detected the 1-year-old child subject at the greatest measured dynamic range of 11 feet.
As was found with the 1-year-old child, the Lincoln Navigator ultrasonic-radar hybrid system detected the 3-year-old child subject at the greatest measured dynamic range of 11 feet.
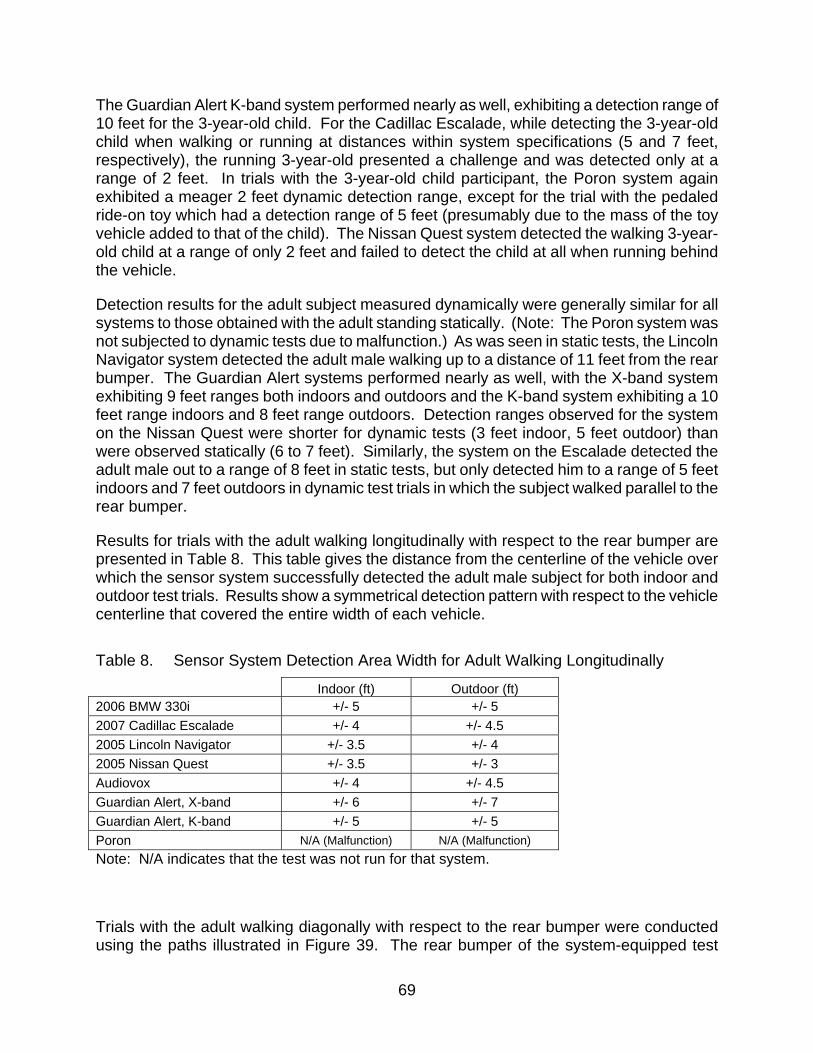
69
The Guardian Alert K-band system performed nearly as well, exhibiting a detection range of 10 feet for the 3-year-old child. For the Cadillac Escalade, while detecting the 3-year-old child when walking or running at distances within system specifications (5 and 7 feet, respectively), the running 3-year-old presented a challenge and was detected only at a range of 2 feet. In trials with the 3-year-old child participant, the Poron system again exhibited a meager 2 feet dynamic detection range, except for the trial with the pedaled ride-on toy which had a detection range of 5 feet (presumably due to the mass of the toy vehicle added to that of the child). The Nissan Quest system detected the walking 3-year-old child at a range of only 2 feet and failed to detect the child at all when running behind the vehicle.
Detection results for the adult subject measured dynamically were generally similar for all systems to those obtained with the adult standing statically. (Note: The Poron system was not subjected to dynamic tests due to malfunction.) As was seen in static tests, the Lincoln Navigator system detected the adult male walking up to a distance of 11 feet from the rear bumper. The Guardian Alert systems performed nearly as well, with the X-band system exhibiting 9 feet ranges both indoors and outdoors and the K-band system exhibiting a 10 feet range indoors and 8 feet range outdoors. Detection ranges observed for the system on the Nissan Quest were shorter for dynamic tests (3 feet indoor, 5 feet outdoor) than were observed statically (6 to 7 feet). Similarly, the system on the Escalade detected the adult male out to a range of 8 feet in static tests, but only detected him to a range of 5 feet indoors and 7 feet outdoors in dynamic test trials in which the subject walked parallel to the rear bumper.
Results for trials with the adult walking longitudinally with respect to the rear bumper are presented in Table 8. This table gives the distance from the centerline of the vehicle over which the sensor system successfully detected the adult male subject for both indoor and outdoor test trials. Results show a symmetrical detection pattern with respect to the vehicle centerline that covered the entire width of each vehicle.
Table 8. Sensor System Detection Area Width for Adult Walking Longitudinally
Indoor (ft) Outdoor (ft) 2006 BMW 330i +/- 5 +/- 5 2007 Cadillac Escalade +/- 4 +/- 4.5 2005 Lincoln Navigator +/- 3.5 +/- 4 2005 Nissan Quest +/- 3.5 +/- 3 Audiovox +/- 4 +/- 4.5 Guardian Alert, X-band +/- 6 +/- 7 Guardian Alert, K-band +/- 5 +/- 5 Poron N/A (Malfunction) N/A (Malfunction) Note: N/A indicates that the test was not run for that system.
Trials with the adult walking diagonally with respect to the rear bumper were conducted using the paths illustrated in Figure 39. The rear bumper of the system-equipped test
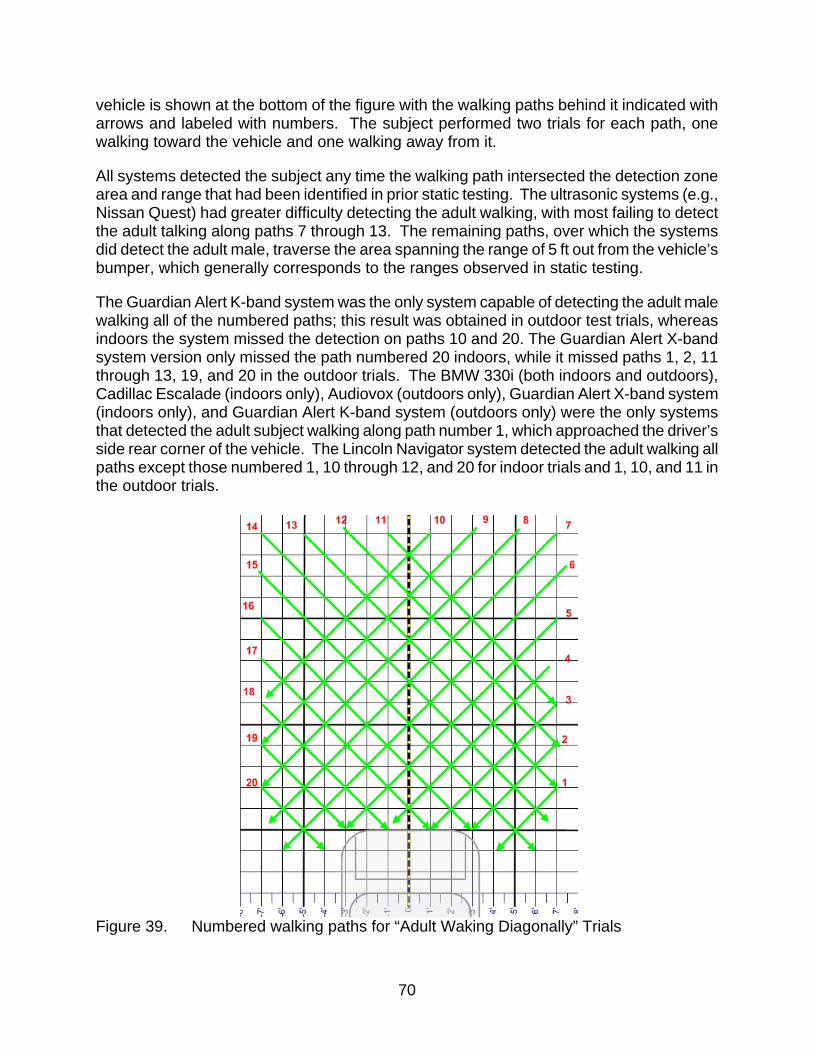
70
vehicle is shown at the bottom of the figure with the walking paths behind it indicated with arrows and labeled with numbers. The subject performed two trials for each path, one walking toward the vehicle and one walking away from it.
All systems detected the subject any time the walking path intersected the detection zone area and range that had been identified in prior static testing. The ultrasonic systems (e.g., Nissan Quest) had greater difficulty detecting the adult walking, with most failing to detect the adult talking along paths 7 through 13. The remaining paths, over which the systems did detect the adult male, traverse the area spanning the range of 5 ft out from the vehicle’s bumper, which generally corresponds to the ranges observed in static testing.
The Guardian Alert K-band system was the only system capable of detecting the adult male walking all of the numbered paths; this result was obtained in outdoor test trials, whereas indoors the system missed the detection on paths 10 and 20. The Guardian Alert X-band system version only missed the path numbered 20 indoors, while it missed paths 1, 2, 11 through 13, 19, and 20 in the outdoor trials. The BMW 330i (both indoors and outdoors), Cadillac Escalade (indoors only), Audiovox (outdoors only), Guardian Alert X-band system (indoors only), and Guardian Alert K-band system (outdoors only) were the only systems that detected the adult subject walking along path number 1, which approached the driver’s side rear corner of the vehicle. The Lincoln Navigator system detected the adult walking all paths except those numbered 1, 10 through 12, and 20 for indoor trials and 1, 10, and 11 in the outdoor trials.
Figure 39. Numbered walking paths for “Adult Waking Diagonally” Trials

71
One outdoor, controlled-speed dynamic sensor system detection performance test scenario was performed involving a toy car, called a “Cozy Coupe®” (made by the Little Tikes Company). The toy car was moved across the lines of the outdoor test grid using the pulley system. Trials with this test object were conducted at 2 and 3 mph. Figure 40 shows a photograph of the toy car test scenario.
Figure 40. Photograph of toy car outdoor dynamic test trial
The toy car was well detected by all systems with detection ranges seen from 6 feet (Guardian Alert, X-band) to 11 feet (Lincoln Navigator). As shown in Table 9, detection ranges were identical across the two test speeds for all systems except the Guardian Alert, K-band system, which detected the toy car 1 foot further out at 2 mph than it did at 3 mph.
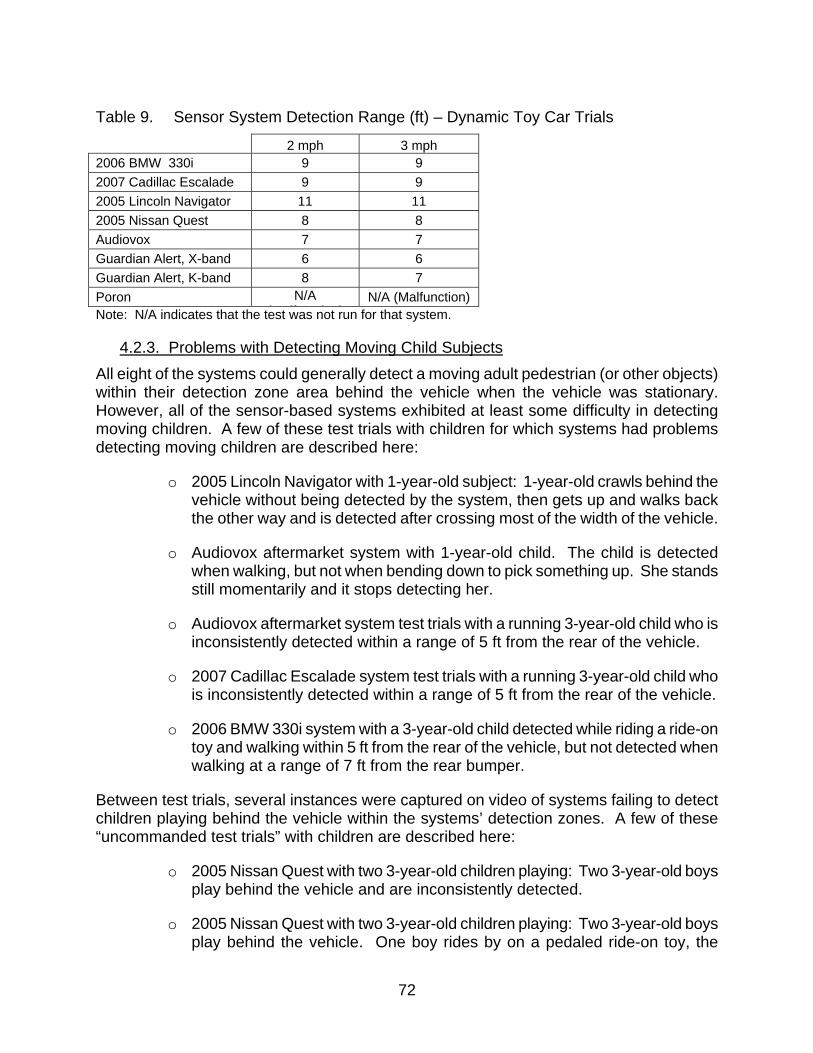
72
Table 9. Sensor System Detection Range (ft) – Dynamic Toy Car Trials
2 mph 3 mph 2006 BMW 330i 9 9 2007 Cadillac Escalade 9 9 2005 Lincoln Navigator 11 11 2005 Nissan Quest 8 8 Audiovox 7 7 Guardian Alert, X-band 6 6 Guardian Alert, K-band 8 7 Poron N/A
(M lf ti )N/A (Malfunction)
Note: N/A indicates that the test was not run for that system.
4.2.3. Problems with Detecting Moving Child Subjects All eight of the systems could generally detect a moving adult pedestrian (or other objects) within their detection zone area behind the vehicle when the vehicle was stationary. However, all of the sensor-based systems exhibited at least some difficulty in detecting moving children. A few of these test trials with children for which systems had problems detecting moving children are described here:
o 2005 Lincoln Navigator with 1-year-old subject: 1-year-old crawls behind the vehicle without being detected by the system, then gets up and walks back the other way and is detected after crossing most of the width of the vehicle.
o Audiovox aftermarket system with 1-year-old child. The child is detected when walking, but not when bending down to pick something up. She stands still momentarily and it stops detecting her.
o Audiovox aftermarket system test trials with a running 3-year-old child who is inconsistently detected within a range of 5 ft from the rear of the vehicle.
o 2007 Cadillac Escalade system test trials with a running 3-year-old child who is inconsistently detected within a range of 5 ft from the rear of the vehicle.
o 2006 BMW 330i system with a 3-year-old child detected while riding a ride-on toy and walking within 5 ft from the rear of the vehicle, but not detected when walking at a range of 7 ft from the rear bumper.
Between test trials, several instances were captured on video of systems failing to detect children playing behind the vehicle within the systems’ detection zones. A few of these “uncommanded test trials” with children are described here:
o 2005 Nissan Quest with two 3-year-old children playing: Two 3-year-old boys play behind the vehicle and are inconsistently detected.
o 2005 Nissan Quest with two 3-year-old children playing: Two 3-year-old boys play behind the vehicle. One boy rides by on a pedaled ride-on toy, the

73
system detects him, and then he moves out of view leaving the second boy still standing, vulnerable behind the vehicle approximately 5 feet away without any response from the system.
o Poron aftermarket system with 1-year old and 3-year-old children playing: The system initially detects a PVC pole the children are playing with, then it detects the 1-year-old, then it stops detecting altogether.
Video recordings of these scenarios are available and can be obtained from Docket No. NHTSA-2006-25579 or from the NHTSA web site.
Figure 41. Photograph of car backing to a car scenario
4.2.4. Dynamic Tests with the Vehicle in Motion Tests were conducted in which each system-equipped vehicle was backed up to another vehicle (a Toyota Camry, as pictured in Figure 41) and a 36-inch-tall traffic cone. All systems detected the vehicle, except the Poron system for which this test could not be performed due to prior malfunction.
Table 10 gives the approximate distance at which the warning was first presented. These range values track closely with those obtained for static detection zone, with two exceptions. First, the Lincoln Navigator detected the car at a distance 6.5 feet further than that observed for any of the static test objects. Second, in the outdoor dynamic test scenario the BMW 330i detected the 36-inch cone at a distance of approximately 6 feet greater than it detected any object in any other test scenario.
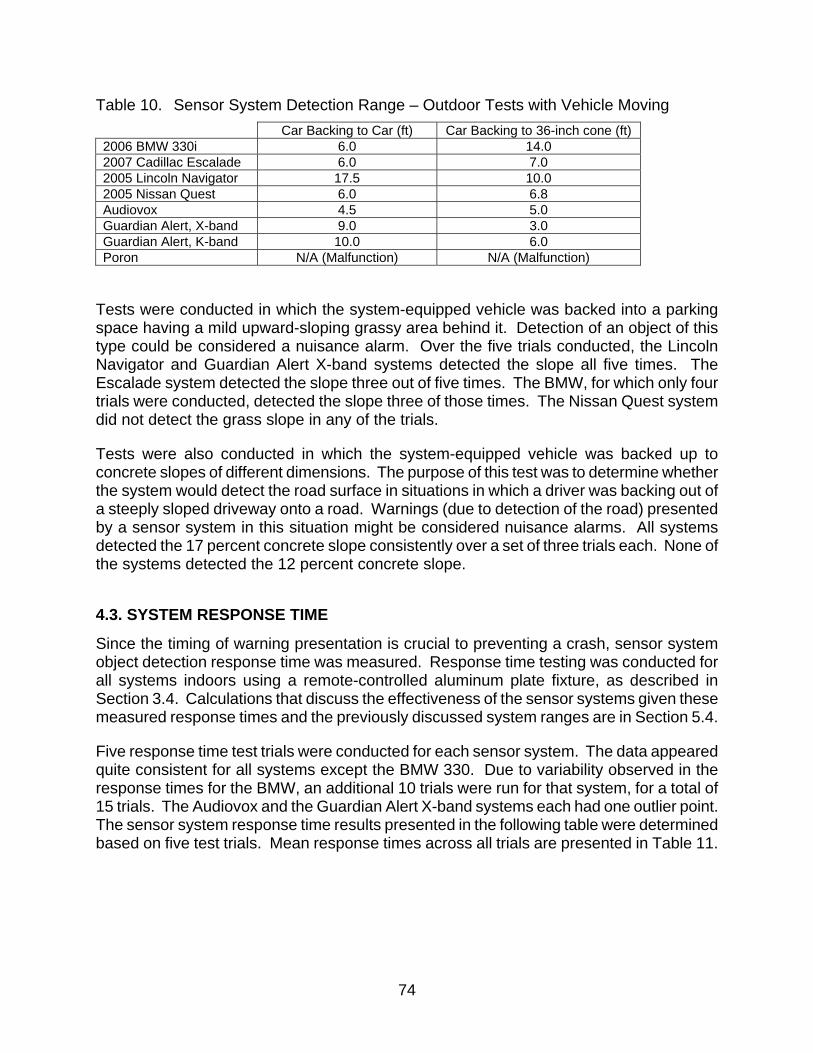
74
Table 10. Sensor System Detection Range – Outdoor Tests with Vehicle Moving Car Backing to Car (ft) Car Backing to 36-inch cone (ft)
2006 BMW 330i 6.0 14.0 2007 Cadillac Escalade 6.0 7.0 2005 Lincoln Navigator 17.5 10.0 2005 Nissan Quest 6.0 6.8 Audiovox 4.5 5.0 Guardian Alert, X-band 9.0 3.0 Guardian Alert, K-band 10.0 6.0 Poron N/A (Malfunction) N/A (Malfunction)
Tests were conducted in which the system-equipped vehicle was backed into a parking space having a mild upward-sloping grassy area behind it. Detection of an object of this type could be considered a nuisance alarm. Over the five trials conducted, the Lincoln Navigator and Guardian Alert X-band systems detected the slope all five times. The Escalade system detected the slope three out of five times. The BMW, for which only four trials were conducted, detected the slope three of those times. The Nissan Quest system did not detect the grass slope in any of the trials.
Tests were also conducted in which the system-equipped vehicle was backed up to concrete slopes of different dimensions. The purpose of this test was to determine whether the system would detect the road surface in situations in which a driver was backing out of a steeply sloped driveway onto a road. Warnings (due to detection of the road) presented by a sensor system in this situation might be considered nuisance alarms. All systems detected the 17 percent concrete slope consistently over a set of three trials each. None of the systems detected the 12 percent concrete slope.
4.3. SYSTEM RESPONSE TIME
Since the timing of warning presentation is crucial to preventing a crash, sensor system object detection response time was measured. Response time testing was conducted for all systems indoors using a remote-controlled aluminum plate fixture, as described in Section 3.4. Calculations that discuss the effectiveness of the sensor systems given these measured response times and the previously discussed system ranges are in Section 5.4.
Five response time test trials were conducted for each sensor system. The data appeared quite consistent for all systems except the BMW 330. Due to variability observed in the response times for the BMW, an additional 10 trials were run for that system, for a total of 15 trials. The Audiovox and the Guardian Alert X-band systems each had one outlier point. The sensor system response time results presented in the following table were determined based on five test trials. Mean response times across all trials are presented in Table 11.
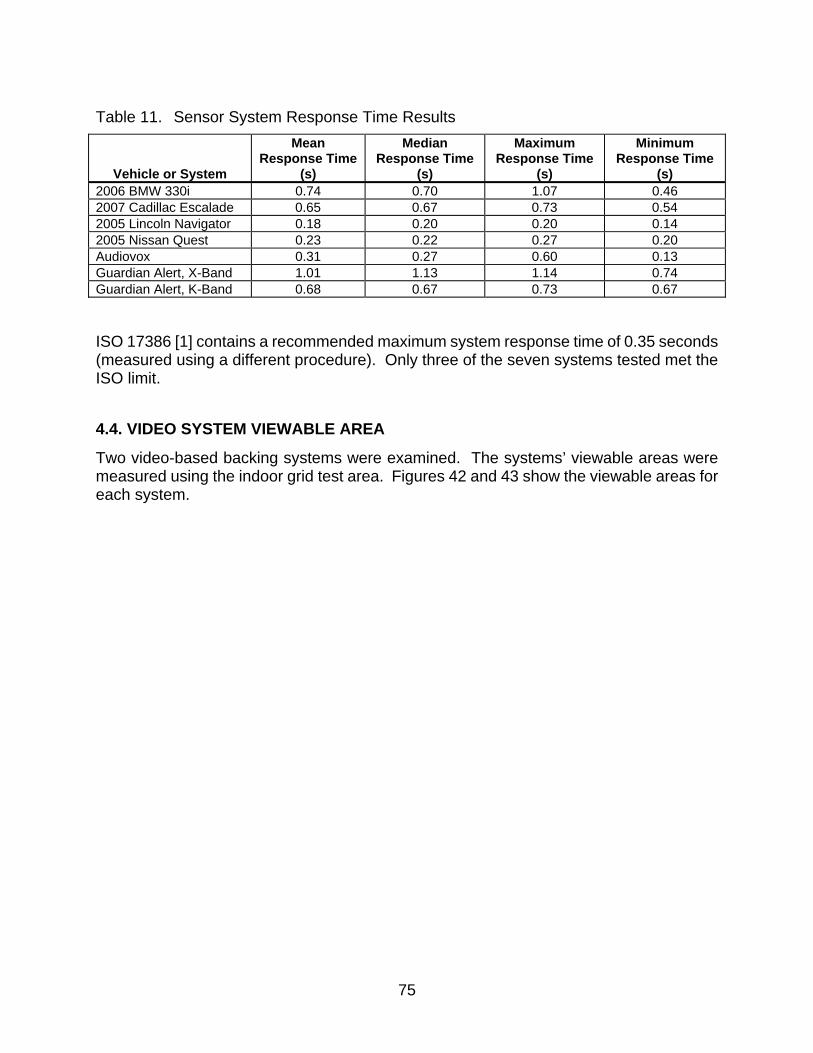
75
Table 11. Sensor System Response Time Results
Vehicle or System
Mean Response Time
(s)
Median Response Time
(s)
Maximum Response Time
(s)
Minimum Response Time
(s) 2006 BMW 330i 0.74 0.70 1.07 0.46 2007 Cadillac Escalade 0.65 0.67 0.73 0.54 2005 Lincoln Navigator 0.18 0.20 0.20 0.14 2005 Nissan Quest 0.23 0.22 0.27 0.20 Audiovox 0.31 0.27 0.60 0.13 Guardian Alert, X-Band 1.01 1.13 1.14 0.74 Guardian Alert, K-Band 0.68 0.67 0.73 0.67
ISO 17386 [1] contains a recommended maximum system response time of 0.35 seconds (measured using a different procedure). Only three of the seven systems tested met the ISO limit.
4.4. VIDEO SYSTEM VIEWABLE AREA
Two video-based backing systems were examined. The systems’ viewable areas were measured using the indoor grid test area. Figures 42 and 43 show the viewable areas for each system.

76
Figure 42. Video System Field of View: Cadillac Escalade
Figure 43. Video System Field of View: Infiniti FX35

77
Both systems provided a clear image in daylight and indoor lighted conditions. Using the Infiniti system, 1-inch-tall block letters were clearly visible in the display at distance of up to 44 inches from the rear bumper of the vehicle.
The height of the viewable area for the Infiniti system was significantly less than that of the Cadillac. The Infiniti camera along the centerline of the vehicle reached 0 feet in height at a longitudinal distance of approximately 23.5 feet from the rear bumper. In addition to limiting the field of view, as seen in Figures 44 and 45, the downward angled camera also seemed to complicate the judgment of the distance to rear objects. In addition, since the vertical upper limit of the view for this rear camera system seems to correspond to the camera height (approximately 41 inches above the ground) and slopes downward noticeably (e.g., at 2 feet from the rear bumper the view height is approximately 36 inches, as evidenced by the top of the 3-year-old ATDs head not being visible at 2 feet, as shown in Figure 44), it is possible that objects above that height (e.g., tree branch) might be missed by the driver and struck while backing. Figures 44 and 45 below illustrate the field of view height difference by showing the 3-year-old ATD pictured in both displays standing 2 feet and 10 feet, respectively, from the rear bumper.
Figure 44. 3-year-old ATD at 2 feet from rear bumper as displayed by Cadillac Escalade (left) and Infiniti FX35 (right) rear video systems.
Figure 45. 3-year-old ATD at 10 feet from rear bumper as displayed by Cadillac Escalade (left) and Infiniti FX35 (right) rear video systems.
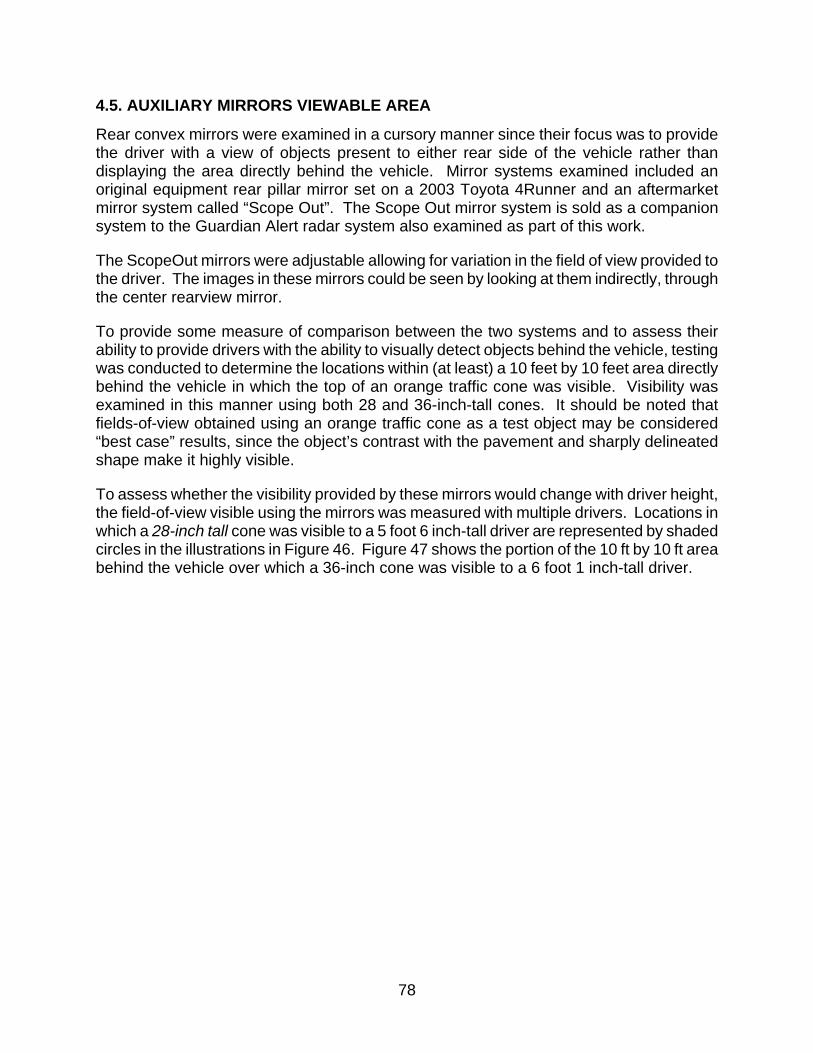
78
4.5. AUXILIARY MIRRORS VIEWABLE AREA
Rear convex mirrors were examined in a cursory manner since their focus was to provide the driver with a view of objects present to either rear side of the vehicle rather than displaying the area directly behind the vehicle. Mirror systems examined included an original equipment rear pillar mirror set on a 2003 Toyota 4Runner and an aftermarket mirror system called “Scope Out”. The Scope Out mirror system is sold as a companion system to the Guardian Alert radar system also examined as part of this work.
The ScopeOut mirrors were adjustable allowing for variation in the field of view provided to the driver. The images in these mirrors could be seen by looking at them indirectly, through the center rearview mirror.
To provide some measure of comparison between the two systems and to assess their ability to provide drivers with the ability to visually detect objects behind the vehicle, testing was conducted to determine the locations within (at least) a 10 feet by 10 feet area directly behind the vehicle in which the top of an orange traffic cone was visible. Visibility was examined in this manner using both 28 and 36-inch-tall cones. It should be noted that fields-of-view obtained using an orange traffic cone as a test object may be considered “best case” results, since the object’s contrast with the pavement and sharply delineated shape make it highly visible.
To assess whether the visibility provided by these mirrors would change with driver height, the field-of-view visible using the mirrors was measured with multiple drivers. Locations in which a 28-inch tall cone was visible to a 5 foot 6 inch-tall driver are represented by shaded circles in the illustrations in Figure 46. Figure 47 shows the portion of the 10 ft by 10 ft area behind the vehicle over which a 36-inch cone was visible to a 6 foot 1 inch-tall driver.
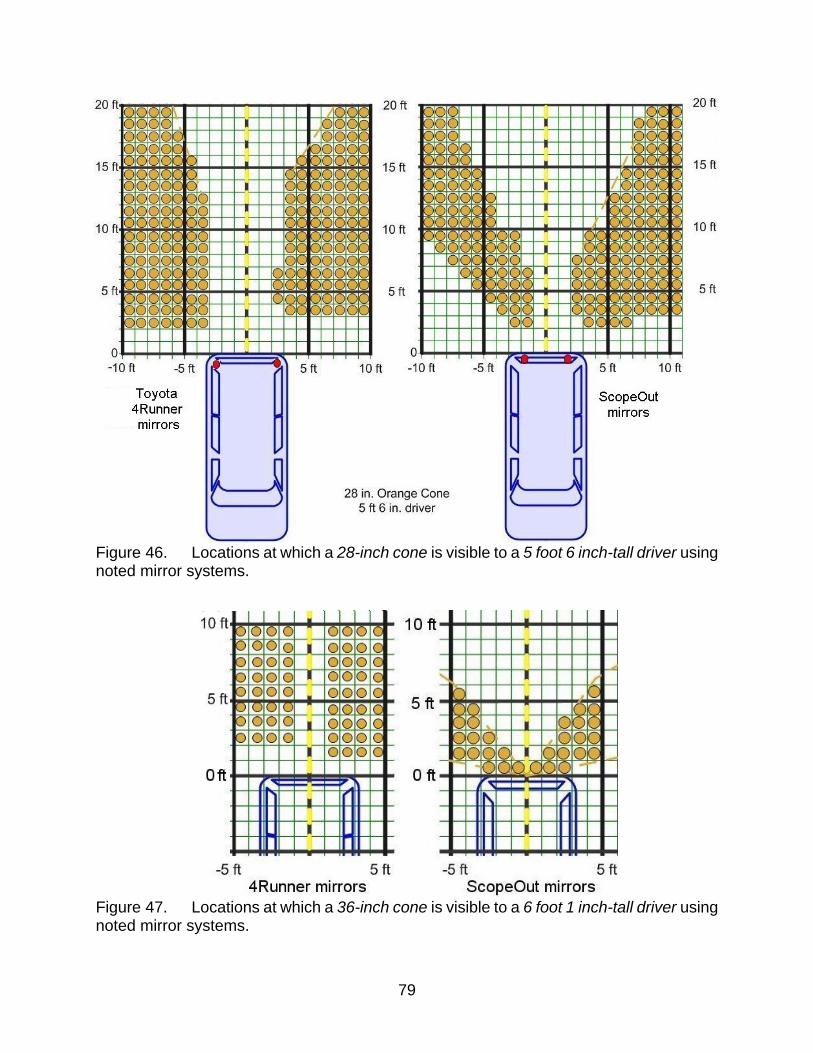
79
Figure 46. Locations at which a 28-inch cone is visible to a 5 foot 6 inch-tall driver using noted mirror systems.
Figure 47. Locations at which a 36-inch cone is visible to a 6 foot 1 inch-tall driver using noted mirror systems.

80
Some variability in the results obtained amongst these drivers is believed to be attributable to image distortion causing drivers to be unsure whether they could see the top of the cone of some other part of it. Differences in the fields-of-view for the ScopeOut mirrors seen between Figures 46 and 47 may have been attributable to differences in mirror adjustment. Using a 28-inch-tall traffic cone, neither the 5 feet 10 inch nor the 4 feet 10 inch driver could see the cone behind the vehicle with the ScopeOut mirrors. They could, however, see the 28-inch cone using the 4Runner mirrors. The areas visible behind the vehicle using the 4Runner mirrors for the 5 feet 10 inch and the 4 feet 10 inch drivers is shown in Figure 48.
Figure 48. Locations at which a 28-inch cone is visible to a 5 feet 10 inch tall driver and a 4 feet 10 inch tall driver using Toyota 4Runner rear pillar mirrors.
For the particular mirrors used in these tests, visually detecting the cone behind the car using the convex mirrors proved to be challenging for drivers. The combination of rear window tinting, head restraint location, and driver range of mobility (when belted) contributed to the difficulty. Though the mirror convexity broadened the field of view, it causes distortion of displayed objects making them more difficult to recognize in the mirror. Identifying whether or not the top of the cone could be seen required concentrated glances. A hurried driver making quick glances prior to initiating a backing maneuver might detect the presence of an object, but might not allocate sufficient dwell time to permit them to recognize the type of obstacle present and the level of threat it presents.

81
4.6. VEHICLE REAR VISIBILITY
The “baseline” rearward viewable area for all vehicles involved in backing system testing was assessed. A number of aspects of the vehicle’s design can affect rear visibility: the height of the vehicle, the location and dimensions of rear head restraints, the size of the rear pillars, and the size and shape of the rear window and wiper (if present). The driver’s eye height and range of mobility also greatly impact what they can see.
The method used was similar to that used by Consumer’s Union [10]. A 28-inch-tall traffic cone was placed behind the vehicle, and the minimum distance at which the top of the cone could be seen via direct view or center rearview mirror glance by the driver was noted.
Side-view mirrors were not used in this particular set of visibility tests, although it is possible to see areas behind the vehicle at a distance using these mirrors. Some of the vehicles used in this research (e.g., 2006 BMW 330i and 2005 Nissan Quest) had left-side, rearview mirrors that tilted downward when the vehicle transmission was placed in reverse gear. While this shift of the mirror permits the driver to see more of the area directly adjacent to the vehicle (e.g., such as for viewing pavement marking lines when backing into a parking space), it nearly eliminates the ability of this mirror to show objects behind the vehicle. In addition, side-rearview mirrors are also subject to a greater range of driver preferences in adjustment that affect field of view. Thus, to simplify testing and analysis side-rearview mirrors were not used in any field-of-view testing conducted as part of this research.
For each vehicle, minimum sight distance values were recorded for a 10 feet span across the rear of the vehicle. (Note that [10] only noted a single distance representing the closest distance at which the cone could be seen anywhere along the width of the vehicle.) A maximum distance of 100 feet to the rear of the vehicle was used. Drivers of two heights were used for these measurements, a 4 foot 10 inch tall female and a 5 foot 10 inch tall male. The two drivers used in these tests sat in the driver’s seat and wore the seat belt during the testing. Tables 12 and 13 present sight distance values obtained in these trials. For cases in which the 28-inch cone was not visible within 100 feet, “-” is listed.

82
Table 12. Sight Distance: 28-inch cone for 5’10” Driver (ft) Vehicle 5L 4L 3L 2L 1L CL 1R 2R 3R 4R 5R
BMW 330i 71 70 71 66 64 23 20 19 18 20 20 Cadillac Escalade - - - 99 89 31 32 32 41 35 31 Infiniti FX35 28 21 19 45 24 22 17 21 22 19 19 Lincoln Navigator 59 52 52 50 49 46 44 48 49 49 51 Nissan Quest 41 40 38 37 36 33 21 19 22 33 33
Direct View (e.g., glance over the shoulder)
Toyota 4Runner 22 18 23 25 19 17 16 17 18 18 21 BMW 330i 37 26 22 22 23 26 26 21 22 23 29 Cadillac Escalade 46 35 36 35 34 37 35 31 32 37 46 Infiniti FX35 38 32 24 19 18 22 19 18 19 22 31 Lincoln Navigator 42 45 39 38 39 42 43 37 45 44 45 Nissan Quest 37 36 26 24 34 36 30 25 37 38 37
Center Rearview Mirror Glance
Toyota 4Runner 22 24 17 18 22 23 19 18 18 20 21
Table 13. Sight Distance: 28-inch cone for 4’10” Driver (ft) Vehicle 5L 4L 3L 2L 1L CL 1R 2R 3R 4R 5R
BMW 330i 35 25 20 19 18 19 22 21 20 21 23 Cadillac Escalade - - 83 82 46 48 47 47 44 50 53 Infiniti FX35 49 44 37 39 25 22 24 28 35 32 35 Lincoln Navigator 61 58 61 61 61 61 58 59 55 53 54 Nissan Quest 48 51 49 36 29 29 27 30 41 53 51
Direct View (e.g., glance over the shoulder)
Toyota 4Runner 43 43 38 34 22 19 19 20 22 25 31 BMW 330i 28 22 21 19 18 24 24 21 23 25 34 Cadillac Escalade 44 43 37 38 38 42 40 36 36 37 47 Infiniti FX35 40 30 23 21 20 29 23 19 21 23 27 Lincoln Navigator 51 50 51 51 53 56 51 53 49 51 53 Nissan Quest 46 47 41 26 26 44 43 32 29 39 44
Center Rearview Mirror Glance
Toyota 4Runner 28 24 21 20 29 29 28 22 20 22 27
Results presented in Tables 12 and 13 show that neither driver could see the 28-inch cone using direct glances within 15 feet of the rear of the vehicle for any of the vehicles examined. Using the center rearview mirror, the 28-inch cone could not be seen closer than 17 feet from the rear of any vehicle.
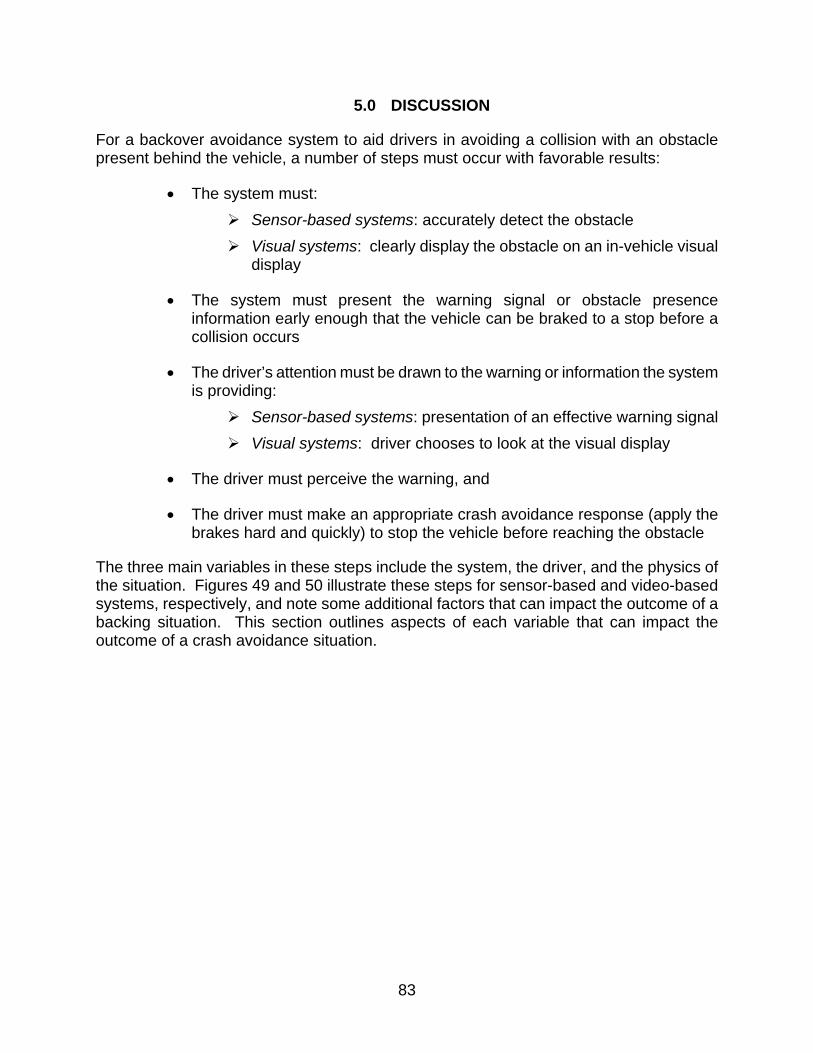
83
5.0 DISCUSSION
For a backover avoidance system to aid drivers in avoiding a collision with an obstacle present behind the vehicle, a number of steps must occur with favorable results:
• The system must: Sensor-based systems: accurately detect the obstacle Visual systems: clearly display the obstacle on an in-vehicle visual
display
• The system must present the warning signal or obstacle presence information early enough that the vehicle can be braked to a stop before a collision occurs
• The driver’s attention must be drawn to the warning or information the system is providing:
Sensor-based systems: presentation of an effective warning signal Visual systems: driver chooses to look at the visual display
• The driver must perceive the warning, and
• The driver must make an appropriate crash avoidance response (apply the brakes hard and quickly) to stop the vehicle before reaching the obstacle
The three main variables in these steps include the system, the driver, and the physics of the situation. Figures 49 and 50 illustrate these steps for sensor-based and video-based systems, respectively, and note some additional factors that can impact the outcome of a backing situation. This section outlines aspects of each variable that can impact the outcome of a crash avoidance situation.
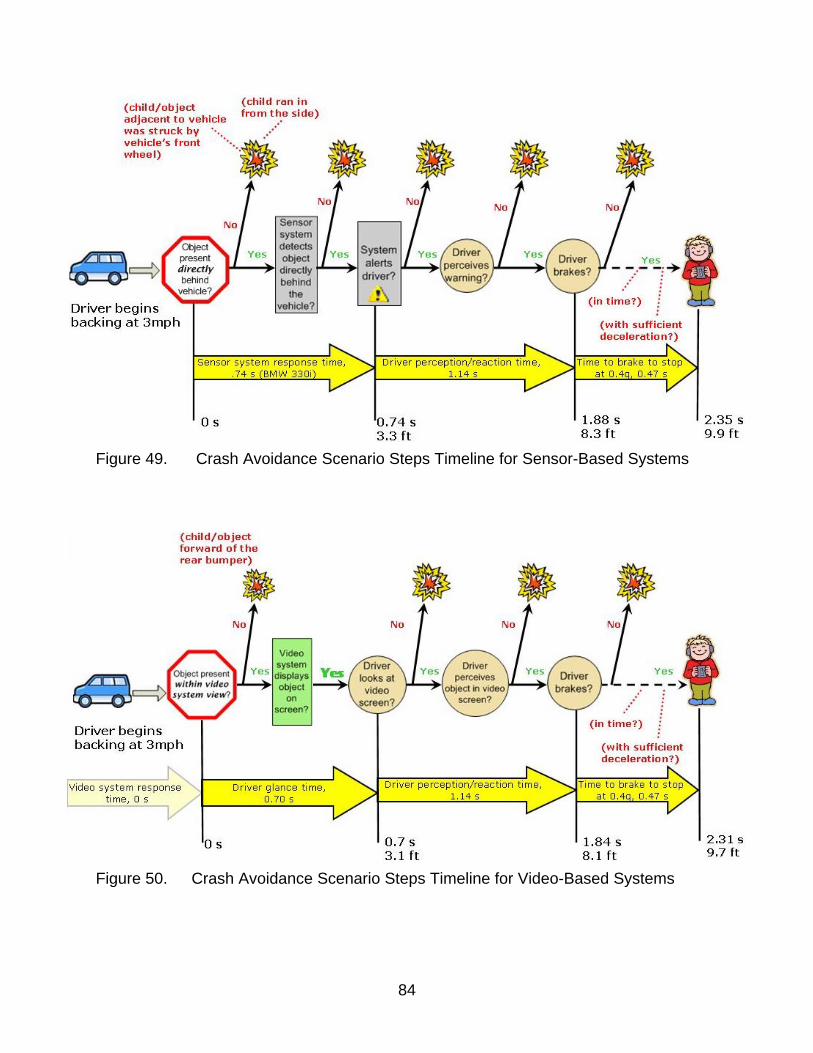
84
Figure 49. Crash Avoidance Scenario Steps Timeline for Sensor-Based Systems
Figure 50. Crash Avoidance Scenario Steps Timeline for Video-Based Systems
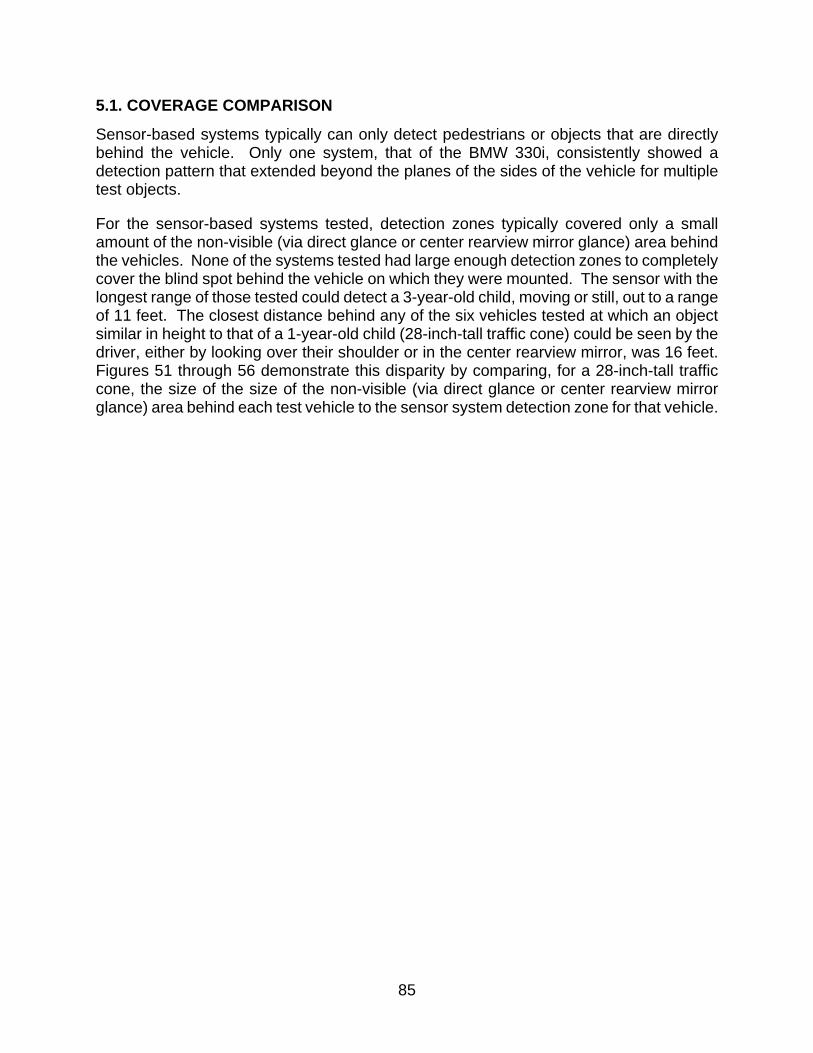
85
5.1. COVERAGE COMPARISON
Sensor-based systems typically can only detect pedestrians or objects that are directly behind the vehicle. Only one system, that of the BMW 330i, consistently showed a detection pattern that extended beyond the planes of the sides of the vehicle for multiple test objects.
For the sensor-based systems tested, detection zones typically covered only a small amount of the non-visible (via direct glance or center rearview mirror glance) area behind the vehicles. None of the systems tested had large enough detection zones to completely cover the blind spot behind the vehicle on which they were mounted. The sensor with the longest range of those tested could detect a 3-year-old child, moving or still, out to a range of 11 feet. The closest distance behind any of the six vehicles tested at which an object similar in height to that of a 1-year-old child (28-inch-tall traffic cone) could be seen by the driver, either by looking over their shoulder or in the center rearview mirror, was 16 feet. Figures 51 through 56 demonstrate this disparity by comparing, for a 28-inch-tall traffic cone, the size of the size of the non-visible (via direct glance or center rearview mirror glance) area behind each test vehicle to the sensor system detection zone for that vehicle.

86
Figure 51. System coverage areas and non-visible areas (via direct glance or center rearview mirror) for 28-inch-tall traffic cone (2007 Cadillac Escalade)
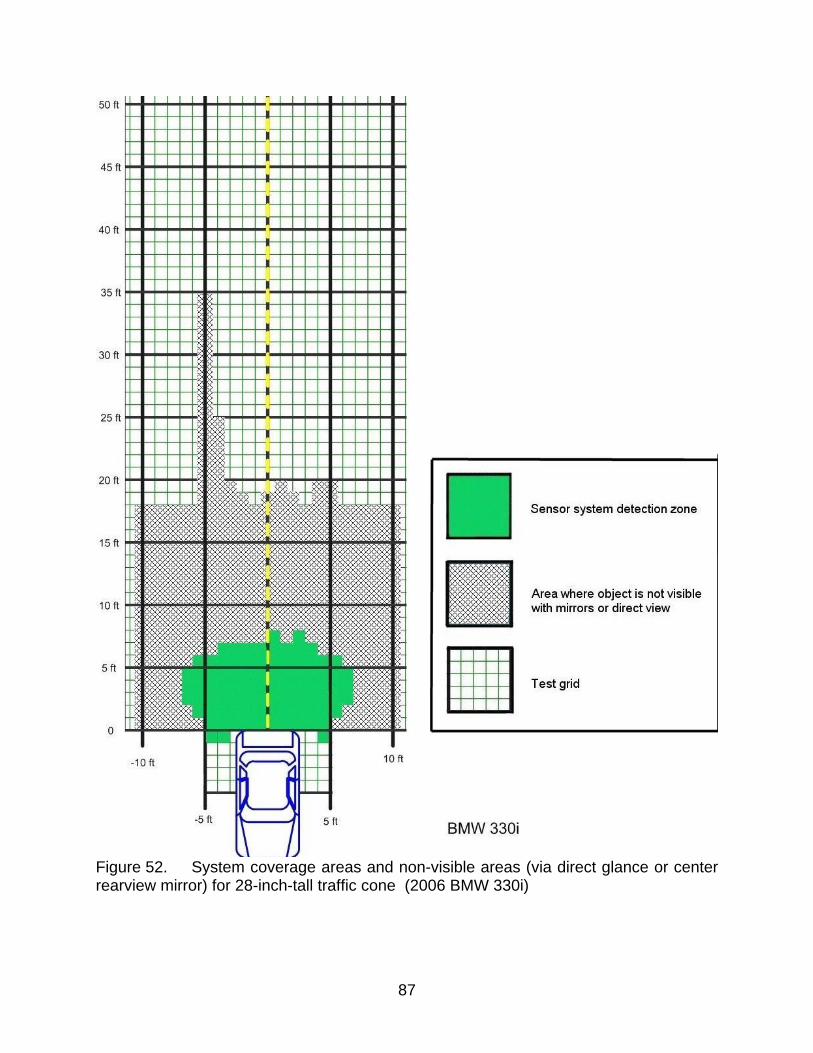
87
Figure 52. System coverage areas and non-visible areas (via direct glance or center rearview mirror) for 28-inch-tall traffic cone (2006 BMW 330i)

88
Figure 53. System coverage areas and non-visible areas (via direct glance or center rearview mirror) for 28-inch-tall traffic cone (2005 Nissan Quest)
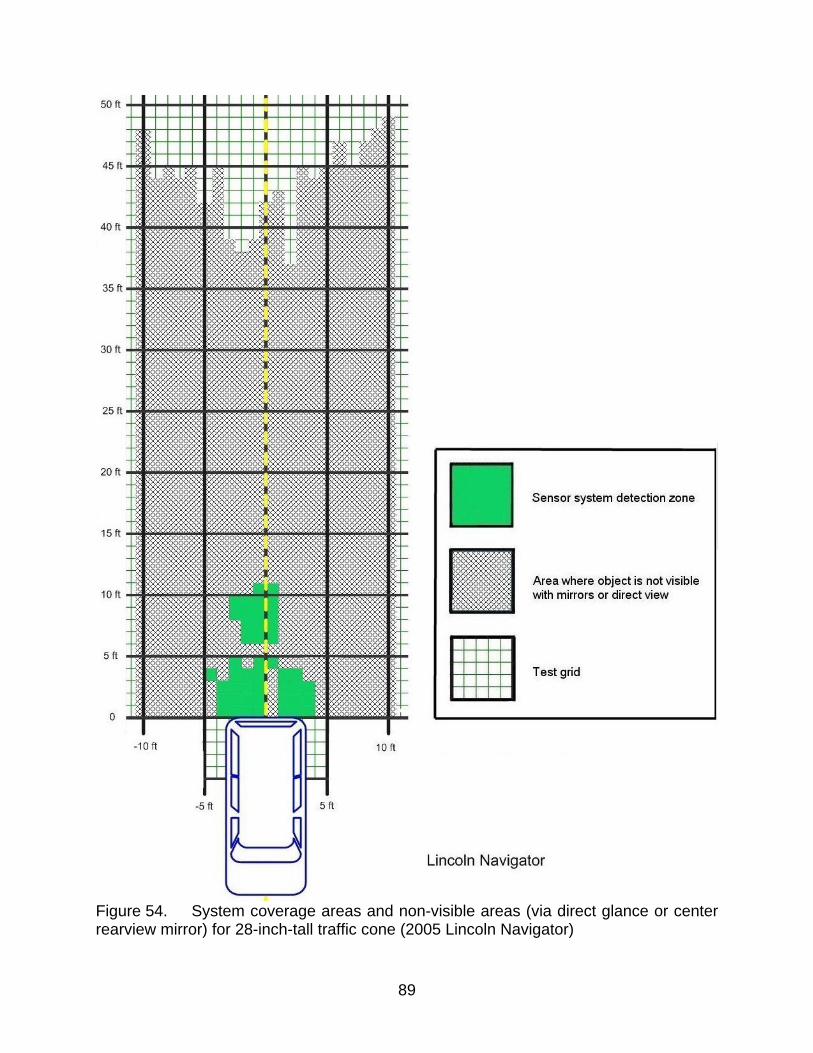
89
Figure 54. System coverage areas and non-visible areas (via direct glance or center rearview mirror) for 28-inch-tall traffic cone (2005 Lincoln Navigator)

90
Figure 55. System coverage areas and non-visible areas (via direct glance or center rearview mirror) for 28-inch-tall traffic cone (2005 Infiniti FX35)

91
Figure 56. Cross-View mirror coverage areas (for 10 foot by 10 foot area behind vehicle) and non-visible areas (via direct glance or center rearview mirror) for 28-inch-tall traffic cone (2003 Toyota 4Runner)

92
5.2. ADEQUACY OF SENSOR SYSTEM DETECTION RANGES
For a sensor-based backing system’s warning to be effective, it must be presented early enough that the driver has time in which to stop the vehicle before colliding with the obstacle. Calculations were made to determine what conditions must be met in order for collision avoidance to be possible. The parameters included in these calculations and related assumptions used are as follows.
Driver Reaction Time – The time it takes a driver to initiate brake application in response to a stimulus. The stimulus in this scenario is warning signal presented by an object detect system. A mean driver reaction time of 1.17 seconds was used based on the mean value for dry pavement given in Table 4 of [15]. This driver reaction time was used instead of the mean driver reaction time in response to warnings presented during backing (0.54 s) given in [16] because that study used alerted drivers while the driver reaction time in [15] was for unalerted drivers; a situation that is more typical of the situation in which backover avoidance technology is needed. For the uncertainty calculations, a normal distribution of driver reaction times was used with a standard deviation of 0.31 seconds. Again, this standard deviation was taken from Table 4 of [15].
System Response Time – The elapsed time between presentation of a test object and the sensor-based system’s delivery of a warning signal, as measured in this testing (see Table 11). For the uncertainty calculations, a uniform distribution of system response times ranging from the maximum to the minimum response time in Table 11 was used.
Brake Application Time – The elapsed time between the initiation of brake application to the point when maximum deceleration of the vehicle is reached. This parameter includes both the time for the driver to apply the brake and the time for the brake system to respond to this input. A mean time of 0.25 seconds was used based on one author’s past research experience. For the uncertainty calculations, a uniform distribution of brake application times ranging from 0.20 to 0.30 seconds was used.
Maximum Deceleration – The maximum deceleration level attainable when braking the vehicle. The vehicle is assumed to decelerate at a constant rate after the initial brake application period. From the “stopping time” regression equation (Equation 2) of [16], a mean maximum deceleration of 0.32 g was calculated. For the uncertainty calculations, a uniform distribution of maximum decelerations ranging from 0.17 g to 0.47 g was used.
The first set of calculations estimated the distance in which a driver could reasonably be expected to brake to a stop from a range of initial speeds in response to a warning signal presented by a sensor-based backing system. This calculation used mean values of each of the parameters listed above. Table 14 shows the calculated distances given the assumptions noted above for system response time, driver reaction time, brake application time, and maximum deceleration.
93
Table 14. Distance in Which Drivers Could Brake To A Stop in Response to Backing System Warning
Vehicle or System
From 1.0 mph
(ft)
From 2.0 mph
(ft)
From 3.0 mph
(ft)
From 5.0 mph
(ft)
From 7.0 mph
(ft)
From 10.0 mph
(ft) BMW 330i 3.1 6.4 9.9 17.5 26.0 40.3 Cadillac Escalade 2.9 6.0 9.3 16.6 24.7 38.4 Lincoln Navigator 2.2 4.7 7.4 13.4 20.2 32.0 Nissan Quest 2.3 4.9 7.6 13.8 20.8 32.8 Guardian Alert, X-band 3.6 7.5 11.5 20.2 29.8 45.7 Guardian Alert, K-band 3.0 6.2 9.6 17.1 25.4 39.4 Audiovox 2.4 5.1 8.0 14.4 21.6 34.0
Paine and Henderson concluded in [17] that a 4 meter (13.1 feet) detection distance would be sufficient (95% avoidance probability) for a vehicle traveling 8 kph (approximately 5.0 mph). The current results are somewhat pessimistic, giving calculated stopping distances from 5.0 mph that range from 4.1 meters (13.5 feet) to 6.2 meters (20.3 feet).
The second set of calculations estimated the maximum speed from which a driver could reasonably be expected to brake to a stop in response to a system’s warning for an obstacle present at the system’s maximum detection range. For this set of calculations, Crystal Ball® software was used to perform Monte Carlo simulation while the parameters listed below were varied over reasonable ranges. The results provide both the median maximum speed and the tenth and ninetieth percentile limits for this speed.
Monte Carlo simulation was performed to quantify the range of maximum speeds from which a driver could reasonably be expected to brake to a stop without striking an obstacle. The distances shown in Table 14 were calculated based upon one Driver Reaction Time, one System Reaction Time, one Brake Application Time, and one Maximum Deceleration. However, in real life the values of these parameters will vary from stop-to-stop over a range of values. This variation in these parameters will, of course, change the maximum speed for braking to a stop. Monte Carlo simulation quantifies the range of maximum speeds.
For this calculation to be made, sensor system detection range values were needed. The decision was made to use two ranges for each system; the maximum detection range values for the 40-inch PVC pole moving at 3 mph and a walking 3-year-old child, as reported in Tables 6 and 7 of this report. For the reader’s convenience, Tables 15 and 16 repeat these maximum detection range values.
Table 15 summarizes, for each system and its corresponding maximum detection range for a walking 3-year-old child, the maximum speed from which a driver could reasonably be expected to brake to a stop if warned by the system of the child’s presence behind the vehicle.
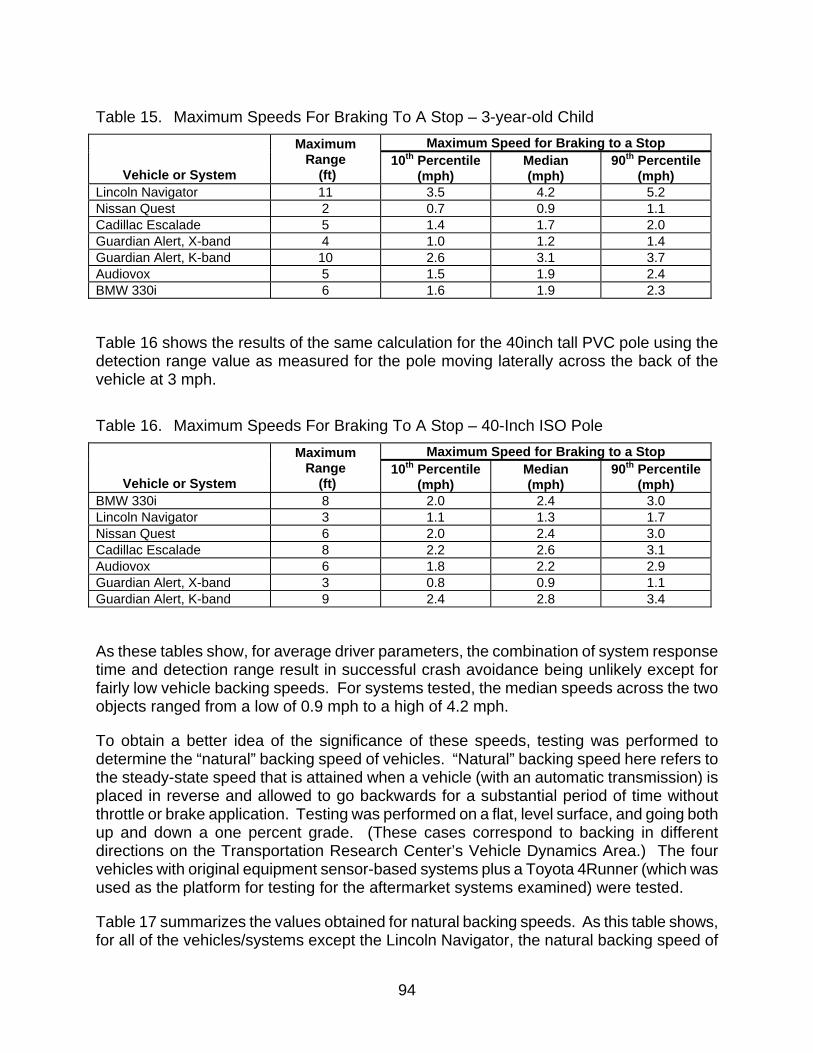
94
Table 15. Maximum Speeds For Braking To A Stop – 3-year-old Child Maximum Speed for Braking to a Stop
Vehicle or System
Maximum Range
(ft) 10th Percentile
(mph) Median (mph)
90th Percentile (mph)
Lincoln Navigator 11 3.5 4.2 5.2 Nissan Quest 2 0.7 0.9 1.1 Cadillac Escalade 5 1.4 1.7 2.0 Guardian Alert, X-band 4 1.0 1.2 1.4 Guardian Alert, K-band 10 2.6 3.1 3.7 Audiovox 5 1.5 1.9 2.4 BMW 330i 6 1.6 1.9 2.3
Table 16 shows the results of the same calculation for the 40inch tall PVC pole using the detection range value as measured for the pole moving laterally across the back of the vehicle at 3 mph.
Table 16. Maximum Speeds For Braking To A Stop – 40-Inch ISO Pole Maximum Speed for Braking to a Stop
Vehicle or System
Maximum Range
(ft) 10th Percentile
(mph) Median (mph)
90th Percentile (mph)
BMW 330i 8 2.0 2.4 3.0 Lincoln Navigator 3 1.1 1.3 1.7 Nissan Quest 6 2.0 2.4 3.0 Cadillac Escalade 8 2.2 2.6 3.1 Audiovox 6 1.8 2.2 2.9 Guardian Alert, X-band 3 0.8 0.9 1.1 Guardian Alert, K-band 9 2.4 2.8 3.4
As these tables show, for average driver parameters, the combination of system response time and detection range result in successful crash avoidance being unlikely except for fairly low vehicle backing speeds. For systems tested, the median speeds across the two objects ranged from a low of 0.9 mph to a high of 4.2 mph.
To obtain a better idea of the significance of these speeds, testing was performed to determine the “natural” backing speed of vehicles. “Natural” backing speed here refers to the steady-state speed that is attained when a vehicle (with an automatic transmission) is placed in reverse and allowed to go backwards for a substantial period of time without throttle or brake application. Testing was performed on a flat, level surface, and going both up and down a one percent grade. (These cases correspond to backing in different directions on the Transportation Research Center’s Vehicle Dynamics Area.) The four vehicles with original equipment sensor-based systems plus a Toyota 4Runner (which was used as the platform for testing for the aftermarket systems examined) were tested.
Table 17 summarizes the values obtained for natural backing speeds. As this table shows, for all of the vehicles/systems except the Lincoln Navigator, the natural backing speed of

95
the vehicle is above the maximum speed for braking to a stop without striking the object (3-year-old child).
Table 17. Natural Backing Speeds For Selected Vehicles
Vehicle Slope Steady State Speed
(mph) Steady State Speed
(kph) BMW 330i Zero Slope 4.9 7.9 BMW 330i Up 1% Slope 4.6 7.4 BMW 330i Down 1% Slope 5.3 8.5 Cadillac Escalade Zero Slope 4.0 6.5 Cadillac Escalade Up 1% Slope 3.1 5.0 Cadillac Escalade Down 1% Slope 4.9 7.8 Lincoln Navigator Zero Slope 4.0 6.5 Lincoln Navigator Up 1% Slope 3.6 5.8 Lincoln Navigator Down 1% Slope 4.9 7.8 Nissan Quest Zero Slope 4.3 6.9 Nissan Quest Up 1% Slope 3.5 5.6 Nissan Quest Down 1% Slope 5.8 9.3 Toyota 4 Runner Zero Slope 7.0 11.3 Toyota 4 Runner Up 1% Slope 5.9 9.5 Toyota 4 Runner Down 1% Slope 8.1 13.0
Additional information about vehicles speeds during backing can be found in the literature. Two studies have measured typical backing speeds. Huey et al. [2] found in a study of naturalistic backing behavior that “typical parking lot types of tasks all had slow maximum backing speeds (less than 7.0 mph, 10.3 feet per second). The mean maximum backing speed for those tasks was around 3.0 mph (4.4 feet per second).” In a 1996 study of driver reaction time to warnings during backing [16], mean backing speed for alerted drivers was 2.6 mph (SD 2.2).
A study sponsored by NHTSA [18] examined approximately 200 police accident reports corresponding to backing crash entries in the 1992 GES database. Fifty of these reports were for crashes in which the backing vehicle struck a pedestrian. Backing speed distributions were extracted from the available data. This analysis found that in approximately 90 percent of the fifty backing crashes with pedestrians, the striking vehicle was traveling at 5 mph or slower.
Based on these points, the combination of system response times and detection range values result in successful crash avoidance being unlikely except for fairly low vehicle backing speeds. For the ultrasonic sensor-based systems tested, the calculated median maximum speeds for braking to a stop for a 3-year-old child for these systems were all below 2.0 mph. This indicates that the maximum detection range for ultrasonic sensor-based systems tested was insufficient to prevent a backover situation in which the obstacle is a 3-year-old child. Based on the analysis in [18], only about 50 percent of the vehicles that back into pedestrians are traveling at speeds below 2.0 mph. The situation for the radar-based sensor systems is slightly better, but still poor. Again, based on the analysis in [18], a system should have a maximum detection range that facilitates warning the driver in

96
time for them to brake to a stop from at least 5 mph to avoid colliding with a 3-year-old child.
5.3. FACTORS AFFECTING SYSTEM PERFORMANCE
The testing documented in this report assessed the current state of sensor technology performance in the detection of objects, particularly children, at short range behind vehicles. The testing was conducted in a controlled, laboratory setting. However, in everyday driving, a variety of factors can impact sensor performance and system effectiveness. Some of these factors are described below.
The degree and quality of coverage provided by sensor or video systems is critical in accurately informing the driver of rear obstacles that may present a collision threat. Sensor systems detect certain objects better than others and some objects at closer range than others. Drivers may have difficulty realizing that a system may detect another vehicle at a range of 10 feet, but can only detect a small child to a distance of 3 feet. To complicate matters, some systems may detect a child at a certain distance in one location behind the vehicle, but not detect the child at the same distance if they take a step to one side. Care must be taken to ensure that the backover system’s object detection strategy is understandable to drivers.
The degree of motion of the obstacle also affects sensor systems’ ability to detect it. Sensor systems appear more likely to detect slowly moving objects than stationary ones. Even small motions, such as a young child standing still but moving a hand, can impact detection. Fast motion, such as a child running behind the vehicle, presented a detection challenge to some systems.
The permutations of possible scenarios in which a backover avoidance system could not assist in preventing a collision are numerous. Sensor systems typically only detect objects positioned directly behind the vehicle. While the BMW 330i and Cadillac Escalade systems did exhibit detection zones that reached 2 to 4 feet beyond the side of the vehicle for some objects, this detection zone width was not consistently seen in tests with children. Designing sensor-based systems to detect a wider area than that directly behind the vehicle could lead to problems such as nuisance alarms due to detection of adjacent vehicle when parking. While rear video and convex mirror systems do provide some view of the areas diagonally to the rear of the vehicle on both sides, those views tend to be somewhat distorted due to mirror convexity or video image nonlinearities inherent in wide-angle camera lenses. A child standing to the rear of the vehicle, but a short distance to the side will probably not be detected by a sensor system, but may be within the field of view of a visual system. A child standing to the side of a vehicle that is backing in a curved path would not be detected by a rear sensor system or displayed by a rear video system and could be struck by the front tires of the vehicle during the backing maneuver. A child crawling on the ground beside the vehicle between the front and rear wheels would not be detected by a rear sensor system or displayed by a rear video system. A child positioned under the vehicle’s rear bumper would also not be detected in many cases.

97
False alarms are warning signals emitted by the system when no threat is present. False alarms cause the driver annoyance and erode the driver’s trust in the system. While false alarms were observed to be a significant problem in past NHTSA testing, the current systems tested did not exhibit a false alarm problem. Rare false alarms that appeared to be caused by wind gusts were seen with one aftermarket ultrasonic sensor system. One original equipment ultrasonic system also exhibited a single false alarm of unknown cause over the course of multiple months of testing.
Weather conditions can impact backing system performance. Dirt and dust can decrease the performance of ultrasonic sensors. During conditions of snow, none of the systems examined in this test program developed accumulated snow during light to moderate snow conditions. Camera system examined in this research used cameras embedded in the recessed area of the rear license plate which offered protection from rain and snow.
5.4. DRIVERS’ COMPLIANCE WITH WARNINGS
In order for backover avoidance systems to assist in preventing collisions, the driver must perceive either the warning or the object displayed by the rearview video system and respond appropriately. Responding appropriately involves the driver trusting the information presented that a threat truly exists and then braking quickly and with sufficient force applied to the brake pedal to bring the vehicle to a stop. Section 5.1 worked through effectiveness scenarios given sensor system response time, the mechanical limits of the vehicle, and the physical limits of the driver. However, an examination of driver behavior in backing scenarios and their responses to sensor system warnings and rearview video is necessary in order to accurately estimate real world effectiveness of these systems. Time was not available to perform the complex human factors experimentation necessary to assess drivers’ compliance rate with backing system warnings prior to the congressional report deadline.
There is a limited amount of information on drivers’ use of backing systems and response to backing system warnings available in the literature. The only research that the authors are aware of was sponsored by General Motors Corporation. These studies examined drivers’ responses both to warnings from sensor systems or to objects displayed by a rearview video system.
One General Motors Corporation sponsored study, which examined drivers’ responses to warnings from sensor systems, was performed by Llaneras et al. [3] in 2004. This study has been summarized in a recent SAE paper by Green and Deering [19], which states:
“Driver performance testing was conducted in an open parking lot using two instrumented vehicles, both equipped with a prototype backing warning system. A variety of approaches for presenting warning information to the driver were investigated using a surprise trial methodology. Due to drivers’ inherent vigilance, it was necessary to distract them from the backing task by asking them to monitor a small video screen adjacent to the rear window.

98
The study found that for those trials where the driver was successfully distracted (approximately two-thirds of trials) and a warning was issued, only 13% of drivers avoided hitting the toy coupe (five of 39); over 87 percent of drivers collided with the toy coupe following the warning. While many drivers who experienced the warning (68%) demonstrated precautionary behaviors in response to the warning by covering the brake, tapping the brake, or braking (44% braked), the level of braking was generally not sufficient to avoid colliding. Thus, although the data provide some evidence that the warnings were influencing driver behavior, warnings in this context were not reliably inducing drivers to immediately brake to a stop.
The Llaneras et al. backing warning study data further suggest that knowledge and experience with the backing warning system may not significantly improve the situation (driver compliance and immediate response to the warning). Specific training on the warning system was provided to eight drivers; but only one of these drivers avoided the obstacle. In all cases, drivers reported that they did not expect there to be any obstacle in their path. Many also reported searching for an obstacle following the warning, but since they “didn’t see anything” they continued to back. These perceptions suggest that expectancy is a powerful determinant, guiding driver perception and behavior.”
General Motors has sponsored two studies that examined typical drivers’ responses to objects displayed by a rearview video system. The first study was performed by McLaughlin, et al. [20] in 2003. In this study, subjects were tested with either no system, an ultrasonic rear parking assist system (URPA), rear camera system (RV), or an ultrasonic rear parking assist system plus a rear camera system (URPA + RV). Subjects were distracted by a ruse while an object was placed behind the vehicle. The ruse was set-up and executed successfully for 29 of the 32 study participants. As reported in [20]:
“In sum, 24 of the participants hit the obstacle leaving five who avoided hitting the obstacle. Of the five participants who did not hit the obstacle: three saw the obstacle using the RV (two in the RV condition, one in the URPA + RV condition), one saw the obstacle in their mirror (in the URPA + RV condition), and one saw the obstacle out of the back window (in the RV condition).”
The second study was performed by Lee et al. [21] in 2004. In this study, each participant parked a vehicle equipped with an ultrasonic rear parking assist system plus a rear camera system more than 30 times (including practice trials). Near the end of the study, while the participant was filling out paperwork, a 22 centimeter wide by 1.2 meter tall object was placed behind their vehicle. Subjects were then asked to back up. As reported in [21]:
“It was striking that 31 of the 48 participants who experienced this ruse, or 65%, noticed and successfully avoided the obstacle. Some reasons why the participant success rate in avoiding the obstacle may have been measured greater in the second study as compared to the first may be the greater experience participants had with the camera system in the second study, or it could be due to the larger number of ruse trials available in the data set.”

99
General Motors overall conclusions from these three studies can be summarized by the following quote from [19]:
“These results suggest that rearview video camera systems may provide limited benefit in some backing scenarios, while parking assist systems may not effectively warn drivers of unexpected obstacles.”
The results from these General Motors studies raise questions as to whether the driver will perceive either the warning or the object displayed by the rearview video system and respond quickly and with sufficient force applied to the brake pedal to bring the vehicle to a stop. More research is needed on this important topic. However, this is difficult, time-consuming, and expensive research to perform.

100
6.0 FINDINGS
This report summarized testing conducted by NHTSA to assess the performance of available backover avoidance system technologies. Available technologies identified included original equipment (OE) and aftermarket products, each using ultrasonic sensors, radar sensor(s), mirrors, a video camera, or some combination thereof.
OE products were advertised as “parking aids,” rather than safety systems. Aftermarket systems were typically marketed as safety systems with the ability to warn drivers of children present behind backing vehicles. While the OE parking aid systems were cast as having the ability to detect inanimate obstacles and did not purport to detect pedestrians, they were included in this testing to fully address the Congressional directive that asked for an examination of “available technologies for detecting people or objects behind a motor vehicle.” Furthermore, many OE sensor-based systems used the same technologies that aftermarket systems used (and claimed could detect the presence of children). Thus, examining a range of available OE parking aids and aftermarket backover warning systems allows NHTSA to inform consumers about the capabilities of individual technologies and permits comparison of their performance with other systems utilizing similar technology.
Sensor System (including “Parking Aid”) Findings
Findings relating to the eight sensor-based systems examined include:
• Sensor-based systems generally exhibited poor ability to detect pedestrians, particularly children, located behind the vehicle. Systems’ detection performance for children was inconsistent, unreliable, and in nearly all cases quite limited in range. Testing showed that, in most cases, the detection zones of sensor-based systems contained a number of “holes” in which a standing child was not detected. The size of the pedestrian did seem to affect detection performance, as adults elicited better detection response from the sensor systems than did 1 or 3-year-old children.
• All eight of the systems could generally detect a moving adult pedestrian (or other objects) within their detection zone area behind the vehicle when the vehicle was stationary. However, all of the sensor-based systems exhibited at least some difficulty in detecting moving children. A few of these test trials with children for which systems had problems detecting moving children are described here:
o 2005 Lincoln Navigator with 1-year-old subject: 1-year-old crawls behind the vehicle without being detected by the system, then gets up and walks back the other way and is detected after crossing most of the width of the vehicle.
o Audiovox aftermarket system with 1-year-old child. The child is detected when walking, but not when bending down to pick something up. She stands still momentarily and it stops detecting her.

101
o Audiovox aftermarket system test trials with a running 3-year-old child who is inconsistently detected within a range of 5 ft from the rear of the vehicle.
o 2007 Cadillac Escalade system test trials with a running 3-year-old child who is inconsistently detected within a range of 5 ft from the rear of the vehicle.
o 2006 BMW 330i system with a 3-year-old child detected while riding a ride-on toy and walking within 5 ft from the rear of the vehicle, but not detected when walking at a range of 7 ft from the rear bumper.
Video recordings of these scenarios are also available in electronic copies of this report, in the appropriately labeled file of “Appendix A.”
• Between test trials, several instances were captured on video of systems failing to detect children playing behind the vehicle within the systems’ detection zones. A few of these “uncommanded test trials” with children are described here:
o 2005 Nissan Quest with two 3-year-old children playing: Two 3-year-old boys play behind the vehicle and are inconsistently detected.
o 2005 Nissan Quest with two 3-year-old children playing: Two 3-year-old boys play behind the vehicle. One boy rides by on a pedaled ride-on toy, the system detects him, and then he moves out of view leaving the second boy still standing behind the vehicle approximately 5 feet away without any response from the system.
o Poron aftermarket system with 1-year old and 3-year-old children playing: The system initially detects a PVC pole the children are playing with, then it detects the 1-year-old, then it stops detecting altogether.
Video recordings of these scenarios are also available can be obtained from Docket No. NHTSA-2006-25579 or from the NHTSA web site.
• The reliability (i.e., ability of systems to work properly without an unreasonable failure rate) of sensor-based systems as observed during testing was good, with the exception of one aftermarket, ultrasonic system that malfunctioned after only a few weeks, rendering it unavailable for use in remaining tests. In examining consistency of system detection performance, it was noted that all of the sensor-based systems tested exhibited at least some degree of day-to-day variability in their detection zone patterns. Results of static sensor-based system detection zone repeatability showed a range of performance quality. Inconsistency in detection was usually seen in the periphery of the detection zones and typically was not more than 1 foot in magnitude.
• There are limitations to the performance of sensor-based backing systems. Additional study of actual backing crashes is needed to better understand how backing crashes happen and the degree to which these technology limitations present a problem for crash avoidance.

102
o Sensor-based systems typically can only detect pedestrians or objects that are directly behind the vehicle. However, not all crashes involve pedestrians located directly behind the vehicle.
o A majority of systems tested were unable to detect test objects of less than 18 inches in height.
o While ultrasonic systems can detect stationary obstacles behind the vehicle when the vehicle is stationary, Doppler radar-based sensors, by design, cannot. Doppler radar-based sensors also cannot detect objects moving at the same speed and direction as the vehicle on which they are mounted.
• None of the systems tested had large enough detection zones to completely cover the blind spot behind the vehicle on which they were mounted. The sensor with the longest range of those tested could detect a 3-year-old child out to a range of 11 feet. The closest distance behind any of the six vehicles tested at which a child-height object could be seen by the driver, either by looking over their shoulder or in the center rearview mirror, was 16 feet.
• Response times of sensor-based systems ranged from 0.18 to 1.01 seconds. ISO 17386 [1] contains a recommended maximum system response time of 0.35 seconds (measured using a PVC pole that enters the detection zone from above). Only three of the seven systems tested met the ISO limit. Given the observed sensor system response times, the ranges at which systems tested were able to detect children were insufficient to allow time to brake the vehicle to a stop prior to a collision (assuming typical backing speeds; [18] states that only about 50 percent of the vehicles that back into pedestrians are traveling at speeds below 2.0 mph). Based on the analysis in [18], a system should have a median maximum speed for braking to a stop for a 3-year-old child of at least 5 mph.
• In order for sensor-based backover avoidance systems to assist in preventing collisions, the driver must perceive the warning generated by the system and respond quickly and with sufficient force applied to the brake pedal to bring the vehicle to a stop. Time was not available in the context of this research to perform the complex human factors experimentation necessary to assess drivers’ tendency to respond appropriately to backing system warnings. However, a study sponsored by General Motors [19] raises questions as to whether the driver will respond quickly and with sufficient force applied to the brake pedal to bring the vehicle to a stop in response to a warning. More research is needed on this important topic.
While the sensor-based systems showed some object detection deficiencies, particularly in detecting small pedestrians, it may be possible to improve system performance (e.g., improve detection range). However, considering the currently observed system performance capabilities to those observed 10 years ago, the detection of small pedestrians still seems to be a significant challenge for sensor-based systems.

103
Visual System (Rearview Video Cameras and Auxiliary Mirrors) Findings
NHTSA also examined visual systems including rear video camera systems and auxiliary mirror systems designed to augment driver rearward visibility. The examination of these systems included assessment of their field of view and potential to provide drivers with information about obstacles behind the vehicle. Based upon this research, the following observations relating to the rearview video systems examined were made:
• Rearview video systems provided a clear image of the area behind the vehicle in daylight and indoor lighted conditions. The video systems showed pedestrians or obstacles behind the vehicle and displayed a wider area than was covered by the detection zones of sensor-based systems tested in this study. The range and height of the viewable area differed significantly between the two OE systems examined. In addition to limiting the field of view, the limited view height of one system seemed to complicate the judgment of the distance to rear objects.
• In order for rearview video systems to assist in preventing backing collisions, the driver must look at the video display, perceive the pedestrian or object in the video screen, and respond quickly and with sufficient force applied to the brake pedal to bring the vehicle to a stop. The true efficacy of rearview video systems cannot be known without assessing drivers’ use of the systems and how they incorporate the information into their visual scanning patterns. Determining typical drivers’ interactions with rearview video systems would require complex human factors testing.
• The examination of rearview auxiliary mirror systems revealed that neither of the two systems tested fully showed the area directly behind the vehicle. Both mirror systems had substantial areas in which pedestrians or objects could not be seen.
• Visually detecting a 28-inch-tall traffic cone behind the car using the rearview auxiliary mirrors proved to be challenging for drivers. The convexity mirror of the mirrors caused significant image distortion making reflected objects difficult to discern. Concentrated glances were necessary to identify the nature of rear obstacles. A hurried driver making quick glances prior to initiating a backing maneuver might not allocate sufficient dwell time to allow them to recognize an obstacle presented in the mirror.
104
7.0 NHTSA’S FUTURE PLANS FOR BACKOVER PREVENTION RESEARCH
Because of NHTSA’s concern about the serious safety problem presented by vehicle backing crashes, the agency intends to continue its work to address this hazard by analyzing the safety problem more thoroughly and attempting to understand the various scenarios under which such crashes occur. NHTSA’s efforts will also include investigation of improvements to technology-based countermeasures and the feasibility of developing objective tests and technology-neutral performance specifications for backing safety systems. Human Factors research will be conducted to assess drivers’ use of rearview video systems. The rear visibility characteristics, including blind zones, for a range of contemporary vehicles will be assessed. Finally, NHTSA will analyze data from a AAA Foundation for Traffic Safety survey of thousands of drivers of vehicles equipped with electronic parking aids or rearview video systems. NHTSA is hopeful that through these efforts and those of industry, significant advances in the development of effective backing safety systems can be made in order to address the hazard of pedestrian backover incidents.
105
8.0 REFERENCES
[1] ISO 17386, “Transport information and control systems – Manoeuvring Aids for Low Speed Operation (MALSO) – Performance requirements and test procedures”
[2] Huey, R., Harpster, H., Lerner, N.,(1995). Field Measurement of Naturalistic Backing Behavior. NHTSA Project No. DTNH22-91-C-07004.
[3] Llaneras, R.E., Green, C.A., Chudndrlik, W., Altan, O.D., and Singer, J.P. (2004). Design and Evaluation of a Prototype Rear Obstacle Detection and Driver Warning System. Human Factors (in press).
[4] Consumer’s Union. We Need Better Car Safety for Kids. http://www.thepetitionsite.com/takeaction/982684985. Accessed 7/26/2006.
[5] Automotive News, May 1, 2006, page 14. Safety gear exists; we must use it.
[6] National Highway Traffic Safety Administration (1994). A Study of Commercial Motor Vehicle Electronics-Based Rear and Side Object Detection Systems; Prepare in Response to: Section 6057: P.L. 102-240; December 19, 1991; Intermodal Surface Transportation Efficiency Act of 1991. NHTSA Technical Report No. DOT HS 808 080.
[7] Talmadge, S., Yokohama, K.E., Shreve, G.A., and Johnston, S. (1995). Development of performance specifications for collision avoidance systems for lane change, merge, backing;, Task 3: Test of Existing Systems; Part 1 – Sensor System Testing. (DOT HS 808 434). Washington, DC: NHTSA.
[8] Llaneras E. & Neurauter L. (2005). Early Adopters Safety-Related Driving With Advanced Technologies. 2005 Inventory of In-vehicle Devices & Interface Characteristics. (Task Order 10 under Project DTNH22-99-D-07005).
[9] Raju, M. (2001). Ultrasonic Device Measurement with the MSP430. Application Report SLAA136A. Texas Instruments, October 2001.
[10] Consumer Reports Vehicle Backup Aids, October, 2003. Driving Blind. (Vehicle backup aids 10/03: Backup sensor, rearview camera, reverse sensing systems). www.consumerreports.org/main/detailv2.jsp?CONTENT%3C%3Ecnt_id=329161&FOLDER%3C%Efolder_id=113261. Accessed 8/12/2005.
[11] Lincoln web site: 2006 Lincoln Navigator – Exterior Features – Power Features – Reverse Sensing System. http://www.lincoln.com/navitagot/exteriorfeatures.asp?/feature=reverse_sensing_system. Accessed 12/30/2005.
[12] Manual on Uniform Traffic Control Devices for Streets and Highways, 2003 Edition. Washington, DC: FHWA, November 2003.
[13] Milazzo, J.S., Rouphail, J.E., and Alien, D.P. (1999). Quality of Service for Interrupted-Flow Pedestrian Facilities in Highway Capacity Manual 2000. Transportation Research Record, No. 1678 (1999): 25-31.
106
[14] Chou, P., Chou, Y., Su, F., Huang, W., Lin, T. (2003). Normal Gait of Children. Biomedical Engineering – Applications, Basis & Communications, Vol. 15 No. 4 August 2003.
[15] Mazzae, E. N., Baldwin, G. H. S., Barickman, F. S., Forkenbrock, G. J. (2003). NHTSA Light Vehicle Antilock Brake Systems Research Program, Task 5.2/5.3: Examination of driver crash avoidance behavior using conventional and antilock brake systems. (DOT HS 809 561). Washington, DC: NHTSA.
[16] Harpster, H., Huey, R., Lerner, N., and Steinberg, Geoff (1996). Backup Warning Signals: Driver Perception and Response. NHTSA Project No. DTNH22-91-C-07004.
[17] Paine M., Henderson M. (2001). Devices to Reduce The Risk to Young Pedestrians from Reversing Vehicles. Motor Accidents Authority of NSW Australia, March 2001.
[18] Eberhard, C.D., Moffa, P.J., Young, S.K., and Allen, R.W. (1995). Development of performance specifications for collision avoidance systems for lane change, merge, backing; Phase 1, Task 4: Development of Preliminary Performance Specifications. (DOT HS 808 430). Washington, DC: NHTSA.
[19] Green, C.A. and Deering, R.K. (2006). Driver Performance Research Regarding Systems for Use While Backing. Paper No. 2006-01-1982. Warrendale, PA: Society of Automotive Engineers.
[20] McLaughlin, S.B., Hankey, J.M., Green, C.A., and Kiefer, R.J. (2003). Driver Performance Evaluation of Two Rear Parking Aids. Proceedings of the 2003 Enhanced Safety Vehicle Conference.
[21] Lee, S.E., Hankey, J.M., Green, C.A. (2004). Rear Video II Study: Methods and Results. Draft Unpublished GM Report.

107
9.0 APPENDIX A: VIDEO CLIPS DOCUMENTING TRIALS OF INTEREST
All eight of the systems could generally detect a moving adult pedestrian (or other objects) within their detection zone area behind the vehicle when the vehicle was stationary. However, all of the sensor-based systems exhibited at least some difficulty in detecting moving children. A few of these test trials with children for which systems had problems detecting moving children are described here:
• 2005 Lincoln Navigator with 1-year-old subject: 1-year-old crawls behind the vehicle without being detected by the system, then gets up and walks back the other way and is detected after crossing most of the width of the vehicle.
• Audiovox aftermarket system with 1-year-old child. The child is detected when walking, but not when bending down to pick something up. She stands still momentarily and it stops detecting her.
• Audiovox aftermarket system test trials with a running 3-year-old child who is inconsistently detected within a range of 5 ft from the rear of the vehicle.
• 2007 Cadillac Escalade system test trials with a running 3-year-old child who is inconsistently detected within a range of 5 ft from the rear of the vehicle.
• 2006 BMW 330i system with a 3-year-old child detected while riding a ride-on toy and walking within 5 ft from the rear of the vehicle, but not detected when walking at a range of 7 ft from the rear bumper.
Readers can obtain video clips of these scenarios from Docket No. NHTSA-2006-25579 or from the NHTSA web site.
108
Between test trials, several instances were captured on video of systems failing to detect children playing behind the vehicle within the systems’ detection zones. A few of these “uncommanded test trials” with children are described here:
• 2005 Nissan Quest with two 3-year-old children playing: Two 3-year-old boys play behind the vehicle and are inconsistently detected.
• 2005 Nissan Quest with two 3-year-old children playing: Two 3-year-old boys play behind the vehicle. One boy rides by on a pedaled ride-on toy, the system detects him, and then he moves out of view leaving the second boy still standing, vulnerable behind the vehicle approximately 5 feet away without any response from the system.
• Poron aftermarket system with 1-year old and 3-year-old children playing: The system initially detects a PVC pole the children are playing with, then it detects the 1-year-old, then it stops detecting altogether.
Readers of printed copies of this report can obtain video clips of these scenarios from Docket No. NHTSA-2006-25579 or from the NHTSA web site.