experimental and theoretical studies of the f+h2...
TRANSCRIPT

Experimental and theoretical studies of the F+H2 transition state region via photoelectron spectroscopy of FH2
Stephen E. Bradforth,a) Don W. Arnold, and Daniel M. Neumarkb) Department of Chemistry, University of California, Berkeley, California 94720 and Chemical Sciences Division, Lawrence Berkeley Laboratory, Berkeley, California 94720
David E. Manolopoulos Department of Chemistry, University of Nottingham, Nottingham NG7 2RD, United Kingdom
(Received 25 May 1993; accepted 20 July 1993)
The transition state region of the F+H2 reaction is studied by photoelectron spectroscopy of FH, . The photoelectron spectra consist of overlapping electronic bands with different angular distributions. The ground state band shows partially resolved features which differ depending on whether the anion is made from normal orpara hydrogen. This dependence on the anion nuclear spin statistics implies that these features are due to progressions in bending levels of the neutral FH2 complex. In order to confirm this, and to determine the sensitivity of the photoelectron spectrum to the bend potential near the F + H, transition state, three-dimensional simulations of the FH, photoelectron spectrum were performed assuming various potential energy surfaces for the F+H, reaction. We found that the London-Eyring-Polanyi-Sato surface proposed by Takayanagi and Sato gave better agreement than either the T5a or 5SEC surfaces. From the higher energy band, we can extract information on the F+H2 excited electronic states, and several approximate simulations on model surfaces for these states are presented.
1. INTRODUCTION
This paper describes experimental and theoretical studies of the transition state region of the reaction F+H2+HF+H via photoelectron spectroscopy of the sta- ble negative ion FH, . The goal of this work is to combine experimental spectra with theoretical simulations in order to probe, in detail, the nature of the ground and excited state potential energy surfaces for the F+H2 reaction in the vicinity of the transition state.
The F+H, reaction, along with its isotopic variants, has been one of the most thoroughly investigated reactions in chemical dynamics. Various aspects of the product en- ergy and angular distributions have been measured in chemical laser, ’ infrared chemiluminescence,’ and crossed molecular beam experiments.3-5 Accurate rate constants have been obtained over a large temperature range.6 From the theoretical perspective, interest in this reaction has cen- tered on the development of accurate potential energy fur- faces as well as the methodology to carry out detailed quantum mechanical reactive scattering calculations on these surfaces. Recent advances in scattering theory7 now make it possible to compute detailed differential and inte- gral reaction cross sections which, when compared to ex- periment, provide a stringent test for the various potential energy surfaces which have been proposed over the years.‘-l3
Although the interaction of a F atom with H, leads to three electronic states,i4 only the lowest of these is reactive, and most of the theoretical effort thus far has focused on
‘IPresent address: Department of Chemistry, University of Chicago, 5735 S. Ellis Avenue, Chicago, IL 60637.
“NSF Presidential Young Investigator, and Camille and Henry Dreyfus Teacher-Scholar.
this surface. The construction of a ground state potential energy surface which can reproduce all the experimental results has proved to be a challenge. The Muckerman 5 (M5) surface,’ which was used in a series of scattering calculations prior to 1985,” matches the experimental HF vibrational distribution in classical trajectory calculations but not the rate constant or angular distribution. More recently, the dynamics of this reaction have been exten- sively investigated in quantal’G22 and quasiclassicalz3 scat- tering calculations using the T5a and. SSEC surfaces of Truhlar and co-workers,1op*1 both of which have consider- ably flatter bend potentials near the saddle point than the M5 surface. Calculations of the HF angular distribu- tions20*23 show that both surfaces approximately reproduce the experimental angular distributions.4 However, while the experiments’*2y4 show the HF (U = 2) level is the dom- inant product vibrational channel, quanta1 calculations” on the T5a surface show HF (u= 3) to be the most popu- lated channel, and quasiclassical trajectory calculations23 on the SSEC surface predict approximately equal yields of RF (v=3) and (u=2). Hence these two surfaces appar- ently yield incorrect HF vibrational energy distributions. Another noteworthy surface is the empirical surface con- structed by Takayanagi and Sato12 (the TS surface). This does a reasonable job of reproducing both the experimental product energy and angular distributions in classical tra- jectory calculations, but the transition state theory rate constant on this surface is larger than the experimental value by a factor of 2.
What emerges from this body of work is that the cal- culated rate constant and product energy and angular dis- tributions on a given surface have a complicated depen- dence on the height and location of the barrier as well as the bend potential near the barrier. This makes it difficult
J. Chem. Phys. 99 (9), 1 November 1993 0021-9606/93/99(9)/6345/l 5/$6.00 @ 1993 American Institute of Physics 6345 Downloaded 03 Mar 2003 to 128.32.220.150. Redistribution subject to AIP license or copyright, see http://ojps.aip.org/jcpo/jcpcr.jsp

6346 Bradforth et al.: The F+ H2 transition state
H + HF tering wave functions supported by the neutral potential 2 : energy surface. The experimental ground state band was
4 found to be in qualitative agreement with the simulations \ 1 - --“. .ra “Led mF_ (see-below, however). Assignments of the partially re-
solved features in these spectra have been proposed by r :>>-;; ‘+A,,. r*,‘V F + H,
0 I 1 I 2 4 6 8
x/A
FIG. 1. Plot of F+H,+HF+H ground state reaction surface with the FH; ground vibrational state wave function shown shaded. The contours for the neutral potential surface are determined from the T5a potential function of Ref. 10. The saddle point (RF,nZ = 1.953 & R,, = 0.762 b;) is marked with a cross. The anion wave function assumes the ab inirio CCSD(T) equilibrium geometry ( ReHz = 2.075 8, and R, = 0.770 L%) and MCSCF harmonic frequencies of Nichols et al. (Ref. 25); the ellipse represents the 90% probability limits of the wave function, The axes for the plot are mass scaled Jacobi coordinates: x = (/.~r,nJ~rrJ "'REHZ and y = RHdH. The skew angle for FH, is 46”.
Hahn and Taylor,29 using a classical analysis in which tra- ‘jectories initiated in the Franck-Condon region were com- pared to periodic orbits,30 and by Kress and Hayes,== who compared the peaks in the photoelectron spectrum to fea- tures in the quantum mechanical cumulative reaction probability.
to “tweak” a particular region of a model surface in order to achieve better agreement with experimental results. Moreover, the exact calculation of state-resolved integral and ditferential cross sections on a given surface is quite lengthy,2o as it involves summing over all the partial waves that contribute to the reaction.
In order to provide a more direct link between exper- iment and theory, and to provide experimental information complementary to that obtained from scattering experi- ments, we have performed a transition state- spectroscopy experiment one the F+ H, reaction via photoelectron spec- troscopy of the stable negative ion FH;. We have previ- ously used this method to study several reactions, prima- dY involving the “heavy + light-heavy” mass combination. 24 This experim ent provides a detailed probe of the “Franck-Condon region,” the region of the neutral potential energy surface that has good geometric overlap with the negative ion. Figure 1 shows the ground state wave function of FH, ,-based on the ab initio calculation by Nichols et al.,25 superimposed on a collinear cut through the T5a F+H, surface. The Franck-Condon re- gion clearly overlaps the saddle point, although more of its lies in the reactant valley than on the product side of the saddle point, so photodetachment of FH; should probe the F+H, transition state region.
This paper describes new experimental work in our laboratory, and an extensive new analysis of the FH, pho- toelectron spectrum. Recent experimental improvements to our ion source have resulted in the production of colder anions, and the collection efficiency of our photoelectron detector has been increased, yielding higher signal-to-noise photoelectron spectra. Moreover, we report photoelectron spectra of FH, made by clustering F- with para-Hz, rather than with normal-H, as in our previous work. Our concern here was that in the latter case, the 75% of the H2 molecules. with j= 1 (and higher odd values) were not rotationally quenched upon formation of the anion, leading to rotational and vibrational excitation of the anion. In- deed, the results reported here show that the photoelectron spectra obtained using normal- and para-H, are markedly different, and the implications for comparing the experi- mental and simulated spectra are discussed. New simula- tions of the FH, spectra on several potential energy sur- faces are also presented. The comparison with experiment shows that most of the resolved structure in the spectra is due to bend progressions in the neutral complex, and that the photoelectron spectrum provides an extremely sensitive probe of the bend potential near the saddle point.
In our earlier photoelectron spectroscopy studies of this system,26’2’ we found that the photoelectron spectra of FH; , FD, , and FDH- each consisted of two overlapping bands with markedly different photoelectron angular dis- tributions. One band was assigned to a transition from the anion to the ground state F+H, surface, and the other to transitions to two additional low-lying excited electronic states that result from the interaction of F(=P) with H2.i4 The ground state band showed partially resolved vibra- tional features which could be directly compared with sim- ulations of the FH, and FD, photoelectron spectra by Zhang et al. 18728 using the T5a surface. These are “exact” simulations which calculate the Franck-Condon overlap between the anion ground vibrational state (assuming total angular momentum J=O) and the three-dimensional scat-
The higher quality of the photoelectron spectra also allows us to analyze the excited state band, and to extract one-dimensional potential energy curves for the excited state interactions. These results are of interest in light of various calculations of the effects of the low-lying excited electronic states on reactive31e3s and rotationally inelas- tic36937 F + H, scattering. The validity of this body of work is limited by the quality of the excited state potential en- ergy surfaces used in the calculations; at the time, there were no experimental results to use as a check on the sur- faces. Recently, Aquilanti et al. 38 extracted the long-range forms of the excited state potentials from total cross- section measurements using state-selected F atoms. The experimental results presented here provide the first quan- titative determination of these surfaces at short range.
II. EXPERIMENT
~-The instrument employed in this study is the same time-of-flight photoelectron spectrometer described in our earlier work on FH, .26227 Here we will describe only mod- ifications to the experimental apparatus and the particular details of the experiments carried out. FHF ions are made by crossing a pulsed free jet expansion of 8% NF3/32% H2/6O% N2 with a 1 keV electron beam. The presumed mechanism of ion formation is dissociative attachment to
J. Chem. Phys., Vol. 99, No. 9, 1 November 1993
Downloaded 03 Mar 2003 to 128.32.220.150. Redistribution subject to AIP license or copyright, see http://ojps.aip.org/jcpo/jcpcr.jsp

Bradforth et al.: The F+H2 transition state 6347
NF3 to form F-, followed by clustering of the F- with H, as the expansion progresses. A piezoelectric pulsed valve of the design of Proch and Trick13’ was used in the work reported here; this was found to give cooler ions (i.e., the photoelectron spectrum is less congested and the features better resolved) than the General Valve pulsed valve used in our earlier studies. The addition of the N2 in the reagent gas mixture was also found effective in cooling the ions. The gases are allowed to mix thoroughly in a stainless steel cylinder before use; at run time the stagnation pressure of the mixed gases behind the pulsed valve is 80 psig.
Ions are made from both normal- and para-hydrogen. The normal-H, (n-H,) used in these experiments was ob- tained commercially and is 99.99% purity. The para-Hz (p-H,) was prepared by the University of California, Ber- keley Department of Chemistry Low Temperature Labo- ratory, and is estimated to be 99.7% p-H2 at the time of production. It was stored in standard aluminum gas cylin- ders in order to reduce para-ortho interconversion,40’41 and used within a few hours of mixing with the other gases in the stainless steel mixing tank. While some interconversion may occur between generation of thep-H, and execution of the experiment, the significant differences observed be- tween the photoelectron spectra of FH, depending on whether n-H2 or p-H2 was used (see below) indicates that this interconversion was far from complete.
The negative ions are extracted, mass selected in a time-of-flight mass spectrometer, and photodetached with a pulsed Nd:YAG laser.27’42 Spectra reported here were recorded using a laser wavelength of 266 nm (4.66 eV). The pulsed laser light is plane polarized; as before, we can adjust the angle 13 between the electric vector of the laser radiation and the direction of electron detection by rota- tion of a half-wave plate. The second major change to our apparatus has been the upgrade of the electron detector. The electrons photodetached by the laser are detected at the end of a 1 m flight tube, and their energy is analyzed by time-of-flight. For this detector we now use a pair of 75 m m diam microchannel plates, rather than a pair of 40 m m plates.42 This increases the electron collection efficiency by a factor of 3.5, with a similar improvement in the signal- to-noise. There is a slight loss in electron energy resolution due to the larger angular acceptance of the detector,43 typ- ically the instrumental resolution is 12 meV at 0.65 eV, and, as before, degrades for higher electron energies as (eKE) 3’2.
Ill. RESULTS
Photoelectron spectra were recorded for the FH, ion made from n-H2 and p-H2 at two laser polarization direc- tions, 6=0” and 8=90”. The spectra are presented in Fig. 2. The form of the two n-H2 spectra are similar to those reported earlier,27 although more features are resolved at higher electron kinetic energy and there is a noticeable improvement in signal-to-noise in the 8=90” spectrum. The 8=90” spectrum consists of several partially resolved peaks between 0.8 and 1.1 eV, and a broad feature at lower electron kinetic energy. In the 8=0” spectrum, the peaks at higher kinetic energy are more intense, and the broad fea-
s&Y 0=90” . _.I normal El2 normal Hz
.
Electron Kinetic Energy (eV) Electron Kinetic Energy (eV)
FIG. 2. Photoelectron spectra of FHF at 266 nm. (Top) Ions made from normal-H, (3:l orfho/para), and (bottom) ions made from para-H,. Spectra recorded at two polarizations of the photodetachment laser: (Left) parallel [6=0”] and (Right) perpendicular [f3=907 to direction of electron collection.
ture is largely suppressed. The partially resolved peaks at higher energy are labeled A, A’, B, C, and D in the 8=0” spectrum.44 Peak A’ was not observed in our earlier spec- trum, and peak C is better resolved here; both of these effects are attributed to lower ion temperatures in the cur- rent study.
The p-H2 spectra in Fig. 2 show approximately the same dependence on laser polarization angle as the n-H2 spectrum. However, the peaks between 0.8 and 1.1 eV ap- pear markedly different in the p-H2 spectrum, particularly the 8=0” spectrum. While the same peaks in the n-H2 spectrum appear in the p-H2 spectrum, the intensities are quite different. Peak A’ is the dominant feature in thep-H2 spectrum, while peaks A and B, which appear cleanly in the n-H2 spectrum; are barely observable shoulders on ei- ther side of peak A’ in the p-H2 spectrum. Peak C is also less obvious in the p-H2 spectrum and in its place a new shoulder seems to appear between B and C. Peak positions are listed in Table I.
The two peaks observed in all four spectra at 1.26 and- 1.21 eV are due to a two photon process and correspond to the photoelectron spectrum of F-, the first photon disso- ciates FH, to F--+H,, the second photon detaches F-;27
TABLE I. Peak positions (electron kinetic energies) in the 6=r, 266 nm photoelectron spectra of FH; .
Peak position/eV’
FH, from A’ A’ B C D
normal-H, 1.ooo 0.972 0.941 0.815 0.54 para-H, 0.996 0.970 0.942 0.51
‘Peak positions in the table and in the spectra shown in Fig. 2 have been corrected for the small space charge shift ( <5 meV) in the electron kinetic energies. Uncertainties in peak positions.are 0.005 eV, except for peaks C and D where the uncertainty is approximately 0.015 eV.
J. Chem. Phys., Vol. ~99, No. 9, 1 November 1993 Downloaded 03 Mar 2003 to 128.32.220.150. Redistribution subject to AIP license or copyright, see http://ojps.aip.org/jcpo/jcpcr.jsp
6346 Bradforth et a/.: The F+H, transition state
IV. ANALYSIS AND DISCUSSION
A. Overview of spectrum and summary of previous analysis
The electron kinetic energy (eKE) is related to the initial energy of the anion, EC-‘, and the final energy of the neutral, E(O), by
eKE=hv- [Do(FH,) +EA(F)] -I!T(~)+E’-‘. (1)
Here EA(F)=3.401 190 eV is the electron affinity of atomic fluorine,45 and Do( Fl!I; ) is the dissociation energy of the anion to form F- +H2( u=O); the ab initio value of Do is 0.20*0.10 eV.25 Equation ( 1) shows that transitions at lower electron kinetic energy typically correspond to higher energy states of the neutral. In contrast, simulations of the photoelectron spectrum presented below are typi- cally plotted as a function of the scattering energy E, de- fined with respect to the bottom of the F+H, well at inll- nite reactant separation, so that
E=E”‘+zpe(Hz). (2)
The differences in the photoelectron spectra at laser polarizations 8=0“ and 0=90” indicate that there are two types of transitions in the spectra with markedly different photoelectron angular distributions. This implies that the two types of transitions are from different anion-+neutral electronic transitions. On this basis, we previously assigned peaks A-D in the n-Hz spectrum to transitions to the ground state F+H, potential energy surface, and the broad feature at lower electron energy, particularly preva- lent in the 90” spectra, to transitions to the two low-lying excited state surfaces. In addition, peaks A-D shifted upon isotope substitution in the anion and were therefore as- signed to vibrational features associated with the ground state F+H, surface. Peaks A-C occur at electron kinetic energies just below the F+H,(v=O) asymptote at eKE = 1.06 eV (i.e., the eKE corresponding to E(O) =0, assum- ing Do=0.20 eV); according to Eq. ( 1 ), these peaks cor- respond to levels of the FHz complex that lie slightly above this asymptote. The more specific assignment of these peaks is discussed below. Peak D is separated from the centroid of peaks A, A’, and B by about one H2 vibrational quantum and apparently corresponds to a level that corre- lates to F+H,( U= 1); this assignment is supported by the isotopic substitution results.”
In the following sections, we first focus on the ground state transitions, particularly the differences between the n-H, and p-H2 spectra. A comparison of these results to new simulations on several proposed F + H, surfaces offers a convincing assignment of the features in the photoelec- tron spectrum. We then analyze the excited state transi- tions and compare the excited state potential energy curves extracted by our analysis to those obtained by Aquilanti et a1.38
B. Nuclear spin statistics in the anion and its effect on the photoelectron spectrum
The differences between the FHF photoelectron de- pending on whether n-H, orp-H, is used to make the anion
,.I’ ,,’
j M :’ ;’ ,’ v2.I
,
.’ - 3 .‘i ,,_ --.’
_.-- 292 .,,. ?, _ .~ - ..: 2 _.- _- _.__.- -. _... = 2,o ,_ _,_
3 0
,,<c .-.. .&Y ;:__Qii- -.--
2 i,i * . . . .-
1 -.. I,-. - -.‘..
0 0 I I
FREE 0,0-d.’ ROTOR LINEAR
*
Increasing anisotropy (\ / B)
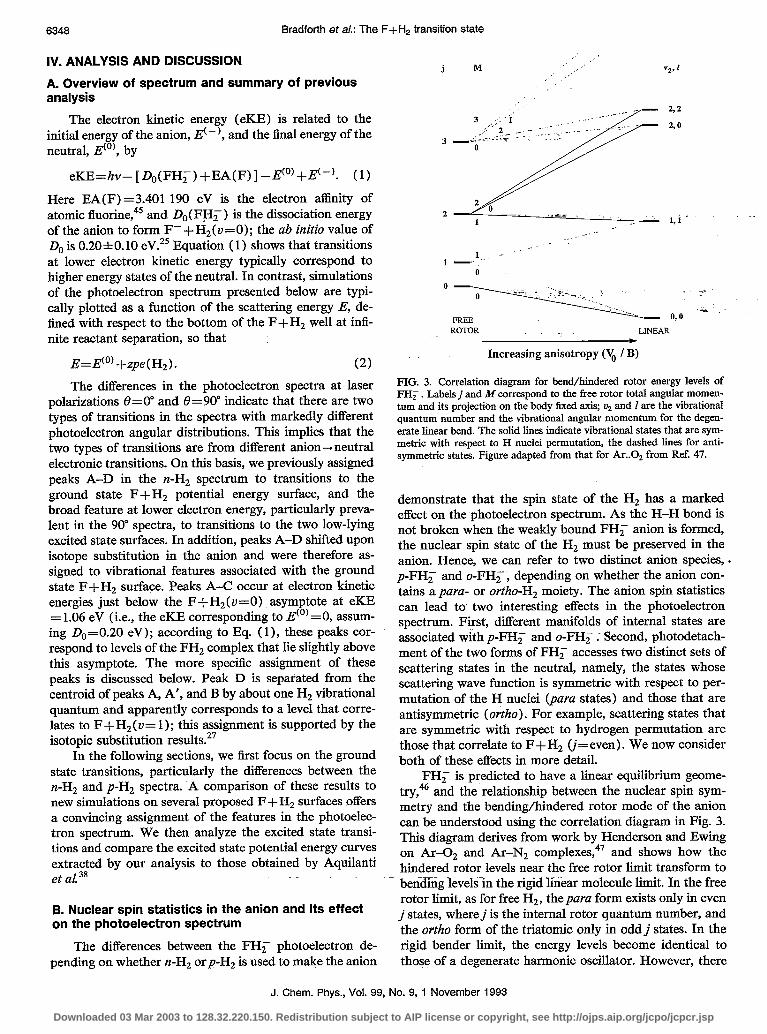
FIG. 3. Correlation diagram for bend/hindered rotor energy levels of FH; . Labelsj and M correspond to the free rotor total angular momen- tum and its projection on the body tixed axis; ur and I are the vibrational quantum number and the vibrational angular momentum for the degen- erate linear bend. The solid lines indicate vibrational states that are sym- metric with respect to H nuclei permutation, the dashed hues for anti- symmetric states. Figure adapted from that for Ar..02 from Ref. 47.
demonstrate that the spin state of the H, has a marked effect on the photoelectron spectrum. As the H-H bond is not broken when the weakly bound FH, anion is formed, the nuclear spin state of the Hz must be preserved in the anion. Hence, we can refer to two distinct anion species, . p-FHF and o-FH, , depending on whether the anion con- tains a para- or ortho-Hz moiety. The anion spin statistics can lead to two interesting effects in the photoelectron spectrum. First, different manifolds of internal states are associated with p-FH, and o-FH, .- Second, photodetach- ment of the two forms of FH; accesses two distinct sets of scattering states in the neutral, namely, the states whose scattering wave function is symmetric with respect to per- mutation of the H nuclei (para states) and those that are antisymmetric (ortho). For example, scattering states that are symmetric with respect to hydrogen permutation are those that correlate to F+H, (j=even). We now consider both of these effects in more detail.
FH, is predicted to have a linear equilibrium geome- try,46 and the relationship between the nuclear spin sym- metry and the bending/hindered rotor mode of the anion can be understood using the correlation diagram in Fig. 3. This diagram derives from work by Henderson and Ewing on Ar+ and Ar-N2 complexes,47 and shows how the hindered rotor levels near the free rotor limit transform to bending levels-in the rigid linear molecule limit. In the free rotor limit, as for free H, , the para form exists only in even j states, where j is the internal rotor quantum number, and the ortho form of the triatomic only in oddj states. In the rigid bender limit, the energy levels become identical to those of a degenerate harmonic oscillator. However, there
J. Chem. Phys., Vol. 99, No. 9, 1 November 1993
Downloaded 03 Mar 2003 to 128.32.220.150. Redistribution subject to AIP license or copyright, see http://ojps.aip.org/jcpo/jcpcr.jsp

Bradforth et a/.: The F+H, transition state 6349
is a doubling of each state due to the two equivalent posi- tions of the H nuclei. For each state there is a pair of wave functions: one is symmetric (s) and the other antisymmet- ric (a) with respect to permutation of the H nuclei. Near the rigid bender limit, with a large but finite barrier to internal rotation of Hz in the complex, the symmetric and antisymmetric levels split as indicated in Fig. 3. For the purposes of our experiment, the relative proportions of symmetric to antisymmetric states of FH, reflect the ratio of para- to ortho-hydrogen used in the clustering process, irrespective of what the actual value of Vo/B may be. Therefore para-H, will form only even symmetry states of FHF shown in Fig. 3; normal-H, will form 1:3 symmetric to antisymmetric states.
We have performed ab initio calculations48 on FH; that indicate the barrier to internal rotation of the H2 is about 3ooO cm-‘; this agrees with recent higher level cal- culations by Simons.4g Such a barrier is substantially larger than the rotational constant of H,, 60 cm-‘, implying that the FH; energy levels lie near the rigid bender limit. The splitting between the symmetric and antisymmetric levels associated with a bend level of the anion should then be small compared with the bend frequency (calculated value, w2=773 cm-1).25 Thus, if only the ground bend levels were populated in p-FH, and o-FH, , the small splitting between the symmetric and antisymmetric levels is not likely alone to be the cause of the difference between the p-FH; and n-FHF photoelectron spectra.
On the other hand, Fig. 3 shows that the F-/H,(j = 1) free rotor state formed from F- with H2(j= 1) cor- relates partially to the antisymmetric u2= 1 bend level of FHF, while the F-/H,(J’=O) free rotor state correlates only to the ground vibrational state of FH,. One might therefore expect more bend-excited FH, to be formed when n-H, is used than when p-H, is used (assuming et& cient rotational cooling of the p-H, to j = 0 prior to clus- tering with the F-). This represents a significant amount of internal energy which would certainly be expected to affect the photoelectron spectrum. However, the actual population of the antisymmetric u2= 1 level will depend on how much subsequent cooling to the antisymmetric v,=O level occurs in the free jet expansion. The similarities be- tween the rising edges (at high eKE) of the n-FHF and p-FCH, photoelectron spectra, where hot band effects should be most noticeable, suggest that cooling of the bending mode is quite effective.
A more likely explanation of the difference between the n-FHF and p-FHF spectra lies in the neutral scattering states accessible from photodetachment of the symmetric and antisymmetric levels of the anion. A correlation dia- gram similar to Fig. 3 can be applied to the neutral hin- dered rotor/bend levels in the entrance valley of the F + H, potential energy surface. Figure 3 applies only if the system is collinear in the rigid limit; a similar diagram4’ shows how free rotor levels correlate to the vibrational levels of a bent A2B molecule. In any case, the recent surfaces pro- posed for the reaction have fairly flat bend potentials in the Franck-Condon region so, in contrast to the anion, we expect the neutral levels to lie considerably closer to the
free rotor limit. Since the nuclear spin symmetry is un- changed by photodetachment, photodetachment of sym- metric anion levels can only access symmetric neutral lev- els, and similarly for the antisymmetric levels. Hence, the photoelectron spectrum of p-FH, can consist of progres- sions only in symmetric hindered rotor/bend levels of the neutral complex, that is, levels that correlate to F+H2 (j even), while the n-FHF spectrum can have progressions in both antisymmetric and symmetric levels, with a 3:l pref- erence for the former. The notion that it is the different manifolds of accessible neutral scattering states which are responsible for the differences between the two photoelec- tron spectra is strongly supported by the simulations dis- cussed in the next section.
C. Comparison of experimental and simulated photoelectron spectra
1. Theoretical methodology
The exact simulation of anion photoelectron spectra as Franck-Condon factors between bound anion vibrational wave functions and neutral reactive scattering wave func- tions was -pioneered by SchatzS0P51352 and Zhang and Miller.” Because these Franck-Condon factors only re- quire reactive scattering wave functions with total angular momentum J=O, at least to a good first approximation, they are relatively easy to compute using any one of a number of exact quantum reactive scattering methods.
The new FH, simulations reported in the present pa- per were performed using a coupled-channel Delves hyper- spherical coordinate method similar to the one described by Schatz.53 However, in contrast to the method chosen by Schatz to study the photoelectron spectra of ClHC1-50 and IHI-,” the required Franck-Condon overlaps with the ground FH, vibrational wave function were accumulated directly during the coupled-channel integration without explicitly calculating reactive scattering wave functions. This was done by using a hyperspherical coordinate ver- sion of the driven equation formulation of Band et aL54 in conjunction with an improved log derivative propagation algorithm.55 A simple way to implement the solution of driven close-coupled equations using the log derivative method has recently been described elsewhere.56
The ground vibrational wave function of para-FH, was modeled as a symmetrized product of harmonic nor- mal mode wave functions, as described in the paper by Zhang and Miller. ‘* The ground vibrational wave function of ortho-FH, was modeled as the corresponding antisym- metrized product, and the appropriate H2 permutation symmetry block of the F+H2 reactive scattering problem was selected accordingly for each simulation. The coupled- cluster (CCSDT) anion equilibrium geometry ( RF,H2 = 2.075 A, rn-n = 0.770 A) and multiconfiguration self- consistent-field (MCSCF) anion vibrational frequencies (al=292 cm-‘, a,=773 cm-‘, a,=4143 cm-‘) were taken from the ab initio calculations of Nichols et al.25
Finally, in order to facilitate doing a large number of calculations of comparable accuracy on several different
J. Chem. Phys., Vol. 99, No. 9, 1 November 1993 Downloaded 03 Mar 2003 to 128.32.220.150. Redistribution subject to AIP license or copyright, see http://ojps.aip.org/jcpo/jcpcr.jsp

6350 Bradforth et a/.: The F+H2 transition state
F+H, potential energy surfaces, the input to our Franck- Condon factor program was streamlined. This was accom- plished by using a series of one-dimensional heuristics to reduce the quadrature rule and basis set parameters re- quired by the reactive scattering part of the program to two simple input parameters E,, and j, . lg (The most obvi- ous roles of these parameters are that E,, is a cutoff for the energy, and j,, is~a cutoff for the diatomic rotational quantum number, of the asymptotic channels that are re- tained in the calculation.) These two parameters were then increased for each separate calculation until the results were converged to graphical accuracy. The resulting opti- mum production parameters were typically j,,= 17 and E,,=1.7 eV, measured from the bottom of the F+H2 valley. Similar parameters have also been found to give well-converged results for F+H, reactive scattering at an etiergy of E=0.45 eV,” which lies above the dominant peaks in the simulated FH, spectra.
2. T5a surface In previous work, the photoelectron spectrum of
n-FH; was cb;mpared with the simulation by Zhang et al., 18~28 in which the T5a surface was used for the neutral reaction. The anion was assumed to lie at the rigid bender limit, and the simulations used preliminary ab initio equi- librium parameters for the anion calculated by Nichols et al.25s57 However, Zhang and Miller explicitly chose the anion ground state wave function to be symmetric with respect to nuclear exchange,‘* so Frank-Condon overlaps were computed with only the symmetric set of scattering states. In fact, their calculation employs a separation of the scattering problem by nuclear inversion symmetry,58 and only one block, the para block, is used in the Franck- Condon calculation. Thus, the appropriate comparison with experiment is with the para-FH; spectrum, and not with the normal-FHj- spectrum as previously done.27’28 This only becomes an issue in light of the new experimental results showing that the p-FH; afid n-FW,- spectra are different.
Figure 4 (a) shows the correct comparison of the T5a simulation of the FH, photoelectron spectrum with our paru-FH; results. In this figure, we use &=0.23 eV for the dissociation energy of FH;(u=O) to F+H,(u=O), since this aligns the most intense peaks in the experimental (peak A’) and simulated spectra, as well as the smaller peaks at 0.5 eV. This value is well within the range of the ab initio value of Nichols (0.20 f 0.10 eV), but is slightly smaller than the value used in our previous comparison of the simulation with the n-FCH, spectrum (0.26 eV) ,
The normal-FHF spectrum, in contrast, contains tran- sitions that are 75% due to antisymmetric states. There- fore, to simulate this photoelectron spectrum, a computa- tion of the anion overlap with ortho scattering wave functions should be made and then added to the para sim- ulation shown in Fig. 4(a) in the correct ratio. We have recently carried out exactly this calculation, using the method in Sec. 4C 1. In these calculations, we have first reproduced Zhang and Miller’s result for para-FH; , and then gone on to compute the ortho scattering states and
0.0 0.5 1.0 - 1.5 Electron Kinetic Energy (eV)
I”” I “. I ““I
h
. 0.0 0.X .I 1.0 1.5
Electron Kinetic Energy (eV)
FIG. 4. [(a), top] Three-dimensional simulation (dotted) of the FIST photoelectron spectrum using the T5a surface, considering only symmet- ric permutation states, of Zhang and Miller (Ref. 28) compared to 8=0” FHi (para-Hz) experiifhtal spectrum (solid). [(b), bottom] Three- dimensional simulation (dotted) of the FI-I, photoelectron spectrum, considering both symmetric and antisymmetric permutation states com- pared to the 0=0” FH, (normal-H,) experimental spectrum (solid). The simulation is a weighted sum of the p-FH: and o-FHF simulations. Both calculations assume the same anion and neutral parameters and D,(F-..H,) =0.23 eV (see the text).
their Franck-Condon overlap with the antisymmetrized anion ground state wave function, which, in the rigid bender limit, is at the same energy as the symmetric wave function. Together these simulations yield the theoretical photoelectron spectrum of normal-FH; shown in Fig. 4(b), where it is compared to the experimental normal- FH;- spectrum.5g
Figures 4(a) and 4(b) make two points. First ~of all, although the energy of the initial anion state is the same in the para and ortho Franck-Condon calculations, the sim- ulations are noticeably different, supporting the idea that the overlap with different sets of scattering states is respon- silG for the differences in the photoelectron spectra. Sec- ond, the overall comparison of the experimental and sim- ulated spectra is not as good as was originally believed when the n-FH, spectrum was first compared to thepara simulation.
This is partly because of the new value of D,-, for FH, used to achieve the best fit between the p-FH, experimen- tal and simulated spectra; the new value shifts the simu- lated spectra 0.03 eV towards higher electron kinetic en- ergy. In addition, the spacings of features in the simulations are clearly inconsistent with the experimental spacings given in Table I; the eKEs of the four most in- tense peaks in the simulation are 1.018, 0.972, 0.852, and
J. Chem. Phys., Vol. 99, No. 9,1 November 1993 Downloaded 03 Mar 2003 to 128.32.220.150. Redistribution subject to AIP license or copyright, see http://ojps.aip.org/jcpo/jcpcr.jsp

Bradforth et aL: The F+ H2 transition state 6351
F+H2 Bending Potentials 0.502 eV. Also, peak A in the experiment n-FH; spectrum was originally believed to correspond to the sharp peak just above 1.0 eV in the para simulation. While this peak is more intense in the n-FH, experimental spectrum than in the p-FHF spectrum, it is I+ intense in the normal sim- ulation compared to the para simulation. This indicates that the original correspondence inferred by us was fortu- itous. This is an important point, because the analysis of the cumulative reaction probability22 on the T5a surface shows that the sharp peak in the simulation is from a re- active resonance. Based on the new results, this particular resonance is not apparent in the experiment.
Overall, Fig. 4 shows that simulations on the T5a sur- face do not reproduce key features of the experimental spectrum. This suggests that simulations on other potential energy surfaces proposed for the F+H2 reaction would be useful, and these are discussed in the next section.
5 ‘\ \\ 1’ /’
E ‘\ /’ a, i;
‘\ 1’ QO
‘\ ‘A --- 1’
/’ .:: -
45’ I 90 135 180
gamma (degrees)
3. Simulations on the 5SEC and TS surfaces In this section, we consider simulations on two addi-
tional F+H, surfaces: the SSEC surface proposed by Lynch et al. I1 and the TS surface proposed by Takayanagi and Sato.i2 The 5SEC surface is based on an ab initio sur- face which is improved near the saddle point using “scaled external correlation,” 6a and which also incorporates long- range attractive terms in the potential that result in a shal- low van der Waals well in the reactant valley. The TS surface is a purely empirical modified London-Eyring- Polanyi-Sato6’ (LEPS) surface which approximately re- produces the experimental angular distributions4 and HF vibrational population distribution1*2r4 in classical trajec- tory calculations. The bend potentials for the three surfaces at their saddle points are shown in Fig. 5. These are plotted as a function of the Jacobi angle ‘y, defined in Fig. 5. The bend potentials are all quite flat, but the other two surfaces favor bent geometries at the transition state to a greater extent than the T5a surface.
FIG. 5. Plot of bend potentials at the saddle point for the T5a, 5SEC, and TS potential energy surfaces as function of Jacobi angle ‘y, delined in lower half of the figure.
Figures 6 and 7 show simulated spectra obtained using the SSEC and TS surfaces. These again assume the anion is in the rigid bender limit, and use the ab initio anion geom- etry and frequencies of Ref. 25. Figures 6(a) and 7(a) are para simulations, and Figs. 6(b) and 7(b) are ortho sim- ulations [antisymmetric wave functions only, unlike Fig. 4(b)]. Note that these simulations are plotted as a function of scattering energy E, related to the electron kinetic en- ergy by Eqs. ( 1) and (2). Table II lists the energies and widths of the peaks in these simulations. A comparison of Figs. 4(a), 6(a), and 7(a) shows that the simulations are extremely sensitive to the potential energy surface assumed for the reaction; the peak spacings, intensities, and widths are very different in the three simulations. Moreover, the differences between the para and ortho simulations on the SSEC and TS surfaces are even more pronounced than on the T5a surface.
mental peaks in Fig. 2). The above discussion suggests that the lettered peaks appearing only in the para simulations are due to transitions to symmetric bend/hindered rotor levels of the FH2 complex, while those peaks that appear only in the ortho simulations correspond to antisymmetric levels. The SSEC simulations can be compared to the F + H2 (j =O) cumulative reaction probability ( CRP ) cal- culated by Kress and Hayes22 on the SSEC surface (with total J=O). Peaks A, B, and C in the simulation occur at very nearly the same energy as steps A, B, and C in their CRP. These steps correspond to vibrational levels of the transition state becoming accessible,62 and the comparison with the simulated photoelectron spectra implies these transition state levels are symmetric bend levels of the FH2 complex. Peaks D and E do not appear in Kress calcula- tion. This is consistent with our interpretation, since anti- symmetric bend levels would not be accessible from F + H2 (j =O) reactants.
There appear to be two types of peaks in the simula- tions: those that appear in both the para and ortho simu- lations and those that do not. The former are numbered, and the latter are labeled with capital letters. (Note that these letters are not intended to correspond to the experi-
Peaks 1 and 2 do not correspond to any features seen in F+H2 reactive scattering calculations on the SSEC sur- face. In fact, both occur at energies below the threshold for reaction on this surface ( -0.30 eV),21p22 and peak 1 lies below the reactant zero-point energy (0.269 eV) . This sug- gests that both peaks correspond to scattering states which are localized on the H+HF side of the saddle point. Such states are accessible via photodetachment, provided they have sufficient overlap with the anion, but do not appear in F+ H, scattering calculations (or experiments!). This as- signment is supported by simulations which assume a larger RF,H, distance for the anion (2.377 vs 2.074 A, not shown); peaks 1 and 2 are virtually absent in these simu- lations, while the lettered peaks are of comparable inten-
J. Chem. Phys., Vol. 99, No. 9, 1 November 1993 Downloaded 03 Mar 2003 to 128.32.220.150. Redistribution subject to AIP license or copyright, see http://ojps.aip.org/jcpo/jcpcr.jsp

6352 Bradforth et al.: The F+H, transition state
20 -I B
E (4
E (ev)
FIG. 6. (a) Three-dimensional simulations of para-FH, spectrum on 5SEC surface for F+H,. One-dimensional simulation (see the text) is superimposed as stick spectrum. For ease of comparison, the one- dimensional intensities are scaled so that the most intense one- dimensional peak is half the height of the most intense three-dimensional peak. Simulations are plotted as function of scattering energy E. (b) Three- and onedimensional simulations of orrho-FH, spectrum on 5SEC surface.
sity. Note that peaks 1 and 2 are considerably narrower than the lettered peaks, suggesting that the corresponding scattering states are actually quasibound resonances.
A similar situation occurs in the TS simulation. The lowest energy peak, labeled peak 1 + A in the para simula- tion and peak 1 in the ortho simulation, occurs at the same energy in both simulations. Peaks B and C appear only in the para simulation, while peaks D, E, and F appear only in the ortho simulation. This again suggests peaks B-F are due to progressions in bend/rotor levels of the FH, com- plex. The lowest energy peak lies just above the reactant zero-point energy. In simulations using the larger value of RFwHz in the anion (not shown), its intensity drops by about 70% in thepara simulation and by more than 95% in the ortho simulation. This suggests that in thepara sim- ulation of Fig. 7(a), peak 1 +A consists of overlapping transitions to a bend level of the F/H, complex (the A component) and a scattering state (the 1 component) lo- calized on the product side of the saddle point; the A com-
(a)
l+A
.4 0.5 0.6 0.7 0.8 E (eV)
201 E
F I
0.2 0.3 0.4 0.5 0.6 0.7 0.8
_
:
FIG. 7. (a) Three-dimensional simulations ofpara-FHT spectrum on TS surface for F+Hs. One-dimensional simulation superimposed as stick spectrum. Scaling of the one-dimensional intensities is the same as in Fig. 6(a). (b) Three- and one-dimensional simulations of ortho-FHF spec- trum on TS surface.
ponent of this peak is then absent in the ortho simulation. In order to provide further support for these assign-
men& we have carried out one-dimensional simulations of the FH, photoelectron spectrum in which only bending motion of the complex along the Jacobi angle y is allowed. In these simulations, RFwH2 and RHmH on the neutral sur- face are fixed at their equilibrium values in the anion; only y is allowed to vary. Hence, the one-dimensional simula- tion probe the bend potential of the neutral surface at the center of the Franck-Condon region.
The results of these simulations are superimposed on the three-dimensional simulations in Figs. 6 and 7. The one-dimensional simulations do an excellent job of repro- ducing the positions of the lettered peaks for both surfaces. Moreover, in the one-dimensional simulations, the appear- ance of peaks in the para vs ortho spectra mirrors the let- tered peaks in the three-dimensional simulations. Peaks 1 and 2 do not appear in the one-dimensional 5SEC simula- tion, consistent with the notion that they are transitions to product scattering states. For the TS simulations, the rel- ative intensity of peak 1 +A is lower by about a third in the
J. Chem. Phys., Vol. 99, No. 9, 1 November 1993
Downloaded 03 Mar 2003 to 128.32.220.150. Redistribution subject to AIP license or copyright, see http://ojps.aip.org/jcpo/jcpcr.jsp

Bradforth et al.: The F+H, transition state 6353
para FHZG -Simulation TABLE II. Positions, widths, and assignments of peaks inpara and ortho FHF simulations on the 5SEC and TS surfaces [CCSD(T) anion geom- etvl.
Simulation Peak Position/eV FWHM/eV Assignment
1 2 A B C
0.207 0.003 0.280 0.001 0.319 0.012 0.362 0.019 0.465 01027
H/HF resonance H/HF resonance F/Hs(j=O) M-W) F/H,(4)
1 0.207 0.003 H/HF resonance 2 0.280 0.001 HYHF resonance D 0.329 0.016 F/H,(l) E 0.405 0.019 F&(3) F 0.538 0.032 F/H,(5)
1 +A
B C
0.260 0.008
0.318 0.014 0.417 0.010
HA-IF resonance +WJWN F/H,(2) F/H,(4)
1 0.264 0.015 H/HF resonance D 0.289 0.022 F/H,(l) E 0.358 0.010 F/H2(3) F 0.491 0.014 F/H,(5)
one-dimensional vs three-dimensional simulations, sup- porting the idea that it consists of two overlapping transi- tions.
Overall, the comparison between the two sets of sim- ulations strongly supports the assignments of the lettered peaks to progressions in’bend/rotor levels of the neutral complex. Moreover, the increasing spacing of these peaks with E suggests we are closer to the free rotor than rigid bender limit for the neutral complex (see Fig. 3). Hence, based on the energetic ordering of the peaks, each can be assigned to an F/Hz(j) hindered rotor level which corre- lates asymptotically to the reactant free rotor level F+H,(j). These assignments are listed in Table II.
4. Comparison with experiment
Figures 8 and 9 show the p-FH; and n-FH, photo- electron spectra superimposed on appropriate simulations using the SSEC and TS surfaces, respectively. The simula- tions have been convoluted with a 15 meV full width at half-maximum (FWHM) Gaussian to approximate the ex- perimental resolution. Also, slightly different values of Do( FH,) are used (0.20 and 0.24 eV for the SSEC and TS simulations, respectively) to optimize the alignment of the simulated and experimental spectra; see Eqs. ( 1) and (2).
Both simulations of the p-FH, spectra consist of a small number of peaks which approximately follow the contour of the experimental spectrum; it is difficult to choose which simulation is superior based on this compar- ison alone. However, the TS surface is clearly better with
1 .c
T? 0.8
: E .- 0.6
s .- -6 5 0.4 L
0.2
z f 5 E .- : .- z 3
eKE = 1.3305-E ,V - F W H M = 0.015 eV -
0.4 0.6 0.8 I:0 1.2 electron kinet’rc energy (eV)
normal FH2- Simulation
eKE = 1.3305-E aV -
1 .o F W H M = 0.015 eV
0.6
electron kinetic energy (eV)
FIG. 8. Simulations of @I-I; and n-FHi photoelectron spectra using SSEC surface superimposed on experimeptal (19=@) spectra. D0=0.24 eV is assumed for FH; in the simulations.
respect to simulating the n-FH, spectrum; the positions and intensities of the three main peaks in the experimental spectrum (A, A’, and B) -are reproduced reasonably well in the TS simulation but not in the SSEC simulation. Thus, the TS surface does better overall in simulating the FH, photoelectron spectrum.
The reasonable agreement between the experimental spectra and TS simulations implies that most of the struc- ture in the experimental spectra is due to progressions in bend/rotor levels of the FH, complex. This explains why some of the features in the n-FHF spectrum are largely absent in thep-FH; spectrum: transitions to both symmet- ric and antisymmetric bend/rotor levels occur in the n-FHF spectrum, but only transitions to symmetric levels should occur in the p-FH, spectrum. Based on the corn- parison with the TS simulations, the various peaks~in the experimental spectrum can be assigned to transitions to F/H, ( j ) hindered. rotor levels. Specifically, peak A’ can be assigned to the F/H,(j =2) level, while peaks A, B, and C, which are prominent only in the n-FHT spectrum, are
J. Chem. Phys., Vol. 99, No. 9, 1 November 1993 Downloaded 03 Mar 2003 to 128.32.220.150. Redistribution subject to AIP license or copyright, see http://ojps.aip.org/jcpo/jcpcr.jsp

6354 Bradforth et a/.: The F+Hp transition state
% c g E .- T .- z z
pat-a FH2- Simulation
aKE-= 129965-E eV
1 .o - FWHM = 0.015 eV
0.6
1.0 1.2 electron kinetic eneigy (eV)
normal FHZ- ~Simulation
eKE = 1.2905-E eV -
1 .o FWHM = 0.015 eV
.g 0.8
it! (II
2 0.6 F .- z z 0.4 L
electron kinetic energy (eV)
FIG. 9. Simulations of p-FHF and n-FH, photoelectron spectra using TS surface superimposed on experimental (0=W) spectra. &=0.20 eV is assumed for FJX; in the simulations.
due to F/HZ(j) levels with j= 1, 3, and 5, respectively. The shoulder in the p-FH, spectrum at 0.85 eV appears to be due to the F/l&, (j=4) symmetric level.
Note that peaks A and B in the experimental spectra (see Fig. 2), although assigned to antisymmetric bend/ rotor levels, are not completely gone in the p-FH, spec- trum. We believe this is because some Hz para-+ortho con- version takes place in the mixing cylinder prior to the experiment, so that there is some nonzero population of Hz ( j = odd) rotational levels in the reagent gas mixture. This is also at least part of the reason why thep-FH, simulation is considerably more structured than the experimental spectrum. Another possible contribution to the discrep- ancy between experimental and simulated para spectra is that the peaks in the simulation are too narrow because of deficiencies in the TS surface; we have observed similar discrepancies in several past comparisons of experimental and simulated transition state photodetachment spectra where a LEPS surface is assumed to describe the reac- tion.42
In the n-FH; simulation, the peak at highest electron kinetic energy is too intense. This is the sum of peak 1 +A in Fig. 7(a) and-peak 1 in Fig. 7(b) in a 1:3 ratio. In light of the discussion in Sec. 4C 3, most of the intensity of this peak-5 due to a scattering state localized on the product side of the saddie point. Its intensity ‘would be reduced if the barrier height were increased, as this state would then have .less amplitude in the Franck-Condon region, and hence. less “overlap with the anion wave function. This dis- crepancy thus points to a specific modification which ‘shZu%l ‘be made- to the TS surface; the requirement of a higher barrier is consistent with the observation’2 that the tra@ tion state theory rate constant on the TS surface is tbo high.
We should emphasize that the center of the Franck- Condon region lies considerably closer to the collinear sad- dle point on the TS surface (for which RF-q = 2.031 A) than on the T5a surface ( RFmH2 = 1.953 A). Hence, the
, overlap of the anionwith the neutral transition state region is even better than in Fig. 1. This means that there should be v@y close correspondence between the peaks in the pho- toelectron spectrum and the’ bend/rotor levels of the F+H2 transition state, assuming that the assignment im- -’ .-q -lF. .- ; . _ _ plied by the comparison with the TS simulations is correct.
*‘* On the other hand, the only peak in the TS simulations that--might be due to a resonance, peak 1, is not clearly
:? -obssbie in the experimental spectrum at our current resol&on. _I.
.: overall, the comp&sons between the experimental and simulated spectra in Figs. 4, 8, and 9 show that the FH; photoelectron spectrumis extremely sensitive to the nature of the bend potential in the transition state region. This seems to be approximately correct only on the TS surface. The bend potential is expected to play a major role in determining the reaction rate constant as well as the product energy and angular distributions. Hence, our ex- periment provides a very direct probe of one of the most important features of the F+H2 potential energy surface.
Finally, we note that the FHF photoelectron spectrum is qualitatively very different from our earlier studies24 of heavy + light-heavy X + HY reactions via photoelectron spectroscopy of XHY-. In the XHY- studies, the most prominent features were progressions in the antisymmetric stretch mode of the XHY complex, although our higher resolution work on IHI- did reveal structure attributable to bending/hindered rotor motion of the IHI complex.63 These differences are understood in light of the internal coordinate along which the greatest change in the potential energy surface occurs upon photodetachment. In the XHY- spectra, one typically has a single minimum poten- tial along the antisymmetric stretch coordinate in the an- ion, and a double minimum potential in the neutral (in the center of the Franck-Condon region). In the case of FH, photodetachment, the anion is a reasonably rigid linear species, while the bend potential for the neutral is a double minimum potential which is also considerably flatter than in the anion.
J. Chem. Phys., Vol. 99, No. 9, 1 November 1993 Downloaded 03 Mar 2003 to 128.32.220.150. Redistribution subject to AIP license or copyright, see http://ojps.aip.org/jcpo/jcpcr.jsp

Bradforth et al.: The F+H, transition state 6355
_=.- .--- 0
clsx 010 is====mF”am”l .., 30
FIG. 10. Highest molecular orbitals for FH, , showing the 30; one of the In; and the 4~7 orbitals, all of which are fully occupied in the anion. The molecular orbitals are the optimized MP2/6-3 1+ + G** orbitals evalu- ated at the computed equilibrium structure for the FH, ion at the same level of nb initio theory.
D. Electronic effects
In this section, we consider what can be learned about the low-lying excited state F+H2 potential energy surfaces from the broad features at low electron kinetic energy in the 8=90” spectra of Fig. 2.
1. Background
The approach of a F atom with a ground state H2 molecule may occur on three potential energy surfaces, which are labeled 1 2Ar, 2A”, and 2 2A1 in the most general symmetry of collision (C,). The upper 2A” and 2 2A’ sur- faces become degenerate in C,, (collinear approach) so that there are only two surfaces 2H and 211. Figure 10 shows the highest occupied molecular orbitals for the an- ion, where the C,, point group is appropriate. Photode- tachment of an electron from the filled 4a and 1~ orbitals leads to the 22 and 211 states, respectively, in the neutral. Only the lowest surface, the 2X, where the fluorine atom approaches with the p orbital containing the unpaired elec- tron along the H2 bond, adiabatically leads to reaction. It is this ground state surface that we have focused on in the preceding sections. The introduction of spin orbit coupling in the F atom splits the degeneracy of the upper 211 sur- faces in C,, and the correct state labels are 2&2, 2113,2, and 21Tln The 2P3,2-2P112 splitting in the fluorine atom is 0.0501 eV.64 A correlation diagram is shown in Fig. 11. In the adiabatic limit, only the 2Z1,2 surface leads to H+HF reaction products and the F(2P1,2) state is completely un- reactive. However, reaction may also take place via the 2111,2 surface if nonadiabatic coupling is appreciable.
A number of model potential energy surfaces have been proposed for the excited state surfaces over the years. In 1972, Blais and Truhlar constructed semiempirical va- lence bond surfaces for the 28 and 211 states.65 An ab initio calculation of these surfaces at the SCF level was subse- quently carried out by Rebentrost and Lester.66 Spin-orbit effects were neglected in these studies, but were included semiempirically in the calculation of collinear and three- dimensional surfaces by Jaffe et aL67 and Komornicki
W ’S ) + HFh)
_..c: .:~ -“i.
FIG. 11. Electronic correlation diagram for F+H,.
et al. 32 and in diatomics-in-molecules (DIM) calculations by Tull~,~l and by Faist and Muckerman.33 The effect of the excited states on the FHH bend potential on the ground state surface has been considered recently by Wright.68
Several of these studies have considered the reactivity of the F(2P1,2) state via nonadiabatic effects. Semiclassical scattering calculations by Tull~,~* Komornicki,32 and Muckerman33 demonstrated that the F( 2P1,2> +H2 may contribute significantly to the overall reaction cross sec- tion. The multisurface problem was also considered in col- linear quanta1 scattering calculations by Zimmerman et al. 34 and LePetit et al. 35 The other nonadiabatic effect of interest is electronic-to-rotational energy transfer since the spin-orbit splitting in F is very close to the j =0-2 spac- ing in H2. This process has been predicted to be quite efficient in calculations by Rebentrost36 and Wyatt.37
One point that emerges from these studies, not surpris- ingly, is that the reactivity of the F(2P1,2) state depends strongly on the assumed form of the ground and excited state surfaces used in the scattering calculations, and the excited state surfaces are particularly suspect. The ab initio calculation of excited state surfaces is a challenge, and, until recently, there has been very little experimental data to aid in the empirical development of these surfaces. Ex- periments on the F+H2 reaction by Lee and co-workers4 showed no evidence for reactivity of F(2P1,2), nor did the experiments of Hepburn et al. on the F+HBr reaction, for which one might expect similar nonadiabatic effects in the entrance channel as in the F+H, reaction6’ The experi- mental work most directly related to the excited states has been performed by Aquilanti and co-workers.38 By mea- suring the total scattering cross section of magnetically analyzed F atoms with D2 as a function of collision energy, they reported experimentally determined potentials for all three states. However, only the long range part of each potential ( RF-H2 > 2.5 A) is well characterized in these experiments, although their derived functional forms for the potentials can be extrapolated to shorter range.
J. Chem. Phys., Vol. 99, No. 9, 1 November 1993 Downloaded 03 Mar 2003 to 128.32.220.150. Redistribution subject to AIP license or copyright, see http://ojps.aip.org/jcpo/jcpcr.jsp

6356 Bradforth et ab: The F+H2 transition state
--?&ion to the 2113,2.1,2 states only. The two photon F- peaks
Electron Kinetic Energy (eV)
FIG. 12. (a) Difference plot of the 266 nm normal-FH, spectra. Here the 8=0” spectrum has been scaled and subtracted from the 8=90” spec- trum to yield the band due to transitions from the anion to the ‘IIjjz and %2 FIX2 states. (b)-(d) Collinear two-dimensional simulations of the ‘lI bands described in text. Potential along RP,H2 constructed as follows: (b) V,, chosen to approximate DIM curves of Ref. 3 1, (c) from func- tional form and parameters from Ref. 38, and (d) V,, chosen to yield a fit to photoelectron band (a). In all simulations, transitions to both spin orbit components of the *Il state have been considered, and are assumed to have equal transition probability (dashed and dot-dashed lines). The sum of the two subbands are shown by the solid line.
As mentioned above, photodetachment of FH, ac- cesses both the ground and excited state F+H, surfaces. Our photoelectron spectra probe these surfaces at closer range than Aquilanti’s work and therefore provide comple- mentary information tin the potentials. In the following sections, we first describe how the contribution of the ex- cited states to the FHF photoelectron spectrum in Fig. 2 is determined. We then present simulations of the spectrum on various excited state potentials.
2. Extraction of excited state bands As discussed in Sec. 4A and in our previous work,27
the contribution of the 211 states to the FH, photoelectron spectrum is all but eliminated at the laser polarization an- gle 8=0”. This spectrum may then be used as a reference spectrum for the 22 band, and we may subtract this spec- trum, appropriately scaled, from the 0=90” spectrum to determine the contribution of the 211 states. Let us assume that feature A (at highest eKE) in the normal-FH, spec- trum has no contribution from the excited electronic states, and so this peak is a marker of the contribution of the 281,2 surface to the photoelectron spectrum for the scaling pro- cedure in the subtraction.
Figure 12(a) shows the subtracted result which we will assume represents the spectrum of transitions from the
_,-,..- at 1.21 and 1.26 eV appear with relatively large inten&y in the difference plot because the F(2P,,2,,,2) +F- transitions also have electron angular distributions peaked at 8=90”. The noise in the region 0.9-1.1 eV is most likely due to slight differences in the 28 band shape due to incomplete signal averaging, which is amplified in the subtraction pro- cl&Z The structure we are interested in lies between 0.5 and 0.9 _eV. The band rises fairly sharply at eKE=0.9 eV, peaks at approximately 0.8 eV, and has a FWHM of -0.3 eV. We note ‘that the band is quite asymmetrical.
In order to ensure that the spectrum in Fig. 12(a) represents the entire 211 band, we have recorded photoelec- tron spectra of normal-FHF at 213 nm (not. shown), where the photon energy is 1.17 eV higher. The spectra are essentially identical to their respective 266 nfi coimter- parts, except for ‘the I. 17 eV shift to higher eKE and di- minished spectral resolution. The polarization dependence of the signal is also the same. The important result is that no additional bands are observed for FH; photodetach- he% t&t a&-not present in the 266 nm spectra. Thus, there are no other electronic bands within 2 eV of the 22 band except those seen in the 266 nm spectrum appearing at polarization f3= 90”. Further, Muckerman’s semiquanti- tative correlation diagram predicts that only one electronic state, the 211 state, is expected within 6 eV of the ground state.33 Hence we may confidently assume that the allowed transitions from the anion to both the 2JIi components are those in the 266 nm spectnim between eKE=0.5 and 0.9 eV.
3.2n sinwlafions
As described above, several potential energy curves have been proposed for the Il interaction between F and H,. The potentials are essentially repulsive as they corre- late to high lying, dissociative, states of HF (see Fig. 10). To assess the accuracy of these curves in the Franck- Condon region, we attempt to simulate the photoelectron band in Fig. 12(a) using two of these potentials: the diatomics-in-molecules (DIM) potentials of Tully31 and the experimentally derived potentials of Aquilanti et al.38
Since the excited state curves are strongly repulsive along the R,+ coordinate, the photoelectron spectrum is largely determined by the slopes of these curves in the FrGZk-Condon region, and effects due to differences be- tween the bend potentials of the anion and neutral should be relatively minor. We therefore restrict the simulations to collinear geometries, and use two-dimensional potential en- ergy surfaces of the form
fl;) = ~rmdR~-~> + ~:~WP,HJ, (3)
where Abound is the bound ‘H+ potential curve of H,, mod- eled by a Morse function, $1 * rep 1s the repulsive interaction of the F atom with H, in a II configuration and iy~3/2, l/2.
Tully calculated Prep for both spin orbit components.3* The resultant DIM potentials can be approximately de- scribed by exponential functions,
J. Chem. Phys., Vol. 99, No. 9, 1 November 1993
Downloaded 03 Mar 2003 to 128.32.220.150. Redistribution subject to AIP license or copyright, see http://ojps.aip.org/jcpo/jcpcr.jsp

Bradforth et al.: The F+H2 transition state 6357
f13j2) CA rep 3/2 eXP(-f13/2RF,Hzh
(4) f11n)=A~/2 exP( --&/~RF,H~)+A, =P
where A=O.O501 eV, the spin-orbit splitting in fluorine,64 and V is in units of eV and RF,H, in A. In contrast, the experimentally fitted Vrep potential curves of Aquilanti et aL3$ are formulated using a more complex functional form, which can be evaluated at the shorter values of RF,H$II the Franck-Condon region in order to simulate the spectrum.
To simulate the photoelectron band, we need to calcu- late the overlap of the anion ground state wavefunction with the scattering states supported by each 211 surface. If we ignore nonadiabatic effects, as also assumed in the ground state simulations in Sec. IV C, a relatively simple quantum mechanical calculation using the potential func- tion given by Eq. (3) will yield the scattering states for each spin-orbit surface. We actually simulate the excited state spectrum with a two-dimensional wave-packet prop- agation calculation.” This is formally equivalent to the time-independent methods used in the previous section, although the dimensionality of the time-dependent calcu- lation is lower. The contribution of the 211 states, and the model we are using to describe it, is very similar to the that of the F+HO+HF+O( ‘D) reaction to the OHF- spec: trum.71 In the Franck-Condon region the Vn potentials are fairly repulsive, so the wave packet moves quickly out of this region, and only a short propagation time is neces- sary. All the 211 simulations assume the ab initio anion geometry and frequencies of Nichols et aL25 In contrast to the ground state simulations, a Morse potential (rather than a harmonic potential) is assumed for the H-H stretch in the anion with ape (but not r,) the same as in free H2 .72 A value of Do=0.23 eV was assumed for the anion disso- ciation energy [see Eq. (44)]. For the Vbound term in V,, Morse parameters derived from the spectroscopic con- stants of H2 are used.
The first simulation Fig. 12(b)] assumes f13,2=5.53 A-‘, ~t,,~=3022 eV, &2=5.60 A-‘, and A,,,=2950 ev for V,, in Eq. (4); these parameters give the best fit to the DIM potential curves shown in Fig. 2 of Ref. 3 1. Each subband has similar shape and the shape reproduces the experimental band shape in that it rises fairly rapidly at lower scattering energies (high eKE) and has a longer tail at low eKE. However, it is immediately apparent that V,, is not repulsive enough to reproduce the FWHM of the band. The FWHM in the simulation, for each 211 com- ponent, is only 0.065 eV. Further, the onset of the band (the high eKE edge) is very close to the F+H,( v=O) asymptote near 1 eV, and in comparison to the experimen- tal band is at too high electron kinetic energy.
The simulation in Fig. 12(c) results from using the much more repulsive excited state potentials of Aquilanti for e:k. The simulated band onset is at much lower eKE (0.75 eV) and the band has a much wider FWHM, 0.62 eV, than the simulations on the DIM-like potentials. This is clearly at the opposite extreme; the surface is now too repulsive at the calculated anion geometry. We note in
1.5 2.0 2.5 3.0 R IA KHZ
FIG. 13. The variation of potential energy for the three lowest lying electronic states of FHs as a function of the F to Hz distance. Lowest curve (%Zt,s) is calculated from the T5a surface (Ref. IO), upper 211sn,1,2 surfaces are those calculated to best fit difference spectrum Fig. 12(d) (see the text). The ‘2,,, curve is included only for purposes of compar- ison; it was not used in the simulations in Fig. 12.
passing that the potential of Blais and Truhlar,65 which has been used by others in dynamical studies,34’35 although less repulsive than that of Aquilanti, also yields a simulated band much wider than experimentally observed.
The third simulation shown, Fig. 12(d), is a compro- mise “fit.” Here we have again used a Vrep with the form of Eq. (4), but, compared to that used in the first simulation, the fit potential has the correct slope and potential energy offset at the anion F to H2 separation. The fitted Vr,,p CUIVeS (p3,2+.18 A-', x43,2=161.5 ev, &2=3.22 ii-l, All22 161.9 eV) are shown in Fig. 13~ along with the T5a potential for the 28 state. The vertical energy differences from the 22,,2 to the 2H3,2 and 2111,2 curves in Fig. 13 at the anion RF,H, are 0.18 and 0.21 eV. In comparison, Simons’ ab initio calculation suggested 0.25 eV for the 21;-211 splitting at this geometry,25 whereas Tully’s DIM curves suggest 0.01 and 0.06 eV separation from the 22,,2 to the 2113/2 and 21111,2, respectively. 31 Wright gives the 22-211 separation at the Z state saddle point geometry as -0.78 eV.68 The simulated subbands in Fig. 12(d) are separated by 0.03 eV at the band maximum and the FWHM for the 2113,2 and 2111,,2 subbands are 0.23 and 0.21 eV, respectively. The sum of the simulated subbands ap- proximately reproduces the whole unresolved band in our experimental spectrum.
The small bump observable at low electron kinetic en- ergies (0.3-0.4 eV> in simulations (b) and (d) (in each spin orbit component) is due to overlap with states corre- lating to H2 (u= 1); there is overlap to these vibrationally excited states because the anion has a slightly elongated H-H bond, and the valleys in the V, surfaces have RH-H set at the equilibrium H2 value. The intensity of this band depends on two factors, the degree of H-H elongation in the anion and on the anharmonicity assumed along the H-H stretch in the anion. It seems reasonable to expect ~3, for this mode to be at least as large in the anion as it is for free H2, which we have assumed in the simulation, and it is most likely larger (which would yield more inten- sity in the U= 1 bump). This may account for some of the
J. Chem. Phys., Vol. 99, No. 9, 1 November 1993 Downloaded 03 Mar 2003 to 128.32.220.150. Redistribution subject to AIP license or copyright, see http://ojps.aip.org/jcpo/jcpcr.jsp

6358 Braciforth et a/.: The F+H2 transition state
signal extending out to low eKEs in the experimental dif- ference plot.
The important result here is that the ‘II surfaces rise more steeply in the interaction region than predicted by the DIM approach, but less steeply than extrapolated by Aq- uilanti’s potentials fitted to low energy elastic scattering data. We have therefore determined improved potential parameters for V,, at short range, with the caveat that the CCSD(T) ab inirio value of Nichols for the anion equilib- rium geometry, used throughout this paper, has been as- sumed to be correct. The simulated bandwidth is, unfortu- nately, strongly dependent on the assumed anion equilibrium RF,Hz. Assuming the ab initio anion geometry is reasonably accurate, then our results for the II potentials indicate that there is stronger nonadiabatic coupling be- tween the Q= l/2 surfaces near the ground state saddle point than one would suppose based on Aquilanti’s poten- tials. However, it remains to be seen if these nonadiabatic effects are sufficiently strong to noticeably influence the reaction dynamics.
V. SUMMARY
In this work we have presented new experimental and theoretical results on the spectroscopy of the F+H, tran- sition via photodetachment of FH,. The experimental FHT photoelectron spectra show transitions to the ground F+H, potential energy surface as well as to low-lying ex- cited state surfaces. There are pronounced differences in the ground state photoelectron band depending on whether the FH, is synthesized from normal or para hydrogen. These differences indicate that previous comparisons of the n-FIX; photoelectron spectrum with theory were, in retro- spect, inappropriate. The striking dependence on the nu- clear spin statistics in the anion is interpreted to mean that the photoelectron spectra consist of progressions in bend/ hindered rotor levels of the FH2 complex. This interpreta- tion is strongly supported by one- and three-dimensional simulations of the para and normal photoelectron spectra performed on several different surfaces for the F+H2 re- action. These simulations explicitly account for the anion nuclear spin statistics. The best agreement in the work reported here is obtained with the empirical TS surface from Ref. 12; the agreement between the experimental and simulated spectra is considerably better than when either the T5a or 5SEC surface is used.
Quantitative consideration of the excited state bands, assigned to the-2113j2 and 2111,2 states, has been made here, and collinear simulations have allowed the determination of the shape of these potential curves along the RSHz co- ordinate. These results represent the first experimental characterization of the excited state potentials at geome- tries close to the transition state on the ground state sur- face. We hope that the results of this analysis will stimulate new ab initio work on characterizing these excited state surfaces, and their nonadiabatic coupling to the ground state surface.
There is clearly much still to learn about the F+H2 reaction, and our photoelectron experiments have intro-
duced a new experimental approach into the fitting of the potential surfaces, both in the transition state region for the ground reaction surface and in the inner regions of the upper nonreactive surfaces. Further experiments to extract even more detail are possible. Zero electron kinetic energy (ZEKE) photodetachment spectroscopy, with an attain- able resolution of 2-3 cm-‘, would be particularly useful for this transition state system.63’73 As the feature A in the normal-FH; spectrum is quite narrow, a more concrete assignment of the FHF internal states giving rise to the peaks in this region should be possible in a ZEKE spec- tmm.
On the theoretical side, new simulations for the pho- toelectron spectrum of FD, have been performed on the surfaces considered here and will be published elsewhere.74 These support the current bending assignments when com- pared to the-experimental FD, spectrum.” Also, Werner and co-workers75 have recently developed a new ab initio F+H2 surface, and preliminary simulations of the p-FHF and n-FHF photoelectron spectra yield even better agree- ment with the experimental spectra than in the results re- ported here.76 Moreover, Simons4’ has performed ab initio calculations on more of the FH, potential energy surface. This will enable the determination of more realistic anion vibrational wave functions than the harmonic wave func- tions used in the simulations reported here. It should there- fore be possible to perform very stringent tests of this new surface in the near future.
ACKNOWLEDGMENTS
We would like to thank Professor J. Zhang for com- municating new Franck-Condon results for the 5SEC sur- face. We thank Professor R. J. Saykally for useful discus- sions on nuclear spin statistics considerations in the FH; anion. This work has been sponsored by the United States Air Force Office of Scientific Research under Contract No. AFOSR-91-0084, and by the United Kingdom Science and Engineering Research Council.
‘J. H. Parker and G. C. Piientel, J. Chem. Phys. 51,91 (1969); R. D. Coombe and G. C. Pimentel, ibid. 59,251 (1973); M. J. Berry, ibid. 59, 6229 ( 1973).
‘J. C. Polanyi and D. C. Tardy, J. Chem. Phys. 51, 5717 (1969); J. C. Polanyi and K. B. Woodall, ibid. 57, 1574 (1972); N. Jonathan, C. M. Melliar-Smith, and D. H. Slater, Mol. Phys. 20, 93 (1971).
3T. P. Schafer, P. E. Siska, J. M. Parson, F. P. Tully, Y. C. Wong, and Y. T. Lee, J. Chem. Phys. 53, 3385 (1970).
‘D. M. Neumark, A. M. Wodtke, G. N. Robinson, C. C. Hayden, and Y. T. Lee, J. Chem. Phys. 82,3045 (1985); D. M. Neumark et al., ibid. 82, 3067 (1985).
5M. Faubel, S. Schlemmer, F. Sondermann, and J. P. Toeties, J. Chem. -Phys. 94, 4676 (1991). ‘E. Wurzburg and P. L. Houston, J. Chem. Phys. 72,481l (1980); R. F.
Heidner, J. F. Bott. C. E. Gardner. and J. E. Melzer, ibid. 72, 4815 (1980).
7W. H. Miller, Annu. Rev. Phys. Chem. 41, 245 (1990). *C. F. Bender, P.K. Pearson, S. V. O’Neill, and H. F. Schaeffer, J. Chem. Phys. 56, 4626 (1972); Science 176, 1412 (1972); H. F. Schaeffer, J. Phys. Chem. 89, 5336 (1985).
‘J. T. Muckerman, in Theoretical Chemistry-Advances and Perspectives, _ec.jited by H. Eyring and D. Henderson (Academic, New York, 1981), Vol. 6A, pp. l-77.
‘OR Steckler, D. G. Truhlar, and B. C. Garrett, J. Chem. Phys. 82, 5499 (i985).
J. Chem. Phys., Vol. 99, No. 9, 1 November 1993
Downloaded 03 Mar 2003 to 128.32.220.150. Redistribution subject to AIP license or copyright, see http://ojps.aip.org/jcpo/jcpcr.jsp

Bradforth et ab: The F+H2 transition state 6369
“G.C. Lynch, R Steckler, D. W. Schwenke, A. J. C. Varandas, and D. G. Truhlar, J. Chem. Phys. 94, 7136 (1991).
“T.Takayanagl and S. Sato, Chem. Phys. Lett. 144, 191 (1988). 13C. W. Bauschliche;, S. P. Walch, S. R. Langhoff, P. R. Taylor, and R.
L. Jaffe, J. Chem. Phys. 88, 1743 (1988); R. J. Bartlett, J. Phys. Chem. 93, 1697 (1989).
‘“D G Truhlar, J. Chem. Phys. 56,3189 ( 1972); J. T. Muckerman and . . M. D. Newton, ibid. 56, 3191 (1972).
“G C Schatz, 3. M. Bowman, and A. Kuppermann, J. Chem. Phys. 63, . . 674 (1975); J. N. L. Connor, W. Jakubetz, and J. Manz, Mol. Phys. 35, 1301 (1978); R. E. Wyatt, J. F. McNutt, and M. J. Redmon, Ber. Bunsenges Phys. Chem. 86, 437 (1982).
16J. D. Kress, Z. Bacic, G. A. Parker, and R. T Pack, Chem. Phys. Lett. 157,484 (1989); Z. Bacic, J. D. Kress, G. A. Parker, and R T Pack, J. Chem. Phys. 92, 2344 (1990).
t7C.-H. Yu, D. J. Kouri, M. Zhao, and D. G. Truhlar, Chem. Phys. Lett. 157,491 (1989); C.-H. Yu, D. J. Kouri, M. Zhao, D. G. Truhlar, and D. W. Schwenke, Int. J. Quantum Chem. 23, 45 (1989).
‘*J. Z. H. Zhang and W. H. Miller, J. Chem. Phys. 92, 1811 ( 1990). “D. E. Manolopoubs, M. D’Mello, and R. E. Wyatt, J. Chem. Phys. 93,
403 (1990); M. D’Mello, D. E. Manolopoulos, and R. E. Wyatt, Chem. Phys. Lett. 168, 113 (1990).
20(a) J. M. Launay and M. LeDoumeuf, Chem. Phys. Lett. 169, 473 (1990); (b) J. M. Launay, Theor. Chim. Acta 79, 183 (1990).
*‘G. C. Lynch et aL, J. Chem. Phys. 94, 7150 (1991). **J. D. Kress and E. F. Hayes, J. Chem. Phys. 97,488l (1992). u F. J. Aoiz, V. J. Herrero, M. M. Nogueira, and V. Saez Rabanos, Chem.
Phys. Lett. 204, 359 (1993). %R. B. Metz, S. E. Bradforth, and D. M. Neumark, Adv. Chem. Phys.
81, 1 (1992). **J. A. Nichols, R. A. Kendall, S. J. Cole, and J. Simons, J. Phys. Chem.
95, 1074 (1991). 26A. Weaver, R. B. Metz, S. E. Bradforth, and D. M. Neumark, J. Chem.
Phys. 93, 5352 (1990). 27A Weaver and D. M. Neumark, Faraday Discuss. Chem. Sot. 91, 5
(1991). *sJ Z H. Zhang, W. H. Miller, A. Weaver, and D. M. Neumark, Chem.
Phys. Lett. 182, 283 (1991). *‘O. Hahn and H. S. Taylor, J. Chem. Phys. 96, 5915 (1992). ME. Pollak, M. S. Child, and P. Pechukas, J. Chem. Phys. 72, 1669
(1980); E. Pollak, Chem. Phys. 61, 305 (1981). “J. C. Tully, J. Chem. Phys. 59, 5122 (1973); 60, 3042 (1974). 32A. Komornlcki, K. Morokuma, and T. F. George, J. Chem. Phys. 67,
5012 (1977). “M. B. Faist and J. T. Muckerman, J. Chem. Phys. 71, 233 (1978). 34I. H. Zimmerman, M. Baer, and T. F. George, J. Chem. Phys. 71,4132
(1979). 3sB. LePetit, 3. M. Launay, and M. Le Doumeuf, Chem. Phys. 106, 111
(1986). 36F. Rebentrost and W. A. Lester, J. Chem. Phys. 67, 3367 (1977). 37R. E. Wvatt and R. B. Walker, J. Chem. Phvs. 70. 1501 (1979). . , ‘*V. Aquiianti, R. Candori, D. Cappelletti, E: Luzzatti, and F. Piiani,
Chem. Phys. 145, 293 (1990). “D. Proch and T. Trickl, Rev. Sci. Instrum. 60, 713 (1989). 4oJ. E. Pollard, D. J. Trevor, J. E. Reutt, Y. T. Lee, and D. A. Shirley, J.
Chem. Phys. 77, 34 (1982). 4’R E.
(i989). Continetti, Ph.D. thesis, University of California, Berkeley
42R. B. Metz, A. Weaver, S. E. Bradforth, T. N. Kitsopoulos, and D. M. Neumark, J. Phys. Chem. 94, 1377 (1990).
43H Hotop and W. C. Lineberger, J. Phys. Chem. Ref. Data 14, 731 (i985).
“The peak labeling scheme of Refs. 27 and 28 is also used here to avoid confusion.
45C. Blondel, P. Cacciani, C. Delsart, and R. Trainham, Phys. Rev. A 40, 3698 (1989).
46The equilibrium structure of FH, is assumed to be linear on the basis of ab initio calculations of Simons (Ref. 25). A linear structure is consistent with the electrostatic forces of a charge interacting with the H2 quadrupole moment.
47G. Henderson and G. E. Ewing, J. Chem. Phys. 59,228O (1973); Mol. Phys. 27, 903 (1974).
48The calculations compare the energy at the MP2/6-31+ +G** opti- mized linear geometry, which is close to Nichols’, CCSD geometry, (Ref. 25) and the energy for the rotated contlguration (C,,) with Rr,n2 and RH-H held constant. The calculated barrier is approximately invariant to the level of correlation correction to the energy. RI-IF, RMP2, and RMP4(SDQ) all give about the same barrier to internal rotation.
4g J. Simons (private communication). “G. C. Schatz, J. Chem. Phys. 90, 3582 (1990). “G. C. Schatz, J. Chem. Phys. 90, 4847 (1990). 52G. C. Schatz, J. Phys. Chem. 94, 6157 (1990). 53 G. C. Schatz, Chem. Phys. Lett. 150, 92 (1988). 54Y. B. Band, K. F. Freed, and D. J. Kouri, J. Chem. Phys. 74, 4380
(1981). 55D. E. Manolopoulos, J. Chem. Phys. 85, 6425 (1986). 56D. E. Manolopoulos, M. J. Jam&on, and A. D. Pradhan, J. Comput.
Phys. 105, 169 (1993). 57The anion parameters used by Zhang et al. were the following: REH2
=2.138 A; Ru-,=0.796 A, and harmonic frequencies at=302 cm-‘, w,=693 cm-‘, and 0,=3816 cm-‘. These values changed slightly in the final version of Ref. 25.
‘*J. Z. H. Zhang and W. H. Miller, J. Chem. Phys. 88,4549 (1988). rgT5a simulations using the published CCSD(T) anion ab initio equilib-
rium geometry and MCSCF harmonic frequencies show only small differences with the simulations displayed here.
6oF. B. Brown and D. G. Truhlar, Chem. Phys. Lett. 117, 307 (1985). 61S. Sato, Bull. Chem. Sot. Jpn. 28,450 (1955). 62D. C. Chatfield, R. S. Friedman, D. G. Truhlar, B. C. Garrett, and D.
W. Schwenke, J. Am. Chem. Sot. 113, 486 (1991); J. M. Bowman, Chem. Phys. Lett. 141, 545 (1987).
631. M. Waller, T. N. Kitsopoulos, and D. M. Neumark, J. Phys. Chem. 94, 2240 (1990).
“S. Baskii and J. 0. Stoner, Jr., Atomic Energy Level hnd Grotian Dia- grams (North-Holland, New York, 1978), Vol. 1.
65N. C. Blais and D. G. Truhlar, J. Chem. Phys. 58, 1090 (1973). &F. Rebentrost and W. A. Lester, Jr., J. Chem. Phys. 63, 3884 (1976). 67R. L. Jatfe, K. Morokuma, and T. F. George, J. Chem. Phys. 63, 3417
(1975). 68M. Kolbuszewski and J. S. Wright, J. Chem. Phys. 96, 5548 ( 1992). 6gJ. W. Hepburn, K. Liu, R. G. MacDonald, F. J. Northrup, and J. C.
Polanyi,J. Chem. Phys. 75, 3353 (1981). 7oS E Bradforth, A. Weaver, D. W. Arnold, R. B. Metz, and D. M. . .
Neumark, J. Chem. Phys. 92, 7205 (1990). “S E. Bradforth, D. W. Arnold, R. B. Metz, A. Weaver, and D. ‘M.
Neumark, J. Phys. Chem. 95, 8066 (1991). 72K. P. Huber and G. Herzberg, Spectra of Diatomic Molecules (Van
Nostrand Reinhold, New York, 1979), Vol. IV. 73 K. Muller-Dethlefs, M. Sander, and E. W. S&lag, Z. Naturforsch. Teil
A 39, 1089 (1984); T. N. Kitsopoulos, I. M. Waller, J. G. Loeser, and D. M. Neumark, Chem. Phys. Lett. 159, 300 (1989).
74D. E. Manolopoulos (unpublished). 75H.-J. Werner (private communication). 76D. E. Manolopoulos, K. Stark, H.-J. Werner, D. W. Arnold, S. E.
Bradforth, and D. M. Neumark, Science (submitted).
J. Chem. Phys., Vol. 99, No. 9, 1 November 1993 Downloaded 03 Mar 2003 to 128.32.220.150. Redistribution subject to AIP license or copyright, see http://ojps.aip.org/jcpo/jcpcr.jsp