experimental and numerical study of soot formation in
TRANSCRIPT
Available online at www.sciencedirect.comProceedings
Proceedings of the Combustion Institute 33 (2011) 549–557
www.elsevier.com/locate/proci
of the
CombustionInstitute
Experimental and numerical study of soot formationin laminar ethylene diffusion flames at elevated
pressures from 10 to 35 atm
Marc R.J. Charest ⇑, Hyun I. Joo, Omer L. Gulder, Clinton P.T. Groth
University of Toronto Institute for Aerospace Studies, 4925 Dufferin Street, Toronto, Ontario, Canada M3H 5T6
Available online 24 September 2010
Abstract
The effects of pressure on soot formation and flame structure were studied experimentally and numer-ically in coflow ethylene–air laminar diffusion flames between 10 and 35 atm. Reliable measurements up to35 atm were permitted by diluting the fuel with nitrogen and suppressing smoke formation. These measure-ments were compared with numerical predictions to assess the accuracy of current soot models applied tohigh pressure diffusion flames. The numerical framework used in the present work represents the currentstate of the art in computational modelling, making use of a block-based parallel implicit finite-volumescheme and detailed radiation heat transfer. In the current implementation, a semi-empirical acetylene-based model is used to predict the nucleation, growth, and oxidation of soot particles. Although the sootmodel is based on experimental data at atmospheric pressure, it correctly predicted many of the observedtrends with pressure. A narrowing flame with constant height was observed as pressure was increased inboth the experiments and numerical results. The model also captured the observed relationship betweenthe maximum amount of carbon converted to soot and pressure, although soot volume fractions were gen-erally over-predicted everywhere in the flames. In both the experiments and predictions, soot volume frac-tions increased with pressure while the tendency of the fuel to produce more soot declined as pressure wasincreased. Interestingly, the calculations predicted soot inside the fuel tube at 20 atm whose concentrationsincreased with pressure. An analysis of the numerical results concluded that this early appearance of sootwas attributed to fuel pyrolysis inside the tube which accelerated as pressure was increased from 10 to35 atm.� 2010 The Combustion Institute. Published by Elsevier Inc. All rights reserved.
Keywords: Soot formation; High pressure combustion; Ethylene diffusion flames; Soot modelling
1. Introduction
Pressure has a profound effect on the overallsoot yield as well as the rates of soot production
1540-7489/$ - see front matter � 2010 The Combustion Institdoi:10.1016/j.proci.2010.07.054
⇑ Corresponding author. Fax: +1 416 667 7799.E-mail address: [email protected] (M.R.J.
Charest).
and oxidation in diffusion flames. Our currentunderstanding of the effects of pressure on sootformation and oxidation is limited as most experi-mental and numerical studies have focused onatmospheric flames. On the other hand, practicalcombustion devices such as gas turbine combustorsand diesel engines operate at elevated pressures.
Despite the challenges associated with measur-ing soot concentrations in high pressure laminar
ute. Published by Elsevier Inc. All rights reserved.
550 M.R.J. Charest et al. / Proceedings of the Combustion Institute 33 (2011) 549–557
diffusion flames, several studies at pressures aboveatmospheric exist. Flower and Bowman [1] mea-sured the line-of-sight integrated soot volumefraction in ethylene flames between 1 and10 atm. They found that the maximum valuereached in each flame scaled with pressure raisedto an exponent of 1.2. Lee and Na [2] obtaineda similar result for ethylene flames between 1and 4 atm. More recently, the path-integratedand local soot volume fractions were measuredin methane flames between 1 and 25 atm and eth-ylene flames between 1 and 16 atm by McCrainand Roberts [3]. Thomson et al. [4] obtained radi-ally-resolved measurements for soot concentra-tion and temperature in methane–air diffusionflames from 5 to 40 atm. This work was continuedto include measurements up to 60 atm by Joo andGulder [5]. Similar experiments were performedby Bento et al. [6] with propane–air flames up to7.3 atm.
There are many numerical studies on soot for-mation in laminar diffusion flames at atmosphericpressure [7–11] but only a few at elevated pres-sures [12,13]. The detailed numerical study byLiu et al. [13] on methane–air diffusion flamesbetween 5 and 40 atm concluded that the increasein soot production with increasing pressure wasdue to larger mixture densities and higher speciesconcentrations. Increasing pressure was alsoobserved to enhance air entrainment into the fuelstream near the burner tip, accelerating the pyro-lysis of fuel. The study showed large discrepanciesbetween measurements and predictions whichwere attributed to the inability of simplified sootformation/destruction models to accurately pre-dict soot concentrations. However, the fuel pre-heating effect, which is known to significantlyaffect numerical predictions [14], was neglectedin the study.
In the present research, laminar diffusionflames of ethylene were studied both experimen-tally and numerically between 10 and 35 atm toinvestigate the effect of pressure on soot formationand oxidation. Radially resolved measurementsfor both soot volume fraction and temperaturewere obtained and compared with the numericalpredictions to assess the accuracy of simplifiedsoot models applied to high pressure diffusionflames. With the help of the numerical results,some of the observed phenomena are discussed.
2. Experimental methodology
The experimental apparatus consists of acoflow burner installed inside a pressure vesselthat allows the burner operating pressure to bevaried as desired. This apparatus is described indetail elsewhere [4,6,5]. The burner consists of astainless steel central fuel tube with 3 mm innerdiameter and a concentric tube of 25.4 mm inner
diameter that supplies the coflow air. The outersurface of the fuel tube is chamfered to form aknife-edge at the nozzle exit plane. While thiswas necessary to improve flame stability over awide range of pressures, uncertainties in the fuel’soutlet velocity profile are introduced as a result. Achimney was also installed to improve flame sta-bility by shielding the core flow from disturbancescreated inside the chamber.
Line-of-sight measurements using the spectralsoot emission diagnostic (SSE) technique wereused to construct radial profiles for temperatureand soot volume fraction at different axial heightsalong the burner axes. The theory and configura-tion of the present SSE system is well documented[15,4,6,5].
Ethylene was diluted with nitrogen to inhibitsmoke formation and allow reliable measurementsup to pressures of 35 atm. Above this pressure, theflames became unstable and meaningful measure-ments were no longer possible. The lowest pres-sure investigated was limited to 10 atm since theSSE technique requires strong radiation from sootto work properly. Ethylene and nitrogen weresupplied through the fuel tube at 0.27 and1.35 mg/s, respectively, while coflow air was sup-plied at 0.4 g/s. This ethylene flow rate corre-sponds to an equivalent carbon flow rate of0.231 mg/s. These mass flow rates were main-tained throughout the study while measurementswere obtained at 10, 20, 30, and 35 atm in heightincrements of 0.5 mm and radial increments of50 lm.
3. Numerical model
A numerical framework previously developedby Charest et al. [16,17] for the solution of lami-nar reacting flows with complex chemistry, non-gray radiative heat transfer, and soot was appliedto study the flames described in the previoussection. This framework solves the conservationequations for continuous, multi-component com-pressible gas mixtures [18]. Soot is modelled usingthe approach proposed by Leung et al. [19] whichrequires only two additional transport equationsfor soot mass and number. These authorsdescribed the evolution of soot through four basicsteps—nucleation, surface growth, coagulation,and oxidation—and assumed that acetylene isthe only precursor responsible for the presenceof soot. Surface growth was assumed proportionalto the square root of soot particle surface area perunit volume of aerosol. Based on the work of Liuet al. [20,13], this soot model was updated toinclude oxidation by OH and O since the originalmodel only accounted for O2 oxidation. All rateconstants related to soot were taken from [13].
Multi-species diffusion is modelled here usingthe first-order Hirschfelder and Curtiss approxi-
10 mm
15m
m4. 5
1.5 mm
0.4 mm
z
r
Outlet
Reflection Fr
ee-s
lip
Coflow Inlet
No-slip Wall
FuelInlet
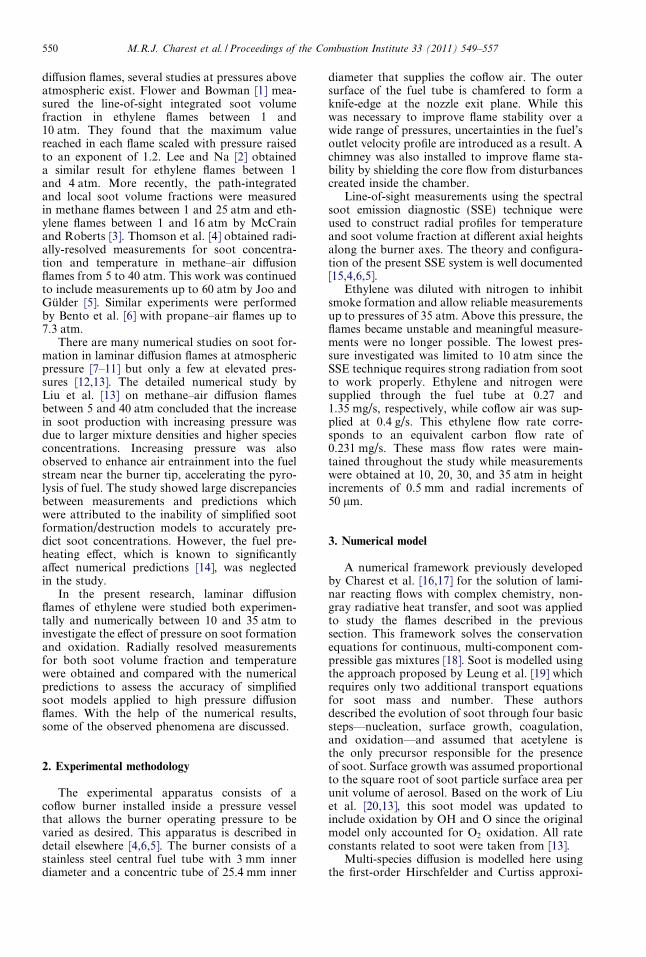
Fig. 1. Computational domain and boundaryconditions.
M.R.J. Charest et al. / Proceedings of the Combustion Institute 33 (2011) 549–557 551
mation [21] while soot is assumed to diffuse onlyby thermophoresis using a model based on thelimit of free-molecular flow [22]. A small diffusioncoefficient for soot due to particle concentrationgradients was included to aid numerical stabilityeven though it is generally negligible. This numer-ical instability was also observed by Kennedyet al. [23].
Radiation emitted and absorbed by the gasand soot is modelled using the discrete ordinatesmethod (DOM) coupled with the point-implicitfinite volume approach of Carlson and Lathrop[24]. Spatial derivatives are evaluated using cen-tered differences while ordinate directions andweights were selected based on the T3 quadratureset [25]. Spectral absorption coefficients areapproximated by the statistical narrow-band cor-related-k (SNBCK) model developed by Liuet al. [26]. Four Gauss quadrature points werefound to provide a reasonable balance betweenaccuracy and computational expense [27,28]. Inthis work, the narrow-band data of Soufiani andTaine [29] for H2O; CO2, and CO are used to con-struct the cumulative distribution function. Toreduce the number of unknowns required fornon-gray radiation in mixtures, the three radiatinggases are approximated by a single gas with effec-tive narrow-band parameters based on the opti-cally thin limit [30]. Additional computationalsavings are achieved by combining bands to formseveral wide bands using the lumping proceduredescribed by Liu et al. [26]. Based on the recom-mendations of Goutiere et al. [31], a total of ninenon-uniformly spaced wide bands are employed.The soot absorption coefficient is determined inthe Rayleigh limit for small spherical particles[20].
The governing equations are solved numeri-cally using a finite-volume scheme previouslydeveloped by Groth and co-workers [32,33]. Thescheme makes use of piecewise limited linearreconstruction and an approximate Riemann sol-ver to determine the inviscid fluxes [34]. The vis-cous fluxes were evaluated using the second-order diamond-path method developed by Coirierand Powell [35]. Both the inviscid flux and thetemporal derivative are preconditioned using theproposed matrix of Weiss and Smith [36]. Thispreconditioning helps reduce excessive dissipationand numerical stiffness commonly encounteredwhen applying the compressible gas equations tolow-Mach-number flows. The solution of thefully-coupled non-linear ODEs is relaxed to asteady-state using the block-based parallel implicitalgorithm developed by Northrup and Groth [32]which makes use of a matrix-free inexact Newton–Krylov method. Solution of the DOM equationsis decoupled from the gas-particle flow equationsand solved sequentially at each time step.
Thermodynamic and transport propertiesalong with gas-phase kinetic rates are evaluated
using CANTERA [37], an open-source softwarepackage for chemically-reacting flows. The simu-lations were performed using the skeletal mecha-nism of Law [38] for ethylene–air combustionwhich consisted of 33 species and 205 elementaryreactions.
4. Discretization and boundary conditions
The modelled domain is shown schematicallyin Fig. 1 along with the employed boundary con-ditions. The domain extends radially outwards 10and 15 mm downstream. The far-field boundarywas treated using a free-slip condition whichneglects any shear imparted to the coflow air bythe chimney walls. The modelled domain is alsoextended 4.5 mm upstream into the fuel and airtubes to account for the effects of fuel preheatingobserved by Guo et al. [14] and better representthe inflow velocity distribution. At the outlet, tem-perature, velocity, species mass fractions, and sootnumber density are extrapolated while pressure isheld fixed. The gas/soot mixture is specified at theinlet along with velocity and temperature whilepressure is extrapolated. Uniform velocity andtemperature profiles were specified for both thefuel and air inlet boundaries. For the radiationsolver, all boundaries except for the axis of sym-metry are assumed to be cold and black.
A simplified representation of the fuel tubegeometry was employed to reduce the numericalcomplexity of this particular problem. As shownin Fig. 1, the knife-edge of the fuel tube wasapproximated by a tube with 0.4 mm thick walls.The three surfaces that lie along the tube wall weremodelled as adiabatic walls with zero-slip condi-tions. Fixed-temperature wall boundary condi-tions were also tested, however, adiabatic wallconditions provided the best agreement between
552 M.R.J. Charest et al. / Proceedings of the Combustion Institute 33 (2011) 549–557
numerical predictions and experimentalmeasurements.
The computational domain illustrated in Fig. 1was subdivided into 192 cells in the radial- and320 in the axial-direction to form a structured,non-uniformly-spaced computational mesh of60,000 total cells. These cells were clusteredtowards the burner exit plane to capture interac-tions near the fuel tube walls and towards the cen-terline to capture the core flow of the flame. Afixed mesh spacing of approximately 18 lm wasspecified in the radial-direction between r ¼ 0and 2.4 mm. The vertical spacing approaches5.7 lm near the fuel tube exit plane. Increasingthe mesh resolution further did not offer anyimprovements in accuracy or alter the numericalsolution.
5. Experimental and numerical results
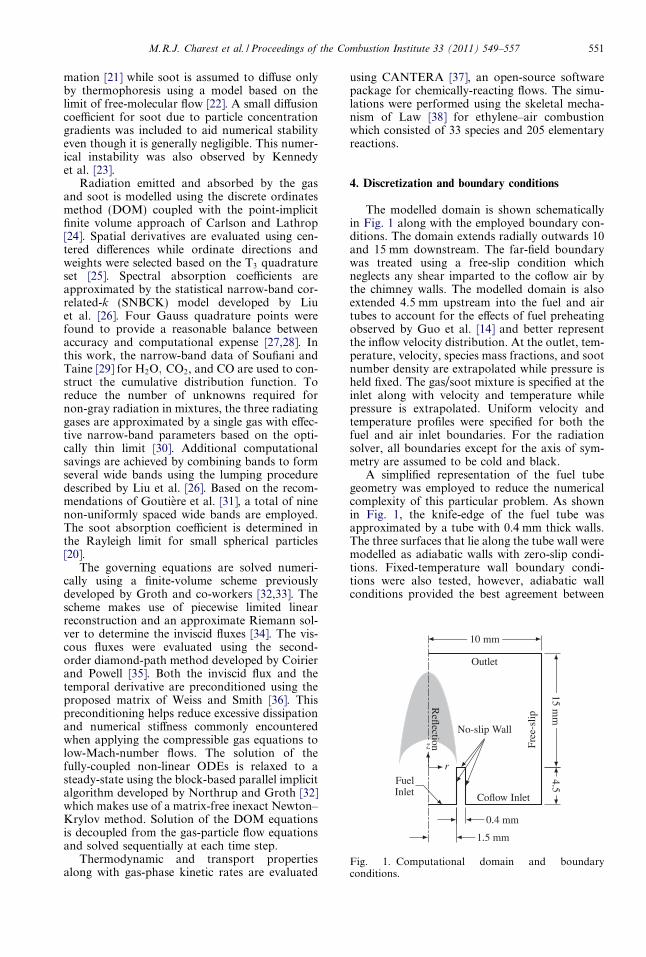
Images of the flames over the range of pres-sures studied are provided in Fig. 2. The shapeof the flame and its appearance changes signifi-cantly with pressure. Increasing pressure causesthe flame diameter to narrow and the luminosityto intensify while the height remains constant at5.5 mm. At 10 atm, a blue region exists in thelower portion of the flame which suggests thepresence of a small premixed zone. As pressureis increased to 20 atm, this blue region diminishesand the yellow luminous region in the upper por-tion of the flame moves towards burner tip. Theblue zone nearly vanishes with further increasein pressure and the flame appears attached tothe burner rim, suggesting that soot is formed atthe burner exit. Similar observations were madefor methane–air flames [4,5].
5.1. Comparison with experiment
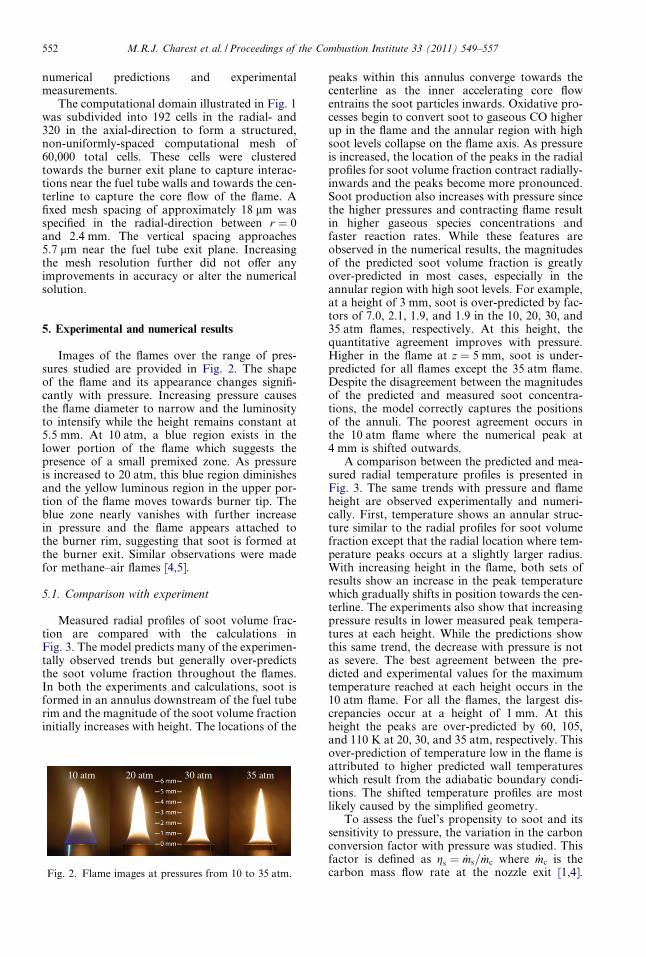
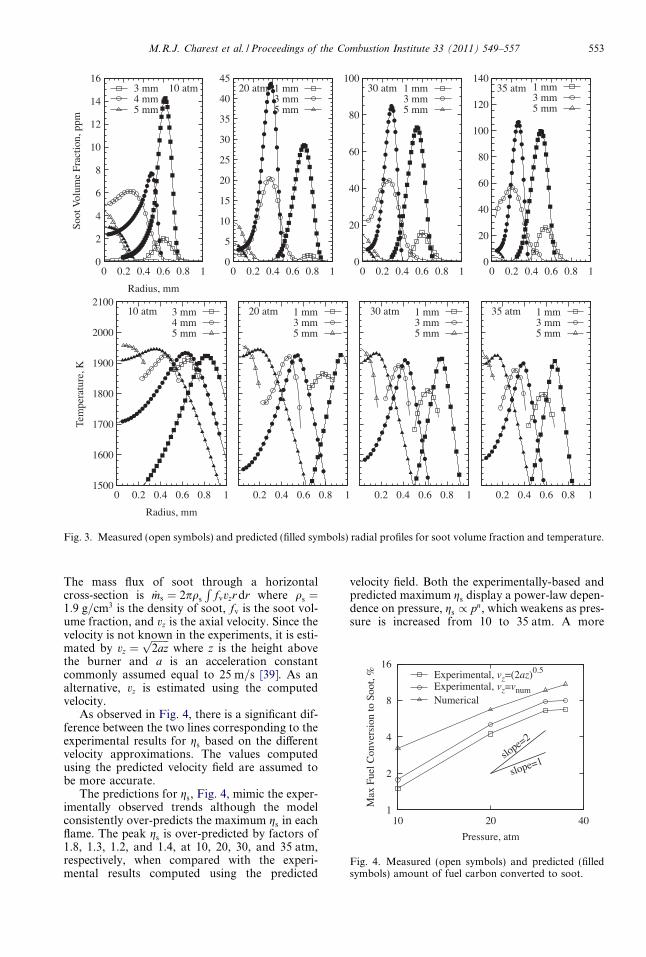
Measured radial profiles of soot volume frac-tion are compared with the calculations inFig. 3. The model predicts many of the experimen-tally observed trends but generally over-predictsthe soot volume fraction throughout the flames.In both the experiments and calculations, soot isformed in an annulus downstream of the fuel tuberim and the magnitude of the soot volume fractioninitially increases with height. The locations of the
10 atm 20 atm 30 atm 35 atm
Fig. 2. Flame images at pressures from 10 to 35 atm.
peaks within this annulus converge towards thecenterline as the inner accelerating core flowentrains the soot particles inwards. Oxidative pro-cesses begin to convert soot to gaseous CO higherup in the flame and the annular region with highsoot levels collapse on the flame axis. As pressureis increased, the location of the peaks in the radialprofiles for soot volume fraction contract radially-inwards and the peaks become more pronounced.Soot production also increases with pressure sincethe higher pressures and contracting flame resultin higher gaseous species concentrations andfaster reaction rates. While these features areobserved in the numerical results, the magnitudesof the predicted soot volume fraction is greatlyover-predicted in most cases, especially in theannular region with high soot levels. For example,at a height of 3 mm, soot is over-predicted by fac-tors of 7.0, 2.1, 1.9, and 1.9 in the 10, 20, 30, and35 atm flames, respectively. At this height, thequantitative agreement improves with pressure.Higher in the flame at z ¼ 5 mm, soot is under-predicted for all flames except the 35 atm flame.Despite the disagreement between the magnitudesof the predicted and measured soot concentra-tions, the model correctly captures the positionsof the annuli. The poorest agreement occurs inthe 10 atm flame where the numerical peak at4 mm is shifted outwards.
A comparison between the predicted and mea-sured radial temperature profiles is presented inFig. 3. The same trends with pressure and flameheight are observed experimentally and numeri-cally. First, temperature shows an annular struc-ture similar to the radial profiles for soot volumefraction except that the radial location where tem-perature peaks occurs at a slightly larger radius.With increasing height in the flame, both sets ofresults show an increase in the peak temperaturewhich gradually shifts in position towards the cen-terline. The experiments also show that increasingpressure results in lower measured peak tempera-tures at each height. While the predictions showthis same trend, the decrease with pressure is notas severe. The best agreement between the pre-dicted and experimental values for the maximumtemperature reached at each height occurs in the10 atm flame. For all the flames, the largest dis-crepancies occur at a height of 1 mm. At thisheight the peaks are over-predicted by 60, 105,and 110 K at 20, 30, and 35 atm, respectively. Thisover-prediction of temperature low in the flame isattributed to higher predicted wall temperatureswhich result from the adiabatic boundary condi-tions. The shifted temperature profiles are mostlikely caused by the simplified geometry.
To assess the fuel’s propensity to soot and itssensitivity to pressure, the variation in the carbonconversion factor with pressure was studied. Thisfactor is defined as gs ¼ _ms= _mc where _mc is thecarbon mass flow rate at the nozzle exit [1,4].
0
2
4
6
8
10
12
14
16
0 0.2 0.4 0.6 0.8 1
Soot
Vol
ume
Frac
tion,
ppm
Radius, mm
10 atm3 mm4 mm5 mm
0
5
10
15
20
25
30
35
40
45
0 0.2 0.4 0.6 0.8 1
20 atm 1 mm3 mm5 mm
0
20
40
60
80
100
0 0.2 0.4 0.6 0.8 1
30 atm 1 mm3 mm5 mm
0
20
40
60
80
100
120
140
0 0.2 0.4 0.6 0.8 1
35 atm 1 mm3 mm5 mm
1500
1600
1700
1800
1900
2000
2100
0 0.2 0.4 0.6 0.8 1
Tem
pera
ture
, K
Radius, mm
10 atm 3 mm4 mm5 mm
0.2 0.4 0.6 0.8 1
20 atm 1 mm3 mm5 mm
0.2 0.4 0.6 0.8 1
30 atm 1 mm3 mm5 mm
0.2 0.4 0.6 0.8 1
35 atm 1 mm3 mm5 mm
Fig. 3. Measured (open symbols) and predicted (filled symbols) radial profiles for soot volume fraction and temperature.
1
2
4
8
16
10 20 40
Max
Fue
l Con
vers
ion
to S
oot,
%
Pressure, atm
slope=1slo
pe=2
Experimental, vz=(2az)0.5
Experimental, vz=vnumNumerical
Fig. 4. Measured (open symbols) and predicted (filledsymbols) amount of fuel carbon converted to soot.
M.R.J. Charest et al. / Proceedings of the Combustion Institute 33 (2011) 549–557 553
The mass flux of soot through a horizontalcross-section is _ms ¼ 2pqs
Rfvvzr dr where qs ¼
1:9 g=cm3 is the density of soot, fv is the soot vol-ume fraction, and vz is the axial velocity. Since thevelocity is not known in the experiments, it is esti-mated by vz ¼
ffiffiffiffiffiffiffi2azp
where z is the height abovethe burner and a is an acceleration constantcommonly assumed equal to 25 m=s [39]. As analternative, vz is estimated using the computedvelocity.
As observed in Fig. 4, there is a significant dif-ference between the two lines corresponding to theexperimental results for gs based on the differentvelocity approximations. The values computedusing the predicted velocity field are assumed tobe more accurate.
The predictions for gs, Fig. 4, mimic the exper-imentally observed trends although the modelconsistently over-predicts the maximum gs in eachflame. The peak gs is over-predicted by factors of1.8, 1.3, 1.2, and 1.4, at 10, 20, 30, and 35 atm,respectively, when compared with the experi-mental results computed using the predicted
velocity field. Both the experimentally-based andpredicted maximum gs display a power-law depen-dence on pressure, gs / pn, which weakens as pres-sure is increased from 10 to 35 atm. A more

Fig. 5. Predicted (left) and measured (right) contours for soot volume fraction.
Fig. 6. Predicted contours for temperature.
Fig. 7. Predicted contours for C2
554 M.R.J. Charest et al. / Proceedings of the Combustion Institute 33 (2011) 549–557
drastic reduction in the pressure exponent, n, isobserved in the experiments.
H2 (lef
Two-dimensional contour plots of soot volumefraction were constructed from the measurementsand are compared with the numerical results inFig. 5. Qualitatively, the predicted and measuredflame geometries are similar and the narrowingof the flame with increasing pressure is clearlyobserved in both sets of results. The flame heightbased on soot volume fraction is also accuratelypredicted by the model. In the experiments, itis approximately 5 mm and remains constantthroughout the entire range of pressures investi-gated. Similar observations are made for thenumerical predictions. However, the model incor-rectly predicts the location of the peak soot vol-ume fraction and, in general, some significantdifferences between predicted and measured sootconcentrations can be observed at lower flameheights. Soot is predicted to occur in an annularregion low in the flame, whereas experimentalobservations show that the peak occurs alongthe centerline near the flame tip. Additionally,the model always predicts that soot production
t) and C2H4 (right) mass fraction.

M.R.J. Charest et al. / Proceedings of the Combustion Institute 33 (2011) 549–557 555
begins further upstream than in the experiments.With increasing pressure, both experiments andpredictions show that the initial onset of soot for-mation begins earlier and that the annular struc-ture becomes thinner and more pronounced. At20 atm, the model predicts a small amount of sootinside the fuel tube and adjacent to the tube walls.This production of soot inside the tube intensifiesas pressure is further increased to 35 atm.
The over-prediction of soot and temperaturelow in the flame near the burner suggests thatthe adiabatic wall boundary conditions predictwall temperatures that are too high. Highertemperatures near the wall would increase the rateof fuel pyrolysis and cause the early predictedappearance of soot in Fig. 5. However, it isunclear whether the early formation of soot insidethe tube is solely an artifact of over-predicted walltemperatures. This early predicted formation ofsoot may also be related to inadequacies of thesoot model.
5.2. Effects of pressure
Predicted contours of temperature for eachflame are presented in Fig. 6. As pressure isincreased from 10 to 35 atm, the flame contractsinward and the main attachment point shiftstowards the centerline. At 10 atm, the flame is rel-atively unstrained and attached to the top of thefuel tube wall. This attachment point movestowards the inner edge of the fuel tube as pres-sures are increased to 35 atm. At 35 atm, the baseof the flame is highly strained and significant fuelpreheating is observed inside the tube near thewalls. There is also a significant increase in thetemperature near the centerline just upstream ofthe fuel tube. Figure 7 presents the predictedcontours for C2H4 and C2H2 mass fraction inthe vicinity of the burner rim. At 10 atm, C2H4
is partially consumed near the tube walls priorto exiting the fuel nozzle and the concentrationsalong the centerline remain high for the first0.5 mm. The rate of C2H4 consumption increases
Radius, mm
Hei
ght,
mm
1.3 1.4 1.5 1.6 1.7 1.8 1.9 2-0.3
-0.2
-0.1
0
0.1
0.2
0.3
Fig. 8. Streamlines near the fuel tube wall at 35 atm.
significantly as pressure is increased. At 35 atm,most of the fuel is broken down inside the fueltube and C2H4 concentrations along the innertube walls are completely depleted before leavingthe mouth of the burner. Ethylene concentrationsalong the centerline in the 35 atm flame aredepleted by 18% by z ¼ 0.
As shown in Fig. 7, the concentration of C2H2
inside the fuel tube increases as pressure isincreased and C2H4 breakdown accelerates. Ini-tially, only a small amount of C2H2 is presentinside the fuel tube at 10 atm. However, concen-trations of C2H2 near the wall and inside the tubeincrease significantly with pressure. At 35 atm,C2H2 produced near the walls is completely con-sumed upstream of the fuel tube exit plane. Thisresults in the predicted appearance of soot insidethe fuel tube in Fig. 5. The peak concentrationsof C2H2 are observed to occur along the centerlinehigher up in the flame. These peak concentrationsdecrease significantly as pressure is increased. Asalready discussed by Liu et al. [13], this is a resultof increased soot production rates with increasingpressure. This observed decrease in C2H2 concen-tration was also hypothesized to be the cause ofdecreased sooting propensity with increasing pres-sure [13]. As pressure is increased and more C2H2
is converted to soot, less gaseous carbon mass isavailable for further soot production.
The flow streamlines are also depicted inFig. 7. Increasing pressure from 10 to 35 atm isobserved to drastically alter the streamlines, caus-ing the flow to contract inwards towards the cen-terline. At 35 atm, the streamlines near the fueltube are almost parallel to the top surface. A smallregion just downstream of the fuel tube in the10 atm flame exists along the centerline wherethe streamlines diverge. This region becomes lar-ger and moves inside the fuel tube as pressure isincreased and is a direct result of the suddenexpansion at the burner exit.
A closeup of the streamlines near the burnerexit is provided in Fig. 8 for the 35 atm flame.The coflow streamlines makes a 90� turn towardsthe fuel stream just prior to exiting the burner.The oxidizer stream eventually flows into the fueltube which would explain the early oxidation offuel inside the tube observed at high pressures.This slight inward dip was not observed in thelower pressure flames.
6. Conclusions
Although large discrepancies were observedbetween predictions and measurements for sootvolume fraction, the soot model employed in thisstudy predicted the overall features and displayedthe correct trends with pressure. In the experi-ments, the flame height was independent of pres-sure and the flame diameter decreased with

556 M.R.J. Charest et al. / Proceedings of the Combustion Institute 33 (2011) 549–557
increasing pressure. Both of these phenomenawere correctly predicted by the numerical model.Soot volume fractions were generally over-pre-dicted everywhere in the flame, but the soot modelstill captured the general trend of increasing car-bon conversion factor with pressure. The sootmodel predicted the appearance of soot much ear-lier in the flame than observed in the experimentsand that soot is formed inside the fuel tube above20 atm. It has been shown that this soot formationis related to accelerated fuel pyrolysis triggered byenhanced air entrainment and increasing tempera-tures inside the tube as pressure was increased. Asa result, C2H2 levels inside the tube intensifiedwith pressure and the C2H2-based soot modelhas incorrectly translated this to an increase insoot production.
The results of this study also illustrated thestrong effect of the burner wall on flame structureand its increasing impact with pressure. Whenstudying high pressure laminar flames, inletboundary placement must be far enough upstreamto capture the fuel preheat effect and minimize itsimpact on the solution.
Future work will include more detailed gas-phase kinetic mechanisms that describe the forma-tion of large molecular weight soot precursors andmore realistic models for soot [40,7]. The detailedfeatures of the burner geometry and a conjugateheat transfer analysis of the tube wall will alsobe included in future efforts.
Acknowledgements
Operational funds for this work have beenprovided by the Natural Sciences and Engineer-ing Research Council (NSERC) and the Cana-dian Space Agency (CSA). Computationalresources for performing all of the calculationsreported herein were provided by the SciNetHigh Performance Computing Consortium atthe University of Toronto and Compute/CalculCanada through funding from the Canada Foun-dation for Innovation (CFI) and the Province ofOntario, Canada.
References
[1] W.L. Flower, C.T. Bowman, Proc. Combust. Inst.21 (1988) 1115–1124.
[2] W. Lee, Y.D. Na, J. Soc. Mech. Eng. Int. J. Ser. B43 (2000) 550–555.
[3] L.L. McCrain, W.L. Roberts, Combust. Flame 140(2005) 60–69.
[4] K.A. Thomson, O.L. Gulder, E.J. Weckman, R.A.Fraser, G.J. Smallwood, D.R. Snelling, Combust.Flame 140 (2005) 222–232.
[5] H.I. Joo, O.L. Gulder, Proc. Combust. Inst. 32(2009) 769–775.
[6] D.S. Bento, K.A. Thomson, O.L. Gulder, Combust.Flame 145 (2006) 765–778.
[7] A. D’Anna, J.H. Kent, Combust. Flame 152 (2008)573–587.
[8] S.B. Dworkin, M.D. Smooke, V. Giovangigli, Proc.Combust. Inst. 32 (2009) 1165–1172.
[9] Q. Zhang, M.J. Thomson, H. Guo, F. Liu, G.J.Smallwood, Combust. Flame 156 (2009) 697–705.
[10] H. Guo, K.A. Thomson, G.J. Smallwood, Combust.Flame 156 (2009) 1135–1142.
[11] R.S. Mehta, D.C. Haworth, M.F. Modest, Proc.Combust. Inst. 32 (2009) 1327–1334.
[12] Z. Zhang, O.A. Ezekoye, Combust. Sci. Technol.137 (1998) 323–346.
[13] F. Liu, K. Thomson, H. Guo, G.J. Smallwood,Combust. Flame 146 (2006) 456–471.
[14] H. Guo, F. Liu, G.J. Smallwood, O.L. Gulder,Combust. Theor. Model. 6 (2002) 173–187.
[15] D.R. Snelling, K.A. Thomson, G.J. Smallwood,O.L. Gulder, E.J. Weckman, R.A. Fraser, AIAA J.40 (2002) 1789–1795.
[16] M.R.J. Charest, C.P.T. Groth, O.L. Gulder,Numerical prediction of sooting laminar diffusionflames using adaptive mesh refinement, in: Proceed-ings of the Sixth US National Combustion Meeting,Ann Arbor, Michigan, Paper 23H4, 2009.
[17] M.R.J. Charest, C.P.T. Groth, O.L. Gulder, Acomputational framework for predicting laminarreactive flows with soot formation, Combust.Theor. Model., in press, doi:10.1080/1364783.2010.512960.
[18] K.K. Kuo, Principles of Combustion, second ed.,John Wiley & Sons Inc., New Jersey, 2005.
[19] K.M. Leung, R.P. Lindstedt, W.P. Jones, Combust.Flame 87 (1991) 289–305.
[20] F. Liu, H. Guo, G.J. Smallwood, O.L. Gulder, J.Quant. Spectrosc. Radiat. Transfer 73 (2002) 409–421.
[21] J.O. Hirschfelder, C.F. Curtiss, R.B. Byrd, Molec-ular Theory of Gases and Liquids, John Wiley &Sons, New York, 1969.
[22] M.D. Smooke, C.S. McEnally, L.D. Pfefferle, R.J.Hall, M.B. Colket, Combust. Flame 117 (1999) 117–139.
[23] I.M. Kennedy, W. Kollmann, J.Y. Chen, Combust.Flame 81 (1990) 73–85.
[24] B.G. Carlson, K.D. Lathrop, in: H. Greenspan,C.N. Kelber, D. Okrent (Eds.), Computing Methodsin Reactor Physics, Gordon and Breach, London,1968, pp. 171–266.
[25] C.P. Thurgood, A. Pollard, H.A. Becker, J. HeatTransfer 117 (1995) 1068–1070.
[26] F. Liu, G.J. Smallwood, O.L. Gulder, J. Thermo-phys. Heat Transfer 14 (2000) 278–281.
[27] F. Liu, G.J. Smallwood, O.L. Gulder, Int. J. HeatMass Transfer 43 (2000) 3119–3135.
[28] F. Liu, H. Guo, G.J. Smallwood, Combust. Flame138 (2004) 136–154.
[29] A. Soufiani, J. Taine, Int. J. Heat Mass Transfer 40(1997) 987–991.
[30] F. Liu, G.J. Smallwood, O.L. Gulder, J. Quant.Spectrosc. Radiat. Transfer 68 (2001) 401–417.
[31] V. Goutiere, A. Charette, L. Kiss, Numer. HeatTransfer Pt. B 41 (2002) 361–381.
[32] S.A. Northrup, C.P.T. Groth, Solution of laminarcombusting flows using a parallel implicit adaptivemesh refinement algorithm, in: Proceedings of the

M.R.J. Charest et al. / Proceedings of the Combustion Institute 33 (2011) 549–557 557
Fourth International Conference on ComputationalFluid Dynamics, ICCFD4, Ghent, Belgium, pp.341–346.
[33] X. Gao, C.P.T. Groth, Int. J. Comput. Fluid Dynam.20 (2006) 349–357.
[34] P.L. Roe, J. Comput. Phys. 43 (1981) 357–372.[35] W.J. Coirier, K.G. Powell, AIAA J. 34 (1996) 938–
945.[36] J.M. Weiss, W.A. Smith, AIAA J. 33 (1995) 2050–
2057.
[37] D.G. Goodwin, Chem. Vapor Depos. XVI andEUROCVD 14 (2003) 155–162.
[38] C.K. Law, Combust. Sci. Technol. 177 (2005) 845–870.
[39] F.G. Roper, C. Smith, A.C. Cunningham, Combust.Flame 29 (1977) 227–234.
[40] J. Appel, H. Bockhorn, M. Frenklach, Combust.Flame 121 (2000) 122–136.