experimental and numerical investigation of flow induced
TRANSCRIPT

1 Copyright © 2010 by ASME
Proceedings of ASME 2010 3rd Joint US-European Fluids Engineering Summer Meeting and 8th International Conference on Nanochannels, Microchannels, and Minichannels
FEDSM2010-ICNMM2010 August 2-4, 2010, Montreal, Canada
FEDSM-ICNMM2010-30676
EXPERIMENTAL AND NUMERICAL INVESTIGATION OF FLOW INDUCED VIBRATION OF STEAM CONTROL VALVE
Koichi Yonezawa Osaka University
Toyonaka, Osaka, Japan
Kanako Ogi Osaka University
Toyonaka, Osaka, Japan
Tomofumi Takino Osaka University
Toyonaka, Osaka, Japan
Yoshinobu Tsujimoto Osaka University
Toyonaka, Osaka, Japan
Takahide Endo Tokyo Electric Power CompanyYokohama, Kanagawa, Japan
Kenichi Tezuka Tokyo Electric Power CompanyYokohama, Kanagawa, Japan
Ryo Morita
Central Research Institute of Electric Power Industry Komae, Tokyo, Japan
Fumio Inada Central Research Institute of
Electric Power Industry Komae, Tokyo, Japan
ABSTRACT Control valves of the main steam flow for power plants are
operated under wide range of valve openings and pressure ratios. In the present paper, experimental and numerical investigations are described in order to clarify mechanisms of the valve head vibration. Experiments are conducted with two types of the valve head support. One is a flexible support and the other one is with an exciter. Results show that valve head vibrations with large amplitude appear with the flexibly supported valve head under certain range of valve openings and the pressure ratio. With the valve head exciter, dynamic fluid forces are measured. Results show that the added damping force becomes negative around the condition where the valve head oscillation is observed with flexible support. Numerical analyses are carried out in order to observe the flow field. In the simulations, forced vibrations of valve head are assumed. Results show that the pressure distribution on the valve head surface changes depending on the excitation frequencies, and as a result, the negative damping force occurs. INTRODUCTION
In nuclear and thermal power plants, a main control valve is located between a steam generator and a turbine in order to control the steam flow. The pressure difference between upstream and downstream of the valve becomes large
especially during startup and shutdown transients of the plant. Therefore, the flow around the valve head becomes transonic and separates from the valve head and the seat. This flow separation is associated with a shock-boundary layer interaction [1]-[4]. As a result, the flow field becomes complex and large unsteady forces act on the valve head and pipe systems. Consequently, such unsteady flows can cause serious vibrations [5]-[7]. These problems make stable operation of the plants problematic.
In the present study, experimental and numerical investigations of the self-excited vibrations of the valve head are conducted with subscale valve models. In order to observe the appearance of the valve head vibration, a test valve with the valve head supported by flexible shaft is adopted. Dynamic fluid forces are also measured by exciting the valve head with an exciter. The influence of the valve head vibration on the flow pattern is examined with numerical simulations. EXPERIMENTAL METHODS
Experiments are conducted with a blow down type wind tunnel shown in Fig. 1. Dry compressed air is stored in a high pressure tank. The inlet pressure is controlled by an electric-magnetic control valve. The working fluid from the test valve
Proceedings of the ASME 2010 3rd Joint US-European Fluids Engineering Summer Meeting and 8th International Conference on Nanochannels, Microchannels, and Minichannels
FEDSM-ICNMM2010 August 1-5, 2010, Montreal, Canada
FEDSM-ICNMM2010-30676

2 Copyright © 2010 by ASME
Fig. 1 Experimental apparatus
Fig. 2 Schematic of test valve with flexibly supported valve head
Table 1 Dimensions of test valve
Seat diameter, Ds 62.4 mmMinimum diameter downstream of valve, Dm 52 mmDiameter of downstream pipe Length of downstream pipe
81.9 mm1800mm
Curvature radius of head surface 43.7 mmCurvature radius of seat surface 12 mm
is discharged to atmosphere through a downstream pipe and a silencer.
Figure 2 shows a schematic of the test valve with the flexibly supported valve head. The valve head is supported by steel pipe with the outer diameter of 14mm and the thickness of 1mm. Four strain gauges are set in order to monitor the displacement of the valve head. The natural frequency measured by a tapping test without flow is 29.3Hz.
Main dimensions of the test valve are shown in Table 1. The contour of the valve head is similar to the real valve in the plant [7]. There is a step downstream of the valve seat.
Figure 3 shows schematics of the valve head exciter. The valve head is axially supported by the shaft with a pivot and laterally connected to a clank shaft driven by an AC servo motor to provide lateral vibration. Therefore, the valve head vibrates alternatively in one direction. The displacement of the valve head is measured with a laser displacement censor (Keyence, LK-G35, Detecting distance is 30 5± mm and maximum error is 0.02%).
Fig. 3 Schematic of test valve with exciter
Fig. 4 Schematic of fluid force measurement system in valve head and location of pressure taps (A1-A4)
Under the forced vibration, dynamic fluid forces are
measured using loadcells as shown in Fig. 4. The valve head is supported by a load cells (KYOWA Electric Instrument, LUR-A-2KN-SA1, rated capacity is 2kN and maximum error is 0.5%) in axial direction and four loadcells (KYOWA Electric Instrument, LMA-A-50N, rated capacity is 50N and

3 Copyright © 2010 by ASME
Fig. 5 Computational grid (Every 4 lines are shown)
(a) Displacement of valve head in y and z direction
(b) Lissajous curve of valve head
(left: 0.16s-0.32s, right: 0.80s-0.96s) Fig. 6 Vibration of the valve head
(εL=0.046, ψp=0.45)
maximum error is 1.0%) in lateral directions. The root of the load cell in axial direction is freely supported in lateral directions with a ball link. Wall pressures are also measured on the valve head surface with four pressure transducers (KULITE, CT-190-100A, rated capacity 689.5kPaA and maximum error is 0.1%). In the experiment with the flexibly supported valve shown in Fig. 2, only wall pressures are measured at the same locations shown in Fig. 4. In the present study, the coordinate axes are defined as shown in Fig. 4. The origin of the coordinates is at the center of the valve head cusp as shown in Fig. 4.
Operation conditions of the valve are defined by the valve opening ratio and the pressure ratio as follows.
The opening ratio is expressed as:
εL=xL/Ds …(1)
here, xL is the lift of the valve head and Ds is the valve seat diameter.
The pressure ratio is ψp =p0/pb …(2) here, p0 is the inlet pressure measured at the valve case wall and pb is the back pressure. In the present facility, atmospheric pressure is used as the back pressure because the pressure loss in the silencer is negligible.
NUMERICAL PROCEDURES Unsteady numerical simulations are carried out in order to
understand flow patterns. Governing equations are three-dimensional Navier-Stokes equations. Numerical schemes of the simulation are based on a finite difference method. SHUS [8] with fifth order Weighted Compact Nonlinear Scheme (WCNS-E-5) [9] are adopted for convective terms. A sixth order compact scheme [10] is used to calculate viscous terms. DES model based on Spalart-Allmaras model [11] is adopted as a turbulence model. As a time integration scheme, a second order three point backward implicit difference scheme with LU-SGS method [12] are applied. The time step is 3.125x10⁻⁶ seconds.
Figure 5 shows computational grid around the valve. The number of grid nodes is 500 points in axial direction, 100 points in radial direction, and 90 points in circumferential direction. Therefore the total number of grid nodes is 5,220,000 points. Computations are carried out with HITACH, SR11000 in Supercomputing Division, Information Technology Center, The University of Tokyo.
In the present paper, the flow around the fluctuating valve is examined. The valve head vibrates with the frequencies of 16Hz and 32Hz, and the amplitude of 1.0 mm in one direction alternatively to simulate the experimental conditions. At the inlet boundary, the inlet total pressure is fixed at designated value and the stagnation temperature is fixed at 300K and Riemann invariants are extrapolated from inner nodes. At the outlet, the static pressure is fixed at 100kPa and the density and each velocity components are extrapolated. The walls are treated as non-slip adiabatic walls.
RESULTS AND DISCUSSIONS
OBSERVATION OF THE VALVE OSCILLATION As a first step, the valve head vibration is observed under
various valve opening ratios and pressure ratios with the test valve with the flexibly supported valve head.
Figure 6 shows time histories of the valve head oscillation observed with εL=0.046 and ψp=0.45. As shown in Fig. 6 (a),

4 Copyright © 2010 by ASME
(a) εL=0.046, ψp=0.60
(b) εL=0.046, ψp=0.45
Fig. 7 Pressure oscillation on the valve head surface the amplitude of the valve head vibration becomes large gradually, and finally, becomes constant. Fig. 6 (b) shows Lissajous curves of the valve head trace during the amplitude increases. At the beginning of the valve head vibration, the valve head vibrates in one direction. However, as the amplitude becomes larger, the Lissajous curve becomes elliptic.
The pressure oscillation shows different behavior depending on the amplitude of the valve head oscillation. Figure 7 shows the valve head displacement and the pressure oscillation on the valve head surface. Figure 7 (a) shows the case when the amplitude of valve head vibration is small. The
Fig. 8 Amplitude of the valve head vibration plotted in εL-ψp plane
(a) εL=0.046
(a) εL=0.068
Fig. 9 Amplitude of the valve head vibration versus pressure ratio
pressure oscillation is at random in time. On the other hand, when the amplitude of the valve head vibration is larger, the pressure oscillation becomes periodic as shown in Fig. 7 (b). The fundamental frequency of the pressure oscillation, 31.5Hz is the same as the valve head vibration frequency. The frequency of the valve head is 31.5Hz at all cases with the present experimental setup. This is slightly higher than the above mentioned natural frequency of 29.3 Hz determined from the tapping test result.
5 Copyright © 2010 by ASME
Figure 8 shows amplitudes of the valve head vibration plotted in εL -ψp plane. The valve head vibration appears in a limited region in εL -ψp plane. At the smaller valve opening ratio, the valve head vibration appears around small pressure ratios. As the valve opening ratio becomes larger, the region spread to large pressure ratio side.
Figure 9 shows the amplitude of valve head vibration versus the pressure ratio for εL=0.046 andεL=0.068. The amplitude distributions become maximum at a certain pressure ratio as can be seen from Fig. 9.
MEASUREMENT OF FLUID FORCES As mentioned above, the valve head vibration occurs in a
certain range of the operating conditions. The valve motion also affects the flow characteristics. In the present section, dynamic fluid forces are measured by exciting the valve head with the exciter. Dynamic fluid forces are examined as follows.
With the exciter, the valve head vibration is in y-direction shown in Fig. 4 and the equation of motion of the valve head is expressed as follows;
Fkyycym =++ &&& …(3)
tAy ωsin= …(4)
here, m is the mass of the valve head, c is the structural damping coefficient, k is the stiffness coefficient of the valve head support, A is the amplitude, ω is the angular frequency, and t is time. We represented fluid force by
( )
0
0 0
0 0
sin( )cos sin sin cos
cos sin
F F tF t F tF F
y yA A
Ky Cy
ω φφ ω φ ω
φ φω
= −= −
= ⋅ − ⋅
= − −
&
&
…(5)
where, φ is the phase difference, 0 / cosK F A φ= − is an added stiffness coefficient and 0 /( ) sinC F Aω φ= ⋅ is an added damping coefficient. When C is negative, the flow destabilizes the valve motion.
In the present experiment with the exciter, the measured fluid forces include inertial force. The measured data is examined after removing the inertial force measured without flow. To calculate fluid force components, the FFT analysis was applied to the data obtained in one second with sampling rate of 1/8192 are carried out. The following results are obtained by averaging 5 sets of the FFT analyses at different times. The maximum and minimum of 5 sets of measured data are also indicated by error bars.
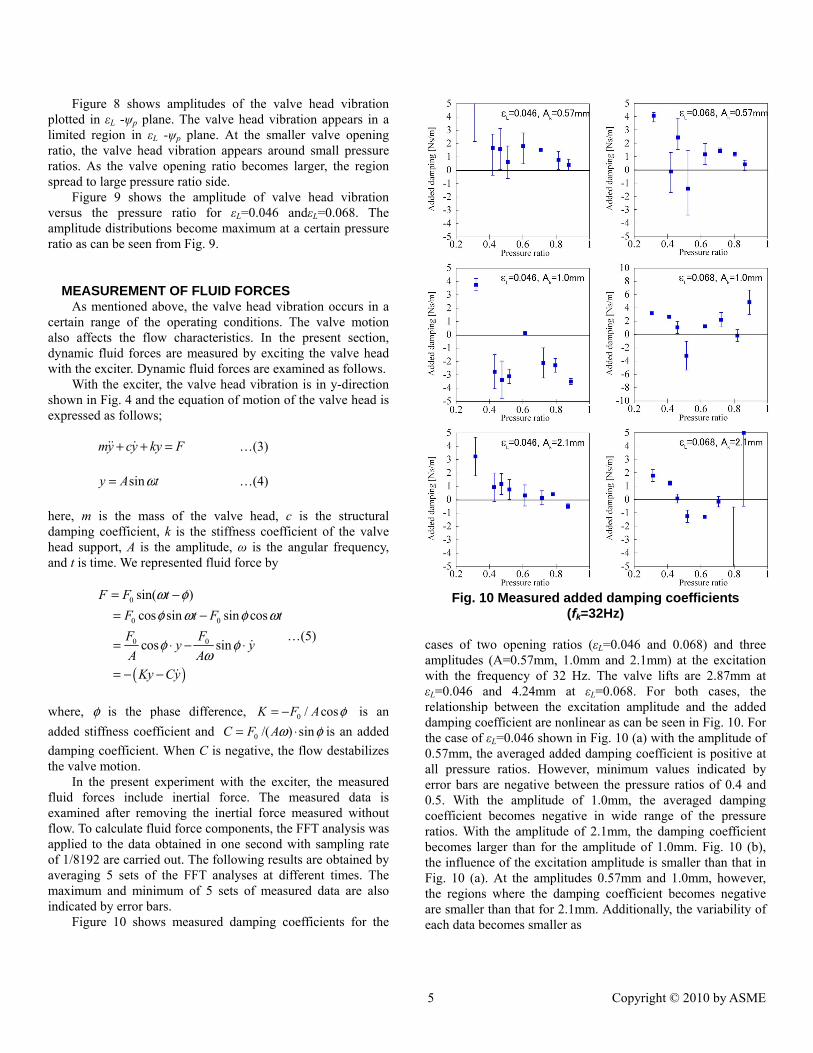
Figure 10 shows measured damping coefficients for the
Fig. 10 Measured added damping coefficients
(fk=32Hz) cases of two opening ratios (εL=0.046 and 0.068) and three amplitudes (A=0.57mm, 1.0mm and 2.1mm) at the excitation with the frequency of 32 Hz. The valve lifts are 2.87mm at εL=0.046 and 4.24mm at εL=0.068. For both cases, the relationship between the excitation amplitude and the added damping coefficient are nonlinear as can be seen in Fig. 10. For the case of εL=0.046 shown in Fig. 10 (a) with the amplitude of 0.57mm, the averaged added damping coefficient is positive at all pressure ratios. However, minimum values indicated by error bars are negative between the pressure ratios of 0.4 and 0.5. With the amplitude of 1.0mm, the averaged damping coefficient becomes negative in wide range of the pressure ratios. With the amplitude of 2.1mm, the damping coefficient becomes larger than for the amplitude of 1.0mm. Fig. 10 (b), the influence of the excitation amplitude is smaller than that in Fig. 10 (a). At the amplitudes 0.57mm and 1.0mm, however, the regions where the damping coefficient becomes negative are smaller than that for 2.1mm. Additionally, the variability of each data becomes smaller as

6 Copyright © 2010 by ASME
Fig. 11 Measured added stiffness coefficients
(fk=32Hz)
the amplitude becomes larger at the pressure ratios between 0.4 and 0.7.
Although the valve head vibration is considered to be caused by the negative damping fluid force, there are some points showing the disagreement of the relation between the amplitude of valve head vibration shown in Fig. 9 and the added damping coefficient shown in Fig. 10. At some conditions, added fluid forces shown in Fig. 10 are positive around pressure ratios where the amplitude of valve head vibration is large in Fig. 9. However error bars are long around such pressure ratio cases. At these conditions, it is observed that the added damping varies between positive and negative during the measurement. Such a trend was observed from the pressure oscillation on the flexibly supported valve head. This suggests that the coupling of the flow and valve head motion is not stable and as a result, the amplitude is limited. At εL=0.046 and 4.24mm, the added damping coefficient is negative at high pressure ratio although the valve head oscillation is not observed in Fig. 9. The reason of this disagreement has not been cleared yet.
Figure 11 shows added stiffness coefficient. As the pressure ratio increases, the added stiffness coefficient becomes smaller. However, the influence of the opening ratio is small.
(a) εL=0.046, ψp=0.50
(b) εL=0.068, ψp=0.50
Fig. 12 Displacement of valve head and pressure oscillation (fk=32Hz)
The frequency of the valve head is constant at 31.5 Hz and higher than the natural frequency measured without the flow in the experiment with flexibly supported valve head. This means the added stiffness is almost constant but the measured stiffness coefficient depends on the pressure ratio. From the result of experiments with the flexibly supported valve head, the added stiffness coefficient is estimated to be 26.3kN/m. Although measured values are less than half of this value, it explains the increase of the frequency under operation condition.
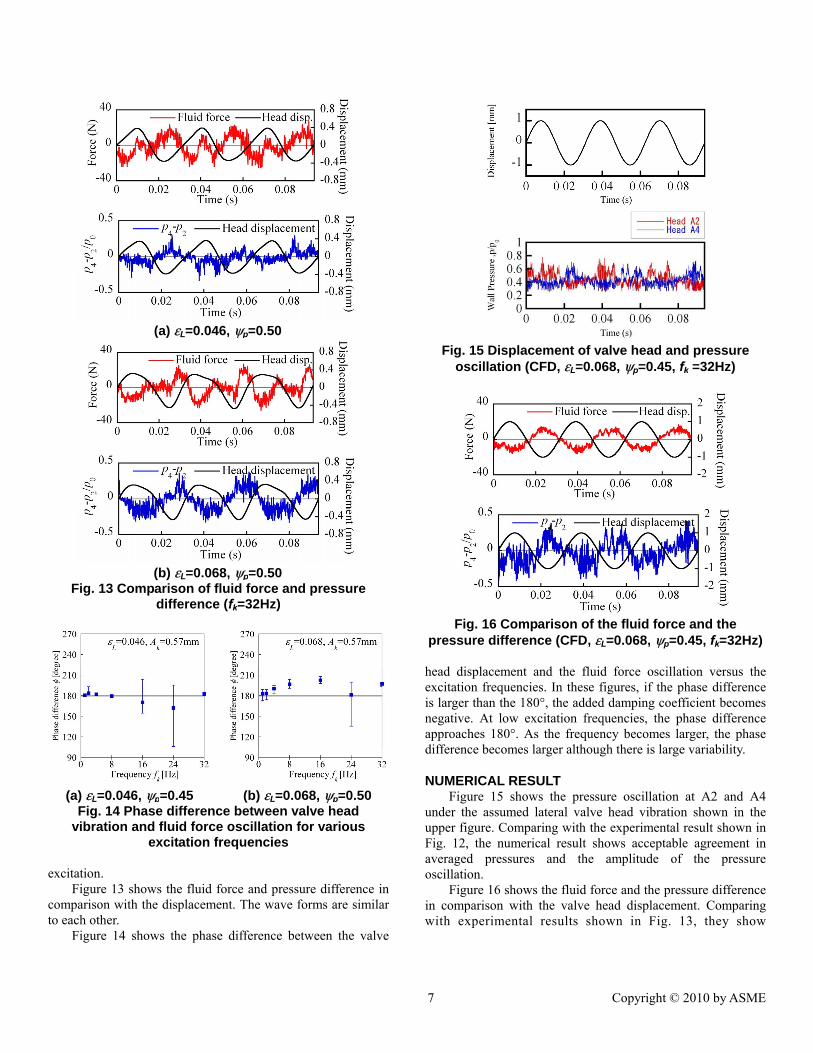
Figure 12 shows displacement of the valve head and pressure oscillation. The pressure transducers A2 and A4 are placed in the direction of the vibration but at the opposite locations. As observed in Fig. 7, the pressure oscillation is periodic and has the same frequency with the valve head
7 Copyright © 2010 by ASME
(a) εL=0.046, ψp=0.50
(b) εL=0.068, ψp=0.50
Fig. 13 Comparison of fluid force and pressure difference (fk=32Hz)
(a) εL=0.046, ψp=0.45 (b) εL=0.068, ψp=0.50
Fig. 14 Phase difference between valve head vibration and fluid force oscillation for various
excitation frequencies
excitation. Figure 13 shows the fluid force and pressure difference in
comparison with the displacement. The wave forms are similar to each other.
Figure 14 shows the phase difference between the valve
Fig. 15 Displacement of valve head and pressure oscillation (CFD, εL=0.068, ψp=0.45, fk =32Hz)
Fig. 16 Comparison of the fluid force and the pressure difference (CFD, εL=0.068, ψp=0.45, fk=32Hz) head displacement and the fluid force oscillation versus the excitation frequencies. In these figures, if the phase difference is larger than the 180°, the added damping coefficient becomes negative. At low excitation frequencies, the phase difference approaches 180°. As the frequency becomes larger, the phase difference becomes larger although there is large variability.
NUMERICAL RESULT Figure 15 shows the pressure oscillation at A2 and A4
under the assumed lateral valve head vibration shown in the upper figure. Comparing with the experimental result shown in Fig. 12, the numerical result shows acceptable agreement in averaged pressures and the amplitude of the pressure oscillation.
Figure 16 shows the fluid force and the pressure difference in comparison with the valve head displacement. Comparing with experimental results shown in Fig. 13, they show

8 Copyright © 2010 by ASME
Fig. 17 Phase difference between the valve head
vibration and the fluid force oscillation for various excitation frequencies (CFD, εL=0.068, ψp=0.45)
Fig. 18 Valve head displacement, Mach number distribution in meridian cross section and pressure distribution on valve head surface (CFD, εL=0.068, ψp=0.45, fk =16Hz) acceptable agreement in the amplitude of the fluid force and the pressure oscillation. The phase difference between the valve head vibration and the fluid force oscillation is 189.5°. In the experimental result at the same condition, the phase difference is 216°. Although the values are different, the damping coefficients are negative in both results.
Fig. 19 Valve head displacement, Mach number distribution in meridian cross section and pressure distribution on valve head surface (CFD, εL=0.068, ψp=0.45, fk=32Hz)
Figure 17 shows the phase difference between the valve head vibration and the fluid force oscillation versus excitation frequencies. The phase difference approaches 180° at low excitation frequencies. As the frequency becomes larger, the phase difference becomes larger. Comparing with the experimental result shown in Fig. 14, smaller phase difference is predicted. Although a dip at 24Hz is found in the experiment, the phase difference in numerical simulation increases monotonically beyond the maximum frequency 32Hz of the experiment.
Figure 18 shows the displacement of the valve head, the Mach number distribution in the meridian cross section and the pressure distribution on valve head surface for every 1/4 period of the valve head vibration with the excitation frequency of 16Hz. At this frequency, Fig. 17 shows that no phase delay of the fluid force occurs. The influence of the valve head vibration is not clear from the Mach number distribution. On the valve head surface, a high pressure region appears because of the asymmetric flow downstream of the valve head. When the displacement of the valve head is maximum at t=1/4 T (1mm) and 3/4 T, (-1mm) the high pressure region is at the same side of the valve head displacement. Therefore, the fluid force acts

9 Copyright © 2010 by ASME
in the opposite direction to the displacement of the valve head and it results in the resilience. The added damping force is small because the phase difference between the valve head vibration and the fluid force oscillation is almost 180° as can be seen in Fig. 17.
Figure 19 shows the case of the excitation frequency of 32Hz. In this figure, the high pressure region is at the opposite side of the valve head velocity direction at t=0 and 2/4T. Therefore, the direction of the fluid force is the same with the valve head velocity. The similar phenomenon is observed in the results with higher excitation frequencies.
CONCLUSIONS In the present study, experimental and numerical studies
have been carried out in order to clarify the mechanisms of the serious vibration of the valve head.
Experimental results with the valve head supported by flexible shaft show that the valve head vibration appears with the large amplitude in a certain range of the operation conditions of the valve. The pressure oscillation on the valve head is at random when the amplitude of the valve head vibration is small. When the valve head vibrates with a large amplitude, however, the pressure oscillation becomes periodic with the frequency of the valve head vibration. Forced vibration experiments were also carried out. The fluid forces are decomposed into the added stiffness and the added damping force. At the condition where the valve head vibration occurs in the experiment with the flexible shaft, the added damping force becomes negative. Numerical results show that the unsteady behavior of the pressure distribution on the valve head surface changes depending on the excitation frequencies.
The fluid force treated in the present study occurs in response to the valve head vibration. Therefore, it is important to increase the stiffness of the valve head support system.
NOMENCLATURE
A : Amplitude of valve head vibration c : Damping coefficient C : Added damping coefficient εL : Valve opening ratio f : Frequency fk : Excitation frequency p0 : Inlet pressure pb : Back pressure ω : Angular frequency xL : Valve lift ψp : Pressure ratio
REFERENCES [1] Araki, T., Okamoto, Y. and Ootomo, F., 1981, “Fluid-
Induced Vibration of Steam Control Valves (In Japanese),” Toshiba review, 36(7), pp. 648-656.
[2] Jibiki, K., 2000, “Fluctuation of Steam Control Valve (In Japanese),” Turbomachinery, 28(4), pp. 225-229.
[3] Morita R., Inada F., Mori M., Tezuka K., and Tsujimoto Y., 2007, "CFD Simulations and Experiments of Flow Fluctuations Around a Steam Control Valve," ASME J. Fluids Eng., 129(48), pp. 48-57.
[4] Yonezawa, K., Terachi, Y., Nakajima, T., Tsujimoto, Y., Tezuka, K., Mori, M., Morita, R., and Inada, F., 2010, “A Two-Dimensional Study of Transonic Flow Characteristics in Steam Control Valve for Power Plant”, Int. J. Fluid Machinery and Systems, 3(1), pp.58-66.
[5] Morita, R., Inada, F., Mori, M., Tezuka, K. and Tsujimoto, Y., 2005, “Flow Induced Vibration of a Steam Control Valve,” ASME Paper No. PVP2005-71334.
[6] Yonezawa, K., Tsujimoto, Y., Tezuka, K., Mori, M., Morita, R., and Inada, F., 2008, “Transonic Flow Vibration in a Steam Control Valve for a Power Plant,” Flow Induced Vibration, Zolotarev, I. and Horáček, J., eds., Institute of Thermomechanics, Prague, pp. 599-604.
[7] Shioyama, T., Asakura, D., Kobayashi, T., Iseki, T. and Hosaka, H., 1995, “Coupling Vibration between Pipe Wall and Internal Higher-Order Acoustic Wave Caused by Valve Choking (In Japanese),” Trans. JSME, Ser. B, 61(589), pp. 3450-3455.
[8] Shima, E. and Jounouchi, T., 1997, ”AUSM type Upwind Schemes- Role of Computational Fluid Dynamics in Aeronautical Engineering (No. 14),” Proceedings of 14th NAL Symposium on Aircraft Computational Aerodynamics, pp. 7-12.
[9] Liu, X., Deng, X. and Mao, M., 1994, “Studying of Weighted Compact High-Order Nonlinear Scheme WCNS-E-5 for Complex Flows,” Computational Fluid Dynamics Journal, 13(2), pp. 173-180.
[10] Lele, S. K., 1992, “Compact Finite Difference Scheme with Spectral-like Resolution,” J. Comp. Phys., 103, pp. 16-42.
[11] Spalart, P.R, Jou, W.-H., Strelets, M. and Allmaras, S.R., 1997, “Comments on the feasibility of LES for wings, and on a hybrid RANS/LES approach,” 1st AFOSR Int. Conf. On DNS/LES, Ruston, LA.
[12] Yoon, S. and Jameson, A., “Lower-Upper Symmetric-Gauss-Seidel Method for the Euler and Navier-Stokes Equations,” AIAA Journal, Vol. 26, No. 9, pp. 1025-1026 (1988).