experimental and modelling studies of gas solid vortex
TRANSCRIPT
Experimental and Modelling Studies of Gas Solid Vortex
Reactor Hydrodynamics
Inês Isabel Antunes Paiva
Thesis to obtain the Master of Science Degree in
Chemical Engineering
Supervisors: Prof. Dr. Ir. Kevin Van Geem
Prof. Dr. Vítor Geraldes
Examination Committee
Chairperson: Prof. Dr. Francisco Lemos
Supervisor: Prof. Dr. Vítor Geraldes
Members of the Committee: Prof. Dr. Filipe Gama Freire
October 2019


Acknowledgements
A cycle has come to an end. I can definitely say these past years were an amazing time for
myself, mostly in terms of personal growth. This thesis is the conclusion of that cycle, which could have
not ended in a better way.
For that, I must thank to Prof. Dr. Ir. Kevin Van Geem and Prof. Ir. Dr. Geraldine Heynderickx,
which allowed this project to become a reality for me. My time in LCT was for sure enriching and pleasant
due to my coach, Shekhar Kulkarni, and my almost-coach Manuel Nunez Manzano. Together, they
formed the best team I could have asked for my orientation. Beyond their duties, they always showed
kindness and consideration towards me. To my two new friends, a major thank-you. A word of gratitude
to Prof. Vítor Geraldes for being always available to answer my questions and clarify my doubts.
Although being away, he was always at a distance of an e-mail.
My time in Belgium was shared with three amazing housemates. Without them, boredom would
have filled my days. To all the laughs and shared memories, I must thank you. A toast to the four of us,
we can finally say ‘We did it!’.
To my boyfriend, I express my gratitude for all the patience required along the years and
especially during this past few months. For all the challenges already overcome and ones which are
coming, I’m sure that there is no better person to have by my side. Love of my life lol.
Finally, to all my friends and family which I left back in Portugal. They are an important part of
my life, which I expect to never lose, even if life keeps me away from my home country. To my family
which supported my choices and my friends who welcomed me back with a smile and a hug.

Resumo Esta dissertação tem por objetivo estudar a hidrodinâmica de um GSVR, através da estimativa
da sua carga máxima, do grau de mistura/segregação do leito e da avaliação teórica do potencial do
reator. A planta piloto opera em regime turbulento (Reynolds de entrada do gás entre 7083 e 10625).
Usaram-se métodos experimentais – processamento de misturas com alumina e alumínio (grupos B e
D de Geldart, respetivamente), em percentagens mássicas diversas, com diâmetros nominais de 0.7 a
1 mm e com velocidades de injeção de ar entre 56 e 83 m.s-1 – e um teórico – modelo matemático. A
carga máxima estimada é de 83 gramas de alumina quando a tubagem de escape está orientada contra
a gravidade e 30 gramas de alumina para a configuração inversa. Alimentando uma mistura de 75%
(m/m) de alumina ao reator, obtém-se 94.4% (m/m) de alumina no leito. A partir do modelo
desenvolvido, estima-se, para um reator vazio e para uma velocidade de injeção de 24 m.s-1 de ar, que
partículas de alumínio com no mínimo 70 μm possam ser fluidizadas, enquanto partículas de alumina
devem ter pelo menos 160 μm. A capacidade máxima da unidade é 3 vezes superior quando a tubagem
está orientada contra a gravidade, aumentando o caudal de sólidos processado; a segregação de
partículas é observada em diferentes graus ao operar o GSVR, reduzindo a necessidade de separação
a jusante do reator; e teoricamente a unidade demonstrou potencial em fluidizar materiais dos grupos
B e D de Geldart, partículas usadas em diversos processos industriais.
Palavras-chave: GSVR, fluidização centrífuga, segregação de partículas, diâmetro crítico de partícula.
Abstract The target of the present dissertation is to study the hydrodynamics of a Gas Solid Vortex
Reactor, through an estimation of its maximum loading, the degree of mixing/segregation of the solid
phase in the bed and a theoretical evaluation of its potential. This setup was built at pilot scale and it’s
operated in turbulent regime (gas Reynolds between 7083 e 10625). Experimental methods –
fluidization of various mixtures with several mass fractions of alumina and aluminium (groups B and D,
according to the Geldart classification), with nominal diameters between 0.7 and 1 mm and air injection
velocities between 56 and 83 m.s-1 – and a theoretical one – a mathematical method – were used. The
maximum loading estimated is 83 grams of alumina when the exhaust is orientated against the gravity
and 30 grams of alumina for the inverse configuration. Feeding a mixture with 75% (w/w) of alumina
results in a bed formed by 94.4% (w/w) of alumina. Using the developed mathematical model, for an
empty reactor and an air injection velocity of 24 m.s-1, 70 μm aluminium particles and 160 μm alumina
particles are the minimum diameter required to achieve successful fluidization. Operating the setup
placed in the inverse configuration increases its maximum loading in 3 times, increasing the solids’ flow
processed; particle segregation is observed while operating the GSVR to several extends, diminishing
the need for separation devices downstream; and theoretically the unit showed potential in fluidizing
Geldart B and D-type particles, which are used in several industrial processes.
Key Words: Gas Solid Vortex Reactor, centrifugal fluidization, particle segregation, critical particle
diameter


Nomenclature
Abbreviations
CCD – Charged Coupled Device
CFD – Computational Fluid Dynamics
CLC – Chemical Looping Combustion
CSTR – Continuous Stirred Tank Reactor
Dcut – Critical particle diameter
FB – Fluidized Bed
GSVR – Gas Solid Vortex Reactor
GSVU – Gas Solid Vortex Unit
HDPE – High Density Polyethylene
HPC-L – Hydroxypropylcellulose
IR – Infrared (camera)
LCT – Laboratory for Chemical Technology (located in Gent, Belgium)
MIVR – Multi Inlet Vortex Reactor
PI – Process Intensification
PIV – Particle Image Velocimetry
PLIF – Planar Laser Induced Fluorescence
RFB – Rotating Fluidized Bed
SPIV – Stereoscopic Particle Image Velocimetry
SNAP – SO2 and NOx Adsorption Process
w.r.t. – with respect to

Symbols
Latin Alphabet
𝐴 Area m2
𝐶𝐷 Drag Coefficient -
𝐷 Diameter m
𝐹 Force N
𝐹1 Fraction of larger particles -
𝐹2 Fraction of smaller particles -
𝐺 Gas flow rate m3 h-1
𝐻 Height of a GSVU m
𝐼𝑁 Number of slots -
𝐼0 Opening of the slot mm
𝐿 Length m
𝑚 Mass g
𝑃 Pressure mbar
𝑅 Radius of a GSVU m
𝑅𝑒 Reynolds Number -
𝑟 Radial position m
𝑆 Swirl ratio -
𝑢, 𝑣 Velocity m s-1
𝑊 Capacity g

Greek Alphabet
𝛼 Slot angle -
𝜀 Void fraction -
𝜃 Angular coordinate in a GSVU -
𝜇 Dynamic viscosity Pa s
𝜌 Density kg m-3
Subscripts
𝐶 Centrifugal
𝑐𝑢𝑡 critical
𝐷 Drag
𝑓 Fluid
𝑔 Gas phase
𝑚𝑎𝑥 maximum
𝑝 Particle
𝑟 Radial component
𝑠 Solids, slots
𝜃 Tangential component


Table of Contents 1. Introduction ....................................................................................................................................... 1
2. Literature Review .............................................................................................................................. 4
2.1. Gas-Solid Vortex Chamber – a unique technology .................................................................. 4
2.1.1. Fundamentals ................................................................................................................... 4
2.1.2. Advantages and Disadvantages ...................................................................................... 7
2.1.3. Measurement Techniques ................................................................................................ 9
2.1.4. Applications .................................................................................................................... 13
2.1.5. Centrifugal Dryers .......................................................................................................... 16
2.1.6. Particle Segregation ....................................................................................................... 17
2.1.7. Process Intensification ................................................................................................... 19
2.1.8. Conclusion ...................................................................................................................... 21
2.2. Fluidization of Geldart A and C-type particles – a challenge yet to be overcome ................. 21
2.2.1. Conclusion ...................................................................................................................... 24
2.3. A Geldart-type chart for centrifugal fields ............................................................................... 24
2.3.1. Geldart Classification Under Centrifugal Field ............................................................... 25
2.3.2. The evolution of the Geldart Classification .................................................................... 26
2.3.3. Conclusion ...................................................................................................................... 28
2.4. Final Considerations............................................................................................................... 29
3. A Mathematical Model – Critical Particle Diameter ........................................................................... 30
3.1. Fundamentals .............................................................................................................................. 30
3.2. Evaluation of the Model ............................................................................................................... 34
3.3. Limitations .................................................................................................................................... 36
3.4. Conclusions ................................................................................................................................. 38
4. Vortex Setup Description and Experimental Methods ....................................................................... 39
4.1. Gas-Solid Feed Section ............................................................................................................... 39
4.2. GSVU Section.............................................................................................................................. 40
4.3. Downstream Section ................................................................................................................... 42
4.4. Experimental Method - Maximum Loading .................................................................................. 43
4.5. Experimental Method - Particle Segregation/Mixing ................................................................... 44
5. Experimental Results and Discussion ................................................................................................ 46
5.1. Maximum Loading ....................................................................................................................... 46

5.2. Particle Segregation/Mixing ......................................................................................................... 47
7. Conclusions and Future Work ............................................................................................................ 58
8. References ......................................................................................................................................... 60

Index of Figures Figure 1. Plant of the forces acting in a centrifugal fluidized bed (reactor orientated vertically). ............ 6 Figure 2. Comparison between fluidization mechanisms 18 ..................................................................... 7 Figure 3. Overview of the PIV procedure in a GSVR setup25. ............................................................... 10 Figure 4. Torbed reactor41 ...................................................................................................................... 15 Figure 5. Flow patterns in beds with different sizes.3............................................................................. 17 Figure 6. Geldart classification for gas fluidization48 .............................................................................. 21 Figure 7. Graphical classification for gas fluidization of powders under industrial conditions56 ............ 26 Figure 8. Proposed graphical classification for gas fluidization.58 ........................................................ 28 Figure 9. Critical aluminium diameter along the chamber for several gas flow rates. ........................... 32 Figure 10. Critical alumina diameter along the chamber for several gas flow rates. ............................. 33 Figure 11. Sensitivity analysis on the particle diameter. ........................................................................ 34 Figure 12. Resulting trends for the Dcut along the bed by using the model with different approximations
for the initial value of particle diameter. ................................................................................................. 35 Figure 13. Azimuthal velocities along the bed for several particle sizes23. ............................................ 36 Figure 14. Schematic view of the vortex setup, highlighting three sections and key elements within each
of them.................................................................................................................................................... 39 Figure 15. (a) Gas-feed and (b) Solid-feed sections of the GSVU. ....................................................... 40 Figure 16. (a) Top view of the unit chamber (inset: top view of two adjacent metallic vanes forming a
slot) and (b) schematic of the unit: (1) Top view; (2) Side View and (3) adjacent vanes forming a slot.
................................................................................................................................................................ 41 Figure 17. Unit end-wall assembly. ........................................................................................................ 42 Figure 18. Downstream section of the unit. ........................................................................................... 43 Figure 19. Maximum loading of Alumina (0.7 – 0.8 mm) for several air flow rates. Blue: Average data
points and error bars for the exhaust orientated with gravity. Red: Average data points for the exhaust
orientated against gravity. ...................................................................................................................... 46 Figure 20. Ratio between (a) 1 mm and 0.7-0.8 mm alumina particles retained in the bed for several
gas flow rates; (b) 1 mm alumina particles and 0.7 mm aluminium particles retained in the bed for
several gas flow rates. The indicated percentages are reported with respect to 1 mm alumina particles
in the initial mixture. (colored areas represent respective error region) ................................................ 48 Figure 21. Fraction of 1 mm particles retained for various mixtures with different mass compositions. (a)
Fed mixture composed by 1 mm and 0.7-0.8 mm Alumina particles; (b) Fed mixture composed by 1 mm
Alumina particles and 0.7 mm Aluminium particles. Colored areas represent respective error region. 49 Figure 22. Composition of the bed in grams for each air flow rate and initial fed mixture. (a) Mixture of
alumina of different sizes. (b) Mixture of alumina and aluminium of different sizes. ............................. 50 Figure 23. Amount of retained solids for various mixtures with different mass compositions ............... 51 Figure 24. Amount of retained solids for various mixtures with different mass compositions ............... 52 Figure 25. Total solids retained for several gas flow rates. Colored areas represent respective error
region. ..................................................................................................................................................... 53 Figure 26. Total solids retained for several gas flow rates (particle sizes: 1 mm and 0.7-0.8 mm). Colored
areas represent respective error region. ................................................................................................ 53 Figure 27. Total pressure drop data for all mixtures and flows used. .................................................... 54 Figure 28. Total pressure drop measured and its errorbars for multiple bed compositions and gas flow
rates. ....................................................................................................................................................... 55 Figure 29. Solid Volume Fraction in the bed under various air flow rates. ............................................ 55

Index of Tables Table 1. Dimensions of the setup used for the PIV trials reported by Gonzalez-Quiroga et al.65 ......... 32 Table 2. Set of correlations tested. The marked correlation was the one used. ................................... 37

1
1. Introduction
Gravitational fluidization is a process applied on binary systems, e.g. gas-solid systems.
Literature about the subject appears on the late 1940’s1,2. Studies about mixing of both phases1 and the
hydrodynamics of the process2 arise as the referred technology becomes known and interesting for the
scientific community. This technology showed to be useful for catalyzed reactions, where the catalyst is
usually the solid phase and the reactional mixture is the gas phase, and to control the reactor
temperature when the reaction is exothermic. As expected, while a bed is fluidized, a large surface area
between the solid phase and the gas phase is obtained, increasing the heat transfer coefficients of the
system, promoting a higher uniformity of the results and avoiding hotspots.
Although having many advantages and applications, classical fluidization cannot handle
particles with extreme small sizes, such as nanoparticles. The characteristics of the particle can also be
damaged during the entire process, since collisions with the walls and between particles happen. As a
result, the particle can break, if the material is fragile (for example ceramics). The opposite can also
happen. Particles can aggregate, modifying the size distribution of the solid phase, decreasing the
uniformity of the results. The pressure drop associated with fluidization is an important aspect. At an
industrial scale, pressure drop can easily achieve higher values, provoking large fluctuations between
inlet and outlet pressure. As a result, this process demands powerful (and therefore costly)
compressors3. The most important limitation of classical fluidization is the terminal velocity of the solid
phase. This variable cannot be changed using gravitational fluidization since gravity has approximately
the same value on every position of the setup. This implies that there is a limit to what can be achieved
using this technology4.
Such limitation can be overcome by using centrifugal fluidization. Such technology has been
studied since the 1960’s5, but it hasn’t reached the industrial world yet. In this case, the fluidization is
achieved by transferring the gas phase momentum to the solid phase, causing the latter to rotate inside
the chamber, generating a bed close to slot walls. As the transfer happens, the gas loses its momentum
to the solid phase, inducing a change in the velocity of both phases. In centrifugal beds, the centrifugal
field can assume different values and can easily reach high values, depending on the fed gas flow rate.
Therefore, terminal settling velocity does not have a defined upper limit, making the potential of such
technology much wider than classical fluidization4.
There are at least two types of reactors where centrifugal fluidization happens: Rotating
Fluidized Bed’s (RFB’s) and Gas Solid Vortex Reactor (GSVR). They differ in the chamber itself and the
technique used for fluidization. For the first case, there is a motor that allows the chamber to rotate on
an axis and it is typically operated horizontally (i.e. with vertical axis). In the second one, every part is
static, and the solids only have azimuthal motion thanks to the air that is fed to the reactor through
several slots4. The RFB has become obsolesce, since moving parts mean higher costs, related with
electricity, which powers the motor, and maintenance, since such parts get rapidly damaged and need
to be replaces often. Hence, GSVR’s have been gaining more attention from the industrial world and
the scientific community. Regarding operational conditions, a GSVR is easily operated. Experiments

2
can be done in a short period of time. Cleaning the solid phase is also an easy task. All things
considered, this reactor is easily operable.
Centrifugal fluidization has a wide range of applications. Industries like food processing, fuel
production, and biomass processing are investing on possible ways to incorporate this type of
fluidization on their processes6-8. The drying of chilies in a rotating fluidized bed device6 is reported has
a possible application of RFB. Using the rotating fluidized bed technique makes the process easier to
be controlled and presents much better results when compared to natural drying, such as less duration
time and a lower operational temperature. Feeding natural gas into a vortex flow reactor and exposing
it to the sunlight leads to a carbon and hydrogen generation (the ruling reaction is CH4 → C + 2H2)8.
Since there is no flame or burning of any kind, there are no oxides, namely CO2, formed. Therefore, the
carbon obtained is free of impurities. It also offers the possibility of storing and transporting solar energy8.
An experimental comparison between the drying of biomass under gravitational and centrifugal forces
is also present in the litearture9. To compare the performance of both systems, a process intensification
factor is established. Using the centrifugal technology and in terms of the specific drying rate, it was
possible to intensify the process by one order of magnitude.
Analyzing the reported examples, the concept of Process Intensification (PI) arises. The aim for
greener processes and the demanding policies in what concerns industrial processes are aspects which
become more and more important every day for any chemical industry in the world. Using the definition
proposed by Stankiewicz and Moulijn, PI is ‘Any development that leads to a substantially smaller,
cleaner, safer, and more energy efficient technology.’. The level of improvement that is expected when
a process is submitted to intensification must be considerably high since the modifications done imply
questioning and adapting processes that were used for decades.
The vortex technology is an example of a process intensifying equipment since the heat and
mass transfer coefficients are largely improved when this equipment is used. Such variables are related
to the driving force of processes like drying, one of the main applications of GSVRs. Those
improvements are mainly due to mechanical changes. The reactor geometry (the feeding of the gas
phase and the chamber itself) leads to centrifugal fluidization, improving the chemical variables of the
process, such as the yield of the process or the drying time. Besides, the size of the unit can be quite
small when compared to gravitational technologies, since the residence times of both phases are
considerably smaller under centrifugal forces. Particle segregation, a phenomenon reported on the
literature10, can perhaps replace or diminish the need for separation devices downstream. Hence, there
are a lot of aspects of a GSVR which can contribute to PI, making this technology worth to study.
After contextualizing the GSVR technology attending today’s industrial world, the scope of this
dissertation arises. More studies must be made and documented on the subject so that industry
comprehends the true potential of this technology. The construction of a mathematical model capable
of assessing which particles (using their size and density) can be successfully fluidized in a certain
GSVR is the first objective to be discussed. A force balance to a single particle will be performed and
iterative method will be used for solving the resulting equation. Evaluation of the possible configurations
on how the setup can work, establishing the most efficient in terms of maximum loading is one priority.

3
For that, alumina particles will be fluidized with air (injection velocities between 56 and 83 m.s-1) when
the setup is placed against gravity. The results of the same experiment but with the inverse configuration
have already been reported by another student11. The results from both students will be graphically
presented. Estimation of the extent of the particle segregation and how it can be used to enhance a
process is the last goal to be discussed. To achieve that, particles from several materials and sizes will
be mixed and fluidized using several air injection velocities. The outcoming bed will be analyzed, using
size as a separation factor and measuring the amount of each material present in it. That ratio between
the two different groups of particles will tell the extent of segregation/mixing in the bed, for a specific
mixture. Accomplishing all these objectives means that a significant quantity of information will be
collected, helping researchers to apply centrifugal fluidization on their works.

4
2. Literature Review
This chapter will include a complete description of a Gas-Solid Vortex Unit, its fundamentals,
advantages and disadvantages of such technology, industrial applications and some promising
processes that were only developed up to a pilot scale. Some characteristics of this unit which are
recently investigated, such as segregation of particles with different sizes or densities will be explained
and its subsequent value to the industry and feasibility discussed. The fluidization of Geldart A- and
C-type particles, which are used as catalysts and for coating, in centrifugal reactors and some
techniques to deal with such challenging particles when it comes to fluidization will also be explained
and enumerated. The fluidization behavior under gravitational and centrifugal forces of such particles
will be compared under the scope of what forces are responsible for the flowing pattern often presented
by such particles once they are fluidized and how one can improve the fluidization quality of these
materials. Examples of re-interpretations of the Geldart chart presented in the literature will also be
provided, with the intention to guide a researcher on how to plan the construction of a new classification
for gas fluidization of solids under a centrifugal field. Within this review, the topic of process
intensification will also be explained, since this concept is strongly associated with centrifugal fluidized
beds.
2.1. Gas-Solid Vortex Chamber – a unique technology
2.1.1. Fundamentals
A Gas-Solid Vortex Reactor is a relatively new technology that allows the gas fluidization of
solid particles in the form of a rotating fluidized bed in a static unit. Although it’s worth has been proven
in literature, its industrial use is still narrow, mainly because there is still a lack of knowledge on how to
do the scale-up of this type of units. The lack of correlations to describe accurately the main aspects of
such units, related to heat and mass transfer, also contributes to its limited use12.
These units fall under the group of centrifugal fluidized beds. These beds are not only under the
influence of a gravitational field but also under a centrifugal field, which changes the way particles with
a certain diameter and density behave when they are fluidized. Subcategories of centrifugally fluidized
beds contain the rotating fluidized beds (RFB’s) and vortex fluidized beds. They differ in the chamber
itself and the technique used for fluidization. For the first case, there is a motor that allows the chamber
to rotate on an axis and it is typically operated horizontally (i.e. with vertical axis). In the second one,
every part is static, and the solids only have azimuthal motion thanks to the air that is fed to the reactor
through several slots.4 The number of slots of the reactor influences the inlet velocity of the gas phase,
for a given flow rate, and consequently the stability of the bed, since the distribution of the gas phase
will be more uniform among the bed. The dissertation will be focused on the static chamber design.
The rotating bed is obtained only because of the momentum transfer from the gas to the solids
since all parts are static. Due to the momentum transfer from the tangential velocity component of the
gas, the solids inside of the chamber rotate. The radial component of the gas will attempt to drag the
particles towards the exhaust which is located at the central axis of the reactor. The tangential
component of the gas will force the solids into a circular motion which causes a centrifugal force to

5
counteract the radial drag force thus creating a rotating fluidized bed13. Using this technology and until
now, it’s only possible to change the inlet velocity of the gas phase. Inside the reactor, one does not
have control over each velocity component (both tangential, 𝑢𝜃,𝑔, and radial, 𝑢𝑟,𝑔) and therefore the
swirl ratio, 𝑆, is constant for a given unit configuration, e.g. for a certain arrangement of the slots14,
𝑆 =
𝑢𝜃,𝑔
𝑢𝑟,𝑔=
2𝜋𝑅𝑐𝑜𝑠(𝛼)
𝐼𝑁𝐼0 (1)
Where 𝑅 is the chamber radius, 𝛼 is the slot angle, 𝐼𝑁 is the number of slots and 𝐼0 is the opening
of the slot.
In this type of units, the fluidization is achieved by transferring the gas phase momentum to the
solid phase, causing the latter to rotate inside the chamber, generating a bed close to slot walls. As the
transfer happens, the gas loses its momentum to the solid phase, inducing a change in the velocity of
both phases. Hence, as the gas flows along the reactor until the exhaust, its velocity diminishes, and
the solids gain velocity as they travel radially inwards inside of the chamber.
The fluidization inside such units is believed to happen layer by layer, which is significantly
different from the mechanism that rules the fluidization under gravitational fields. Under these
circumstances, the particles located nearest the slot wall of the unit are the first to be fluidized, since
they are the first to contact with the gas phase coming from the slots. Increasing the gas flow rate, the
consecutive layer will also be fluidized, since the momentum of the gas phase increases. The gas flow
rate should be increased until all the solids are rotating. The gas flow rate which allows the fluidization
of the entire solid phase is called critical fluidizing velocity15. However, despite the changes in
fluidization, the pressure drop behavior with respect to the gas velocity for a centrifugal system is the
same as the one for gravitational ones.
Partial fluidization is a phenomenon connected with vortex units, being one of the necessary
steps to achieve fluidization of the entire bed16. Such effect is linked with expanded bed heights and a
larger radius of the chamber. Partial fluidization involves the presence of two layers in the solid phase.
The layer close to the walls is in the packed-bed region and the consecutive layer is in the fluidized-bed
region since the fluidization commences in lower radial positions17.
Such process happens when the gas velocity increases up until a certain value and the
centrifugal force decreases due to a smaller radial position. At this stage, particles with the smaller radial
positions, where the centrifugal force is smaller, start to fluidize. Once the gas has enough momentum
e. g. reaches a certain velocity, it overcomes the centrifugal forces acting on the particles near the slots
and therefore the whole bed becomes fluidized. This step is part of the set of crucial stages to achieve
fluidization in a rotating bed. They are, by chronological order, fixed bed, partial fluidization, partial
bubbling, uniform bubbling and, finally, turbulent fluidization17.
Layers of different particles which lay inside of the vortex unit will be mixed at some point. If those
particles have the same density, mixing will happen because of bubbling. For particles with different
densities, this mechanism suffers some changes. If the denser particles are nearest to the slots, the

6
mechanism does not change. If that is not the case, mixing will happen before bubbling, just due to the
difference of densities. Remark that bubbling still happens but does not imply mixing and both
phenomena are not linked.
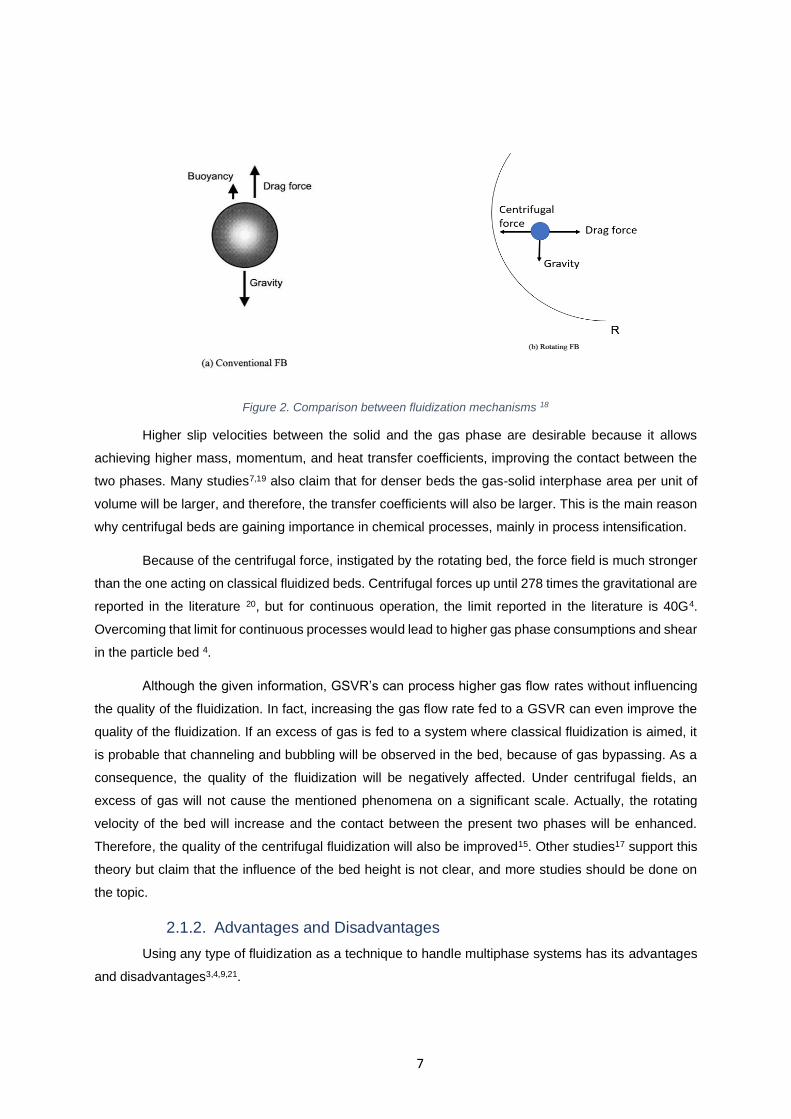
Operation in such equipment is not limited by the gravitational field as in a classical fluidized
bed since the centrifugal force must be considered. Therefore, there are 3 forces acting inside of the
reactor: the gravitational, the drag and the centrifugal, represented in Figures 1 and 2. In the gravitational
fluidization, the velocity of the solids is limited by their terminal velocity when subjected to a gravitational
field, which value is constant. This implies that there is a limit to what can be achieved using this
technology. In centrifugal beds, this limitation can be easily overcome because the centrifugal field can
assume different values and can easily reach high values. Therefore, terminal settling velocity does not
have a defined upper limit. Since the centrifugal field can assume different values for each radius, the
concept of minimum fluidization velocity for a certain set of conditions is not totally applicable in
centrifugal fluidized beds. A minimum gas flow rate is, however, required to achieve high-G operation
4. The mentioned forces acting in a centrifugal reactor are depicted in Figure 1 and Figure 2.
Figure 1. Plant of the forces acting in a centrifugal fluidized bed (reactor orientated vertically).
7
Figure 2. Comparison between fluidization mechanisms 18
Higher slip velocities between the solid and the gas phase are desirable because it allows
achieving higher mass, momentum, and heat transfer coefficients, improving the contact between the
two phases. Many studies7,19 also claim that for denser beds the gas-solid interphase area per unit of
volume will be larger, and therefore, the transfer coefficients will also be larger. This is the main reason
why centrifugal beds are gaining importance in chemical processes, mainly in process intensification.
Because of the centrifugal force, instigated by the rotating bed, the force field is much stronger
than the one acting on classical fluidized beds. Centrifugal forces up until 278 times the gravitational are
reported in the literature 20, but for continuous operation, the limit reported in the literature is 40G4.
Overcoming that limit for continuous processes would lead to higher gas phase consumptions and shear
in the particle bed 4.
Although the given information, GSVR’s can process higher gas flow rates without influencing
the quality of the fluidization. In fact, increasing the gas flow rate fed to a GSVR can even improve the
quality of the fluidization. If an excess of gas is fed to a system where classical fluidization is aimed, it
is probable that channeling and bubbling will be observed in the bed, because of gas bypassing. As a
consequence, the quality of the fluidization will be negatively affected. Under centrifugal fields, an
excess of gas will not cause the mentioned phenomena on a significant scale. Actually, the rotating
velocity of the bed will increase and the contact between the present two phases will be enhanced.
Therefore, the quality of the centrifugal fluidization will also be improved15. Other studies17 support this
theory but claim that the influence of the bed height is not clear, and more studies should be done on
the topic.
2.1.2. Advantages and Disadvantages
Using any type of fluidization as a technique to handle multiphase systems has its advantages
and disadvantages3,4,9,21.

8
As expected, a large surface area between the solid phase and the gas phase is achieved using
this technology. The high thermal inertia of the solids is another characteristic of this regime, which is
important because it measures the tendency of a material to hold heat. Therefore, solids with higher
thermal inertia will keep the same temperature for a longer time. This is an important feature because it
reduces the amount of heat to provide to those particles for them to keep a certain temperature. An
improvement of the solid phase mixing degree leads to more uniform results and helps to avoid hotspots.
With fluidization, the transfer rate of water and heat becomes faster, decreasing the drying time without
subjecting the solids to high temperatures, which can cause permanent damages. Transporting the
solids in and out of the dryer by pneumatic transport (a further stage of fluidization) means less
mechanical and energetic costs.
There are also some undesirable consequences related to fluidization. If the solids used are
fragile, the attrition and the friction can lead to the breakage of the solid phase, to the point of
pulverization. Those fine particles will most likely be lost in the exiting gas stream. Another scenario is
the aggregation of the fines, leading to a serious change in the size distribution present in the unit.
Consequently, the drying rate will diminish, and the results will be less uniform and possibly worse than
expected. The residence time distribution is affected when fluidization is used. Because of the higher
mixing degree, the residence time distribution will increase. Regarding the lifetime of the device where
the operations take place, these are more exposed to erosion, leading to the wear of the facilities, that
should be replaced often. Pressure drop is often associated with fluidization systems since, for gas-solid
systems, the gas phase loses its velocity when going through the solid phase. That pressure drop
increases with the increase of the gas velocity, until a certain limit. Most of the times, that limit is high
enough to cause serious differences in the inlet and outlet pressure. Hence, fluidization is a demanding
process when it comes to compressor costs. The higher the pressure drop of a system, the powerful the
compressor associated needs to be3. For larger bed diameters, the distribution of the gas phase over
the bed is delicate. If the distribution system is not built in a proper way, phenomena as channeling and
slugging can happen. Both are related with an unstable bed behavior. Channeling is the formation of
preferential paths for the gas phase, which leads to poor fluidization. Slugging is the aggregation on
solids in several parts of the bed, making the bed surface non-uniform.
For classical fluidization, fluidizing sub-micron particles is difficult and sometimes impossible,
since the Van der Waals forces for such small particles are extremely strong and overcome the
interfacial momentum of those particles. On the other hand, in an ideal fluidized bed without cohesive
forces, a stable bed is not achievable20. This technique is not flexible. In order to obtain a stable bed,
the system must be designed specifically for that material and the operating conditions cannot differ
much from the minimum fluidization ones. To avoid channeling and slugging, the ratio between the bed
width and height cannot be changed from a calculated value4. Another concern is the wall effects that
often influence the quality of the fluidization. In RFB’s, those effects are negligible17.
Some of these limitations can be overcome when operating under centrifugal forces. A rotating
fluidized bed allows having a more efficient control on the residence time of the solids9. Besides, a wider
range of residence times is allowed in such units. Regarding slugging and channeling, these phenomena

9
can still occur but since the width-height ratio of the device is usually smaller, they are less likely to
happen4. The flexibility of operating conditions with respect to the gas flow rate is increased when
centrifugal fluidization is used, but the unit needs to be wisely designed to achieve the balance between
the centrifugal and drag forces. This balance is mandatory to avoid the entrainment of particles into the
exhaust at the same time to achieve a denser and stable bed. Another advantage is the possibility of
controlling independently the gas and solid flows over a relatively wider range.
Although there seem to be many disadvantages related to fluidization, these aspects are related
to very specific operating conditions. There is still a very wide range of conditions which can be explored.
The disadvantages that are common to most systems can be minimized using a centrifugal fluidization
unit, as the case of channeling and slugging, which can be more accurately controlled using this
technology. The worse aspect is perhaps the damaged inflicted in the dryer and the vessels connected
to that, but the results achieved largely compensate for those costs. The need for larger gas volumes,
and therefore, larger chamber volumes is also a disadvantage. Higher capital costs are associated with
this characteristic. However, such condition can be overcome by choosing reactive systems, especially
where the gas phase is consumed during the reaction.
2.1.3. Measurement Techniques
In a GSVR several properties must be measured to ensure a good set of operating conditions.
In a non-reactive and in a hydrodynamics prospect, the solids velocity, gas and solid temperature
pressure are some of the most important variables. Along with these variables, heat transfer
characteristics of the reactor/unit need to be established by using above mentioned variables. This
section is therefore dedicated to summarizing some measurement techniques that can be applied in a
GSVR. A comment is also added regarding heat transfer in vortex devices.
Solids Velocity and Flow Pattern When dealing with fluids, liquid or gas, traveling inside a reactor or a chamber, its flow pattern
and flow dynamics should be analyzed. Therefore, quantitative measurements of its properties, namely
the position of each particle along time, velocities of particles as a function of radial positions, etc. are
required. For that purpose, many researchers use Particle Image Velocimetry (PIV) techniques.
PIV is a 2-dimensional optical technique that allows to characterize the azimuthal velocity field
of the fluid or the solid phase in a certain region of the chamber. A typical PIV setup consists of a
Charged Coupled Device (CCD) camera, high power laser, an optical arrangement to convert the laser
output light to a light sheet, tracer particles and the synchronizer. The laser and the optical arrangement
that follows illuminate the area which will be examined. The laser has therefore two purposes – illuminate
the examined area and avoid the blurred images, since they freeze the solids’ motion22. With the CCD
camera, a pair of images is taken, which have apart only a few moments. As a good practice, the gap
between two pictures should be enough to let the particle move a quarter of the final interrogation area23,
which is a portion of each image taken by the camera24 . On the other hand, that gap should be short
enough so that the particles with an out-of-plane velocity component leave the light sheet22. After both

10
shots are taken, the displacement of the particles and the time in between those pictures are used to
calculate the particle velocity and therefore, to build a 2D particle velocity vector field23. The information
contained in the images can be converted in a text file, which contains the spatial coordinates and
information regarding the components of solids velocity. That information can afterwards be processed
using a programming software. Finally, the synchronizer is used to coordinate the laser with the CCD
camera25. All the procedures involved during PIV are summed in Figure 3.
Figure 3. Overview of the PIV procedure in a GSVR setup25.
If the goal is to analyze the fluid phase, tracers should be placed in the chamber. Those particles
should be small enough to faithfully follow the dynamics of the fluid and big enough to scatter enough
light to the sensor26. Hence, the velocity field achieved for the particles can be extrapolated for the fluid.
If the solid phase is the one to study, those particles can act as tracers, since they can scatter light.
Hence, this method can also be used to characterize the velocity field of the solids. The only requirement
is that the particles from the solid phase can act as tracers27.
One of the main advantages of such procedure is the capacity of analyze a wider area instead
of a single point, as happens with the Laser Doppler Velocimetry28. For being also a non-intrusive
technique, PIV can be applied in high speed flows or in boundary layers22. Therefore, it allows a great
quantity large quantity of information that can be recorded instantaneously and simultaneously, being
this the biggest advantage of such method28.
Perhaps the biggest disadvantage of PIV is the possibility of decreasing the size of the tracers
by the laser. Such diminishment will alter the results in two possible ways – improve their quality, since
smaller particles will describe more truthfully the flow pattern or worsen it because smaller particles will
11
scatter less radiation, which will influence negatively the quality of the pictures taken. Either way, the
results will be jeopardized and therefore not trustable22.
Besides the presented features that can be achieved using PIV in the context of rotating
fluidized beds, PIV can also offer information about the centrifugal force which is applied in a certain
moment, in a certain point of the reactor. Velocity is composed by three components: radial, axial and
azimuthal. In this context, the azimuthal component is the most relevant one, since it is in this one where
the centrifugal force is expressed. Using PIV, one can know the value of such component and therefore
calculate the centrifugal force in a certain point of the reactor – equation 213.
𝐹𝑐 =
𝑊𝑠,𝑚𝑎𝑥
𝐼𝑁 𝑣𝑠,𝜃
2
𝑟 (2)
Where 𝑊𝑠,𝑚𝑎𝑥 is the maximum solid mass loading, 𝐼𝑁 is the number of slots, 𝑣𝑠,𝜃 is the azimuthal
solid velocity and 𝑟 is the radial position inside the chamber.
In the scope of this thesis, this technique will be depicted by the point of view of a multi-phase
system. In a GSVR, gas and solid phases are presented inside if the chamber at the same time. Hence,
PIV is used to monitor the behavior of the rotating bed. Therefore, the velocity and the arrangement of
the solids in the bed is the characteristic to be studied.
Another technique that can be used to describe the flow pattern in a GSVR is Planar Laser
Induced Fluorescence (PLIF). PLIF is an optical diagnostic technique widely used for flow visualization
and quantitative measurements. Its principal is the fluorescence of the medium when illuminated by a
source of light, usually a laser. The resulting signal is then detected by a sensor. That signal can be
related with other properties and therefore allows to monitor those properties amongst the medium29.
Such technique is also non-intrusive but can provide even more information about the fluid. Using such
method, it becomes possible to measure the concentration of the present species, the temperature and
the pressure of the system. Such properties are all designated as passive scalar properties, since they
do not influence the physical fluid properties30. Thus, the combination of both techniques (PIV and PLIF)
can provide a complete look over systems where fluid dynamics is important, since using both gives the
operator information about the concentration of the present species and the flow velocity field.
In the work of Liu et al.30, this technique is used to study turbulent swirling flow, such as the one
observed in a GSVR, in a multi inlet vortex reactors (MIVR). The production of functional nanoparticles
by flash-nanoprecipitation can be performed in a Multi-Inlet Vortex Reactor (MIVR). To monitor such
process, a characterization of the velocity field can be done using Stereoscopic Particle Image
Velocimetry (SPIV). This technique differs from PIV mainly because it uses two cameras instead of only
one, giving therefore an in-depth perception of the medium. The two remaining components of velocity
can also be evaluated when SPIV is used. This technology proved to be useful in this study since allowed
to understand the importance of the axial component in such systems31.
With such technique, the authors could identify two regions where mixing patterns were
different. In the free-vortex region, the mixing structure was a spiral motion, whereas in the forced-vortex
region it was nearly homogeneous. The phenomena that control the mixing in both regions was also

12
different. In the first region, mixing was controlled by turbulent diffusion and large-scale flow structures.
In the second region, it was only turbulent diffusion the phenomenon which is responsible for mixing30.
The combination of both techniques and some derivations are used by this group in several
types of reactors, which results are published in the literature.
The turbulent mixing in a planar jet reactor was analyzed using PIV and PLIF, which provided
concentration and velocity fields. The measurements were done in six positions where the turbulent flow
was confirmed by the Reynolds number. CFD (Computational Fluid Dynamics) simulations were also
done and both results were compared and showed to be similar. Such studies are important since
turbulent flow provides best heat, mass and momentum transfer than laminar flow32.
Temperature and Pressure Sensors The operating temperature and pressure are perhaps two of the most important indicators of
the state of a system. Both should be carefully controlled in any setup and a GSVR is not an exception.
For that purpose, both pressure and temperature sensors are usually installed in strategic
places, such as the inlet, the bed and the outlet of the reactor. For identifying important locations where
sensors need to be installed, use of CFD simulations is often made. For measuring pressure, two types
of sensors can be used, differential and absolute. The absolute sensor is often used as a reference for
the differential ones. Hence, measurements and recording of the pressure drop are possible between
various sections of the reactor/unit. To monitor gas-phase temperatures, primarily thermocouples are
installed in the chamber, in various positions, determined a priory. Using this methodology, a radial
pressure profile of a GSVR was done and reported in the literature33. This study is done for two different
systems – gas and solid phase and only gas phase. The pressure measurements are used to calculate
the pressure drop of the system and to achieve a relation between the radial position and the gauge
pressure of several locations of the reactor. Thermocouples are preferred as they are cheap and
demonstrate quick response to changes in the temperature. Solids temperature measurement although
is not easy and will be discussed in detail during the following section.
Heat Transfer in Vortex Devices The rate of heating or cooling of a medium is crucial since monitoring the thermal behavior can
provide great information about the subject. This issue gains relevance in a GSVR, since elevated heat
transfer coefficients are a crucial characteristic of such technology and one of the main reasons why it
is studied and used. Based on numerical Computational Fluid Dynamics studies, a rise in the gas to
solid convective heat transfer, as compared to the conventional fluidized bed technologies has been
confirmed25,34. The increased gas-solid slip velocity in the GSVR is at the origin of this phenomenon.
Despite of this, experimental studies focusing on heat transfer are not commonly found in vortex
literature. One of the reasons being difficulty in measuring solid temperature accurately.
An accurate measurement of solid’ temperature in multiphase flow systems is complicated and
not straightforward. Constant renewal of measuring point due to solid movement poses the first major
hurdle. Depending on the operating conditions, solid velocities can vary between 0.5 – 10 m.s-1 in the

13
device. Thermocouples, which are the most preferred, and cost-effective temperature sensors, tend to
have a response time (of the order of few millisecond) much slower than the solid surface renewal speed
(which is in turn proportional to solid velocity). The latter brings an inherent lag in temperature readings
which is, of course, not desired for most of the applications. Secondly, thermocouples fall under the
category of contact-type sensors. Consequently, thermocouples need to protrude into the flow field for
an accurate particle temperature recording. This physical intrusion of a metallic wire provides an
obstacle in the flow; significant enough to alter the local flow for turbulent conditions as seen in a vortex
device. For particles with low Biot Number, the particle surface temperature differs from the particle
internal temperature. Hence, for the reasons discussed, measurement with thermocouples can be
misleading, especially for modeling purposes.
A solution to the above mentioned shortcomings of thermocouples could be overcome by
moving to non-intrusive techniques, one of which being an Infrared (IR) Camera. An IR camera detects
and measures the unique heat signature from a material (in this case, solid particles) by courtesy of a
grid of sensors. The infrared energy that is received is converted into an image mapping the temperature
of the object at hand. Each pixel in the camera sensor array converts the infrared energy focused on it
into an electronic signal. The camera processor further converts the digital signal from each pixel, by
using a mathematical transformation, to generate a temperature map of the object.
2.1.4. Applications
The applications of centrifugal fluidized beds are broadly documented in the literature. The uses
for this technology, at least in a small and pilot scale, are very wide. A research made through the
available literature is resumed in the next pages. Applications in various fields are documented, such as
the food industry, fuel production, and biomass processing.
The study of the kinetic and potential energies of a system and their interaction, namely in
systems of geophysical flows, like glass beads flowing down an inclined plane, under a centrifugal field
were investigated35. The influence of the angle in the rotating velocity and in the height of the bed was
described by qualitative relations. For higher angles and accelerations, larger velocities were achieved,
in a proportional relation. For the same conditions, the height of the bed tends to decrease until a certain
value, that is kept constant for larger angles or larger accelerations. The scaling up of such systems is
also considered since a direct correlation between the velocities of the model and the prototype is
documented. That correlation is based on the centrifugal forces acting on the system. Such correlation
can help to diffuse centrifugal fluidization into an industrial environment, since there is a lack of
knowledge in how to scale up rotating fluidized units, mainly because of its moving parts35.
New approaches for the drying fundamentals in kilns and desorbers are also explored in rotating
fluidized beds. Since the main mechanism of heat transfer is wall-to-bed, an analytical model to predict
the heat transfer rate under such conditions was developed. The main innovation is that the proposed
equation accounts for the effects of moisture evaporation within the bed, bed motion commonly
encountered in rotary desorbers and time-varying wall temperature. By using the developed model,
14
more accurate results can be predicted for such systems, which mitigates uncertainties related to the
time necessary to the drying process36.
The production of catalysts is a complex industry, which accounts for a number of operations
until the catalyst achieves its final form. At a certain stage, heating or cooling is mandatory to enable
drying and then shaping the powder to its final form. For that purpose, calciners or kilns are used which
work under centrifugal forces, whether they are generated by a rotating device or a vortex-like bed.
Therefore, the study of the heat transfer in such devices is crucial for optimization reasons. With an
accurate model to describe heat transfer during calcination and drying, the time spent in those tasks
can be optimized, making the process shorter. Just like catalysts, there are other materials that need to
be dried in a granular form during its industrial processing, namely coal, plastic pellets, metal ores, and
fertilizers, just like described in the literature37.
Rotating drums are largely used in the industry and they are constantly being optimized for
industrial purposes. This equipment can process solids with a wide size distribution, has the capacity to
process large feeding flows and solids with diverse properties are also not an issue for this device.
Hence, scaling relations based on the equations that rule solid motion under such conditions are studied
in the literature26. However, these relations are only applicable to certain ranges of particle diameter and
temperature. For example, the model figuring this article is not applicable to particle diameters smaller
than 100 µm, which fall in the range of Geldart A and C-type particles. As mentioned before, these are
the particles on which a considerable part of this thesis is focused. Despite its limitations, such works
help keep rotating drums updated to the needs of an increasingly demanding industry.
The food industry also takes advantage of rotating vessels, namely to dry food goods using air,
for example an experimental study regarding the drying of chilies in a rotating fluidized bed device6.
During each trial, the rotating velocity of the gas phase was kept constant as well as the temperature.
Parameters such as the moisture, capsaicin (the active component of pepper) content and the color of
each chili were evaluated. To achieve similar final moisture content, the drying time using rotating
fluidized bed is in the range of hours, while days or even weeks are needed if the chilies are dried
through sunlight. Controlling the capsaicin content of the chilies proved to be an easier task when the
rotating equipment was used. Hence, using the rotating fluidized bed technique makes the process
easier to be controlled and presents much better results when compared to natural drying, such as less
during time and a lower operational temperature
The fuel industry has also seen this technology applied in hydrogen production. Feeding natural
gas into a vortex flow reactor and exposing it to the sunlight leads to a carbon and hydrogen generation
(the ruling reaction is CH4 → C + 2H2). The radiation from the sunlight decomposes the methane
molecules in carbon and hydrogen, along with the consumption of energy, since this reaction is
endothermic. By this path, the carbon formed is of nano-filamentary nature. This process shows many
advantages when compared with the most used, which consists of burning natural gas. Since there is
no flame or burning of any kind, there are no oxides formed. Therefore, the carbon obtained is free of
impurities. Another consequence of not having a burning process is that there is no CO2 emitted to the
atmosphere, and therefore decreasing the amount of pollutants associated with the process. Lastly, the
15
solar-driven process upgrades the calorific value of the feedstock by adding solar energy in an amount
equal to the enthalpy change of the reaction. It also offers the possibility of storing and transporting solar
energy8.
The application of protective coatings in solid particles is a process that also fits the
characteristics of centrifugal fluidization units. Once the bed is fluidized, coatings are sprayed from
several angles to the particles. A protective layer will be formed in the surface of those particles. Most
of the times, that layer protects the particle from the surrounding environment or from sunlight. The
mixture that is sprayed is often achieved mixing a solvent with the material with coating properties. After
the spraying, the particles are dried using air, so the solvent can be evaporated38.
The SO2 and NOx adsorption process – SNAP – from flue gases with an Al2O3-based sorbent
is a process by which pollutants can be sequestered from gas streams which would end up in the
atmosphere. It’s a treatment process which suffers significant improvements when performed in
centrifugal units since this technique provides very small gas-phase residence times and a large volume
throughput39. Therefore, intensification is achieved in two aspects: much larger slip velocities and higher
interfacial mass transfer. The main disadvantage of the process is the pressure drop, which can be 20
times higher than in a riser4.
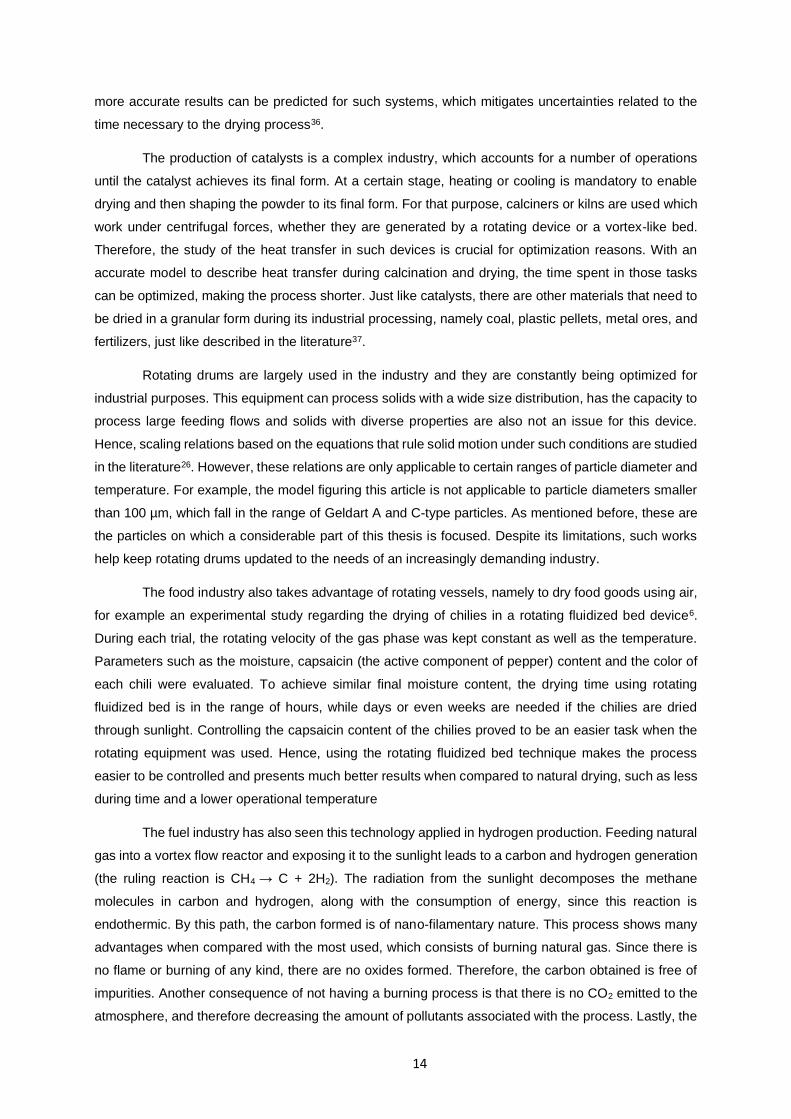
The principal of vortex reactors was also adapted to a different geometry – the torbed reactor.
In this reactor, the gas phase is fed from the below of the plate (in a vertical axis configuration of the
reactor), where several blades are arranged with a specific angle. Passing through those blades, the
gas phase pattern flow is changed, and it starts rotating around a central cone disposed of in the middle
of the plate, as show in Figure 4. The solid phase is fed from the top, slides along the cone and forms a
bed on the top of the plate. As in a vortex reactor, all parts are static in this reactor as well 40.
Figure 4. Torbed reactor41
The main difference between torbed and vortex reactors is the geometry of the solids feeding
system. The distribution of the solid phase is much more uniform in the torbed reactor than in the vortex
one since the particles are distributed around the cone, while in the vortex geometry the solids are

16
usually fed in a single radial position. The main disadvantage when this technology is compared with
the vortex one is the impossibility of removing the particles while operating the unit, what can be done
in vortex reactors though not in a continuous regime.
The applications of such technology are linked with mineral processing, toxic waste destruction,
pasteurization, and materials recycling40.
2.1.5. Centrifugal Dryers
Centrifugal dryers are a huge application of centrifugal fluidization and largely documented in
the literature. The drying process can be applied to porous particles or for superficial drying in non-
porous particles. Many drying processes are present in the literature, including food goods, amorphous
materials, and biomass.
The drying of non-porous particles42 is one of the examples. The materials used are glass beads
and wet sand. The operation occurs in a centrifugal fluidized bed dryer, with a rotating geometry. The
changing parameters were the bed height, the centrifugal force, and the Reynolds number. From those
trials, a model to heat transfer was generated. The article also explores other types of materials, namely
slices and blocks of potato, which have a larger porosity than the ones mentioned before. Although
these differences, the influence of the porosity is never mentioned. A lack of information on how particles
with different porosities behave under the conditions of a centrifugal dryer is noticed. Regarding the
different shapes of potato, is concluded that the optimum dimensions for each material should be
determined for a set of operating conditions.
An experimental comparison between the drying of biomass under gravitational and centrifugal
forces is also present in the litearture9. To compare the performance of both systems, a process
intensification factor is established. It is defined as the ratio between a certain variable obtained for the
centrifugal fluidized bed with a static geometry and the gravitational bed. Using the centrifugal
technology and in terms of the specific drying rate, it was possible to intensify the process by one order
of magnitude. The stage of drying that has seen more improvements was the first one, the constant rate
period, where the vapor pressure in the particle surface is equal to the saturation point of the surface
temperature.
There are 3 characteristics that make centrifugal fluidization more powerful: the higher gas-solid
slip velocities, which leads to higher interfacial heat transfer coefficients; a denser and a more uniform
bed. From these three, the most significant one is the density of the bed. In a centrifugal bed, the bulk
density of the bed is much higher than in a gravitational one. On the other hand, the slip velocities do
suffer an increase but it's not substantial. All these improvements come with the cost of higher air
consumption, which is six times higher than the amount needed in a gravitational bed. Nevertheless, air
usage efficiency is maintained. To diminish the consumption of air, recycling can be considered, as long
as the moisture content is far from reaching the saturation point. During operation, it was noticed that
the moisture content of the particles inside of the reactor was lower than the particles in the outlet region.

17
The cause is a partial bypass of the biomass. This issue can be solved optimizing the feeding and the
outlet geometry of the solids, making it similar to the one used for the gas phase, which implies getting
several inlets for the solids distributed over the chamber.
Once more, scaling up can be an issue, mainly related to the non-uniformity of the results and
the consumption and usage of the gas phase19. Some suggestions are made to improve those issues,
like working with several zones inside the same chamber, which replicates the behavior of a battery of
CSTR'S. To decrease the amount of air used the presented solution is to make it flow through several
chambers. A single use represents a waste of potential since under these conditions, the air rarely
reaches its saturation point. A different behavior of bubbles and mixing regimes for different bed sizes
were also verified3. In smaller beds, the solid phase is dragged along with the gas phase, whereas in
larger beds there is recirculation near the walls. Remark that the size of the bubbles in both cases is
similar. It's the flow patterns that change that may differ from bed to bed. Therefore, this group is
skeptical about results obtained in a laboratory scale or even a pilot scale, since most of the changes
that the system can suffer will not be predictable in those environments. None of those can assure the
fluidization will work on an industrial scale.
Figure 5. Flow patterns in beds with different sizes.3
2.1.6. Particle Segregation
The segregation of particles by their size and density is a promising feature of GSVR’s which
still needs to be explored. This advantage can be applied in processes during which the particles suffer
a decrease of size or density or new ones are formed during the ongoing process. Those changes can
be caused by a reactive or non-reactive environment.
The interesting feature of segregation which can be applied in a GSVR is the change of radial
position inside the reactor depending on the size or density of the particle. When a particle becomes
smaller/lighter, it will travel radially inwards inside of the reactor and therefore it will be easily entrained
from the chamber. If a particle loses mass, either because diameter or density changes, the centrifugal
force applied will decrease and therefore its radial position in the chamber will change. A wide
distribution of the particle sizes in the bed is linked with segregation since the forces acting on each
particle have different impacts. The forces acting on the system are the same but their impact on each
particle it's not43.
18
One application of this feature would be chemical looping combustion (CLC) of coal. In CLC, a
typically metallic oxygen carrier is transported between an air reactor where the oxidation of the carrier
takes place and a fuel reactor in which combustion of a hydrocarbon proceeds with the oxygen provided
through the oxidized carrier10. The GSVR technology shows potential for the second part of the process,
specifically to separate the carrier from coal and from ash. Using a centrifugal unit like GSVR would
provide in-situ separation in a single unit operation. Using the GSVR technology for CLC would decrease
the costs related to equipment and operation and would intensify the process.
A few theoretical studies, using CFD simulations, were done on the topic and described in the
vortex literature10. The flow pattern of a system constituted by air and a mixture of two different solids in
a GSVR was simulated in order to study the separation of phases and particle segregation. That mixture
was composed by two different materials: type 1 – big/heavy particles (1mm and 2700 kg.m-3; 4.864
kg.s-1) and type 2 – small/light particles (0.4 mm and 200 kg.m-3; 0.032 kg.s-1). The main gas used was
air. A standard solids’ inlet design was implemented.
Although the simulation time is only 1 second, three stages of the system were studied. In the
first 0.1 seconds, only the gas phase was fed into the reactor. The formation and stabilization of the free
vortex happened during this stage. This proved to be a very strong vortex, occupying the entire chamber.
The highest velocities (above 35 m.s-1) are detected in the free board region.
Once the solid mixture is fed to the reactor, the free vortex loses strength. From this moment
on, it is possible to see different flow patterns for each type of particle. The small/light particles present
a higher rotation velocity when compared with the larger/heavy ones. Therefore, only 0.25 seconds after
the beginning of the second stage, some of the smaller particles have already completed one rotation.
The particles are mostly found close to the wall. As the feeding continues, particles with different
properties assume different radial positions, but that arrangement is not clear enough to distinguish two
different beds. Another phenomenon worth to be mentioned is the loss of both types of particles through
the chimney, in an early stage of the simulation. This happens almost from the beginning of the feeding.
There are two possible explanations: bypassing, which is also mentioned in the literature9, of the fed
solids, causing an early entrainment of the solid phase; or the collision between the incoming particles
and the ones which are already rotating inside the chamber. This last reason would lead to the
disturbance of the bed, and, once more, to an early entrainment of some of the particles.
In the last stage, the effect of feeding in the bed stability was evaluated. Without particles
entering the reactor, the freeboard region is free from solids. Therefore, the free vortex presents itself
stronger. Alongside with this effect, phase separation and particle segregation gain importance. The
formation of two beds happens in the chamber. One closer to the circumferential walls, denser, where
the heavier particles stay and one closer to the free board region, less dense, where the smaller particles
are rotating. Because of its lower density, this second bed can assume a vortex free-like behavior. In
both beds, it’s possible to find a small percentage of particles from the other type. When small particles
are found amongst bigger ones, they get trapped in the voids and are not likely to leave. When the
opposite happens, the big particles easily leave that radial position, travelling outwards in the chamber
to the periphery.
19
From the above analysis, the authors propose the creation of outlets for each type of solids,
using the chimney only for the exit of the gas phase. The optimization of the solids’ inlet is also
suggested, since it can be the reason of unnecessary losses and disturbance in the rotating bed. This
work does not present any experimental validation and the reason why the inner bed is less dense than
the outer one is not clear, since the mass of smaller particles is so small compared with the amount of
bigger particles fed.
Within the same subject, the influence of small/light particle size and density in the rate and
quality of particle segregation in a GSVR was studied through CFD simulations44. The study concludes
that keeping the properties of the big/heavy particles constant, the segregation observed is fast and
efficient for a large range of sizes and densities of the small/light particles. It is also concluded that a
faster or more pronounced segregation is obtained when the particle diameter or density ratio are
increased. An optimal particle diameter ratio is also found. Above that value, the edges of the beds
become irregular and contamination with different particles happen. Below that value, the difference
between diameters is not big enough to form two distinctive beds. This study strives to combine the
effects of particle segregation, gas-solid contact and gas-solid separation, which are all enhanced by a
high-G field. The scope of the article is a step closer to be achieved, since a range of successful
operating conditions is attained.
In a more practical approach, particle segregation is studied experimentally in a GSVR, when
integrated in the above-mentioned CLC of coal45. For this purpose, a GSVR is used to separate a mixture
of granular materials inside of the chamber from the oxygen carrier, which is successfully achieved.
Since the mixture is formed by particles with different sizes and densities, the formation of two
distinguish beds is observed. Other systems are experimentally studied, including cork, glass beads and
high density polyethylene (HDPE). In the case where glass beads and HDPE are fed to the reactor, no
segregation is achieved, since low drag and centrifugal force are associated to glass beads, in opposite
to HDPE, which particles are under high drag and centrifugal force.
The principle of segregation is still a concept that needs development and a more accurate
theoretical and experimental understanding since the literature lacks information about the subject.
2.1.7. Process Intensification
Process intensification (PI) is a topic which received much attention by the industry world since
aiming for improvements in industrial processes is a growing need. The aim for greener processes is
also a reason for which process intensification gain so much attention lately. Demanding policies in what
concerns industrial processes has increased the interest in the process which can be developed in
smaller, less pollutant and more efficient setups.
Using the definition proposed by Stankiewicz and Moulijn, PI is ‘Any development that leads to
a substantially smaller, cleaner, safer, and more energy efficient technology.’. The level of improvement
that is expected when a process is submitted to intensification must be considerably high since the
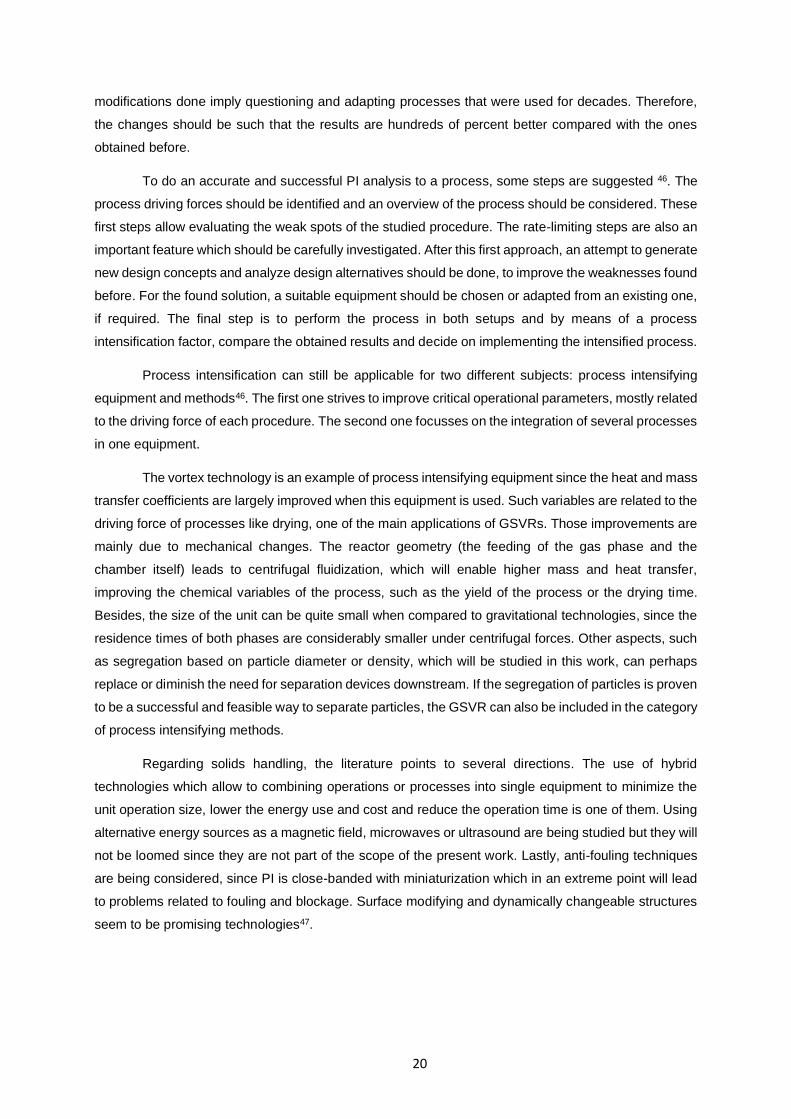
20
modifications done imply questioning and adapting processes that were used for decades. Therefore,
the changes should be such that the results are hundreds of percent better compared with the ones
obtained before.
To do an accurate and successful PI analysis to a process, some steps are suggested 46. The
process driving forces should be identified and an overview of the process should be considered. These
first steps allow evaluating the weak spots of the studied procedure. The rate-limiting steps are also an
important feature which should be carefully investigated. After this first approach, an attempt to generate
new design concepts and analyze design alternatives should be done, to improve the weaknesses found
before. For the found solution, a suitable equipment should be chosen or adapted from an existing one,
if required. The final step is to perform the process in both setups and by means of a process
intensification factor, compare the obtained results and decide on implementing the intensified process.
Process intensification can still be applicable for two different subjects: process intensifying
equipment and methods46. The first one strives to improve critical operational parameters, mostly related
to the driving force of each procedure. The second one focusses on the integration of several processes
in one equipment.
The vortex technology is an example of process intensifying equipment since the heat and mass
transfer coefficients are largely improved when this equipment is used. Such variables are related to the
driving force of processes like drying, one of the main applications of GSVRs. Those improvements are
mainly due to mechanical changes. The reactor geometry (the feeding of the gas phase and the
chamber itself) leads to centrifugal fluidization, which will enable higher mass and heat transfer,
improving the chemical variables of the process, such as the yield of the process or the drying time.
Besides, the size of the unit can be quite small when compared to gravitational technologies, since the
residence times of both phases are considerably smaller under centrifugal forces. Other aspects, such
as segregation based on particle diameter or density, which will be studied in this work, can perhaps
replace or diminish the need for separation devices downstream. If the segregation of particles is proven
to be a successful and feasible way to separate particles, the GSVR can also be included in the category
of process intensifying methods.
Regarding solids handling, the literature points to several directions. The use of hybrid
technologies which allow to combining operations or processes into single equipment to minimize the
unit operation size, lower the energy use and cost and reduce the operation time is one of them. Using
alternative energy sources as a magnetic field, microwaves or ultrasound are being studied but they will
not be loomed since they are not part of the scope of the present work. Lastly, anti-fouling techniques
are being considered, since PI is close-banded with miniaturization which in an extreme point will lead
to problems related to fouling and blockage. Surface modifying and dynamically changeable structures
seem to be promising technologies47.
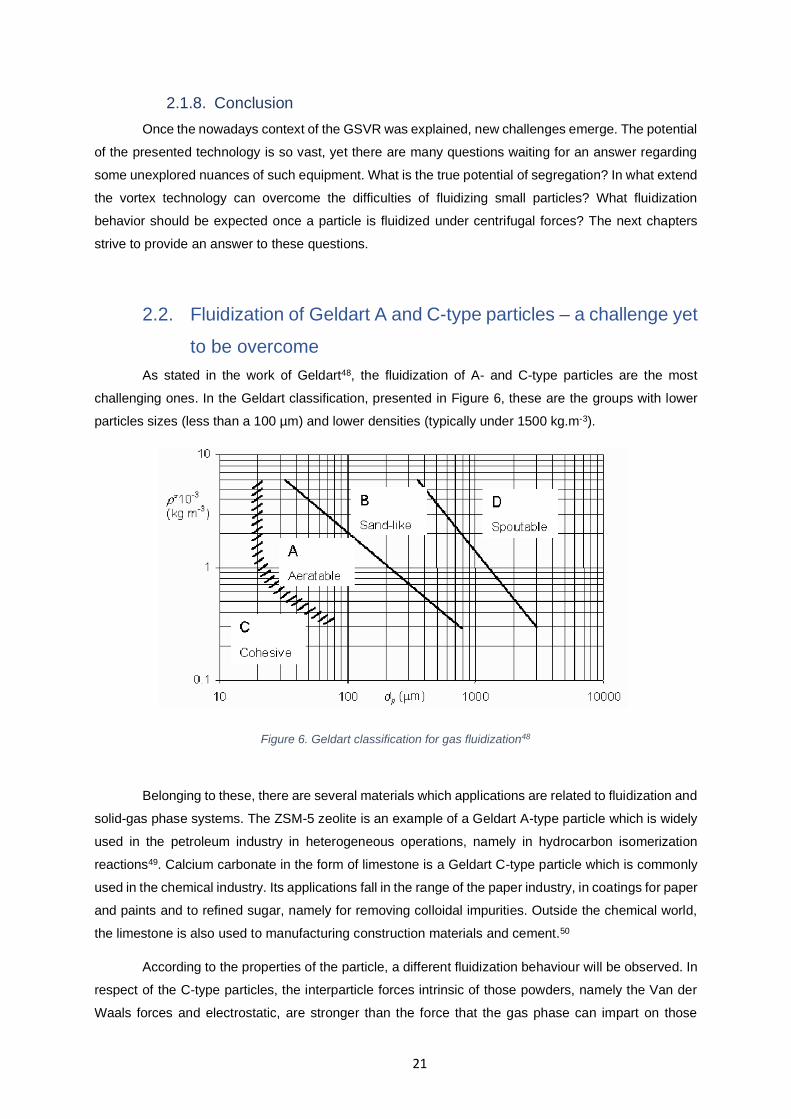
21
2.1.8. Conclusion
Once the nowadays context of the GSVR was explained, new challenges emerge. The potential
of the presented technology is so vast, yet there are many questions waiting for an answer regarding
some unexplored nuances of such equipment. What is the true potential of segregation? In what extend
the vortex technology can overcome the difficulties of fluidizing small particles? What fluidization
behavior should be expected once a particle is fluidized under centrifugal forces? The next chapters
strive to provide an answer to these questions.
2.2. Fluidization of Geldart A and C-type particles – a challenge yet
to be overcome
As stated in the work of Geldart48, the fluidization of A- and C-type particles are the most
challenging ones. In the Geldart classification, presented in Figure 6, these are the groups with lower
particles sizes (less than a 100 µm) and lower densities (typically under 1500 kg.m-3).
Figure 6. Geldart classification for gas fluidization48
Belonging to these, there are several materials which applications are related to fluidization and
solid-gas phase systems. The ZSM-5 zeolite is an example of a Geldart A-type particle which is widely
used in the petroleum industry in heterogeneous operations, namely in hydrocarbon isomerization
reactions49. Calcium carbonate in the form of limestone is a Geldart C-type particle which is commonly
used in the chemical industry. Its applications fall in the range of the paper industry, in coatings for paper
and paints and to refined sugar, namely for removing colloidal impurities. Outside the chemical world,
the limestone is also used to manufacturing construction materials and cement.50
According to the properties of the particle, a different fluidization behaviour will be observed. In
respect of the C-type particles, the interparticle forces intrinsic of those powders, namely the Van der
Waals forces and electrostatic, are stronger than the force that the gas phase can impart on those

22
particles, causing plugs in smaller diameter beds and channelling in larger beds. The fluidization state
is difficult to achieve for particles belonging to this group because of interparticle forces. Therefore,
these particles are characterized as cohesive.
Some of the mentioned difficulties in fluidizing Geldart C-type particles can be overcome using
external means, such as vibration, rotation, centrifugation or a magnetic, electric or acoustic field3,20.
Developments regarding improving the fluidization of cohesive particles are presented in the literature
as coating techniques. The surface of the bigger particles (or host particles) is covered with
nanoparticles (guest particles), decreasing the interparticle interactions and therefore diminishing the
cohesive effects. This process is called functionalization and its applications are very broad. It can be
used to modify the flowability, dispersibility, fluidization purposes, homogeneity of the surface, content
uniformity and dissolution profile51. By using this method, the intrinsic properties of the particles are
being altered, namely the surface characteristics. Another method to improve the fluidization quality of
cohesive powders is to mix those with particles having different size or shape20.
Concerning the particles which dwell in A type, the bed will expand considerably before bubbling
starts, but fluidization is hardly achieved under gravitational fields48. Phenomena as slugging and
channeling are also common in such operations4. A bed formed by particles which properties match the
A-type is classified as aeratable since the gas phase can pass through the bed, but the flow pattern
cannot develop enough to attain fluidization.
The fluidization of Geldart A-type particles under gravitational forces was numerically studied52
and the influence of each pair of forces present in the system was correlated with their fluidization
behavior. Through simulations, this study concluded that the bubbling regime is mainly caused by fluid-
particle interaction, which is the dominant pair of forces. Moreover, during homogeneous fluidization,
there is no main effect since this stage is described as a transition period while the three pairs (particle-
particle, which includes particle-wall interaction; gas-particle and interparticle forces, such as Van der
Waals forces) act at the same extent, which results in competition and absence of a pronounced effect.
Usually, this stage is classified as unstable, since the interactions between the fluid and the particle are
very strong. Consequently, the velocity of the particles increases, destabilizing the bed. Since the other
two pairs of forces have several directional components, and if each component is significant enough,
the bed can be stabilized increasing one or both. The challenge is to lead the system to a homogeneous
fluidization stage and to keep it there, maximizing the heat and mass transfer coefficients.
However, there are other theories related to the homogenous fluidization of Geldart A-type
particles under gravitational forces in literature. The previous theory stated that for this regime there is
not a demarked effect from any of the pairs. Two hypotheses are evaluated related to which pair has
more influence under this regime, if the fluid-particle or the particle-particle pair. The discussion has
relevance since both theories are sustained by experiments but not in a satisfactory way, as both present
flaws. Two important aspects about the fluidization of these particles are the minimum velocity of
bubbling, defined as the gas phase velocity when the first obvious bubble appears, and the minimum
velocity of fluidization. For the first-mentioned parameter, the influence of Van der Waals forces is almost
null. Otherwise, this type of force has much more influence on the minimum bubbling velocity. Increasing

23
those forces will lead to an increase in the minimum velocity. If that increase is substantial, the
fluidization behavior will change, shifting for typical C-type comportment.53
Bearing in mind the advantages present before in this work related the centrifugal fluidization,
is expectable that the fluidization of Geldart A-type particles would be reached easily. A search among
the available literature was done and one article was found. Although there are several articles regarding
the fluidization of ultrafine particles (nanometer scale) for coating purposes, none of them mentions the
use of Geldart A-type particles.
The fluidization of glass beads with a diameter of 100 µm in a rotational fluidized bed is
described in the literature 54. The particle density is not provided, but with such diameter, these particles
most likely belong to group A from the Geldart classification. Therefore, under gravitational forces, these
particles are expected to form a bed which will suffer a considerable expansion before fluidization, if this
stage is achieved at all. Agglomeration is also verified during the reported experiments. When the
particles are submitted to centrifugal forces, specifically 16G, its behavior changes. The bed also
expands but the fluidization stage was easily achieved, and the surface of the bed was irregular.
Introducing carbon particles in the chamber and the gas phase, mixing between both particles was
verified. This happened without agglomeration of the glass beads or distinguish bubbling formation. The
pressure drop of the glass beads under 9, 16 and 37 G was evaluated. For the first two scenarios, this
parameter assumed the same behavior as in gravitational systems, increasing linearly with the gas
phase velocity and stabilizing at the minimum fluidization velocity. For the highest centrifugal force, that
limit was not reached. Estimations of the pressure drop vs. gas phase velocity where done which
considered particle entrainment and bed expansion. The experimental data was clearly similar to those
estimations. Later, the results published will be compared with the ones achieved in LCT for the present
work.
The influence of coating cornstarch (a group C powder, according to the Geldart classification)
with an aqueous solution of hydroxypropylcellulose (HPC-L) in the cohesive properties of those particles
was evaluated. The procedure took place in a rotating fluidized bed coater. By the end of the process,
the particles presented a much more uniform surface which implies that the bed was successfully
fluidized. The releasing time of the drug was extended without compromising the agglomeration state
of the particles. Besides, an effective way for fine particle coating of cohesive fine powders was also
found.18
Some of the presented examples use coating as an improvement tool for the cohesive
properties and others’ purpose is to modify its surface properties without jeopardizing the initial
agglomeration state.
The effect of mixing ultra-fine particles (Geldart C-type) with fine particles (Geldart A-type) is
studied43. By mixing such particles, a simulation of the effects of breakage or surface abrasion of the
fine particles is aimed. This scenario would drastically change the particle size distribution and the
fluidization behavior of the bed under gravitational forces. There were several mixings studied: 30, 50
and 68% (w/w) of ultra-fine particles. Increasing the percentage of ultra-fine particles delays the starting

24
of partial fluidization, which was the only type of fluidization achieved, and increases the bed pressure
drop. Having such a wide size distribution leads to small void sizes, a greater air retention capacity,
enhanced fluidity and partial mixing of the particles. The properties, such as the bulk solid flowability
and the bulk density, of mixtures with higher content of ultra-fines are similar to the properties of those
ultra-fines isolated, e.g. not mixed with anything else. Hence, smaller particles have a large effect on
the properties of the bed and consequently in the presented fluidization behavior. The researchers also
state that the reproducibility of these experiments is null since the fluidization behavior presented in
each trial varies between cracking, channeling, and agglomeration. Therefore, a pattern is not possible
to establish. To conclude, there are several effects in mixtures between ultra-fine and fine particles
which are not clear and strive for more investigation. Although, such effects improve the quality of
fluidization of ultra-fine particles for two reasons – agglomeration between particles with a different size
and the separation of the previously formed agglomerates, caused by friction and collisions. The
breakage of these agglomerates creates smaller agglomerates but improves the size distribution, which
enhances the fluidization. Agglomeration is important because bigger ‘particles’ are formed, with higher
kinetic energy and higher density. The conclusions from this article cannot be directly applied to
centrifugal fluidization since other parameters arise. Although, it is expected that the effects observed
by mixing fines and ultra-fines can be enhanced under a centrifugal field.
2.2.1. Conclusion
Concluding, the fluidization of small powders is getting more attention from the researchers,
mainly under centrifugal forces, since using a classical gravitational fluidized bed has proven to be
difficult. There are a few techniques used to ease the process reported in the literature, including
functionalizing the particles, coating techniques, vibration, and other external means. The use of the
vortex technology has proven its worth in improving the quality of the fluidization of such small particles,
which is a good indicator for the work ahead, which consists in, first, successfully fluidized particles
belonging to the mentioned groups and, secondly, study its behavior under centrifugal forces once they
are fluidized. This subject will be discussed in the following chapter.
2.3. A Geldart-type chart for centrifugal fields
Geldart 48 presents a graphical way to classify gas fluidization behavior of powders, according
to particle diameter and density. The resulting chart is influenced by many factors, such as temperature,
pressure, gravitational forces, cohesion, air viscosity, the adsorption of the gas in the particle and
gravitational acceleration.
The graph, presented in Figure 5, is divided into 4 groups – A, B, C and D. Each of them
represents a different fluidization pattern. For particles belonging to group A, the bed suffers a
considerable expansion before bubbling starts. Because of the expansion of the bed, these particles are
classified as aeratable. For B-type particles, the bubbling starts at the minimum fluidization velocity. The
bed expansion is small, and the bed collapses rapidly when the gas phase ceases. In the absence of

25
bubbling, the power circulation is little to non-existing at all. The main difference between these two
groups consists of the degree of expansion observed. Higher expansion means the particles belong to
group A, while little expansion indicates a group B material. In beds constituted by C group particles,
slugging and channeling are two possible scenarios. For smaller beds, the powder tends to lift as a plug
and for larger ones, channeling is recurrent. These particles can only be fluidized in an agglomeration
form, which is not easily achieved because of the plug formation or channeling in the bed. Finally,
particles fitting the properties of D group will probably form stable spouted beds 20,48.
When one chooses fluidization as the technique to deal with a solid-gas system, usually high
mass and heat transfer coefficients are aimed. For maximizing those, bubbling should be minimized.
Therefore, the quality of fluidization is often linked with such property. Following that thought, the quality
of fluidizing Geldart A-type particles is better than Geldart C-type particles and so on 20.
2.3.1. Geldart Classification Under Centrifugal Field
During operation in GSVR’s or any other kind of unit where a centrifugal field is present, the
Geldart classification is not appropriate, since shifting between groups is reported in the literature20.
Particles with density and diameter in agreement with group A showed a fluidization behavior closer to
the one expected for group B. Therefore, a need to create a new Geldart-like chart that gathers the
fluidization behavior for solids with different densities and sizes under centrifugal forces arises.
The work available in the literature compares the fluidization pattern achieved in a gravitational
fluidized bed and a rotating fluidized bed20. Geldart C-type particles – 7 µm Alumina with a density of
1470 kg.m-3 – were submitted to several centrifugal forces, between 7 and 278 G. For lower centrifugal
forces, the particles present a typical Geldart C-type behavior, with agglomeration, a bed surface
nonuniform and formation of channels among the bed. Increasing the rotating velocity (and therefore
the centrifugal force), the channels diminish in size. At 34 G, the particles start to separate from one
another, which represents a shifting in the fluidization behavior, since it is possible to fluidize the bed
without solids agglomeration. Although this changes, it is still not possible to define the fluidization
behavior as one single group. At 56 G, there are no agglomerations among the bed and the surface
presents itself as uniform. Increasing, even more, the centrifugal force applied, the particles presented
themselves as belonging to group A or B. Distinguish between these groups is difficult since the only
difference is the moment which the bubbling starts, if before or at the minimum fluidization velocity.
Because of this, the authors decided to create a A/B group, which is considered to be a stable state of
fluidization.
This article obviously concludes that the fluidization behavior of the same particles shifts with
the forces field applied. To stronger fields, e.g. centrifugal ones, the quality of the fluidization is better,
and it's easily achieved. However, to reach such stronger fields, the usage of the gas phase reaches
values that can be too high and therefore unfeasible the operation 20. Other researchers also conclude
that viscosity has the same effect on fluidization quality than increasing the acceleration field 55.

26
2.3.2. The evolution of the Geldart Classification
Other attempts at designing a Geldart-like chart were done and reported in the literature. Such
tries were done focusing on and using different approaches, which will be reported in the next pages.
The Geldart classification as it was first presented does not apply in an industrial environment,
since most processes are performed at higher temperatures and pressures and with other fluids rather
than air, which modifies the fluidization behavior of the solid phase. Therefore, a re-interpretation of the
Geldart classification based only on examples found in the literature is presented56. The authors present
several situations in which the powders shift from one group to another under certain conditions, as is
the case of Geldart B-type particles fluidized by supercritical carbon dioxide under high pressures. Those
reasons are the motivation for their work.
This new classification, represented in Figure 7, which plots a dimensionless density (𝜌𝑝−𝜌𝑓
𝜌𝑓)
against the Archimedes number, allows representing the same powder in different parts of the graph,
but only if the density of the fluid is different. It also allows representing in the same plot powders with
different properties, fluidized at different pressures and temperatures and by gases of different nature.
Figure 7. Graphical classification for gas fluidization of powders under industrial conditions56
Therefore, the range of situations where this classification is applicable is much higher than the
one proposed by Geldart 48 and some heuristics can be assumed by analyzing this graph: increasing
the fluid density and viscosity enhances a Group A-like behavior; the same happens for higher operating
pressures. However, changing the temperature does not have a straightforward effect, since it leads to
a decreasing fluid density and an increased fluid viscosity. Comparing the results given by the new
classification with the ones reported in the literature, the results are remarkable. Hence, this new
graphical classification of gas fluidization of powders appears to be very accurate. However,

27
experimental confirmation by the authors would add value to the work, since all the data presented was
collected by themselves from the existing literature. Another aspect worth mentioning is that the result
achieved can be unpractical if one chose to use in the everyday life.
Another aspect of the original classification of Geldart that was evaluated is the cohesive forces.
On that first attempt, the cohesive forces considered between particles were only due to Van der Waals
forces and electrostatics. However, if the powder is wet or contains a high amount of moisture, the
cohesive forces will change, and most likely, become stronger. This situation was not predicted by
Geldart and therefore the need to improve his original classification57.
For that purpose, several solids with different moisture content were evaluated and changes in
the fluidization behavior were detected. Two different systems of fluidization were used to study two
different forces. A system where fluidization is performed with water and Geldart C-type particles and a
second one, where air and Geldart D-type particles with high moisture content are studied. The focus
on the first system is to study the Van der Waal’s forces, which are weaker in liquid mediums. On the
other hand, the second system will be used to study liquid bridges, which augment the cohesive forces.
Both systems operate only under gravitational forces.
These two forces play an important role in particles which are commonly fluidized. The Van der
Waals forces are present in particles which are 100 µm or less and are mostly due to charges
interactions. The liquid bridges are formed when two particles present some moisture in the surface.
This force augments the attraction between those two particles, making more difficult to separate them.
Generally, in the presence of water, the liquid bridges are stronger than the Van der Waal forces.
However, this situation can change according to the amount of moisture on the surface of the particle.
Analyzing the results from the experiments, a clear connection between the moisture content
and the fluidization behavior is achieved. Geldart D-type particles which have a significant amount of
moisture present a behavior close to the one expected for A or C solids. As predicted, the Van der Waals
forces are weaker in aqueous mediums than in air mediums. Although these conclusions, a graphical
classification is not provided by the researchers.
The last example presented in this section emphasizes the importance of nanoparticles for the
industry, which is related to their appealing characteristics, namely high surface area, which is linked to
higher mass and heat transfer coefficients and to better quality surface catalysts reactions and coating
purposes. Although these solids are, in theory, and partially, included in the original Geldart
classification, studies report that particles with such small diameters do not always present a C-type
typical behavior58.
Therefore, this study58 evaluates the gravitational fluidization of zinc and copper oxide particles
with 50 nm and a density of 5600 kg.m-3. For such small particles and high velocities, a more accurate
technique than eyesight is required. The chosen one is X-ray microtomography imaging, which allows
the operator to observe the bed and its behavior without destroying the material and obtain real-time
and in-situ information.
28
Particles with a diameter smaller than 50 µm, the surface forces begin to dominate, which leads
to an increasing cohesiveness. Hence, agglomeration tends to happen. With bigger agglomerates, the
short-range forces which are linked to cohesiveness get weak, changing, therefore, the fluidization
behavior. Higher particles become more easily fluidized and hence many articles have been published59-
62 with the scope of fluidizing nanoparticles by the production of dynamically stable and large
agglomerates. Those agglomerates can reach diameters of microns or even millimeter-order of
magnitude. The agglomeration degree was studied with the X-ray microtomography imaging technique.
At small air velocities (0.052 m.s-1), the agglomerates present a behavior close to the one
expected for A and B particles. The bed is divided vertically into two regions. In the bottom, the bed is
fixed, and channeling is often observed. On the top, bubbling and turbulent flow tends to happen. At
higher air velocities (0.078 m.s-1), the previously formed agglomerates break apart, but because of the
cohesive forces, the small pieces become an agglomerate again. This process is called dynamic
nanoparticle clusters.
Because of this dynamic, a new group of fluidization behavior was established. This group,
designated as E, stands for ‘expandable' and occupies the bottom part of the C group proposed by
Geldart. The main reason to create a new group is the importance of the short-range forces and its
influence in nanoparticles with a density smaller than 100 kg.m-3. Remark that such small densities are
associated with clusters and not to the nanoparticles itself.
Figure 8. Proposed graphical classification for gas fluidization.58
With this work, a more complete classification of the types of gas fluidization was achieved. An
advantage of the proposed graph is the ease in utilization, something that is not always a priority.
2.3.3. Conclusion
In short, many attempts to improve the Geldart classification were done over the years. Reasons
of industrial nature are the motivation for many of those since the old classification could no longer
respond to the needs of the industry. Some of the proposed classifications are easy to use than others
29
and some present a broad range of application. However, a paper reporting a classification for systems
under centrifugal forces was not found in the available literature. The closer that was found to the meant
scope was a comparison between the results obtained under gravitational and centrifugal conditions,
which demonstrated not be sufficient for the industry to fully understand the gas fluidization behavior of
particles under such circumstances. With the increase of the use of centrifugal fluidization, a clear need
to adapt the Geldart classification to centrifugal fields arises. Remark that designing a graph applicable
for general centrifugal forces it's not possible since these forces can assume several values and
therefore imply different behaviors for the bed. Hence, a graph should be designed to a specific value
of centrifugal force.
2.4. Final Considerations
With this literature review, a state of art about fluidization under centrifugal fields was provided,
with particular focus in vortex technology. This has a huge potential and its use amongst the industry
could be broader if more attention was brought to the subject. The need to comprehend phenomena
such as segregation is mandatory to take this technology to an industrial-application level. New paths
are opened by such devices, namely the fluidization of Geldart A- and C-type particles, which importance
and use in the chemical industry is quickly growing. The development of pragmatical tools, that can be
used in a daily basis, such as a graphical fluidization classification under centrifugal fields, would bring
a first impression on the system and therefore, a quick understanding of the fluidization behavior that
can be expected from a certain particle.
30
3. A Mathematical Model – Critical Particle Diameter As explained in the previous chapters, the design aspects of a GSVR greatly influence the
possible operating conditions associated with the unit. The swirl ratio and the dimensions of the unit
cannot be easily changed during operation. For that reason, a GSVR has the disadvantage of narrowing
the diversity of processed materials and operating conditions (e.g. the main gas flow rate). Hence, a
necessity of understanding which materials can and cannot be successfully fluidized in a certain reactor
arises. For that purpose, a mathematical model was constructed and presented in this section. Besides
the presented objective of the model, it can also be employed in a more preliminary stage of the setup,
namely during its design and construction. If a certain set of materials are to be studied, with a particular
particle diameter and density, a unit can be built to match the desired operating conditions. The model
will give a preliminary idea of what is possible to process in a certain unit, without experimental trials.
3.1. Fundamentals
This model was applied to three different materials – aluminium (ρAluminium= 2700 kg.m-3),
alumina (ρAlumina= 4000 kg.m-3) and high density polyethylene (HDPE; ρHDPE= 950 kg.m-3) – and two
different setup configurations – with swirl ratios of 30.94 and 27.27 – and it is based on a force balance
made to a fluidized particle inside of a GSVR. This model strives to find the smallest particle diameter,
of a certain material, that can be retained inside a certain GSVR, with a specific swirl ratio and
dimensions. Henceforth, that variable will be called the critical particle diameter.
The critical particle diameter is the diameter that emerges from the balancing of centrifugal to
drag force at a given radial position in a GSVR. Particles smaller in size than the critical diameter will be
entrained from the specific radial position as the drag force will surpass centrifugal. As it was mentioned
in the previous chapters, there are three main forces acting on a particle which is rotating in a GSVR:
gravity, centrifugal – equation (3) – and drag force – equation (4). Gravity effects are assumed to be
invalid for the present study (considering a vortex unit with a vertical central axis and placed
horizontally). Hence, the force balance takes only into account drag (Fd) and centrifugal (Fc) forces, as
presented below. As a rule of thumb, centrifugal force is believed to be the stabilizing one and drag to
be destabilizing force for a vortex unit.
Fc = mp
vs,θ2
r (3)
Fd =1
2ρgApCdu2 (4)
Where mp is the mass of a single particle, vs,θ is the azimuthal solid velocity, r is the radial position
inside the chamber, ρg is the density of the gas, Ap is the cross-section area of the particle, Cd is the
drag coefficient and u is the gas radial velocity.
Balancing both forces, three possible scenarios arise. In an ideal situation, drag and centrifugal
forces will assume the same value, which results that the particle will keep a certain radial position inside
of the chamber. However, during the operation of the GSVR, two more cases can happen. If the drag
force exceeds the centrifugal force, the radial position of the particle will decrease and consequently,
the particle will get entrained. If the centrifugal force exceeds the drag force, the particle will assume a

31
larger radial position. Hence, for a particle to stay inside of the reactor, the centrifugal force should be
equal or higher than the drag force. That situation implies a minimum particle diameter, which is called
the critical diameter since it is the smallest diameter a particle can assume in order to stay inside of the
reactor. Equaling the drag and the centrifugal force and isolating the particle diameter in one member
of the equation, equation (5) is obtained.
Dcut =
3
4Cd
ρg
ρp (
vg,r
vs,θ)
2
r (5)
Equation (5) is the core of the presented model. Knowing every variable in its right side, one
can calculate the critical diameter for a set of material-reactor pair. This equation gathers characteristics
of both. ρp and vs,θ are linked with the material itself, while ρg, r and vg,r are related with the setup
configuration. Cd is a variable which gathers the influence of both. A description on how to determine
each parameter will follow.
Cd is the drag coefficient which depends on the flow regime, and therefore on the Reynolds
number. In this context, the Reynolds number is modified for the particle Reynolds number – equation
(7). There are several correlations for determining Cd, which criterion of use is usually a range of the
Reynolds number, and the chosen one is presented in equation (6)63. Similar approach was used by the
works of De Weber et al45 in their study of segregation in a GSVR.
Cd =24
Rep+
2.6 (Rep
5)
1 + (Rep
5)
1.52 +0.411 (
Rep
263000)-7.94
1 + (Rep
263000)-8 +
0.25 (Rep
106)
1 + (Rep
106)
, 0.1 < Rep < 106 (6)
Rep =ρgdpvg,r
μg (7)
There were other correlations that could have been used in this case, but this was the one with
more information available on the literature and the only one applied in the same context, by Weber et
al45 . Some other correlations were applied but the outcoming results converged for a trivial solution –
particle diameters tending to zero and were hence ignored.
The velocities present in equation (5) – vg,r is calculated from equation (8) – while the vs,θ values
are taken from PIV trials reported by Gonzalez-Quiroga et al.64 done with Aluminium particles with 500
μm. Because the reported azimuthal solid velocities are local ones, and not averaged, it was decided
that the values should be approximated using a linear regression. Thus, the outcoming results will be
an average of all the particle diameters found at a certain radial position in the chamber.
vg,r =G
2πrL (8)
The setup used by the work of Gonzalez-Quiroga et al.64 is different from the one depicted in
chapter 2. Table 1 is presented with all the relevant information about that setup.
32
Table 1. Dimensions of the setup used for the PIV trials reported by Gonzalez-Quiroga et al.65 Variable Value
Radius chamber 80 mm
Height chamber 15 mm
IN 8
I0 1 mm
α 10º
Swirl Ratio 30.94
Exhaust Diameter 40 mm
Since Cd also depends on the particle diameter, the presented equation cannot be simply
solved. Therefore, an iterative process was employed to determine the critical diameter for each case.
First, a particle diameter was chosen for each evaluated material. For aluminium, the initial value is the
same as the used by Gonzalez-Quiroga et al.64. For alumina, the value chosen was 600 μm, a typical
particle size. Then the particle Reynolds – equation (7) – and the drag coefficient – equation (6) – were
calculated with that value. Finally, a new particle diameter was calculated using equation (5). The
procedure was repeated for several gas flow rates, radial positions and materials. The results are shown
in the next figures – Figure 9 and Figure 10. Since it is an iterative process, it must have a stop criterion.
For both materials, it was decided that the iterations could be stopped when, for two consecutive
calculations, the outcoming particle diameters differ in 5 μm or less.
Figure 9. Critical aluminium diameter along the chamber for several gas flow rates.
The data in Figure 9 can be interpreted as follows: the minimum aluminium particle diameter
that can be retained inside a reactor with the same characteristics and using 35 Nm3.h-1 of air is
approximately 70 μm. And if the largest bed formed by aluminium particles that can be retained is 4.5
mm, then the smallest particle diameter that is possible to retain in the bed, under the same air flow rate,
is approximately 170 μm.

33
To apply the same method to other materials, an assumption has to be made. For alumina, a
momentum balance is necessary, since there is no data available regarding the azimuthal velocities of
such materials in a GSVR. The momentum transfer from the gas phase to the solid phase in a GSVR
depends on the swirl ratio, the main gas flow rate and the gas properties. Thus, maintaining such
conditions, e.g. using the same reactor, the same gas phase, and the same gas flow rate, the momentum
balance associated to the solid phase can be described by equation (9).
(vs,θmp)Aluminium = (vs,θmp)material (8)
Since the properties (density and size) of the particle are known, it is possible to calculate the
azimuthal solids’ velocity of that material and therefore determine the critical particle diameter for each
radial position and gas flow rate – Figure 10.
The momentum balance described in equation (8) is not valid for all materials. When the
compared materials differ in terms of fluidization classification under centrifugal forces, then equation
(8) cannot be applied. What is known is that the momentum transferred by the gas is always the same,
since the air properties and the gas flow rate used remain unaltered. But each material receives that
momentum in a different way, which is thought to be correlated to its fluidization patterns and behavior.
That momentum can be converted into azimuthal velocity (remark that in a GSVR, it is assumed that
the solid phase does not have radial velocity) or it can be lost through friction – mainly between the
particle and the circumferential walls).
Figure 10. Critical alumina diameter along the chamber for several gas flow rates.
Figure 10 can be analyzed in the same way as Figure 9. If the unit is empty and a flow of 35
Nm3.h-1 of air is fed to the chamber, an alumina particle with 160 μm is the estimated minimum particle
size that can be retained in the reactor. As the operator feds more particles, a fluidized bed starts to
form and to expand. If the maximum bed length that is possible to achieve in this reactor and using the

34
same air flow rate has approximately 5 mm, the biggest alumina particle that can be kept inside is
estimated to have around 450 μm.
Comparing both materials, alumina presents values for the critical diameter larger than
aluminium. That difference has mainly to do with the difference of densities between the two materials.
The denser the material, the heavier the particles (while keeping the size unaltered) and harder is to
keep them inside of the chamber. A heavier particle will have a higher mass, and, for that reason, it
would be expected for that particle to sense a stronger centrifugal force. But the azimuthal solid velocity
will decrease for denser particles23. And since that variable is squared, it influences more the outcoming
value for the centrifugal force then the mass of the particle, which is only directly proportional. Therefore,
the centrifugal force will not increase, but decrease, causing the particles to assume a smaller radial
position, being closer to the exhaust and therefore, more likely to be entrained from the chamber. To
balance that drop on the azimuthal solid velocity, the particle must assume a higher size, which results
in higher mass but also higher projected area, increasing the drag force. The whole set of reasons
explained in this paragraph justifies why a denser particle has to be bigger in size to be able to stay
inside a GSVR. Besides density, there are other variables that have an impact on the resulting critical
particle diameter. Therefore, a sensitivity analysis is performed and presented in Figure 11.
3.2. Evaluation of the Model
The developed model was depicted in the last pages and its results applied to two different
materials shown. After that, the model should be evaluated, in terms of its robustness. For that purpose,
a sensitivity analysis was performed to the main variables which affect the critical diameter – the
azimuthal solid velocity, the radial gas velocity, the particle Reynolds and the drag coefficient. The
sensitivity analysis was performed only to one material. Although the method was based on
experimental PIV data, the opportunity to apply the model to a new set of conditions arose. This is a
way to assess the range of conditions where the model can be applied.
Figure 11. Sensitivity analysis on the particle diameter.

35
A sensitivity analysis was performed for aluminium – Figure 11 – , choosing one radial position
– 0,0345 m – and one gas flow rate – 35 Nm3.h-1 – in order to evaluate which parameter influences
greatly the critical diameter. For that purpose, positive and negative changes were done in the variables
present in equation (5) and the outcoming results compared with the initial scenario. Using such process,
it is possible to conclude that the particle Reynolds does not influence significantly the particle diameter
(the changes induced by modifying the variable on the evaluated range are always smaller than 10%),
while the azimuthal solid velocity has a greater influence on the particle diameter, in the studied range
– a change of -10% on this variable causes the particle diameter to increase in more than 20%.
Figure 12. Resulting trends for the Dcut along the bed by using the model with different approximations for the initial value of particle diameter.
Besides evaluating the effect of several variables on the outcoming particle diameter by doing
a sensitivity analysis, as described in the last paragraph, the influence of the initial approximation which
initiates the iterative method was also studied. For that purpose, the developed mathematical method
was applied to three different initial set of conditions. HDPE particles with several sizes are fed to a
GSVR, and the azimuthal velocities of the particles are calculated using PIV data – Figure 13. According
to the preformed sensitivity analysis, this parameter plays an important role in the accuracy of the critical
particle diameter. Using the data obtained by Kovacevic et al., a second point of view on the sensibility
of the model is given.

36
Figure 13. Azimuthal velocities along the bed for several particle sizes23.
Using the data presented in Figure 13, which was processed by an online tool –
WebPlotDigitizer – the model was applied to the three different set of conditions. Each described set will
be the starting point of the iterative method. For a matter of congruence, the azimuthal solid velocities
collected from Figure 13 were linearized and the outcoming values used to calculate the critical
diameters. Taking into account that only the density of the material has a direct influence on the
outcoming result, as it is directly proportional to the drag force, applying the iterative method to the three
presented cases should result in similar final values for the critical diameter, for all the radial positions
evaluated
If the reader gives a closer look to Figure 12, will see that is not the case. The resulting curves
for each initial approximation are considerably different, predicting critical diameters which differ in more
than 150 μm for r=0.21 m. The larger the initial approximation for the critical diameter, the larger the
predicted Dcut. The difference between the curves gets smaller as the radial position increases, e.g. the
particle gets further from the exhaust. For the largest radial position, the results given by the method
differ in approximately 50 μm. All the curves appear to converge to the same value, which will be the
minimum diameter that an HDPE particle can have to be fluidized in an empty GSVR.
Another aspect worth to be mentioned is that the measured azimuthal velocities presented by
Kovacevic et al. are not for the same range of radial positions. The smaller the particles, the larger gets
that range, which is nothing less than the height of the fluidized bed and a portion of the freeboard
region.
3.3. Limitations
While evaluating the robustness of the mathematical model, the reader can already perceive
that its range of applications is limited, mainly for mathematical reasons, as it is expressed by the
sensitivity analysis and the application of the method to an experimental set of values.
The main reason for the results given by the sensitivity analysis is that the model is developed
based in only one set of conditions, obtained in one setup with a constant swirl ratio, for a specific
37
material and a certain range of gas flow rates. For it to have a broader range of applications, it was
necessary to base the method in more experimental values, retrieved from several setups and fluidizing
different materials with different sizes. During the next paragraphs, several limitations associated with
the model will be depicted.
The model was developed using only Excel, which has a limited capacity when it comes to
iterative processes. There were some mathematical problems with convergence, since the model
tended to converge to a trivial solution. During each iteration, a new air of values for the particle Reynolds
and the particle diameter where calculated. As the iterations continued, the particle diameter would
converge to zero and the particle Reynolds would increase to extreme high values, e.g. converge to
infinite.
An attempt to overcome the convergence problem was to find more correlations for the drag
coefficient. A total of 5 correlations – Table 2 where tested but only one gave results which converged
for satisfactory values. That correlation was already reportedly used for a similar work (Weber et al.)
although its performance for predicting drag coefficients in GSVR’s is not yet tested. One of the five
correlations used was created especially for GSVR’s66 , but it was concluded that this correlation was
not suitable for this mathematical model. This correlation depended on different variables. A new
definition for the Reynolds number is used, which is called radial particle Reynolds number, Rep,R. This
is a more accurate way to define the Reynolds number in a GSVR. Besides this variable, the bed porosity
and the swirl ratio integrated the expression too. When this correlation was applied to the system in
study, the resulting particle Reynolds numbers were too small when compared with the ones present by
Friedle et al66. In Table 2, all the correlations that were tested are presented. For that reason, that
correlation was discarded.
Table 2. Set of correlations tested. The marked correlation was the one used.
Reference Expression
Stokes’ Law 24
Re
Ergun 150(1-ε)2
ε2
μf
dp2
+ 1.75 (1-ε)
ε
ρf
dp(ui-ν)
Rowe and Henwood67 24
Re (1 + 0.15Rep
0.687)
Friedle et al.66 (15 ± 4.65)ε2Rep,R-0.28±0.05S0.76±0.03
Morrison, F. A.63 24
Rep+
2.6 (Rep
5 )
1 + (Rep
5 )1.52 +
0.411 (Rep
263000)-7.94
1 + (Rep
263000)-8 +
0.25 (Rep
106)
1 + (Rep
106 )
Another aspect to account is that since the model is based on aluminium azimuthal velocities it
can only be extrapolated for materials which centrifugal fluidization classification is the same as
aluminium. Otherwise, the momentum balance stated in equation (8) can no longer be valid, since the
fluidization mechanisms are also different. Thus, the model can only be applied to other materials if 1)

38
they have the same centrifugal fluidization classification or 2) when there is available data, namely radial
positions vs. azimuthal solid velocities for a certain particle size of such material.
There are some approximations done between iterations. The azimuthal solid velocities should
change between each iteration, since a new step on the iterative process leads to a new particle size.
Something else that also changes with the particle size is the bed height that should be evaluated. As
the particle decreases in size, the bed height expands radially inwards (the centrifugal force will
decrease for a smaller particle because its mass will also decrease). This approximation is supported
by Weber et al., who presented the same reasoning but contradicted by Kovacevic et al., whose results
show a significant difference between the azimuthal solid velocities of particles with different velocities
from the same material. As we change the size of the particles, the solid volume fraction also changes,
as shown in Figure 29. This change will produce a variation of the bed height, which is also not
accounted in the model.
The model was designed to a specific reactor, with a certain swirl ratio (the geometry of the
reactor was kept constant during all the trials), since all the experimental data was retrieved from the
same setup, the one described in Table 1. Applying the model to other GSVR can lead to erroneous
results. The same problem exists when it comes to the valid range of gas flow rates.
Lastly, the preformed force balance was done to a single particle. Interactions between particles
or particle-wall were not accounted, nor its effects. Although the entire bed height has been accounted,
the existence of more particles (which are the reason why the bed grows inwards radially) are not taken
into account. This approximation can influence the drag coefficient, which is probably underestimated.
3.4. Conclusions
The modeling work developed under the scope of this master thesis resulted in a successful
mathematical model which can preliminarily estimate the minimum particle diameter of a certain material
that can be fluidized in an empty GSVR. The method has several limitations, but it can safely be
extended to materials which have the same fluidization behavior as aluminium, under centrifugal forces.
This model can be used for designing purposes and for studying theoretically which materials
of which size can be processed in an already existing unit. For achieving accurate results, a great
quantity of data, namely azimuthal solid velocities, should be given to the model. This variable is the
one that most influence the accuracy of the critical particle diameters. This model gets the scientific
community one step further to comprehend the hydrodynamics of the GSVR.

39
4. Vortex Setup Description and Experimental Methods
The vortex setup consists of 3 sections: the gas-solid feed section, the Gas Solid Vortex Unit
(GSVU) section and the downstream section, as identified in Figure 14.
Figure 14. Schematic view of the vortex setup, highlighting three sections and key elements within each of
them.
4.1. Gas-Solid Feed Section
Gas (compressed air for the present study) is supplied to the unit via a compressor (Atlas Copco,
GA90VSD, with a maximum working pressure of 13 bar (g)), at a pressure of 4 – 5 bar (g). A thermal
mass flow controller (Bronkhorst F-106 CI series) delivers 20 – 600 Nm3 h-1 gas to the unit; for pressures
between 1 – 2 bar (g). Metered gas can be directly sent to the unit at room temperature (i.e. “Cold”
experiments) or can be heated by an electric heater. Nine internally finned tubes, with individual
temperature control, serve as the gas heater assembly. Hot/cold gas gets distributed in 8 corrugated
plastic hoses (glass fabric impregnated with silicone and exposed steel coil, maximum temperature of
260 °C). These tubes are connected to the sides of the unit to form an octagonal jacket. An image of
the gas-feed section is presented in Figure 15 (a).

40
(a) (b) Figure 15. (a) Gas-feed and (b) Solid-feed sections of the GSVU.
Solid, on the other hand, are fed to the unit via a pneumatic conveying assembly, assisted by a
minimal flow of compressed air. Solid for feeding are stored in a closed stainless steel vessel (maximum
capacity of 2 kg), with a connection for purge air flow. From the vessel, a transparent polyurethane tube
(internal diameter of 6 mm) is connected to one of the end-plates (discussed later) of the unit for feeding
particles to the unit. A solenoid valve on the feeding tube inhibits gas backflow from the unit to enter the
solid feed vessel. The purge air flow can be varied depending on the particle properties used in the
experiment. However, the purge flow is typically set to a low value (< 3%) so that the additional air flow
does not influence the behavior of main gas flow (coming from the jacket). Figure 15 (b) shows solid
feed section in brief.
4.2. GSVU Section
Gas entering the octagonal jacket gets distributed to 16 concentric vanes (Stainless Steel or
Polyamide), arranged in a circular fashion as shown in Figure 16. The openings between two successive
vanes act as slots of varying slot sizes (0.5 – 1 mm). Slot openings are angled at 2.5° w.r.t. the tangent
to the chamber. The inner edges of vanes form the unit chamber with a diameter of 139 mm. The
outflowing gas and solid exit the unit via the common central outlet. A transparent silicone pipe connects
the unit to the cyclone separator downstream. Figure 16 (b) (1) presents the top view of (vertically
downwards exhaust) unit chamber and vanes arrangement.

41
(a)
(b) Figure 16. (a) Top view of the unit chamber (inset: top view of two adjacent metallic vanes forming a slot) and
(b) schematic of the unit: (1) Top view; (2) Side View and (3) adjacent vanes forming a slot.
Two Stainless Steel end-plates are placed at an axial distance of 25 mm, forming the length of
the unit. One of the end-plates centrally holds the exhaust for both gas and solid particles. The other
plate has a multifunctional design consisting of 4 quadrants. One of the quadrants holds the pressure
sensors assembly used to measure solid bed pressure at various radial positions, as shown in One
absolute pressure sensor, located at the outermost radial position (r=69 mm), is used as the reference.
Based on this reference value, differential pressures at nine (9) other locations towards the exhaust can
be measured and recorded. These differential sensors are positioned at radial positions 3 mm apart
(between r=66 mm to r=42 mm). A second quadrant holds the solid inlet tube. The inlet connection is
positioned at a 45° angle w.r.t. the end plate for an easy feeding to the unit. The tube is angled along
the solid flow direction inside the unit. The inlet line holds a converging Teflon insert with a 3-4 mm
opening in the chamber. The insert assists solid feeding to the unit, at the same time acting as a non-
return valve and avoiding the backflow of main gas into the solid feeding line. The solid feeding port is
42
located at a radius of 62 mm. The remaining two quadrants can be used for providing visual access to
the unit internals. Makrolon® (for room temperature experiments) and Pyrex or Zinc Selenide (for high
temperature experiments) plates are used for the visualization purpose. These transparent plates can
be used to measure radial bed height or the solid velocities using Particle Image Velocimetry (PIV).
Owing to the mechanical abrasion due to high shear and recurrent contact with particles, these plates
need to be regenerated or replaced frequently. All the quadrants have a modular design and can be
interchanged independent of each other as the application demands. The unit also has flexibility in
orientation and can be operated in two modes: (1) exhaust aligned with gravity and (2) exhaust against
gravity. Both these modes have their advantages and shortcomings, which will be discussed later in this
chapter.
4.3. Downstream Section
Solid entrained with the exiting gas are introduced to a cyclone separator installed downstream
the unit, as presented in Figure 18. Separated solid are recovered at the bottom of the cyclone, while
gas is vented off. An air-actuated double-valve assembly at the bottom of the cyclone separator allows
solid recovery during operation, without any pressure or flow disturbances in the unit.
Figure 17. Unit end-wall assembly.
Valves opening-closing, flow, temperature, etc. can be set and operated using the Siemens
operating software (control system). All sensor values are logged at a frequency of 10 Hz and stored in
.csv files and can be used for further post processing.
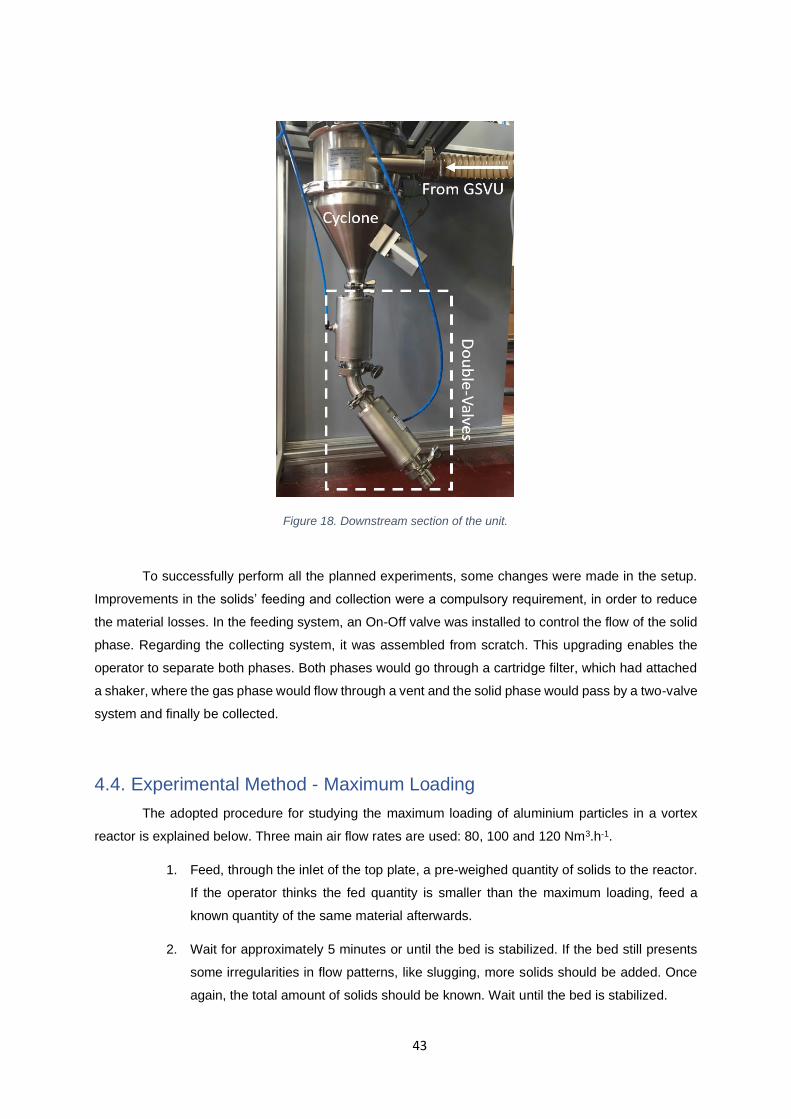
43
Figure 18. Downstream section of the unit.
To successfully perform all the planned experiments, some changes were made in the setup.
Improvements in the solids’ feeding and collection were a compulsory requirement, in order to reduce
the material losses. In the feeding system, an On-Off valve was installed to control the flow of the solid
phase. Regarding the collecting system, it was assembled from scratch. This upgrading enables the
operator to separate both phases. Both phases would go through a cartridge filter, which had attached
a shaker, where the gas phase would flow through a vent and the solid phase would pass by a two-valve
system and finally be collected.
4.4. Experimental Method - Maximum Loading
The adopted procedure for studying the maximum loading of aluminium particles in a vortex
reactor is explained below. Three main air flow rates are used: 80, 100 and 120 Nm3.h-1.
1. Feed, through the inlet of the top plate, a pre-weighed quantity of solids to the reactor.
If the operator thinks the fed quantity is smaller than the maximum loading, feed a
known quantity of the same material afterwards.
2. Wait for approximately 5 minutes or until the bed is stabilized. If the bed still presents
some irregularities in flow patterns, like slugging, more solids should be added. Once
again, the total amount of solids should be known. Wait until the bed is stabilized.

44
3. Collect the solids present in the collecting box, placed underneath the exhaust. That
quantity is named as the ‘entrained quantity’. Weight that quantity for mass balance
closure. This step should only be performed if a significant amount of solids is present
in the collecting box. Otherwise, repeat step 1.
4. Clean the solids inside of the reactor. Turn the gas flow rate to a lower value to take all
the solids out of the reactor. If any solids remain, drag those particles through the
exhaust using compressed air.
5. Collect the solids in the collecting box. That quantity is named as the ‘maximum loading’
for a certain material and for a certain air flow rate.
6. Repeat the procedure three times or until concordant values are achieved to assure
accuracy and to obtain averaged values and corresponding standard deviations.
4.5. Experimental Method - Particle Segregation/Mixing
To study this phenomenon, aluminium and alumina particles of different sizes (0.7-1mm
diameter), were used. Mixtures of two different sizes and several compositions (0, 25, 50, 75 and 100%
of a certain size) were fed to the reactor. The total mass of the mixtures is always kept at 100 grams.
Three main air flow rates are used: 80, 100 and 120 Nm3.h-1 and the purge air was kept at 500 mbar.
Next, the adopted procedure is depicted.
1. Feed a known mixture (e.g. the composition and the used particle sizes) to the feeder.
2. Turn on the purge air to pressurize the solids feed vessel.
3. Open the valve downstream the feeder. The solids will leave the feeder, pass the
connecting tube and enter the reactor. From this moment, wait for 5 minutes, so a stable
bed is achieved. Tap the inlet of the top plate to help the solids to enter (in case the
feeding tube gets blocked). Shake the feeder to assure that all the solids are fed to the
reactor. During the waiting time of 5 minutes, three measurements of the bed height
were taken. The pressure sensors along the bed should be on from this moment and
until the end of the trial.
4. When the bed is visibly stabilized, turn the shaker on, close the top valve and open the
bottom one, collecting the solids that were entrained in a cup. Once the collection is
finished, turn the shaker off, open the top valve and close the bottom one. This
arrangement ensures collection of entrained solids without the need of stopping the
main gas flow via the reactor.
5. Sieve the entrained quantity to separate particles from different sizes. Weight each
fraction.
45
6. Reduce the gas flow rate to a minimum, causing the remaining solids to leave the
reactor. Some solids can stay inside. To remove those, insert the compressed air gun
at the inlet of the top plate and press it until there are no particles in the chamber.
7. To collect possible solids in the tube between the reactor and the cyclone, turn the air
flow rate to its initial value.
8. Once again, turn the shaker on, close the top valve and open the bottom one. Collect
the ‘retained solids’ in a cup.
9. Sieve the retained quantity to separate particles from different sizes. Weight each
fraction.

46
5. Experimental Results and Discussion
5.1. Maximum Loading
Experiments have been done to understand the influence of the position of the exhaust in the
hydrodynamics of the setup. Results were compared with the work reported in another thesis11. During
the work, the unit was assembled in such a way that the exhaust was positioned against gravity. In the
present case, the setup was rotated such that the exhaust was aligned with gravity (facing vertically
downwards). The maximum loading was evaluated for the new exhaust configuration at three different
flow rates of the common fluidizing agent, i.e. compressed air: 80, 100 and 120 Nm3.h-1. The purge air
required to push the solids into a developed a gas flow in the unit was kept at a constant value of 600
mbar pressure and contributes to a negligible fraction of the main gas flow All the trials were performed
at room temperature and using non-porous spherical particles of Alumina (ρAlumina=4000 kg.m-3, dp=0.7-
0.8 mm) as solid phase.
The results of such experiments are presented in Figure 19 and compared with the results of
the experiments done with the exhaust assembled against gravity.
Figure 19. Maximum loading of Alumina (0.7 – 0.8 mm) for several air flow rates. Blue: Average data points and error bars for the exhaust orientated with gravity. Red: Average data points for the exhaust orientated
against gravity.
The maximum loading can be defined, for a given flow rate, as the mass of solids in the
bed/reactor beyond which there will be particles leaving through the exhaust. During experiments, some
patterns were noted. For all the experiment conditions, there were always solids in the freeboard region,
arranged in the shape of a vortex. The solids that reach that region will certainly leave the reactor at
some point. The effect of gravity also obeys to a pattern: for lower airflow rates, both the centrifugal and
the drag force are smaller, but gravity does not change. Consequently, it is observed a thicker bed in
lower axial positions, since the particles are being pushed down. For higher air flow rates, this effect is
much less visible. We concluded that at any air flow rate, the bed would stabilize in, approximately, 5
47
minutes. For higher flow rates, the bed also presents itself as thinner and uniform. Since the solids are
fed through a unique inlet at the top plate, the portion of the bed that is on the same direction is always
thicker than the rest of it. This effect is more visible for lower gas flow rates, being almost irrelevant
when higher gas flow rates are used.
Observing the results from both experiments, it is clear that the higher maximum loading is
achieved for the previously studied configuration. In the current arrangement, the particles are pulled
through the exhaust because of gravity. It is observed that even minor changes to solids rotating closer
to the exhaust, brought about by either collisions or miniscule changes to the gas flow rate, the particle
tend to leave via exhaust, under added influence of gravity. This effect does not happen in the previous
configuration once the exhaust is against gravity. When the exhaust is oriented vertically downward,
gravity effects start to dominate in the freeboard zone as well as in the backflow zone. As a
consequence, the presence of freely rotating particles in the freeboard are no longer observed in this
mode of operation. The lack of loosely rotating particles in the unit suggests that all solid are
accommodated in the bed, unlike in the previous mode. Furthermore, deposition of particles on the
bottom plate is not possible due to strong gravitational effects on heavy particles such as Alumina. As a
combined effect of both, the maximum solid loadings are substantially lowered when operating with an
exhaust aligned with gravity. With all other operating conditions being unchanged, roughly half the
amounts of solid can be retained in the configuration with downwards exhaust. Smaller error bars on
the solid loadings across all the flow rates is also resultant from the lack of solid lingering on the bottom
plate, as opposed to the previous configuration.
The experiments presented in Figure 19 demonstrate the flexibility of the setup in terms of
various operating modes, ease of feeding and recovering solids (in accurate fashion, for quantification
purposes) and stable operation over long time periods. It also shows that for achieving a larger solid
loading, the studied unit should be orientated with the exhaust against gravity.
5.2. Particle Segregation/Mixing
As explained in the first chapter of this thesis, particle segregation is a characteristic of vortex
reactors. Particles with different mass, due to diameter or density, will have different radial positions
inside of the chamber, since they have different values of centrifugal and drag forces. Hence, in a GSVR,
the probability of particle entrainment will be higher for particles which radial position is smaller, e.g.
closer to the exhaust. Therefore, lighter particles are more likely to leave the reactor, in opposite to
heavier particles. To study this phenomenon, the composition of the bed was examined by analyzing
the entrained and retained quantities and their composition. During operation, some characteristics of
the bed were also studied, such as the bed height and the pressure drop across the entire reactor.
Those measurements were an attempt to gather more information related with the system.
A lot of information can be retrieved from such experiments. With data coming only from the
weights of both fractions, only qualitative appreciations can be made. In the following pages, plots which

48
were considered to be relevant are present and depicted. Some qualitative relations are extracted from
those figures.
Two types of mixtures with different materials were prepared. The first contained only alumina
particles in two different sizes, 0.7-0.8 mm and 1 mm. By doing experiments with such mixture, the
influence of size in the particle mass, the driving force for particle segregation in a GSVR, was to be
evaluated. The second mixture was composed by two different materials, alumina and aluminium, with
1 mm and 0.7 mm particles, respectively. This time, the combined effects of changing density and size
in the solid phase were evaluated. The effect of density was coupled with the effect of size because of
practical reasons. The particles available at the time of the experiments were not easily separable by
magnetism (neither alumina or aluminium have magnetic properties) or density (for example, using a
liquid or a solution which density was in between the density of both materials). Therefore, the effects
of both properties were not studied apart. Although, this second set of experiments was designed in
order to change only the density of the small particles, since the size and density of the larger particles
is the same as the one used before. For that reason, it is acceptable to suppose that the changes
observed in these experiments are mainly due to effects of density.
Both mixtures were processed using a common procedure, already described in the beginning
of the chapter. Firstly, graphs which can be compared are presented, side by side, to ease the
comparison. For all the experiments, F1 refers to larger fraction (i.e. 1 mm Alumina particles). F1/F2
refers to the mass ratio of larger to the smaller particles (in bed).
(a) (b)
Figure 20. Ratio between (a) 1 mm and 0.7-0.8 mm alumina particles retained in the bed for several gas flow rates; (b) 1 mm alumina particles and 0.7 mm aluminium particles retained in the bed for several gas flow rates. The indicated percentages are reported with respect to 1 mm alumina particles in the initial mixture.
(colored areas represent respective error region)
According to Figure 20 (a), for the same gas flow rate, the ratio F1/F2 in the bed suffers great
changes when the initial mixture composition is changed. But for the same initial composition, that
parameter does not present significant changes when subjected to different gas flow rates. Therefore,
the initial composition of the fed mixture plays an important role in the matter of the composition of the
fraction retained in the reactor. When the amount of larger particles fed increases, the studied ratio
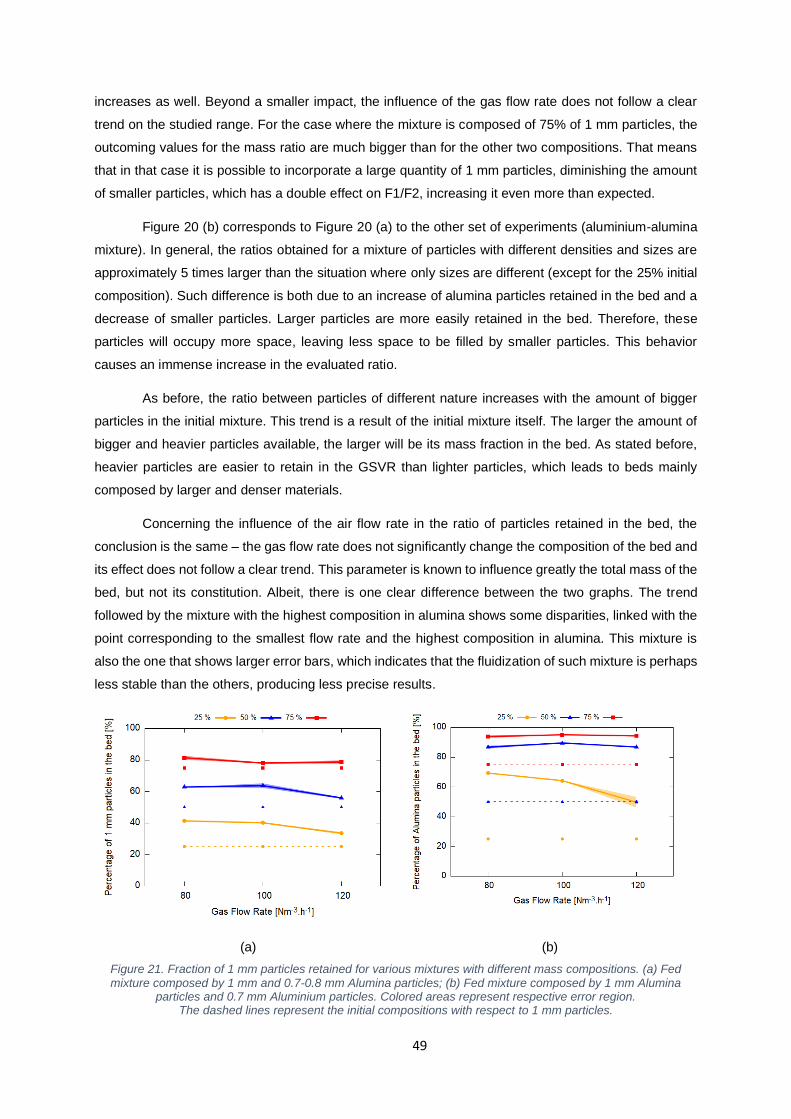
49
increases as well. Beyond a smaller impact, the influence of the gas flow rate does not follow a clear
trend on the studied range. For the case where the mixture is composed of 75% of 1 mm particles, the
outcoming values for the mass ratio are much bigger than for the other two compositions. That means
that in that case it is possible to incorporate a large quantity of 1 mm particles, diminishing the amount
of smaller particles, which has a double effect on F1/F2, increasing it even more than expected.
Figure 20 (b) corresponds to Figure 20 (a) to the other set of experiments (aluminium-alumina
mixture). In general, the ratios obtained for a mixture of particles with different densities and sizes are
approximately 5 times larger than the situation where only sizes are different (except for the 25% initial
composition). Such difference is both due to an increase of alumina particles retained in the bed and a
decrease of smaller particles. Larger particles are more easily retained in the bed. Therefore, these
particles will occupy more space, leaving less space to be filled by smaller particles. This behavior
causes an immense increase in the evaluated ratio.
As before, the ratio between particles of different nature increases with the amount of bigger
particles in the initial mixture. This trend is a result of the initial mixture itself. The larger the amount of
bigger and heavier particles available, the larger will be its mass fraction in the bed. As stated before,
heavier particles are easier to retain in the GSVR than lighter particles, which leads to beds mainly
composed by larger and denser materials.
Concerning the influence of the air flow rate in the ratio of particles retained in the bed, the
conclusion is the same – the gas flow rate does not significantly change the composition of the bed and
its effect does not follow a clear trend. This parameter is known to influence greatly the total mass of the
bed, but not its constitution. Albeit, there is one clear difference between the two graphs. The trend
followed by the mixture with the highest composition in alumina shows some disparities, linked with the
point corresponding to the smallest flow rate and the highest composition in alumina. This mixture is
also the one that shows larger error bars, which indicates that the fluidization of such mixture is perhaps
less stable than the others, producing less precise results.
(a) (b)
Figure 21. Fraction of 1 mm particles retained for various mixtures with different mass compositions. (a) Fed mixture composed by 1 mm and 0.7-0.8 mm Alumina particles; (b) Fed mixture composed by 1 mm Alumina
particles and 0.7 mm Aluminium particles. Colored areas represent respective error region. The dashed lines represent the initial compositions with respect to 1 mm particles.

50
Observing Figure 21 (a), the main gas flow rate does not appear to greatly influence the fraction
of 1 mm particles retained, e.g. in the bed. However, the composition of the fed mixture has a higher
impact on the same variable. Another aspect worth to be mentioned is that for higher main gas flow
rates, the solid volume fraction in the bed gets similar to the solid volume fraction of the initial mixture.
The composition of the fed mixture (dashed lines) and the composition of the mixture that remained in
the reactor (full lines) do not differ much. Thus, in this case, the driving force for particle segregation to
happen is not strong enough. For this reason, the bed becomes a mixture of both types of particles.
Contrary of what is concluded from Figure 21 (a), in the results shown in Figure 21 (b) the main
gas flow rate only influence the fraction of Alumina particles retained for a mixture with 25% of alumina.
In this case, it is possible to understand that the percentage of alumina in the bed largely exceeds the
amount that was initially present in the feeding vessel. Such results support the conclusions retrieved
from the previous plots – alumina, being larger and denser, prevents aluminium from staying inside the
chamber. Therefore, the bed will be mainly composed by alumina particles instead of aluminium. Only
in the case where the initial amount of alumina is smaller the composition of the fluidized bed goes under
80%. Remark that although the initial compositions are expressed in percentage, the mass value would
be the same, since the mixtures fed to the reactor always weighted 100 grams.
By comparing the composition of the mixture fed and the composition of the mixture that
composes the bed, the evidence that particle segregation happens in a GSVR is undeniable. The most
extreme case is for the initial composition of 25% fluidized with 80 Nm3.h-1 of air. The resulting bed is
composed by 70% of alumina, which represents an increase of more than 100% in terms of mass
composition. It is clear that this technology has the capacity of segregate particles with different masses.
It is also important to remark that this is the most extreme case analyzed in this work. in these
circumstances, particles differ both in size and density, which creates a significant difference in terms
of mass of each particle. Besides a percentual analysis, the results are also displayed in mass quantity
– Figure 22, so that the reader has a clear perception of the real capacity and potential of the setup.
(a) (b) Figure 22. Composition of the bed in grams for each air flow rate and initial fed mixture. (a) Mixture of alumina
of different sizes. (b) Mixture of alumina and aluminium of different sizes.

51
Figure 22 (a) and (b) have represented a lot of information, which should be carefully analyzed.
As mentioned before, the total mass fed to the reactor was always kept constant, at 100 grams, which
corresponds to 100%. Hence, the plots should be read according to that principle. If the reader wants
to know how much alumina can be fluidized in the GSVR at 80 Nm3.h-1 in a mixture of alumina and
aluminium, they should look at the initial composition of the fed mixture and correlate the points (which
can have different colors, expect for the case of a binary mixture of 50% each). The results presented
are always relative to the initial mass quantity fed from a certain material. Therefore, the red circles and
triangles, which correspond to 25 grams of a certain material, will always be found bellow the horizontal
line of 25 grams in both graphs.
As already concluded by the percentage plots presented before, when the mixture is composed
by particles with different densities and sizes, the maximum loading is larger. These new plots help to
understand that the larger the quantity of a certain material in the initial mixture, the larger is the increase
of the total mass fluidized, for an increasing air flow rate. This conclusion is clearly seen in Figure 22
(a). In Figure 22 (b), the suggested trend is less notorious, especially for smaller percentages in the
initial composition, where the total mass of the material fluidized is practically independent of the gas
flow rate.
The following graphs describe how the total amount of solid phase retained in the reactor are
affected by the gas flow rate and the composition of the fed mixture. As discussed in Chapter 3, the
maximum loading of a GSVR depends much more on the orientation of the exhaust than any other
variable. Therefore, the following data is not presented side by side, once it should not be compared
like done before. As mentioned before, the maximum loading in a GSVR varies with the composition of
the solid phase because of its properties (namely particle size and particle density).
Figure 23. Amount of retained solids for various mixtures with different mass compositions (particle sizes: 1 mm and 0.7-0.8 mm). Colored areas represent respective error region.
Analyzing the relation between the total amount of retained solids and the main gas flow rate
imposed, Figure 23 shows a clear dependency on the initial composition and the gas flow rate. Once
again, the maximum loading for a pure mixture of 1 mm particles presents itself lower than in most of

52
the studied cases. Once more, the packing theory is corroborated by experimental data, since it presents
a probable explanation for the fact that the maximum loading suffers changes for different feed mixtures.
The maximum loading is also seen to improve for higher gas flow rates. A higher amount of gas per
hour means a higher amount of momentum to be transferred to the solid phase. Therefore, the amount
of particles that the chamber can retain inside increases.
Figure 24. Amount of retained solids for various mixtures with different mass compositions The different lines represent different mass compositions w.r.t. 1 mm alumina particles. Colored areas
represent respective error region.
Comparing the trends between Figure 23 and Figure 24, both sets of mixtures present the same
behavior. As the air flow rate increases, the total amount of retained solids (regardless of their nature)
rises. As it would be expected, a mixture composed only by aluminium particles with a uniform size has
the lowest maximum loading. From the whole spectrum of analyzed particles, these are the lightest and
the smallest particles and therefore the hardest to maintain inside the unit. A bed formed by such
particles is larger in height but only because the particles are more dispersed in the radial direction. On
the other hand, a bed composed only by 1 mm alumina particles is going to be shorter in height, but
more compressed, since this material is denser and the particles bigger. Because of the characteristics
of the material, the bed itself can hold more mass than the previous case.
Another aspect to be addressed is that the maximum value for the total mass of solids retained
in the GSVR is achieved for the initial composition of 75% alumina 1 mm and 25% aluminium 0.7 mm.
It is in this situation where it is believed that the packing in the bed is more efficient, meaning that more
small particles can be retained in between the big ones. That is a possible explanation for the highest
measured values.
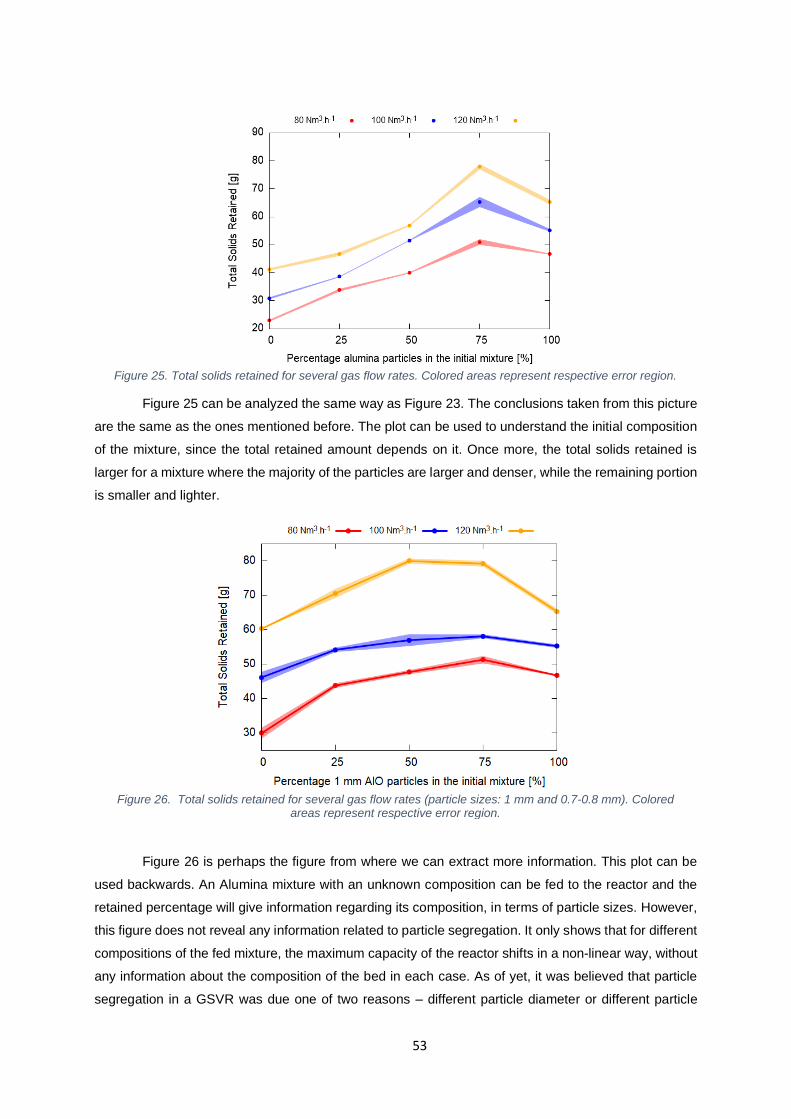
53
Figure 25. Total solids retained for several gas flow rates. Colored areas represent respective error region.
Figure 25 can be analyzed the same way as Figure 23. The conclusions taken from this picture
are the same as the ones mentioned before. The plot can be used to understand the initial composition
of the mixture, since the total retained amount depends on it. Once more, the total solids retained is
larger for a mixture where the majority of the particles are larger and denser, while the remaining portion
is smaller and lighter.
Figure 26. Total solids retained for several gas flow rates (particle sizes: 1 mm and 0.7-0.8 mm). Colored areas represent respective error region.
Figure 26 is perhaps the figure from where we can extract more information. This plot can be
used backwards. An Alumina mixture with an unknown composition can be fed to the reactor and the
retained percentage will give information regarding its composition, in terms of particle sizes. However,
this figure does not reveal any information related to particle segregation. It only shows that for different
compositions of the fed mixture, the maximum capacity of the reactor shifts in a non-linear way, without
any information about the composition of the bed in each case. As of yet, it was believed that particle
segregation in a GSVR was due one of two reasons – different particle diameter or different particle
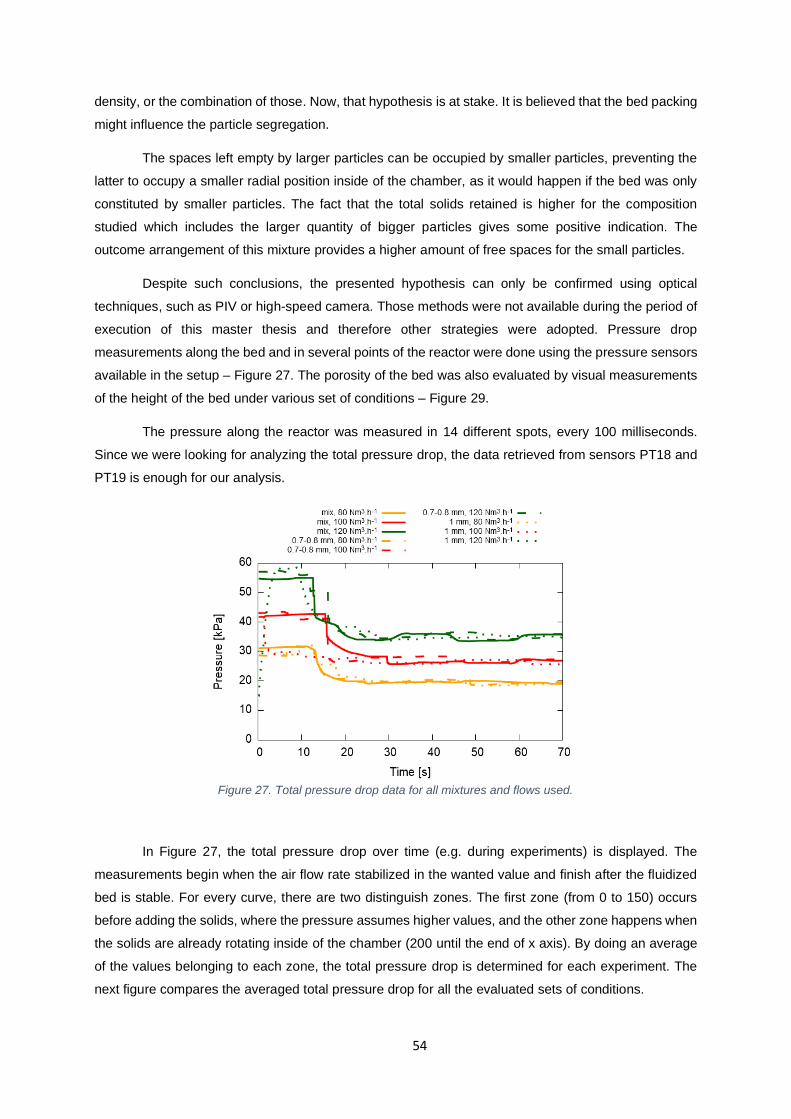
54
density, or the combination of those. Now, that hypothesis is at stake. It is believed that the bed packing
might influence the particle segregation.
The spaces left empty by larger particles can be occupied by smaller particles, preventing the
latter to occupy a smaller radial position inside of the chamber, as it would happen if the bed was only
constituted by smaller particles. The fact that the total solids retained is higher for the composition
studied which includes the larger quantity of bigger particles gives some positive indication. The
outcome arrangement of this mixture provides a higher amount of free spaces for the small particles.
Despite such conclusions, the presented hypothesis can only be confirmed using optical
techniques, such as PIV or high-speed camera. Those methods were not available during the period of
execution of this master thesis and therefore other strategies were adopted. Pressure drop
measurements along the bed and in several points of the reactor were done using the pressure sensors
available in the setup – Figure 27. The porosity of the bed was also evaluated by visual measurements
of the height of the bed under various set of conditions – Figure 29.
The pressure along the reactor was measured in 14 different spots, every 100 milliseconds.
Since we were looking for analyzing the total pressure drop, the data retrieved from sensors PT18 and
PT19 is enough for our analysis.
Figure 27. Total pressure drop data for all mixtures and flows used.
In Figure 27, the total pressure drop over time (e.g. during experiments) is displayed. The
measurements begin when the air flow rate stabilized in the wanted value and finish after the fluidized
bed is stable. For every curve, there are two distinguish zones. The first zone (from 0 to 150) occurs
before adding the solids, where the pressure assumes higher values, and the other zone happens when
the solids are already rotating inside of the chamber (200 until the end of x axis). By doing an average
of the values belonging to each zone, the total pressure drop is determined for each experiment. The
next figure compares the averaged total pressure drop for all the evaluated sets of conditions.

55
Figure 28. Total pressure drop measured and its errorbars for multiple bed compositions and gas flow rates.
The total pressure drop in a GSVR can be defined as Pinlet-Poutlet, with pressures being
measured before and after the reactor, respectively. Hence, there are two major pressure drop sites to
be accounted: the slots and the bed. Because of the reduced width of the slots and the large velocity of
the gas through those, the gas loses a lot of momentum, which is converted into a pressure drop for the
entire system 68. The bed is only responsible for a small contribution of the pressure drop. Therefore,
the results described in Figure 28 – the total pressure drop being equal for all the analyzed mixtures –
do not lead to a particular conclusion, because of the inherently smaller contribution of pressure drop
across the bed to the overall pressure drop. Initially, the hypothesis of the same total pressure drop
being related with the same packing was considered but after a careful analysis, it got compromised.
Hence, by only looking to the data displayed in Figure 28, it is not possible to conclude anything about
the degree of mixing or segregation in the bed.
Although such differences, the residence time of the gas phase does not change according to
the number of phases present inside the unit. What changes is the residence time distribution of the
gas.
Figure 29. Solid Volume Fraction in the bed under various air flow rates.

56
By analyzing Figure 29, the void fraction is influenced by with the gas flow rate and the nature
of the fed mixture. The higher the gas flow rate, the larger will be the solid volume fraction. Higher flow
rates will lead to smaller heights of the bed, which is linked to having higher maximum solid capacities
in the reactor for those cases. A higher flow rate will also carry more momentum, which can be
distributed to more particles. If those particles achieve the minimum velocity necessary to stay in the
bed, the bed will become denser, leading to lower bed lengths and higher solid volume fractions.
Although having higher maximum loadings for higher gas flow rates, the expansion of the bed has a
bigger effect on the solid volume than the extra amount of particles that can be retained in that case.
That is the reason why the solid volume fraction is higher for higher air flow rates. Being the solid volume
fraction higher for the mixture between small and large particles, one can assume that the bed is denser
in that case and therefore that the packing is more efficient.
To conclude this topic, quantitative information regarding the degree of mixing or segregation
was collected and several attempts were made to gather more information about the subject. Those
efforts were based in experimental measurements done with the available resources at that time.
Unfortunately, none of the techniques included visualization of the fluidized bed, which could be
achieved using PIV or high speed camera. Observing the bed during fluidization is crucial to understand
better this topic and to confirm some of the assumptions done in these last pages.
Although these unfortunate circumstances, there are some conclusions worth to be mentioned.
Both particle segregation and mixing, in several degrees, were observed while operating the setup.
When the driving force for particle segregation, e.g. difference in particle mass, due to different densities
and sizes, is strong enough, the composition of the entrained quantity follows a trend. Heavier particles
tend to stay inside the chamber, rotating in the fluidized bed and in the freeboard region, while lighter
particles are entrained easily, hence representing the larger portion of the entrained quantity. This
situation was observed when different materials – Alumina and Aluminium – with different sizes were
fed in a binary mixture to the unit.
When the difference between masses of both sets of particles is not big enough, the difference
in terms of composition of the entrained and retained quantities are less notorious. Although the radial
position of each set of particles is different, that difference is not strong enough to enable particle
segregation. Therefore, particle mixing in the bed is the most rightful way to describe the behavior of the
solid phase subjected to fluidization in a GSVR, in the range of gas flow rate studied. To corroborate
this hypothesis, some positive indications were found during this study. The smaller void fraction of the
bed when particles of different sizes are present indicates a changing in the arrangement of the bed.
Such measurement can be correlated with a more efficient packing. Once more, the reader should be
reminded that there was no visual confirmation of the packing. This conclusion is merely a way to justify
the obtained results.
All the results and conclusions presented in this chapter are in agreement with a published
article in the same matter45. Weber et al. present several sets of experiments where different materials,
with different sizes, are fed to a GSVR and the segregation and mixing degrees are evaluated. That

57
evaluation accounts with visual technique, namely PIV, but only for the case where segregation occurs.
The conclusions retrieved from that work are similar to the ones already mentioned before.
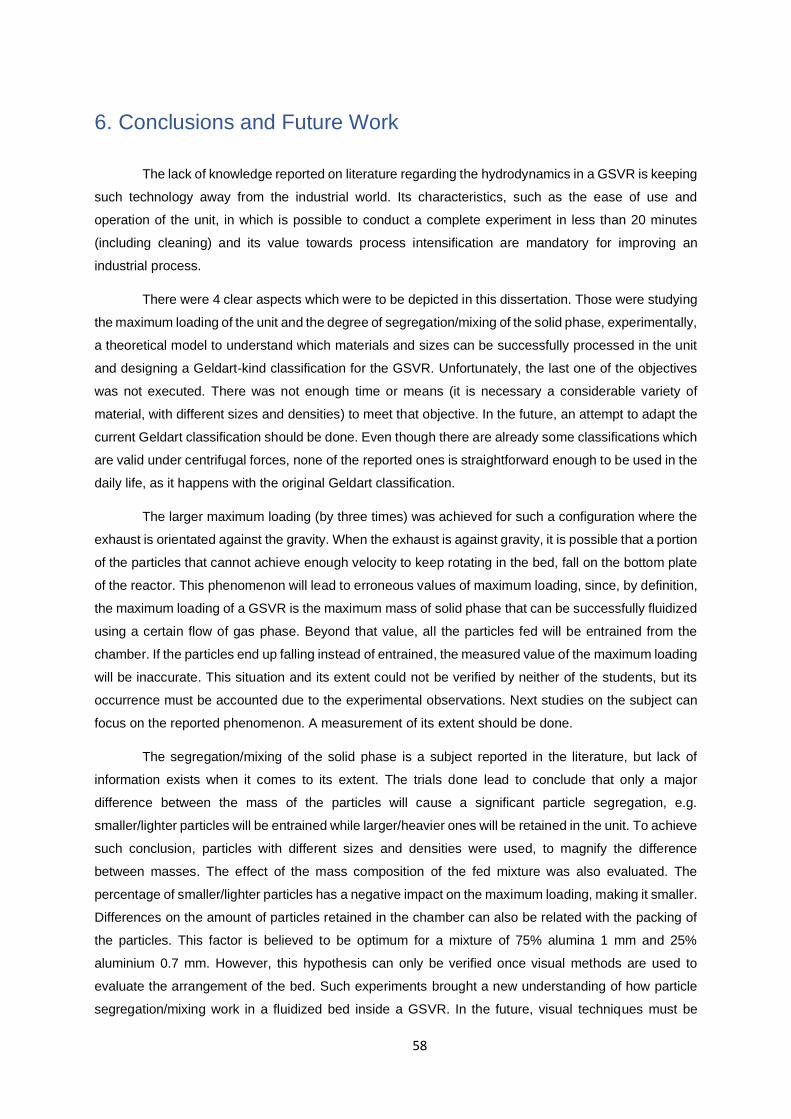
58
6. Conclusions and Future Work
The lack of knowledge reported on literature regarding the hydrodynamics in a GSVR is keeping
such technology away from the industrial world. Its characteristics, such as the ease of use and
operation of the unit, in which is possible to conduct a complete experiment in less than 20 minutes
(including cleaning) and its value towards process intensification are mandatory for improving an
industrial process.
There were 4 clear aspects which were to be depicted in this dissertation. Those were studying
the maximum loading of the unit and the degree of segregation/mixing of the solid phase, experimentally,
a theoretical model to understand which materials and sizes can be successfully processed in the unit
and designing a Geldart-kind classification for the GSVR. Unfortunately, the last one of the objectives
was not executed. There was not enough time or means (it is necessary a considerable variety of
material, with different sizes and densities) to meet that objective. In the future, an attempt to adapt the
current Geldart classification should be done. Even though there are already some classifications which
are valid under centrifugal forces, none of the reported ones is straightforward enough to be used in the
daily life, as it happens with the original Geldart classification.
The larger maximum loading (by three times) was achieved for such a configuration where the
exhaust is orientated against the gravity. When the exhaust is against gravity, it is possible that a portion
of the particles that cannot achieve enough velocity to keep rotating in the bed, fall on the bottom plate
of the reactor. This phenomenon will lead to erroneous values of maximum loading, since, by definition,
the maximum loading of a GSVR is the maximum mass of solid phase that can be successfully fluidized
using a certain flow of gas phase. Beyond that value, all the particles fed will be entrained from the
chamber. If the particles end up falling instead of entrained, the measured value of the maximum loading
will be inaccurate. This situation and its extent could not be verified by neither of the students, but its
occurrence must be accounted due to the experimental observations. Next studies on the subject can
focus on the reported phenomenon. A measurement of its extent should be done.
The segregation/mixing of the solid phase is a subject reported in the literature, but lack of
information exists when it comes to its extent. The trials done lead to conclude that only a major
difference between the mass of the particles will cause a significant particle segregation, e.g.
smaller/lighter particles will be entrained while larger/heavier ones will be retained in the unit. To achieve
such conclusion, particles with different sizes and densities were used, to magnify the difference
between masses. The effect of the mass composition of the fed mixture was also evaluated. The
percentage of smaller/lighter particles has a negative impact on the maximum loading, making it smaller.
Differences on the amount of particles retained in the chamber can also be related with the packing of
the particles. This factor is believed to be optimum for a mixture of 75% alumina 1 mm and 25%
aluminium 0.7 mm. However, this hypothesis can only be verified once visual methods are used to
evaluate the arrangement of the bed. Such experiments brought a new understanding of how particle
segregation/mixing work in a fluidized bed inside a GSVR. In the future, visual techniques must be
59
performed while fluidizing materials with different sizes and densities so that all the explanations for
particle segregation/mixing reported in this document may be validated or discarded. Nonetheless, the
experimental dataset gathered about segregation (or mixing) can also be useful in future for validation
of CFD simulations involving a binary solids fluidization in vortex devices.
Besides experiments, this thesis also reports a portion of modeling work. This mathematical
model strives to predict the minimum size of a particle with a certain density that can be fluidized in a
GSVR. As reported before, this model was successfully built, since its conclusions are supported by
published articles but presents considerable limitations on the virtue of simplifications/assumptions
made during its development. Mathematical limitations arise in the iterative process, which can converge
to solutions other than the trivial one if and only if a specific drag coefficient correlation is used. The
second limitation has to do with the short range of situations where the model can be employed. The
model should only be extended to materials with a similar fluidization behavior (under centrifugal forces)
to aluminum, e.g. that belongs to the same group in the Geldart classification. The need of accurate
azimuthal solid velocities can also be a barrier to obtaining good results from the model. Despite of
these constrains, the modeling work proved to be useful for predicting which materials of what size can
be processed in a certain unit and for designing purposes. This model gives a different perspective
(more theorical) than the preformed experiments. In the future, the outcoming results of the model can
be compared with experiments or even simulations. Those comparisons will lead to a refinement of the
model itself, so it can represent the reality to a better extent. The referred limitations, mainly the
mathematical ones, should be studied and a solution for the convergence problem obtained. The answer
to solve such problem can be related with the software used for the iterative process. A more powerful
tool, such as Matlab or Python may approach the problem by using another method and therefore
achieve new solutions, which proved to be beyond the scope of this thesis.
To conclude, this dissertation strives to fill a part of the gap in the vortex literature regarding the
hydrodynamics of a GSVR. The optimum configuration for the setup is reported in terms of maximum
loading, as well as the degree of segregation/mixing of the solid phase. Such knowledge will lead to an
operation much more efficient than before. A larger maximum loading will lead to a larger quantity of
materials processed during the same period of time and the understanding of the segregation
phenomenon will be useful in processes where a decrease of the particle size happens, such as drying
or pyrolysis, where formation of ash occurs.
7. References
(1) Gilliland, E.; Mason, E. Gas and solid mixing in fluidized beds. Industrial & Engineering Chemistry 1949, 41 (6), 1191.
(2) Ergun, S.; Orning, A. A. Fluid flow through randomly packed columns and fluidized beds. Industrial & Engineering Chemistry 1949, 41 (6), 1179.
(3) Daud, W. R. W. Fluidized bed dryers—Recent advances. Advanced Powder Technology 2008, 19 (5), 403.
(4) De Wilde, J. Gas–solid fluidized beds in vortex chambers. Chemical Engineering Processing: Process Intensification 2014, 85, 256.
(5) Gel'perin, N.; Ainstein, V.; Gakman, I. Rate of inception of fluidization and expansion of a fluidized layer in a centrifugal force field. Khim. Mash. 1964, (5), 18.
(6) Dongbang, W.; Pirompugd, W.; Triratanasirichai, K. The drying kinetics of chilies using a rotating fluidized bed technique. American Journal of Applied Sciences 2010, 7 (12), 1599.
(7) Eliaers, P.; de Broqueville, A.; Poortinga, A.; van Hengstum, T.; De Wilde, J. High-G, low-temperature coating of cohesive particles in a vortex chamber. Powder Technology 2014, 258, 242.
(8) Hirsch, D.; Steinfeld, A. Solar hydrogen production by thermal decomposition of natural gas using a vortex-flow reactor. International Journal of Hydrogen Energy 2004, 29 (1), 47.
(9) Eliaers, P.; De Wilde, J. Drying of biomass particles: Experimental study and comparison of the performance of a conventional fluidized bed and a rotating fluidized bed in a static geometry. Drying technology 2013, 31 (2), 236.
(10) De Wilde, J.; Richards, G.; Benyahia, S. Qualitative numerical study of simultaneous high-G-intensified gas–solids contact, separation and segregation in a bi-disperse rotating fluidized bed in a vortex chamber. Advanced Powder Technology 2016, 27 (4), 1453.
(11) Schuerewegen, C.; Heynderickx, G. p.; Van Geem, K. c. “Experimental Heat Transfer Studies in a Hot Flow Vortex Reactor,” University of Gent, 2018.
(12) Kulkarni, S. R.; Gonzalez-Quiroga, A.; Nuñez, M.; Schuerewegen, C.; Perreault, P.; Goel, C.;
Heynderickx, G. J.; Van Geem, K. M.; Marin, G. B. J. A. J. An experimental and numerical study of the suppression of jets, counterflow and backflow in vortex units. AIChE Journal, e16614.
(13) Kovacevic, J.; Pantzali, M.; Heynderickx, G.; Marin, G. Bed stability and maximum solids capacity in a Gas–Solid Vortex Reactor: Experimental study. Chemical Engineering Science 2014, 106, 293.
(14) Ekatpure, R.; Suryawanshi, V.; Heynderickx, G.; De Broqueville, A.; Marin, G. Experimental investigation of a gas–solid rotating bed reactor with static geometry. Chemical Engineering Processing: Process Intensification 2011, 50 (1), 77.
(15) Chen, Y. M. Fundamentals of a centrifugal fluidized bed. AIChE Journal 1987, 33 (5), 722. (16) Nakamura, H.; Watano, S. Numerical modeling of particle fluidization behavior in a rotating
fluidized bed. Powder Technology 2007, 171 (2), 106. (17) Kao, J.; Pfeffer, R.; Tardos, G. On partial fluidization in rotating fluidized beds. AIChE Journal
1987, 33 (5), 858. (18) Watano, S.; Nakamura, H.; Hamada, K.; Wakamatsu, Y.; Tanabe, Y.; Dave, R. N.; Pfeffer, R.
Fine particle coating by a novel rotating fluidized bed coater. Powder Technology 2004, 141 (3), 172.
(19) Eliaers, P.; Pati, J. R.; Dutta, S.; De Wilde, J. Modeling and simulation of biomass drying in vortex chambers. Chemical Engineering Science 2015, 123, 648.
(20) Qian, G. H.; Bagyi, I.; Burdick, I. W.; Pfeffer, R.; Shaw, H.; Stevens, J. G. Gas–solid fluidization in a centrifugal field. AIChE Journal 2001, 47 (5), 1022.
(21) Qian, G. H.; B´ gyi, I. n.; Pfeffer, R.; Shaw, H.; Stevens, J. G. Particle mixing in rotating fluidized beds: inferences about the fluidized state. AIChE Journal 1999, 45 (7), 1401.
(22) “Particle Image Velocimetry ”https://velocimetry.net/principle.htm 03/05/2019. (23) Kovacevic, J. Z.; Pantzali, M. N.; Niyogi, K.; Deen, N. G.; Heynderickx, G. J.; Marin, G. B. J. C.
E. S. Solids velocity fields in a cold-flow gas–solid vortex reactor. Chemical Engineering Science 2015, 123, 220.
(24) “Measurement Principles of PIV,”https://www.dantecdynamics.com/measurement-principles-of-piv, 03/05/2019.

(25) Kulkarni, S. R.; Vandewalle, L. A.; Gonzalez-Quiroga, A.; Perreault, P.; Heynderickx, G. J.; Van Geem, K. M.; Marin, G. B. Computational fluid dynamics-assisted process intensification study for biomass fast pyrolysis in a gas–solid vortex reactor. Energy Fuels 2018, 32 (10), 10169.
(26) Ding, Y.; Forster, R.; Seville, J.; Parker, D. Scaling relationships for rotating drums. Chemical Engineering Science 2001, 56 (12), 3737.
(27) Niyogi, K.; Torregrosa, M. M.; Pantzali, M. N.; Heynderickx, G. J.; Marin, G. B.; Shtern, V. N. On near-wall jets in a disc-like gas vortex unit. AIChE Journal 2017, 63 (5), 1740.
(28) Brossard, C.; Monnier, J.; Barricau, P.; Vandernoot, F.-X.; Le Sant, Y.; Champagnat, F.; Le Besnerais, G. Principles and applications of particle image velocimetry. AerospaceLab 2009, (1), p. 1.
(29) “Planar laser-induced fluorescence,”https://en.wikipedia.org/wiki/Planar_laser-induced_fluorescence, 02/05/2019.
(30) Liu, Z.; Hitimana, E.; C. Hill, J.; Fox, R.; Olsen, M. Turbulent Mixing in the Confined Swirling Flow of a Multi-Inlet Vortex Reactor. AIChE Journal 2017, 63.
(31) Liu, Z.; Fox, R. O.; Hill, J. C.; Olsen, M. G. A Batchelor Vortex Model for Mean Velocity of Turbulent Swirling Flow in a Macroscale Multi-Inlet Vortex Reactor. Journal of Fluids Engineering 2015, 137 (4), 041204.
(32) Feng, H.; Olsen, M.; Liu, Y.; Fox, R.; C. Hill, J. Investigation of Turbulent Mixing in a Confined Planar-Jet Reactor. AIChE Journal 2005, 51, 2649.
(33) Pantzali, M. N.; Kovacevic, J. Z.; Heynderickx, G. J.; Marin, G. B.; Shtern, V. N. Radial pressure profiles in a cold-flow gas-solid vortex reactor. AIChE Journal 2015, 61 (12), 4114.
(34) Ashcraft, R. W.; Heynderickx, G. J.; Marin, G. B. Modeling fast biomass pyrolysis in a gas–solid vortex reactor. Chemical Engineering Journal 2012, 207, 195.
(35) Cabrera, M. A.; Wu, W. Experimental modelling of free-surface dry granular flows under a centrifugal acceleration field. Granular Matter 2017, 19 (4), 78.
(36) Cook, C. A.; Cundy, V. A. Heat transfer between a rotating cylinder and a moist granular bed. International journal of heat mass transfer 1995, 38 (3), 419.
(37) Chaudhuri, B.; Muzzio, F. J.; Tomassone, M. S. Modeling of heat transfer in granular flow in rotating vessels. Chemical Engineering Science 2006, 61 (19), 6348.
(38) Dewettinck, K.; Huyghebaert, A. Fluidized bed coating in food technology. Trends in Food ScienceTechnology 1999, 10 (4-5), 163.
(39) Ashcraft, R. W.; Kovacevic, J.; Heynderickx, G. J.; Marin, G. B. Assessment of a Gas–Solid Vortex Reactor for SO2/NO x Adsorption from Flue Gas. Industrial Engineering Chemistry Research 2013, 52 (2), 861.
(40) Dodson, C. E.; Lakshmanan, V. I. An innovative gas-solid torbed reactor for the recycling industries. JOM 1998, 50 (7), 29.
(41) “TORBED Compact Bed Reactor (‘CBR’), TORBED Reactor Technology for Gas Solid Contact Processes,”www.torftech.com, 2017.
(42) Shi, M.; Wang, H.; Hao, Y. Experimental investigation of the heat and mass transfer in a centrifugal fluidized bed dryer. Chemical Engineering Journal 2000, 78 (2-3), 107.
(43) Kamranian Marnani, A.; Bück, A.; Antonyuk, S.; van Wachem, B.; Thévenin, D.; Tomas, J. The Effect of the Presence of Very Cohesive Geldart C Ultra-Fine Particles on the Fluidization of Geldart A Fine Particle Beds. Processes 2019, 7 (1), 35.
(44) Verma, V.; Li, T.; De Wilde, J. Coarse-grained discrete particle simulations of particle segregation in rotating fluidized beds in vortex chambers. Powder Technology 2017, 318, 282.
(45) Weber, J. M.; Stehle, R. C.; Breault, R. W.; De Wilde, J. Experimental study of the application of rotating fluidized beds to particle separation. Powder Technology 2017, 316, 123.
(46) “What is Process Intensification and How Can You Implement It?,”https://www.epicmodularprocess.com/blog/what-is-process-intensification, 27/03/2019.
(47) Wang, H.; Mustaffar, A.; Phan, A. N.; Zivkovic, V.; Reay, D.; Law, R.; Boodhoo, K. A review of process intensification applied to solids handling. Chemical Engineering Processing: Process Intensification 2017, 118, 78.
(48) Geldart, D. Types of gas fluidization. Powder Technology 1973, 7 (5), 285. (49) “ZSM-5,”https://en.wikipedia.org/wiki/ZSM-5, 01/04/2019. (50) “The Essential Chemical Industry – online – Calcium Carbonate.
,”http://www.essentialchemicalindustry.org/chemicals/calcium-carbonate.html 04/04/2019. (51) Dahmash, E. Z.; Mohammed, A. R. Functionalised particles using dry powder coating in
pharmaceutical drug delivery: promises and challenges. Expert opinion on drug delivery 2015, 12 (12), 1867.

(52) Ye, M.; van der Hoef, M. A.; Kuipers, J. A numerical study of fluidization behavior of Geldart A particles using a discrete particle model. Powder Technology 2004, 139 (2), 129.
(53) Ye, M.; van der Hoef, M. A.; Kuipers, J. The effects of particle and gas properties on the fluidization of Geldart A particles. Chemical Engineering Science 2005, 60 (16), 4567.
(54) Matsuda, S.; Hatano, H.; Tsutsumi, A. Ultrafine particle fluidization and its application to photocatalytic NOx treatment. Chemical Engineering Journal 2001, 82 (1-3), 183.
(55) Piepers, H.; Cottaar, E. J. E.; Verkooijen, A.; Rietema, K. Effects of pressure and type of gas on particle-particle interaction and the consequences for gas—solid fluidization behaviour. Powder Technology 1984, 37 (1), 55.
(56) Yang, W.-C. Modification and re-interpretation of Geldart's classification of powders. Powder Technology 2007, 171 (2), 69.
(57) Yehuda, T.; Kalman, H. 18th International Conference on Transport; p 401. (58) Gündoğdu, Ö.; Tüzün, U. Gas Fluidisation of Nano-particle Assemblies: Modified Geldart
classification to account for multiple-scale fluidisation of agglomerates and clusters. KONA Powder Particle Journal 2006, 24, 3.
(59) Hakim, L. F.; Portman, J. L.; Casper, M. D.; Weimer, A. W. Aggregation behavior of nanoparticles in fluidized beds. Powder Technology 2005, 160 (3), 149.
(60) Valverde, J. M.; Castellanos, A. Effect of vibration on agglomerate particulate fluidization. AIChE Journal 2006, 52 (5), 1705.
(61) van Ommen, J. R.; Valverde, J. M.; Pfeffer, R. Fluidization of nanopowders: a review. Journal of nanoparticle research : an interdisciplinary forum for nanoscale science and technology 2012, 14 (3), 737.
(62) Dukhin, S.; Zhu, C.; Dave, R. N.; Yu, Q. Hydrodynamic fragmentation of nanoparticle aggregates at orthokinetic coagulation. Advances in colloid and interface science 2005, 114-115, 119.
(63) Morrison, F. A. An Introduction to Fluid Dynamics; Cambridge University Press: New York, 2013.
(64) Gonzalez-Quiroga, A.; Kulkarni, S. R.; Vandewalle, L.; Perreault, P.; Goel, C.; Heynderickx, G. J.; Van Geem, K. M.; Marin, G. B. Azimuthal and radial flow patterns of 1g-Geldart B-type particles in a gas-solid vortex reactor. Powder Technology 2019.
(65) Gonzalez-Quiroga, A.; Reyniers, P. A.; Kulkarni, S. R.; Torregrosa, M. M.; Perreault, P.; Heynderickx, G. J.; Van Geem, K. M.; Marin, G. B. Design and cold flow testing of a Gas-Solid Vortex Reactor demonstration unit for biomass fast pyrolysis. Chemical Engineering Journal 2017, 329, 198.
(66) Friedle, M.; Niyogi, K.; Torregrosa, M. M.; Marin, G. B.; Heynderickx, G. J. A drag model for the gas-solid vortex unit. Powder Technology 2017, 312, 210.
(67) P. Rowe, G. H. Drag Forces in a Hydraulic Model of a Fluidised bed. Trans. Instn. Chem. Engrs. 1960.
(68) Kulkarni, S. R.; Gonzalez-Quiroga, A.; Nuñez, M.; Schuerewegen, C.; Perreault, P.; Goel, C.;
Heynderickx, G. J.; Van Geem, K. M.; Marin, G. B. An experimental and numerical study of the suppression of jets, counterflow and backflow in vortex units. AIChE Journal 2019, e16614.