experiment n2: gamma-ray spectroscopy with the...
TRANSCRIPT

N2-1
Experiment N2: Gamma-ray spectroscopy with the scintillator/photomultiplierand with the high purity Ge detector: Compton scattering, photoeffect, and pair production
References: 1. Experiments in Nuclear Science, AN34 Lab Manual, 3rd ed (EG&G
Ortec, Oak Ridge, TN, 1984) 2. Modular Pulse-Processing Electronics and Semiconductor Radiation
Detectors, (EG&G Ortec, Oak Ridge, TN, 1994) 3. Physics Vade Mecum, H.L. Anderson, ed. (AIP, New York, 2nd ed.,
1989) 4. Preston and Dietz, The Art of Experimental Physics
Objectives: In this experiment on gamma ray detection, the emphasis will be on the detectors and on the interaction of the high energy photons with the solid state materials. We do not emphasize the nuclear physics of radiation emission. For the NaI:Tl scintillator plus photomultiplier, the solid state scintillator converts the gamma ray photon into a burst of visible photons, the number of which is proportional to the gamma energy. For the high purity germanium detector, the gamma rays directly generate electron-hole pairs in numbers proportional to the gamma energy. We shall note the quite different energy resolution of the two detectors and relate these detectors to applications in environmental monitoring and in nuclear medicine. The first week of this lab we will focus on initial experiments using the NaI:Tl scintillator-based detector.
Introduction: One of the most important analytical techniques in any branch of physics is the determination of the energy or wavelength of photons or particles. Thus we will use a spectrometer to analyze the wavelength of visible photons in the Raman measurements and we could measure the frequency of radio-wave photons as they resonate with precessing protons or other nuclei in a magnetic field (NMR). As the energy of photons increases to the keV and MeV range, it is possible to measure directly the energy of the photons, rather than the wavelength or frequency. The NaI scintillator and photomultiplier
In this experiment, we shall examine two different methods for determining the energy of these gamma-ray photons. In one case, the scintillator detector absorbs the gamma ray photon generating either a photoelectron, a Compton scattered electron, or creating a pair of electrons simultaneously. In each case these high energy primary electrons create a cascade of secondary electrons in the conduction band which then eventually slow down and undergo recombination with holes in the valence band. In a good scintillator crystal, a 1 MeV photon photopeak will produce a “scintillation” of about 104 visible photons. In the case of sodium iodide (NaI, an alkali halide crystal), a small amount of thallium (Tl) is added to enhance the radiative probability during the recombination process. These thallium trapping and radiative centers lie somewhat below the conduction band so that the radiated photons are emitted with less energy than the band gap of the pure crystal. The band gap of NaI is ~3.9 eV (~320 nm) and the Tl-

N2-2
related emission is peaked in a band near 3.0 eV (410 nm; blue light). In the NaI:Tl scintillator, γ absorption yields light output (and energy resolution) at the rate of 38 photons/keV; the typical response time for NaI:Tl is 250 ns. Conversion to an electrical pulse is done with a photomultiplier tube (PMT). In a future lab on atomic and molecular spectroscopy, we will also use a PMT to detect light dispersed in a Spex spectrometer, except with the Spex we will operate in the photon counting mode to detect single photons. Rather (in this lab on gamma rays), the electronics are set up to further amplify the PMT pulse in a linear fashion and then do pulse-height analysis. That is, the electronics generate a histogram of pulse heights over a large number of detected gamma ray events.
It is important to recognize that some gamma rays may pass completely through the NaI crystal and others may undergo Compton scattering in which the recoil electron deposits all of its energy into a cascade of other electrons but the Compton-scattered photon may exit the crystal without depositing any further energy. Thus, in addition to the photopeak (which will exhibit the full gamma-ray energy), there will be a broad Compton background with an edge at a maximum energy called the Compton edge. This edge comes from photons which Compton scatter backwards (180o) and hence give up a maximum amount of energy to the Compton electron which can then generate a cascade of other electrons. In those cases where the recoil electron receives maximum energy from the gamma photon, the backscattered gamma ray photon will have a corresponding minimum energy given by the energy of the incident gamma photon minus the maximum energy of the Compton electron (at the Compton edge). When the (minimum energy) backscattered gamma photon is also detected, it will contribute to a “backscattered photon” peak.
The geometry of the NaI:Tl and PMT are shown in Fig. N2-1 (from Ref. 1). The electronics set-up is shown in Fig. N2-2. Table 1, from Ref. 4, gives some of the characteristics of the NaI(Tl) crystal and a number of other scintillator crystals.

N2-3
905‐3 NaI(Tl) Scintillator and PMT
266 PM Base
Canberra 3002 HV Supply
+800 V
113 Preamplifier
575A Amplifier
ACE‐2K MCA System
Readout
Dynode
Source
Fig. N2-1. Geometry of the NaI scintillator/ PMT combination (from Ref. 1).
Fig. N2-2. Block diagram of the scintillator/PMT/MCA system.

N2-4
Table N2-1: Basic properties of solid scintillators (from Ref. 3). The high purity Ge detector
High energy photons interact with a Ge detector in the same way as for NaI:Tl. That is, through a photopeak, the Compton scattering continuum, and pair production, if the energy is above the rest mass energy of two electrons (1.02 MeV). However, the Ge crystal collects the cascade electrons directly rather than reradiating the energy into a photomultiplier. Because the gamma ray photon energy is high, the penetration is deep and thus the crystal must be quite large and very pure (so that the electron-hole pairs will survive long enough to be collected in the doped layers at the surfaces of the crystal).
Figure N2-3a, from Ref. 2, gives the linear absorption coefficient for gamma rays in Ge and Si. (The range of the gamma is obtained by taking the inverse of the absorption coefficient.) Note that, in Fig. N2-3, the absorption coefficient of Ge is more than two times greater than that of Si. Approximately, the absorption probability due to the three types of processes is just proportional to the number of electrons with which a gamma can interact. (By the way, this is the reason for choosing NaI as a scintillator among the other alkali halides, rather than NaCl, or LiF, or RbCl, because there are more electrons per cm3.) The linear absorption coefficient for NaI is given for comparison with Ge and Si in Fig. N2-3b (from Ref. 5). Additional information about the physics of the interaction of gamma rays with the Ge detector is given in Appendix XIV.
Fig. N2-4 (from Ref. 2) indicates the geometry of the Ge detector, where two types of detectors are shown. Ours is shown in the upper sketch in which the Ge crystal is diffusion doped with Li to form an n-type layer over the outer skin about 700 μm (0.7 mm) deep. (Li resides in an interstitial location so that the single valence electron does not participate in any bonds and hence is free to donate.) The hole in the center is doped with B, a group III element which enters substitutionally. Since Ge is four-fold coordinated (bonded), there is one bond which can “accept” electrons from neighbor bonds. This forms the quasiparticle called a “hole”

N2-5
which behaves as a positive charge (with the effective mass of the valence band only positive). Further details of the detector fabrication, as well as the electronics and cryogenics are provided in Appendix XIV.
The lower sketch in Fig. N2-4 shows a crystal with the n- and p-type layers reversed. It is almost equivalent except that the boron-doped layer at the surface is only about 0.3 μm thick. Since the carrier collection is very poor in either the n- or p-type doped layers and mostly arises from the bulk, intrinsic (depleted) Ge, a very thin doped layer is ideal for detecting low energy photons. Referring to Fig. N2-3, you may guess that photons of 10 keV or less might be detectable through this boron-doped layer provided the protective window is also very thin. The nuclear physics
Gamma rays originate from nuclei as an atomic excited state relaxes to a lower or ground state. In almost every case these excited states (isomeric states) occur as daughters of another decay involving radioactive particles, either beta or alpha particles. Examples of these transitions are given in Fig. N2-5 (from Ref. 4).
You should understand the basics of Compton scattering in order to understand the spectra you will obtain. Compton scattering is inelastic scattering of the gamma ray with a bound or conduction electron in the solid. However, since the gamma ray has an energy in the range of 1 MeV, even bound electrons have binding energies small in comparison. Therefore it is common to treat the electron as free. Thus conservation of momentum gives:
hv/c = hv’/c cos θ + P cos φ 0 = hv’/c sin θ - P sin φ
Conservation of energy gives:
hv = hv’ + K. Here, P and K are the momentum and kinetic energy of the electron; hν and hν’ are the incident and scattered gamma ray energies.

N2-6
Fig. N2-3. a) Mass attenuation coefficients for photons in NaI as a function of photon energy; b) linear absorption coefficients vs. photon energy for Si and Ge. The density of Si and Ge are, respectively, 2.33 and 5.32 g/cm3.
Fig. N2-4. Schematic of p-type and n-type HPGe detectors.

N2-7
Fig. N2-5. Gamma ray transitions in three nuclei. Fig. N2-6. Example of the type of spectra you should obtain.

N2-8
Figure N2-7. Electrical connection diagram for M10 P4-70 high-purity germanium detector (HPGe). Note: the HPGe detector is designed to work only in a LN2 environment (77 K). If the detector is not cooled down to this temperature, the bias supply is interlocked so it will not come on. If the “shutdown” LED is not on, it is OK to apply the voltage to the detector by slowly increasing the voltage (note that upon power-up of the 659 Bias Supply, the Shutdown LED is initially on by default, and the Reset button will turn it off). If the “shutdown” LED remains on, check the LN2 supply in the dewar. If the LN2 level is OK, it may be that the detector has not been cooled for six hours or more. If this occurs, see instructor for help.
Ortec GEM10 P4‐70 HPG Detector Cooled w/ LN2
Ortec 659 5 kV Bias Supply
Output 1
HV Bias
(+2,000 V)
Bias Shutdown
(thermal overload
protection)
575A Amplifier
Preamplifier power
MCA Card in PC
Oscilloscope
Bipolar output
Unipolar output

N2-9
Experiments: A. The NaI:Tl scintillator/PMT detector (Part 1)
Refer to Fig. N2-2 for the electronics set-up and connections. 1. Prior to each spectrum, collect a representative background spectrum which can be
subtracted from the “signal” spectrum. Also, when switching between sources, place the source at the same distance each time in order to retain the ability to calculate the activities of the sources relative to one another.
2. Start with the 1 μCi 60Co source, which has gamma peaks at 1.333 MeV and 1.172 MeV. We’ll use this source to calibrate the MCA, determining the energy vs. channel # relationship (note that there may be an offset such that E = 0 may not coincide with Channel 0). Position the 60Co source ~1 cm from the detector. Adjust the amplifier gain so that the highest-energy photopeak in the multichannel analyzer (MCA) is around channel 3000 (out of the 4000 channels available). Acquire a spectrum for ~300 seconds, or long enough to clearly identify the center channels of the two gamma photopeaks.
3. Leave the amplifier settings the same as for the 60Co, and switch to the 1 μCi 137Cs source to obtain a simple spectrum (only a single gamma ray). Again, place the source about 1 cm in front of the scintillator crystal; accumulate a spectrum for about 1000 seconds, or long enough to collect a clean spectrum.
In the write-up, provide a graph of the data, identify the photopeak and the Compton edge. Use the calibration information to determine the energy of the photopeak as well as the energy of the Compton edge. Verify the Compton formula for this edge, recalling that this is for a backscattered photon (θ = 180o). The backscattered photon can also be detected – identify the energy at which the backscattered photon should be detected (compare the backscatter peak (if found) in the spectrum to the computed value based on the photopeak and Compton edge).
Also use the 137Cs source spectrum to calculate the resolution of this gamma ray spectroscopy system with NaI:Tl detector. Measure the full width at half maximum of the photopeak. Give the result in energy units as well as channels (and provide the conversion ratio in terms of eV per channel). How does your result compare with the accepted value of 0.662 MeV?
4. Now switch back to the more complicated source, the 1 μCi 60Co, and acquire a high-quality spectrum in an effort to identify the photopeaks as well as the Comptom edge(s) and backscatter peaks. Again, leave the amplifier settings the same as they were for part (2). Acquire data long enough to obtain a good spectrum.
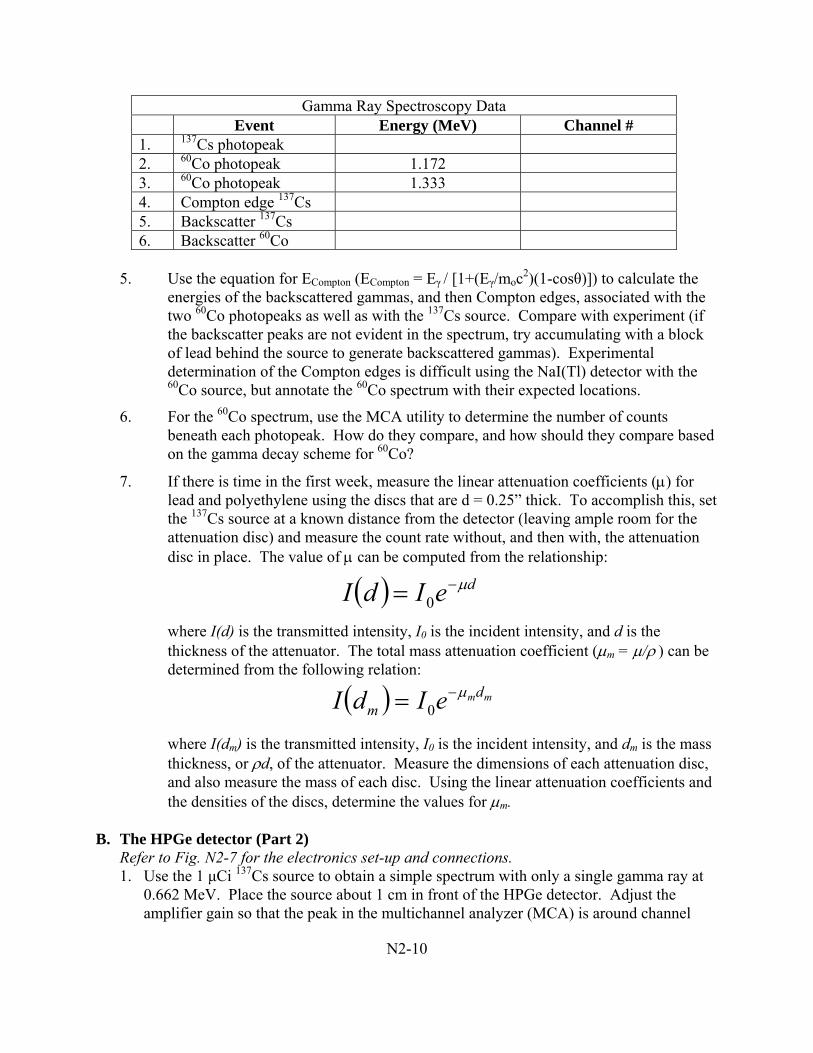
In the write-up, plot the spectra for both 137Cs and 60Co, and identify (annotate) as many of the peaks as possible for both sources. Complete the following Table:
N2-10
Gamma Ray Spectroscopy Data Event Energy (MeV) Channel # 1. 137Cs photopeak 2. 60Co photopeak 1.172 3. 60Co photopeak 1.333 4. Compton edge 137Cs 5. Backscatter 137Cs 6. Backscatter 60Co
5. Use the equation for ECompton (ECompton = Eγ / [1+(Eγ/moc
2)(1-cosθ)]) to calculate the energies of the backscattered gammas, and then Compton edges, associated with the two 60Co photopeaks as well as with the 137Cs source. Compare with experiment (if the backscatter peaks are not evident in the spectrum, try accumulating with a block of lead behind the source to generate backscattered gammas). Experimental determination of the Compton edges is difficult using the NaI(Tl) detector with the 60Co source, but annotate the 60Co spectrum with their expected locations.
6. For the 60Co spectrum, use the MCA utility to determine the number of counts beneath each photopeak. How do they compare, and how should they compare based on the gamma decay scheme for 60Co?
7. If there is time in the first week, measure the linear attenuation coefficients () for lead and polyethylene using the discs that are d = 0.25” thick. To accomplish this, set the 137Cs source at a known distance from the detector (leaving ample room for the attenuation disc) and measure the count rate without, and then with, the attenuation disc in place. The value of can be computed from the relationship:
where I(d) is the transmitted intensity, I0 is the incident intensity, and d is the
thickness of the attenuator. The total mass attenuation coefficient (m = / ) can be determined from the following relation:
where I(dm) is the transmitted intensity, I0 is the incident intensity, and dm is the mass
thickness, or d, of the attenuator. Measure the dimensions of each attenuation disc, and also measure the mass of each disc. Using the linear attenuation coefficients and the densities of the discs, determine the values for m.
B. The HPGe detector (Part 2)
Refer to Fig. N2-7 for the electronics set-up and connections. 1. Use the 1 μCi 137Cs source to obtain a simple spectrum with only a single gamma ray at
0.662 MeV. Place the source about 1 cm in front of the HPGe detector. Adjust the amplifier gain so that the peak in the multichannel analyzer (MCA) is around channel
deIdI 0
mmdm eIdI 0

N2-11
1000 (out of the 4000 channels available). Accumulate a spectrum for about 1000 seconds.
In the write-up, provide a graph of the data, identify the photopeak and the Compton edge. Annotate the graph as you did for the scintillator (NaI(Tl)/PMT) spectrum.
Calculate the resolution of this detection scheme. Measure the full width at half maximum of the photopeak. Give the result in energy units, and compare the energy resolution with that observed by the NaI(Tl) – PMT detector. Explain why the energy resolution differs so much for these two types of detectors. Complete the same Gamma Ray Spectroscopy Data table as you did for Part 1. Indicate clearly your uncertainties in these values, describe what determines the uncertainty, and compare these values to what you found for Part 1.
2. Now use a more complicated source, the 1 μCi 60Co. This has gamma peaks at 1.333 MeV and 1.172 MeV. Leave the amplifier settings the same as for the 137Cs. Acquire data long enough to obtain a good spectrum. In the write-up plot the data and identify (annotate) all the peaks.
C. The NaI:Tl scintillator/PMT detector (Part 3)
1. Prior to each spectrum, collect a representative background spectrum which can be subtracted from the “signal” spectrum. Place the Na-22 source ~ 3 cm from the detector, and collect a spectrum of high quality. Identify the photoabsorption peak, the Compton edge and also the peak related to the sequence of pair production, positronium formation, and two-photon decay of the positronium atom. Please write up the sequence of events that occur in the NaI(Tl) detector in your own words and show that the energies of the observed peaks are as expected.
The decay scheme for 22Na consists of +-decay in which a positron (the +) is emitted along with an electron neutrino and a gamma photon (1.275 MeV)
22Na 22Ne + + + e +
When the positron encounters an electron, positronium is formed; positron annihilation quickly follows, converting the energy of these two particles into light. Specifically, two gamma photons are emitted, in opposite directions. Typically, one of the gammas interacts with the detector, resulting in a pulse corresponding to 0.511 MeV.
Make measurements to determine the linear attenuation coefficients and mass attenuation coefficients for Pb and polyethylene. You will make attenuation measurements for the Na-22 and Cs-137 sources, using five different thicknesses of lead and seven different thicknesses of the polyethylene. To determine the density of each material, carefully measure the diameter and thickness of one or two discs of each material to determine their volumes, and weigh them to determine their mass. Include the density as you determine it for each material, and include an uncertainty for this value. Propagate that uncertainty as you determine m.

N2-12
Linear absorption—make a semilog plot of I/I0 versus thickness, for each of the two attenuation materials, where I is the counts in the peak. Each graph will have three sets of data (two from Na-22 and one from Cs-137). Instead of using the ROI approach, which may be fraught with errors, you should identify the peak channel, and then use the sum of that channel plus the two channels beneath and above in energy. So you’ll sum the five channels around the peak to determine a number proportional to the intensity. Be sure that you subtract the background correctly prior to the 5-channel sum.
Determine the error in the attenuation coefficient, α, assuming Poisson statistics in the counts for the peaks. Be careful to propagate the errors correctly!
Is there a dependence of attenuation coefficient on gamma ray energy?
See below for additional notes on the lab write-up…
****************************************************************************
Notes on the write-up (referring to Part 1): 1. You should have acquired the spectra for both the Cs-137 and the Co-60 with exactly the
same gain settings for the amplifiers. Therefore, make a linear least squares fit of the channel number vs. gamma energy to determine the energy calibration (channels/keV) and any possible zero offset.
2. Now determine the peak resolution (full width at half maximum, FWHM, in keV) at the three gamma energies Two for Co-60, and one for Cs-137).
3. What is the expected natural energy width of the 0.662 MeV peak based on the energy-time uncertainty relation? The half-life of the excited state of Ba-137 (for gamma decay) is 153 s. This may require just a bit of research on your own…
When it comes to error analysis: You should identify how accurately you can identify the peak of any particular gamma
ray. This will be quite different for the scintillator and the Ge detector. You will probably have to look at your data to estimate the uncertainty. It will be some fraction of the peak width. Make your case.
This error in channel number of the peak will inform your fitting procedure. I have asked you to do a straight line fit to extract the intercept and slope. But DO NOT USE THE FIVE OR MORE DIGIT RESULTS UNLESS YOU CAN JUSTIFY SUCH. For example, if the intercept is shown to five significant figures, this implies you can pick the peak that well. You probably will have to override or interpret the numbers coming out of Excel. I would like the intercept and slope to be given as
Slope = xxx +/- y Intercept = aaa +/- b Etc….
On the graphs remember to identify the photopeak, Compton edge, backscatter peak, etc, where possible.