experiences and learned lessons from an air free-cooled
TRANSCRIPT
Experiences and Learned Lessons from an Air Free-CooledTropical Data Center Testbed
Duc Van Le∗
Computer Science & Engineering
Nanyang Technological University
Singapore
Yingbo Liu∗
Computer Science & Engineering
Nanyang Technological University
Singapore
Rongrong WangComputer Science & Engineering
Nanyang Technological University
Singapore
Rui Tan†
Computer Science & Engineering
Nanyang Technological University
Singapore
Lek Heng NgohInfo-communications Media
Development Authority
Singapore
ABSTRACT
The air free-cooling has been long thought infeasible in tropics due
to the unique challenges of year-round high ambient temperature
and relative humidity. In recent years, the increasing availability
of servers that can tolerate higher temperatures and relative hu-
midity levels sheds light upon the feasibility of the air free-cooling
to enhance the data center energy efficiency. However, building an
air free-cooled data center in the tropics requires extensive exper-
iments to understand the details of how the tropical environment
conditions will affect data center power consumption, computing
throughput, and server hardware reliability. Thus, together with
multiple partners in data center industry and research, we con-
ducted a project that designs, builds, and experiments with an air
free-cooled data center testbed consisting of three server rooms
hosting 12 server racks with 60 kW total power rating. This pa-
per presents the key observations, experiences and learned lessons
obtained from our project. The experiments show that (1) the air
free-cooling design that uses fans only can reduce the power us-
age effectiveness (PUE) by 38%, compared to the global average
PUE, (2) the tropics’ year-round high temperatures up to 37°C do
not impede the air free-cooling, and (3) the implementation of the
air free-cooled data centers in tropics requires special cares to deal
with airborne contaminants to avoid fast corrosion rate and dust-
induced server faults.
CCS CONCEPTS
• Applied computing → Data centers; • General and refer-
ence→ Experimentation.
∗The first two authors contributed equally to this research.†Corresponding author.
Permission to make digital or hard copies of all or part of this work for personal orclassroom use is granted without fee provided that copies are not made or distributedfor profit or commercial advantage and that copies bear this notice and the full cita-tion on the first page. Copyrights for components of this work owned by others thanACMmust be honored. Abstracting with credit is permitted. To copy otherwise, or re-publish, to post on servers or to redistribute to lists, requires prior specific permissionand/or a fee. Request permissions from [email protected].
BuildSys ’20, November 18–20, 2020, Virtual Event, Japan
© 2020 Association for Computing Machinery.ACM ISBN 978-1-4503-8061-4/20/11. . . $15.00https://doi.org/10.1145/3408308.3427628
KEYWORDS
Data center, free cooling, performance, reliability
ACM Reference Format:
Duc Van Le, Yingbo Liu, Rongrong Wang, Rui Tan, and Lek Heng Ngoh.
2020. Experiences and Learned Lessons from an Air Free-Cooled Tropi-
cal Data Center Testbed. In The 7th ACM International Conference on Sys-
tems for Energy-Efficient Buildings, Cities, and Transportation (BuildSys ’20),
November 18–20, 2020, Virtual Event, Japan. ACM, New York, NY, USA,
10 pages. https://doi.org/10.1145/3408308.3427628
1 INTRODUCTION
Air free-cooling that utilizes outside cold air to cool the informa-
tion technology (IT) equipment has been increasingly used to im-
prove the energy efficiency of data centers (DCs) [3]. However, air
free-cooling in the tropics has been long thought infeasible from
the intuition that the high temperature and relative humidity (RH)
of the air supplied to the servers will undermine their performance
and reliability. On the other hand, the American Society of Heat-
ing, Refrigeration and Air-Conditioning Engineers (ASHRAE) has
been working for years on expanding the suggested allowable tem-
perature and RH ranges for IT equipment. For instance, the servers
compliant with ASHRAE’s Class A3 can operate continuously and
reliably when the temperature and RH of the supply air are up to
40°C and 90%, respectively. This sheds light on the possibility of
air free-cooled DCs in tropical climate since the maximum record
temperature in our tropical region, i.e., Singapore, is 37°C only and
the ambient RH is in general lower than 90%.
However, the ASHRAE’s relaxed temperature and RH require-
ments are for traditional DCs that recirculate the clean air within
the enclosed DC building only. The air free-cooled DCs that con-
tinuously bring the outside air into the server rooms will intro-
duce extra challenges due to various affecting factors such as the
ambient temperature and RH, air volume flow rate, and cleanness
level of the supply air. Therefore, it is essential to investigate the
details of how the affecting factors of tropical environment condi-
tions will affect DC power consumption, and the computing per-
formance and reliability of the IT equipment. To achieve the goal,
together with multiple partners in DC industry and research, we
designed, constructed, and experimented with an air free-cooled
BuildSys ’20, November 18–20, 2020, Virtual Event, Japan Le and Liu, et al.
DC testbed consisting of three server rooms located in two DC
operators’ premises that are in Singapore. The testbed hosts 12
server racks with 60 kW total power rating. We have conducted
18-month experiments on the built testbed, in which the cooling
conditions (e.g., cold aisle temperature and air flow rate setpoints)
and the server operating parameters (e.g., CPU utilization, hard
disk drive (HDD) read/write speed, and memory copying param-
eters) are controlled in specified ranges. During the experiments,
various types of sensor data, including environmental, energy, per-
formance, and reliability measurements are collected to analyze
the impact of different environmental conditions on DC energy ef-
ficiency, hardware reliability, and computing performance.
Several DC providers such as Facebook and Google have used
the air free-cooling to improve the energy efficiency of their DCs.
However, they often use the air free-cooling only for cold and dry
locations where the climate allows the outside air to be used to
cool the server in the major time of the year. For instance, Face-
book has built free-cooled DCs in Prineville, Oregon and reported
an annualized power usage effectiveness (PUE) of 1.07 [9]. How-
ever, Facebook does not release any technical details. To the best
of our knowledge, this is the first work that experiments with a
real air free-cooled DC tesbted with failures of hardware compo-
nents allowed under controllable and challenging environmental
conditions. A number of works [2, 7, 10] have studied the impact
of DC operating environment condition on the performance and
reliability of servers. Sensor networks have been deployed in DCs
to achieve real-time monitoring of servers’ ambient conditions [5,
6]. For example, the Microsoft researchers [6] implemented a DC
Genome system using wireless sensors called Genomotes to moni-
tor the environmental conditions in their production data centers.
However, those works mostly relied on the data collected from
production DCs. Therefore, their observations may not cover the
impact of all possible temperature conditions under the free cool-
ing in the tropics. In addition, several studies [2, 8] have set up
DC testbeds using thermal chambers to evaluate the impact of the
high temperatures on servers’ performance. However, the tightly
controlled environments in the small-scale thermal chambers fall
short of capturing a full spectrum of affecting factors in the real
air free-cooling setup.
Different from those existing works that study impacts of the
temperature on the server’s performance and reliability, our work
builds a real air free-cooled DC testbed and conducts experiments
spanned 18 months to capture many realistic affecting factors, in-
cluding the temperature, RH, air volume flow rate, and supply air’s
corrosive gases and dusts. Our experimental results measured by
physical sensors monitoring environmental conditions and power
usage, as well as servers’ built-in sensors provide the details of how
the realistic tropical environment conditions affect DC power con-
sumption, computing throughput, and server hardware reliability.
In this paper, from our experiments on the testbed, we draw the
key observations, experiences and learned lessons as follows.
• The air free-cooling design that uses fans only to control the
volume flow rate of the outside air supplied to the servers
can reduce the PUE by 38%, compared with the global aver-
age PUE of 1.7 [4].
• The servers can operate without computing performance
degradation under combined impact of various realistic fac-
tors, including temperature up to 37°C and RH above 90%.
In other words, the tropics’ year-round high temperatures
up to 37°C do not impede the air free-cooling in the tropics.
• The implementation of the air free-cooled DCs in tropics
requires special cares to deal with airborne contaminants
to avoid fast corrosion rate and dust-induced server faults.
• The existing DCs operated in enclosed buildings can increase
their temperature setpoints for better energy efficiency with-
out degrading server computing performance.
The remainder of this paper is organized as follows. Section 2 de-
scribes the design and construction of the testbed. Section 3 presents
the experiments on the testbed and the key results of server per-
formance and energy usage. Section 4 details the IT equipment
failures occurred during the course of the experiments. Section 5
presents the learned lessons and discusses several issues. Section 6
concludes this paper.
2 DESIGN AND CONSTRUCTION OF TESTBED
This section describes the design of the testbed and our experi-
ences in constructing and configuring the testbed.
2.1 Design of Testbed
We design the testbed with three objectives. First, on the testbed,
we can maintain the condition of the air supplied to the IT equip-
ment at a certain setpoint for a period of time (e.g., several days).
The condition includes three aspects that are often considered im-
portant for IT equipment performance and reliability, i.e., temper-
ature, RH, and air volume flow rate. The setpoint can be adjusted
within a wide range, such that we can evaluate the performance
of the IT equipment under various conditions. In other words, we
can run the testbed in a controlled mode. However, we later found
that RH control in a wide range is difficult, which will be discussed
shortly. Second, we can run the testbed in an uncontrolledmode, in
that we just use the outside air without adjusting its condition to
take away the heat generated by the IT equipment. We aim to run
the testbed in this uncontrolled mode for an extended period of
time to understand the direct impact of the outside air on the IT
equipment and the achievable energy saving. Third, the testbed
should include a standard server room with well controlled condi-
tions to generate the baseline results.
To meet the above three objectives, we design a testbed consist-
ing of three server rooms that are referred to as Room-A, Room-B,
and Room-C in this paper. Room-A and Room-B are two side-by-
side purposely built server rooms to support the aforementioned
controlled and uncontrolled experiments. The side-by-side arrange-
ment makes sure that they will inhale outside air with the same
condition, enabling comparative experiments. We built these two
server rooms in the premise of a commercial colocation DC opera-
tor that is referred to as Operator-A in this paper. As such, we may
leverage the domain expertise of Operator-A in facility manage-
ment, 24/7 monitoring, security assurance, emergency response,
and etc. Room-C is a standard server room operated by another
commercial colocation DC operator that is referred to as Operator-
B in this paper.
Experiences and Learned Lessons from an Air Free-Cooled Tropical Data Center Testbed BuildSys ’20, November 18–20, 2020, Virtual Event, Japan
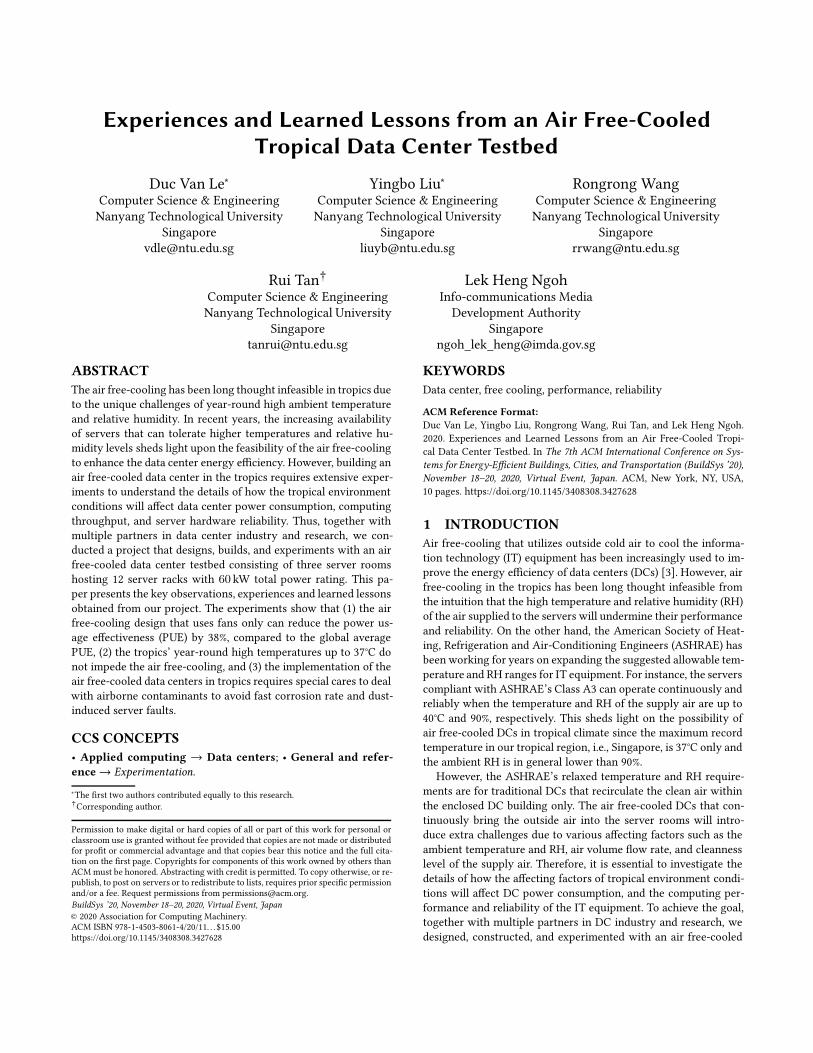
Figure 1: Feasibility of temperature/RH setpoints dur-
ing Jul and Aug 2018 in the testbed area.
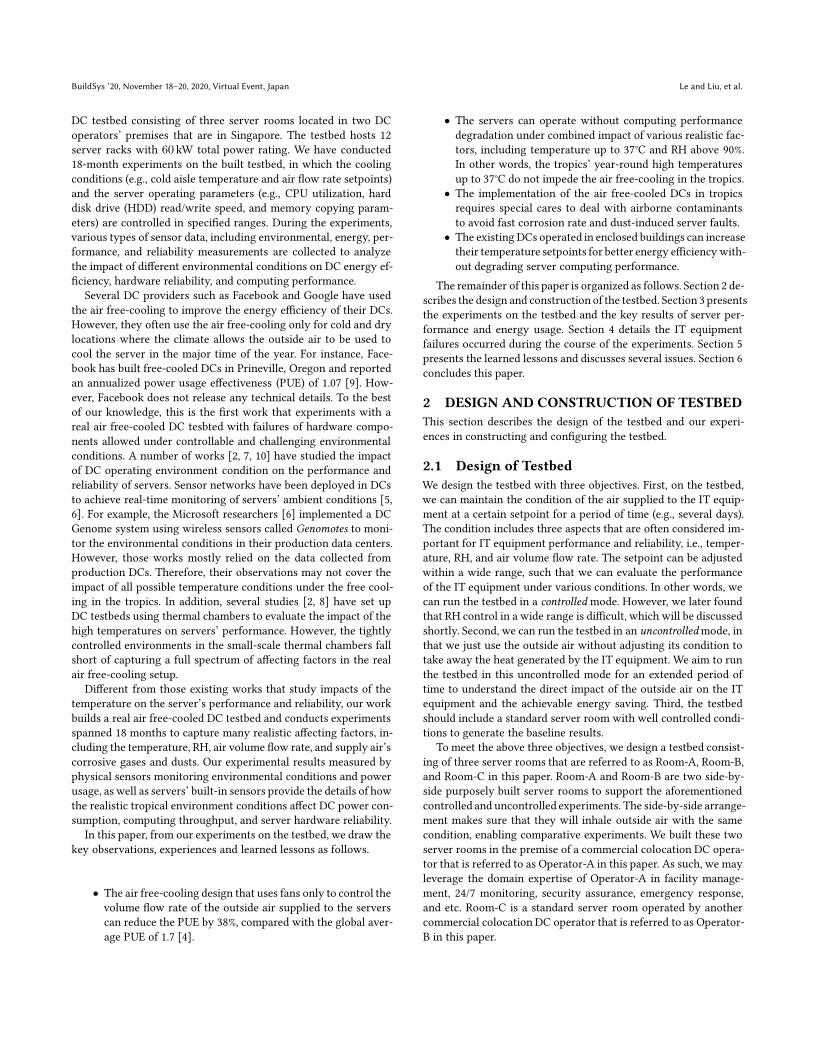
Figure 2: Design of Room-A/B.
Room-B does not have heater.
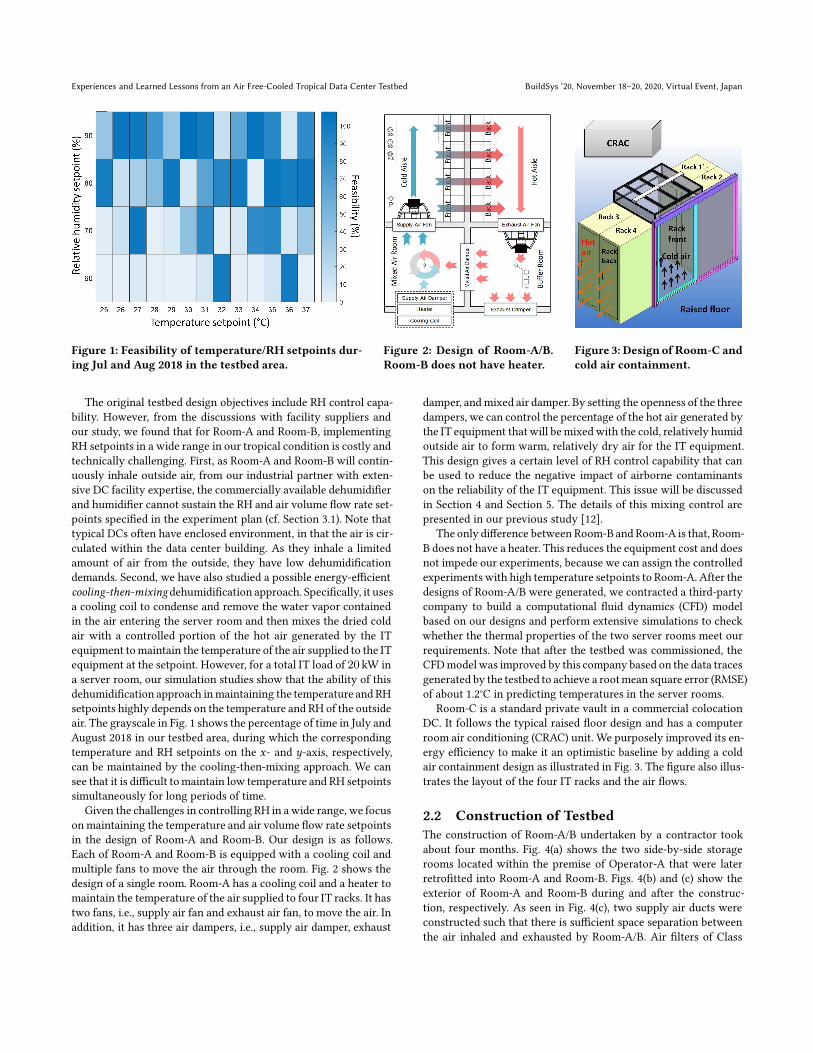
Figure 3: DesignofRoom-C and
cold air containment.
The original testbed design objectives include RH control capa-
bility. However, from the discussions with facility suppliers and
our study, we found that for Room-A and Room-B, implementing
RH setpoints in a wide range in our tropical condition is costly and
technically challenging. First, as Room-A and Room-B will contin-
uously inhale outside air, from our industrial partner with exten-
sive DC facility expertise, the commercially available dehumidifier
and humidifier cannot sustain the RH and air volume flow rate set-
points specified in the experiment plan (cf. Section 3.1). Note that
typical DCs often have enclosed environment, in that the air is cir-
culated within the data center building. As they inhale a limited
amount of air from the outside, they have low dehumidification
demands. Second, we have also studied a possible energy-efficient
cooling-then-mixingdehumidification approach. Specifically, it uses
a cooling coil to condense and remove the water vapor contained
in the air entering the server room and then mixes the dried cold
air with a controlled portion of the hot air generated by the IT
equipment tomaintain the temperature of the air supplied to the IT
equipment at the setpoint. However, for a total IT load of 20 kW in
a server room, our simulation studies show that the ability of this
dehumidification approach inmaintaining the temperature and RH
setpoints highly depends on the temperature and RH of the outside
air. The grayscale in Fig. 1 shows the percentage of time in July and
August 2018 in our testbed area, during which the corresponding
temperature and RH setpoints on the G- and ~-axis, respectively,
can be maintained by the cooling-then-mixing approach. We can
see that it is difficult tomaintain low temperature and RH setpoints
simultaneously for long periods of time.
Given the challenges in controlling RH in awide range, we focus
onmaintaining the temperature and air volume flow rate setpoints
in the design of Room-A and Room-B. Our design is as follows.
Each of Room-A and Room-B is equipped with a cooling coil and
multiple fans to move the air through the room. Fig. 2 shows the
design of a single room. Room-A has a cooling coil and a heater to
maintain the temperature of the air supplied to four IT racks. It has
two fans, i.e., supply air fan and exhaust air fan, to move the air. In
addition, it has three air dampers, i.e., supply air damper, exhaust
damper, andmixed air damper. By setting the openness of the three
dampers, we can control the percentage of the hot air generated by
the IT equipment that will bemixedwith the cold, relatively humid
outside air to form warm, relatively dry air for the IT equipment.
This design gives a certain level of RH control capability that can
be used to reduce the negative impact of airborne contaminants
on the reliability of the IT equipment. This issue will be discussed
in Section 4 and Section 5. The details of this mixing control are
presented in our previous study [12].
The only difference between Room-Band Room-A is that, Room-
B does not have a heater. This reduces the equipment cost and does
not impede our experiments, because we can assign the controlled
experiments with high temperature setpoints to Room-A. After the
designs of Room-A/B were generated, we contracted a third-party
company to build a computational fluid dynamics (CFD) model
based on our designs and perform extensive simulations to check
whether the thermal properties of the two server rooms meet our
requirements. Note that after the testbed was commissioned, the
CFDmodelwas improved by this company based on the data traces
generated by the testbed to achieve a rootmean square error (RMSE)
of about 1.2°C in predicting temperatures in the server rooms.
Room-C is a standard private vault in a commercial colocation
DC. It follows the typical raised floor design and has a computer
room air conditioning (CRAC) unit. We purposely improved its en-
ergy efficiency to make it an optimistic baseline by adding a cold
air containment design as illustrated in Fig. 3. The figure also illus-
trates the layout of the four IT racks and the air flows.
2.2 Construction of Testbed
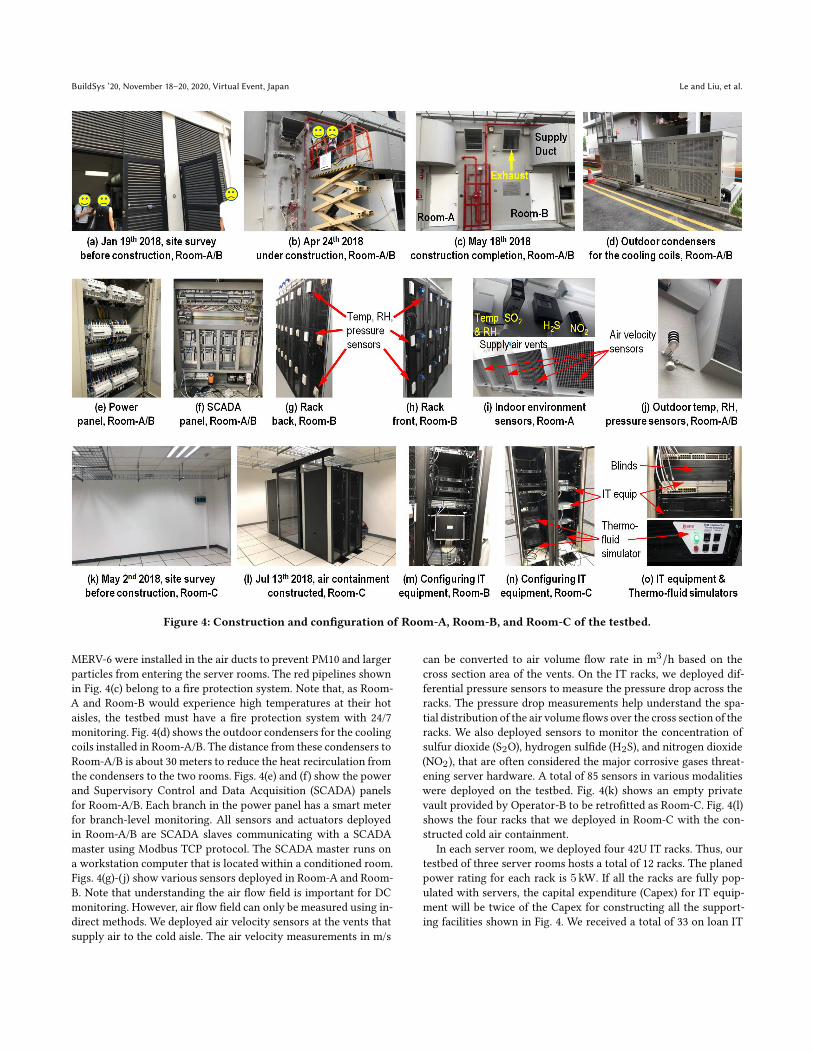
The construction of Room-A/B undertaken by a contractor took
about four months. Fig. 4(a) shows the two side-by-side storage
rooms located within the premise of Operator-A that were later
retrofitted into Room-A and Room-B. Figs. 4(b) and (c) show the
exterior of Room-A and Room-B during and after the construc-
tion, respectively. As seen in Fig. 4(c), two supply air ducts were
constructed such that there is sufficient space separation between
the air inhaled and exhausted by Room-A/B. Air filters of Class
BuildSys ’20, November 18–20, 2020, Virtual Event, Japan Le and Liu, et al.
Figure 4: Construction and configuration of Room-A, Room-B, and Room-C of the testbed.
MERV-6 were installed in the air ducts to prevent PM10 and larger
particles from entering the server rooms. The red pipelines shown
in Fig. 4(c) belong to a fire protection system. Note that, as Room-
A and Room-B would experience high temperatures at their hot
aisles, the testbed must have a fire protection system with 24/7
monitoring. Fig. 4(d) shows the outdoor condensers for the cooling
coils installed in Room-A/B. The distance from these condensers to
Room-A/B is about 30 meters to reduce the heat recirculation from
the condensers to the two rooms. Figs. 4(e) and (f) show the power
and Supervisory Control and Data Acquisition (SCADA) panels
for Room-A/B. Each branch in the power panel has a smart meter
for branch-level monitoring. All sensors and actuators deployed
in Room-A/B are SCADA slaves communicating with a SCADA
master using Modbus TCP protocol. The SCADA master runs on
a workstation computer that is located within a conditioned room.
Figs. 4(g)-(j) show various sensors deployed in Room-A and Room-
B. Note that understanding the air flow field is important for DC
monitoring. However, air flow field can only be measured using in-
direct methods. We deployed air velocity sensors at the vents that
supply air to the cold aisle. The air velocity measurements in m/s
can be converted to air volume flow rate in m3/h based on the
cross section area of the vents. On the IT racks, we deployed dif-
ferential pressure sensors to measure the pressure drop across the
racks. The pressure drop measurements help understand the spa-
tial distribution of the air volume flows over the cross section of the
racks. We also deployed sensors to monitor the concentration of
sulfur dioxide (S2O), hydrogen sulfide (H2S), and nitrogen dioxide
(NO2), that are often considered the major corrosive gases threat-
ening server hardware. A total of 85 sensors in various modalities
were deployed on the testbed. Fig. 4(k) shows an empty private
vault provided by Operator-B to be retrofitted as Room-C. Fig. 4(l)
shows the four racks that we deployed in Room-C with the con-
structed cold air containment.
In each server room, we deployed four 42U IT racks. Thus, our
testbed of three server rooms hosts a total of 12 racks. The planed
power rating for each rack is 5 kW. If all the racks are fully pop-
ulated with servers, the capital expenditure (Capex) for IT equip-
ment will be twice of the Capex for constructing all the support-
ing facilities shown in Fig. 4. We received a total of 33 on loan IT
Experiences and Learned Lessons from an Air Free-Cooled Tropical Data Center Testbed BuildSys ’20, November 18–20, 2020, Virtual Event, Japan
devices from four major IT equipment manufacturers as their con-
tributions to this research project. We deployed the same set of
11 IT devices in each server room, as shown in Figs. 4(n) and (o).
As the racks are not fully populated, to increase cooling efficiency,
we applied blinds as shown in Fig. 4(o) on the empty rack slots.
Moreover, to increase the power consumption of the IT racks for
realism of the experiments, we deployed four in-rack thermo-fluid
simulators in each of Room-A and Room-B, and eight in Room-C,
as shown in Fig. 4(n). The thermo-fluid simulator can be config-
ured manually to consume a certain power among multiple dis-
crete levels up to 5 kW. With the thermo-fluid simulators, we can
reduce the Capex of the testbed,while maintain its realism in terms
of power consumption and heat generation. Thanks to Operator-
A’s and Operator-B’s provision of the spaces as their contributions
to the project, the operating expenditure (Opex) of the testbed is
mainly the energy charge. The Opex of the testbed over about 1.5
years is about 10% of the Capex for constructing the testbed.
2.3 Configuration of Testbed
We configured all servers and network switches/routers so that we
can easily control their operations for experiments. Moreover, as
all the three server rooms are located in the premises ofOperator-A
and Operator-B, it is desirable that we can access all IT equipment
and the supporting facilities remotely from our university campus.
The remote access should be configured prudently with cybersecu-
rity always in the mind. Although the IT equipment on the testbed
will not be used for production, we have a major concern regard-
ing cyber-attacks that take over the SCADA system to damage the
costly supporting facilities and/or use the facilities to create safety
incidents (e.g., fires by the heater).
We installed the unmodified CentOS v6.9 GNU/Linux on all the
servers and configured the switches to form an Intranet in a fat
tree topology. We configured three routers on our testbed to use
three public IPv4 addresses. Once we made our routers publicly
accessible, we observed multiple rounds of port scanning from the
Internet, which is often the first step of cyber-attacks. We applied a
whitelist of accessible ports and remote host IP addresses to restrict
the access. The SCADAmaster provides a password-protectedweb
interface to access real-time or historical sensor data and adjust the
setpoints of actuators (heater, supply/exhaust fans, air dampers,
and cooling coils). The SCADAmaster was configured to useHTTPS
protocol for the web interface to ensure the integrity and confiden-
tiality of the communications between the testbed and our campus.
We developed a set of BASH scripts to control andmonitor servers’
running status. (1) For CPU status control, we use cpulimit v0.2 to
maintain the utilization of each physical core of a CPU at a spec-
ified level. Then, we use a customized LINPACK benchmark pro-
vided by the CPU vendor to measure the CPU performance. (2) For
hard disk drive (HDD) status control, we use the cgroups to main-
tain the read/write throughput of the HDDs configured to operate
in the RAID0 mode. Then, we use fio to generate HDD read/write
requests. (3) For memory status control, we use memtester to gen-
erate test traffic and find memory faults. (4) For server status mon-
itoring, we use nine tools: cpupower, edas-utils, impitool, sar,
rsyslog, smartmontools, lm_sensor, bmc, and fio. Note thatmany
of these tools are based on the Intelligent Platform Management
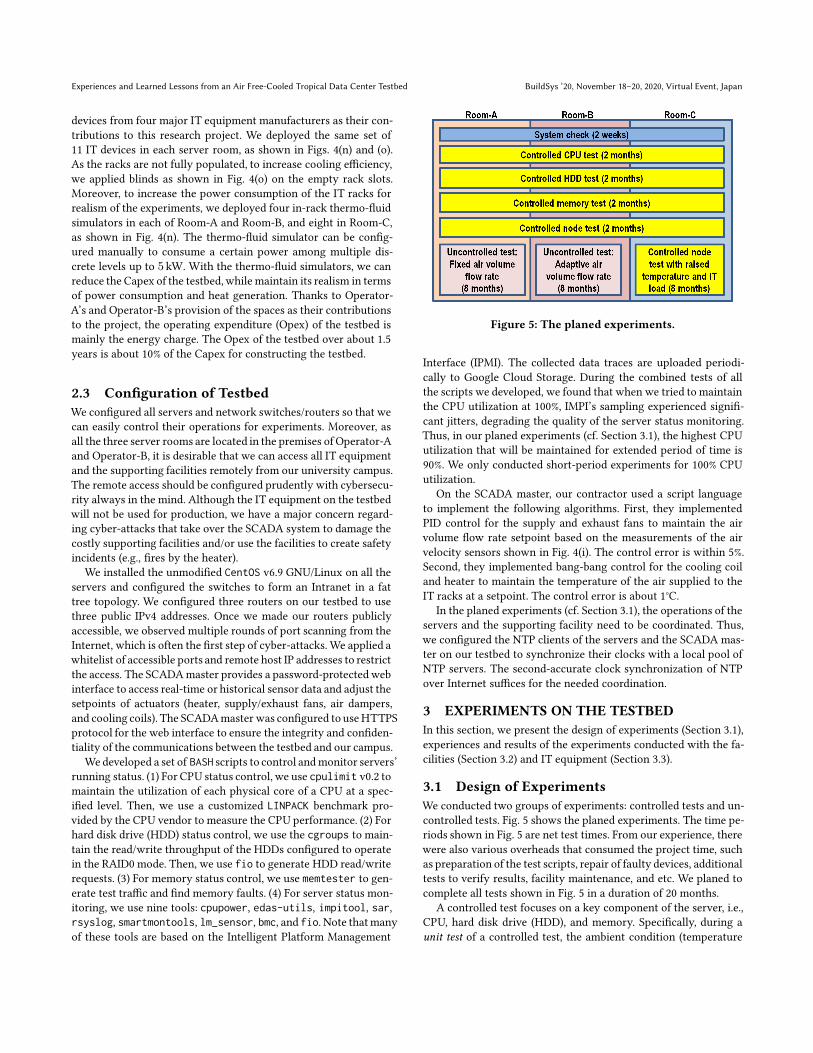
Figure 5: The planed experiments.
Interface (IPMI). The collected data traces are uploaded periodi-
cally to Google Cloud Storage. During the combined tests of all
the scripts we developed, we found that when we tried to maintain
the CPU utilization at 100%, IMPI’s sampling experienced signifi-
cant jitters, degrading the quality of the server status monitoring.
Thus, in our planed experiments (cf. Section 3.1), the highest CPU
utilization that will be maintained for extended period of time is
90%. We only conducted short-period experiments for 100% CPU
utilization.
On the SCADA master, our contractor used a script language
to implement the following algorithms. First, they implemented
PID control for the supply and exhaust fans to maintain the air
volume flow rate setpoint based on the measurements of the air
velocity sensors shown in Fig. 4(i). The control error is within 5%.
Second, they implemented bang-bang control for the cooling coil
and heater to maintain the temperature of the air supplied to the
IT racks at a setpoint. The control error is about 1°C.
In the planed experiments (cf. Section 3.1), the operations of the
servers and the supporting facility need to be coordinated. Thus,
we configured the NTP clients of the servers and the SCADA mas-
ter on our testbed to synchronize their clocks with a local pool of
NTP servers. The second-accurate clock synchronization of NTP
over Internet suffices for the needed coordination.
3 EXPERIMENTS ON THE TESTBED
In this section, we present the design of experiments (Section 3.1),
experiences and results of the experiments conducted with the fa-
cilities (Section 3.2) and IT equipment (Section 3.3).
3.1 Design of Experiments
We conducted two groups of experiments: controlled tests and un-
controlled tests. Fig. 5 shows the planed experiments. The time pe-
riods shown in Fig. 5 are net test times. From our experience, there
were also various overheads that consumed the project time, such
as preparation of the test scripts, repair of faulty devices, additional
tests to verify results, facility maintenance, and etc. We planed to
complete all tests shown in Fig. 5 in a duration of 20 months.
A controlled test focuses on a key component of the server, i.e.,
CPU, hard disk drive (HDD), and memory. Specifically, during a
unit test of a controlled test, the ambient condition (temperature
BuildSys ’20, November 18–20, 2020, Virtual Event, Japan Le and Liu, et al.
Table 1: Experiment settings for controlled experiments.
Parameters Minimum Maximum Step Size
Inlet air temperature 25°C 37°C 1°C
Air flow rate* 2500m3/h 12500m3/h 2500m3/h
Servers’ CPU utilization 10% 90% 20%
Hard disk read/write speed 10 MB/sec 100 MB/sec 20 MB/sec
Memory block size 8 kB, 16 kB, 32 kB, 64 kB, 128 kB, 256 kB
*Applicable for Room-A and Room-B only.
and air volume flow rate) and the operating status of the tested
component are maintained at a certain level for one hour. A con-
trolled test consists of hundreds of unit tests with all combinations
of the server room ambient condition and server component sta-
tus each swiping the respective range summarized in Table 1. Note
that the maximum temperature setpoint of 37 °C is the record max-
imum ambient temperature in Singapore. During the controlled
node test, we simultaneously vary the operating status of CPU,
HDD, and memory. For the first four controlled tests in Room-C,
the temperature setpoint for the return hot air is set to be 20°C as
suggested by Operator-B. The CRAC unit controls the volume flow
rate of the cold air supplied to the four racks. In the last controlled
test in Room-C, we vary the temperature setpoint from 21°C to
35°C with step size of 1°C and the total power of eight thermo-fluid
simulators within [10 kW, 20 kW, 30 kW, 35 kW]. The controlled
tests allow us to understand the performance and thermal safety
of the IT equipment under various conditions.
There are two uncontrolled tests in which the air inhaled by
Room-A and Room-B are not conditioned by cooling coils and heater.
Thus, the servers experience the ambient temperature and RH. In
the uncontrolled test in Room-A, we fix the air volume flow rate
to a setting that ensures no overheating on the IT racks. This set-
ting is determined from the test results obtained in the controlled
tests with the most extreme condition (i.e., 37°C and full utilization
of servers). In the uncontrolled test in Room-B, we adapt the air
volume flow rate to the outside temperature. The adaptation logic
is designed based on the controlled test results. The uncontrolled
tests allow us to assess the energy saving that can be achieved by
the air free-cooling design in our tropical condition.
3.2 Experiments with Facilities
In this section, we discuss several important issues in operating
the supporting facilities and the key measurement results.
3.2.1 Dew point prevention. During the controlled experiments,
the cooling coils are used to maintain the cold aisle temperature
at the setpoint. When the outside air is hot and humid (e.g., before
an afternoon rainfall), the temperature of the cooled air leaving the
cooling coil may reach the dew point. In fact, we did see drained
water from the cooling coil, which is an indication of 100% RH
for the cooled air. As such, the saturated cold air may condense
on a colder surface. If such condensation occurs on the printed
circuit boards (PCBs) of the IT equipment, the resulted short cir-
cuits may damage the IT equipment. Although this concern can
be mitigated by the fact that the heat generated by the IT equip-
ment will increase the temperature and thus decrease the RH of
the air passing through the IT equipment, for the safety of the IT
July 01 July 14 July 28 Aug 11 Aug 25 Sep 08 Sep 22 Oct 06 Oct 20
Time
20
25
30
35
40
Tem
pera
ture
(oC
)
Outside Temperature Dewpoint
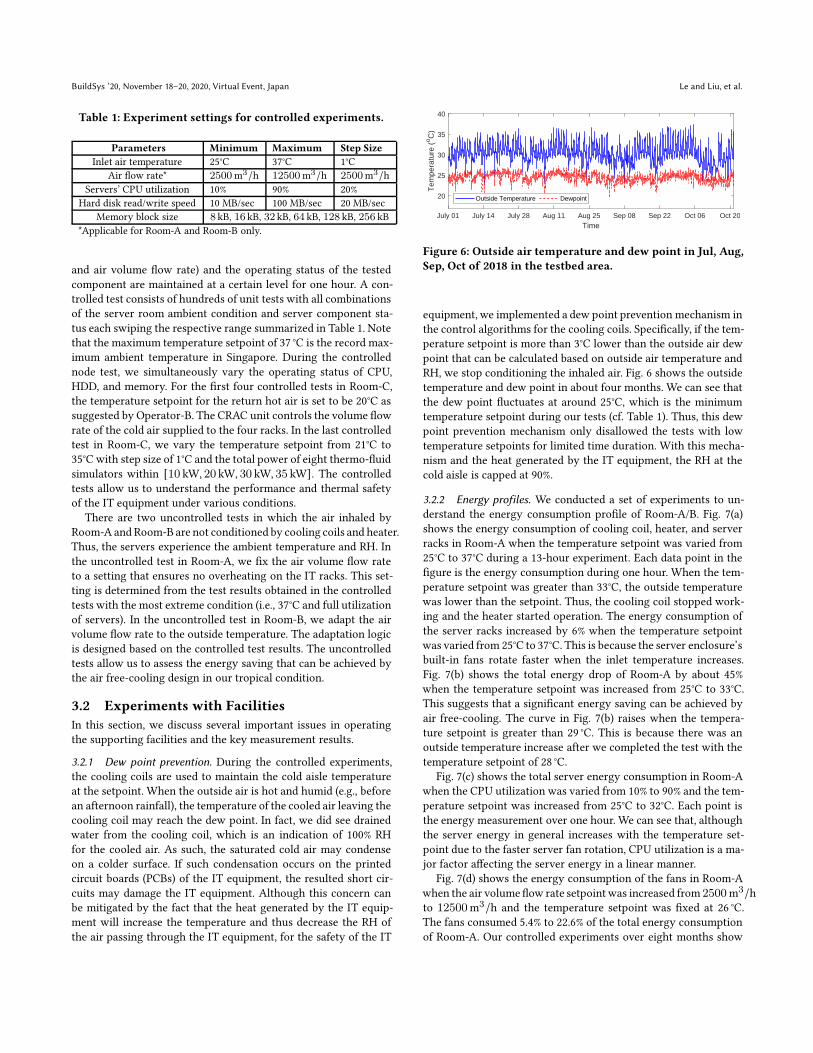
Figure 6: Outside air temperature and dew point in Jul, Aug,
Sep, Oct of 2018 in the testbed area.
equipment, we implemented a dew point prevention mechanism in
the control algorithms for the cooling coils. Specifically, if the tem-
perature setpoint is more than 3°C lower than the outside air dew
point that can be calculated based on outside air temperature and
RH, we stop conditioning the inhaled air. Fig. 6 shows the outside
temperature and dew point in about four months. We can see that
the dew point fluctuates at around 25°C, which is the minimum
temperature setpoint during our tests (cf. Table 1). Thus, this dew
point prevention mechanism only disallowed the tests with low
temperature setpoints for limited time duration. With this mecha-
nism and the heat generated by the IT equipment, the RH at the
cold aisle is capped at 90%.
3.2.2 Energy profiles. We conducted a set of experiments to un-
derstand the energy consumption profile of Room-A/B. Fig. 7(a)
shows the energy consumption of cooling coil, heater, and server
racks in Room-A when the temperature setpoint was varied from
25°C to 37°C during a 13-hour experiment. Each data point in the
figure is the energy consumption during one hour. When the tem-
perature setpoint was greater than 33°C, the outside temperature
was lower than the setpoint. Thus, the cooling coil stopped work-
ing and the heater started operation. The energy consumption of
the server racks increased by 6% when the temperature setpoint
was varied from 25°C to 37°C. This is because the server enclosure’s
built-in fans rotate faster when the inlet temperature increases.
Fig. 7(b) shows the total energy drop of Room-A by about 45%
when the temperature setpoint was increased from 25°C to 33°C.
This suggests that a significant energy saving can be achieved by
air free-cooling. The curve in Fig. 7(b) raises when the tempera-
ture setpoint is greater than 29 °C. This is because there was an
outside temperature increase after we completed the test with the
temperature setpoint of 28 °C.
Fig. 7(c) shows the total server energy consumption in Room-A
when the CPU utilization was varied from 10% to 90% and the tem-
perature setpoint was increased from 25°C to 32°C. Each point is
the energy measurement over one hour. We can see that, although
the server energy in general increases with the temperature set-
point due to the faster server fan rotation, CPU utilization is a ma-
jor factor affecting the server energy in a linear manner.
Fig. 7(d) shows the energy consumption of the fans in Room-A
when the air volumeflow rate setpointwas increased from 2500m3/h
to 12500m3/h and the temperature setpoint was fixed at 26 °C.
The fans consumed 5.4% to 22.6% of the total energy consumption
of Room-A. Our controlled experiments over eight months show
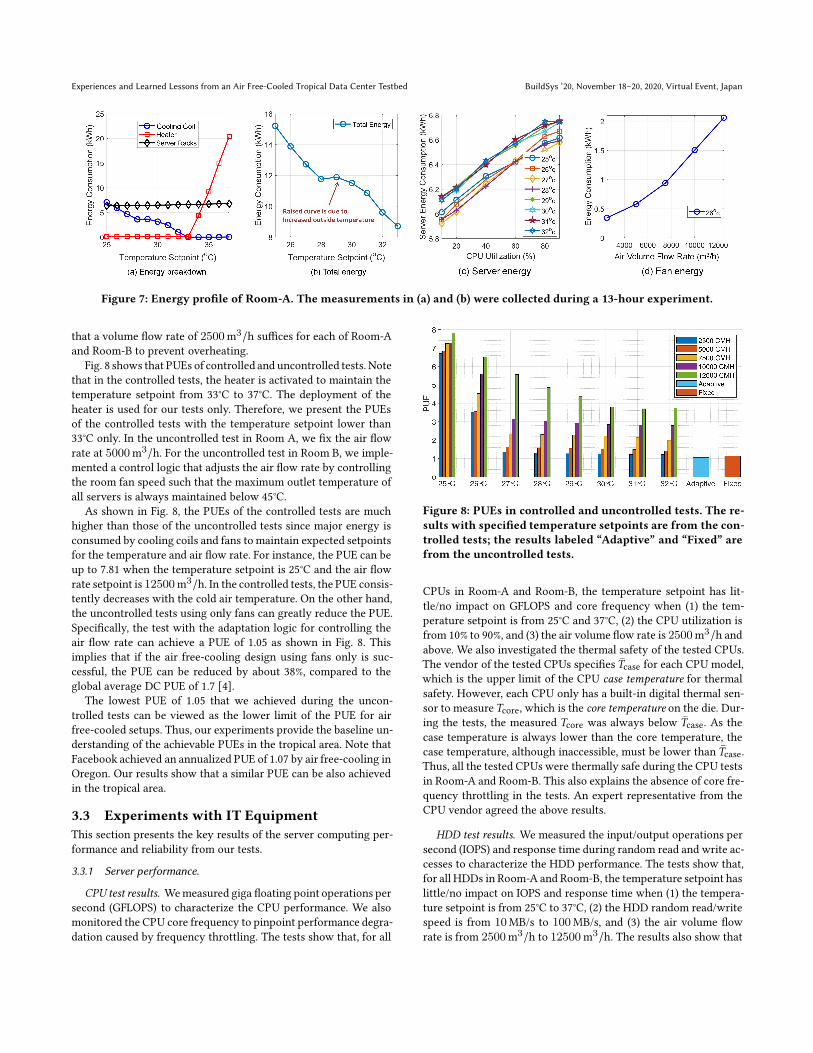
Experiences and Learned Lessons from an Air Free-Cooled Tropical Data Center Testbed BuildSys ’20, November 18–20, 2020, Virtual Event, Japan
Figure 7: Energy profile of Room-A. The measurements in (a) and (b) were collected during a 13-hour experiment.
that a volume flow rate of 2500m3/h suffices for each of Room-A
and Room-B to prevent overheating.
Fig. 8 shows that PUEs of controlled and uncontrolled tests. Note
that in the controlled tests, the heater is activated to maintain the
temperature setpoint from 33°C to 37°C. The deployment of the
heater is used for our tests only. Therefore, we present the PUEs
of the controlled tests with the temperature setpoint lower than
33°C only. In the uncontrolled test in Room A, we fix the air flow
rate at 5000m3/h. For the uncontrolled test in Room B, we imple-
mented a control logic that adjusts the air flow rate by controlling
the room fan speed such that the maximum outlet temperature of
all servers is always maintained below 45°C.
As shown in Fig. 8, the PUEs of the controlled tests are much
higher than those of the uncontrolled tests since major energy is
consumed by cooling coils and fans to maintain expected setpoints
for the temperature and air flow rate. For instance, the PUE can be
up to 7.81 when the temperature setpoint is 25°C and the air flow
rate setpoint is 12500m3/h. In the controlled tests, the PUE consis-
tently decreases with the cold air temperature. On the other hand,
the uncontrolled tests using only fans can greatly reduce the PUE.
Specifically, the test with the adaptation logic for controlling the
air flow rate can achieve a PUE of 1.05 as shown in Fig. 8. This
implies that if the air free-cooling design using fans only is suc-
cessful, the PUE can be reduced by about 38%, compared to the
global average DC PUE of 1.7 [4].
The lowest PUE of 1.05 that we achieved during the uncon-
trolled tests can be viewed as the lower limit of the PUE for air
free-cooled setups. Thus, our experiments provide the baseline un-
derstanding of the achievable PUEs in the tropical area. Note that
Facebook achieved an annualized PUE of 1.07 by air free-cooling in
Oregon. Our results show that a similar PUE can be also achieved
in the tropical area.
3.3 Experiments with IT Equipment
This section presents the key results of the server computing per-
formance and reliability from our tests.
3.3.1 Server performance.
CPU test results. Wemeasured giga floating point operations per
second (GFLOPS) to characterize the CPU performance. We also
monitored the CPU core frequency to pinpoint performance degra-
dation caused by frequency throttling. The tests show that, for all
Figure 8: PUEs in controlled and uncontrolled tests. The re-
sults with specified temperature setpoints are from the con-
trolled tests; the results labeled “Adaptive” and “Fixed” are
from the uncontrolled tests.
CPUs in Room-A and Room-B, the temperature setpoint has lit-
tle/no impact on GFLOPS and core frequency when (1) the tem-
perature setpoint is from 25°C and 37°C, (2) the CPU utilization is
from 10% to 90%, and (3) the air volume flow rate is 2500m3/h and
above. We also investigated the thermal safety of the tested CPUs.
The vendor of the tested CPUs specifies )̄case for each CPU model,
which is the upper limit of the CPU case temperature for thermal
safety. However, each CPU only has a built-in digital thermal sen-
sor to measure)core, which is the core temperature on the die. Dur-
ing the tests, the measured )core was always below )̄case. As the
case temperature is always lower than the core temperature, the
case temperature, although inaccessible, must be lower than )̄case.
Thus, all the tested CPUs were thermally safe during the CPU tests
in Room-A and Room-B. This also explains the absence of core fre-
quency throttling in the tests. An expert representative from the
CPU vendor agreed the above results.
HDD test results. We measured the input/output operations per
second (IOPS) and response time during random read and write ac-
cesses to characterize the HDD performance. The tests show that,
for all HDDs in Room-A and Room-B, the temperature setpoint has
little/no impact on IOPS and response time when (1) the tempera-
ture setpoint is from 25°C to 37°C, (2) the HDD random read/write
speed is from 10MB/s to 100MB/s, and (3) the air volume flow
rate is from 2500m3/h to 12500m3/h. The results also show that
BuildSys ’20, November 18–20, 2020, Virtual Event, Japan Le and Liu, et al.
the HDD random read/write speed has little impact on the server
energy consumption.
Memory test results. We measured the speed of copying a large
amount of data from a user space memory area to another area
using various block sizes to characterize the memory performance.
We use cyclic redundancy check (CRC) to verify the integrity of the
data copying. The tests show that, for all memories in Room-A and
Room-B, the temperature setpoint has little/no impact on memory
speed when (1) the temperature setpoint is from 25°C to 37°C, (2)
the block size setting is from 8 kB to 256 kB, and (3) the air volume
flow rate is from 2500m3/h to 12500m3/h. No CRC verification
errors occurred during the tests. The results also show that the
memory speed has little impact on the server energy consumption.
Node test results. We tested the CPU, HDD, and memory simul-
taneously under a total of six server status levels. At the first level
where the server has light workload and the sixth level where the
server is stressed, the CPU utilization, HDD read/write speed, and
memory block size in data copying are {10%, 10MB/s, 8 kB} and
{90%, 100MB/s, 256 kB}, respectively. The test results show that
the performance metrics of CPU, HDD, and memory are similar to
those tested separately, except that the memory speed is affected
by CPU utilization setpoint. This is because CPU cycles are needed
to copy data for testing the memory. In contrast, the HDD perfor-
mance is not affected by CPU utilization setpoint, because HDD
is a low-speed devive compared with CPU and memory. All the
CPUs were also thermally safe, although CPU, HDD, and memory
generate heat simultaneously.
3.3.2 Server Reliability. In controlled and uncontrolled tests, we
also measured various reliability data, such as correctable and un-
correctable memory errors, HDDs’ latent sector errors and self-
monitoring, analysis, and reporting technology (SMART) records
to investigate the reliability of the server’s hardware during the
tests. The measurement results show that all tested HDDs and
memories work successfully without any errors during the tests.
Moreover, there are no servers -shutdown and overheating when
the aisle cold temperature setpoint is up to 37°C and the CPU is
fully utilized. However, we observed serval server faults on the
testbed during the tests. The detailed analysis of the faults will be
presented in next section.
4 IT EQUIPMENT FAILURES
In this section, we first describe a summary of IT equipment fail-
ures that occurred on the testbed during the tests. Then, we present
our investigation on the reason of the failures.
4.1 Summary of Failures
The testbed has a total of 18 servers from four different vendors
which are deployed in three server rooms. During the tests, a num-
ber of servers in Room-A and Room-B had faults and could not be
booted. Specifically, among 12 servers from the same Vendor 1 in
Room A and Room B, six of them failed after about 6 months from
the initial operation.We requested the Vendor 1 to perform on-site
examination for the faulty servers. They found that the fan back-
plane of all failed servers and the motherboards of three servers
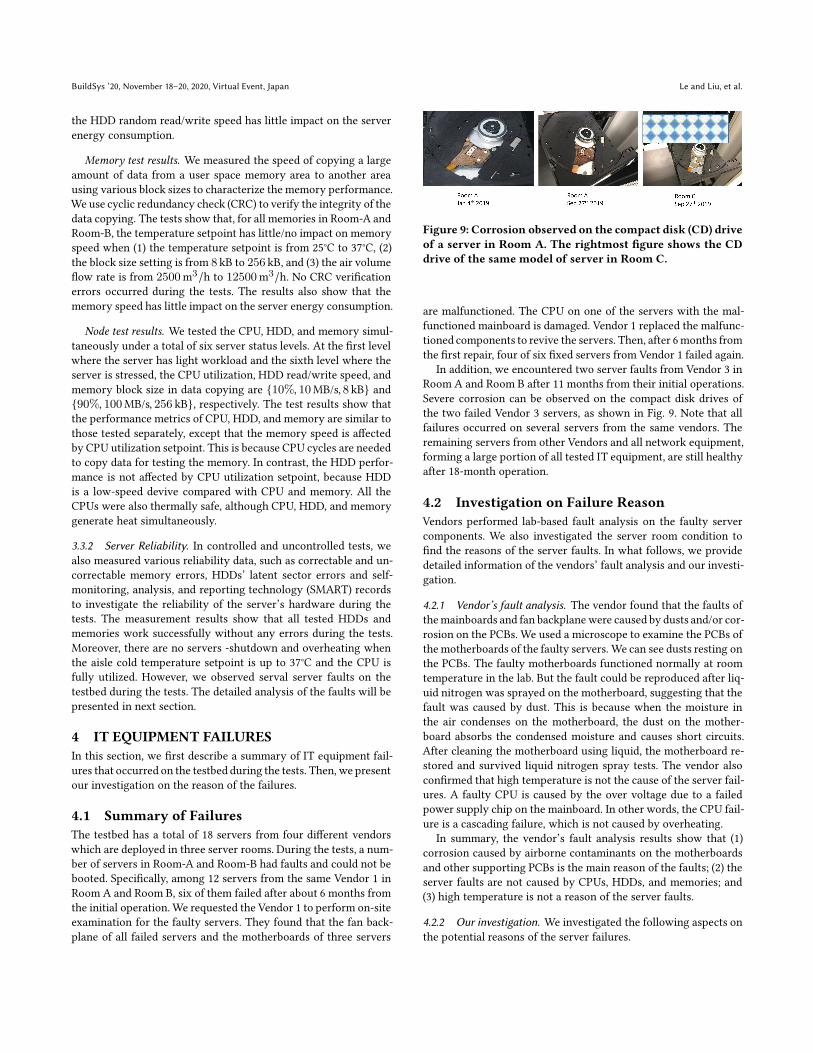
Figure 9: Corrosion observed on the compact disk (CD) drive
of a server in Room A. The rightmost figure shows the CD
drive of the same model of server in Room C.
are malfunctioned. The CPU on one of the servers with the mal-
functioned mainboard is damaged. Vendor 1 replaced the malfunc-
tioned components to revive the servers. Then, after 6months from
the first repair, four of six fixed servers from Vendor 1 failed again.
In addition, we encountered two server faults from Vendor 3 in
Room A and Room B after 11 months from their initial operations.
Severe corrosion can be observed on the compact disk drives of
the two failed Vendor 3 servers, as shown in Fig. 9. Note that all
failures occurred on several servers from the same vendors. The
remaining servers from other Vendors and all network equipment,
forming a large portion of all tested IT equipment, are still healthy
after 18-month operation.
4.2 Investigation on Failure Reason
Vendors performed lab-based fault analysis on the faulty server
components. We also investigated the server room condition to
find the reasons of the server faults. In what follows, we provide
detailed information of the vendors’ fault analysis and our investi-
gation.
4.2.1 Vendor’s fault analysis. The vendor found that the faults of
themainboards and fan backplane were caused by dusts and/or cor-
rosion on the PCBs. We used a microscope to examine the PCBs of
themotherboards of the faulty servers. We can see dusts resting on
the PCBs. The faulty motherboards functioned normally at room
temperature in the lab. But the fault could be reproduced after liq-
uid nitrogen was sprayed on the motherboard, suggesting that the
fault was caused by dust. This is because when the moisture in
the air condenses on the motherboard, the dust on the mother-
board absorbs the condensed moisture and causes short circuits.
After cleaning the motherboard using liquid, the motherboard re-
stored and survived liquid nitrogen spray tests. The vendor also
confirmed that high temperature is not the cause of the server fail-
ures. A faulty CPU is caused by the over voltage due to a failed
power supply chip on the mainboard. In other words, the CPU fail-
ure is a cascading failure, which is not caused by overheating.
In summary, the vendor’s fault analysis results show that (1)
corrosion caused by airborne contaminants on the motherboards
and other supporting PCBs is the main reason of the faults; (2) the
server faults are not caused by CPUs, HDDs, and memories; and
(3) high temperature is not a reason of the server faults.
4.2.2 Our investigation. We investigated the following aspects on
the potential reasons of the server failures.
Experiences and Learned Lessons from an Air Free-Cooled Tropical Data Center Testbed BuildSys ’20, November 18–20, 2020, Virtual Event, Japan
Jul Aug Sep OctTime 2018
30
40
50
60
70
80
90
100
Rel
ativ
e H
umid
ity (
%)
Outside Air RH Room-A Cold Air RH Room-C Cold Air RH
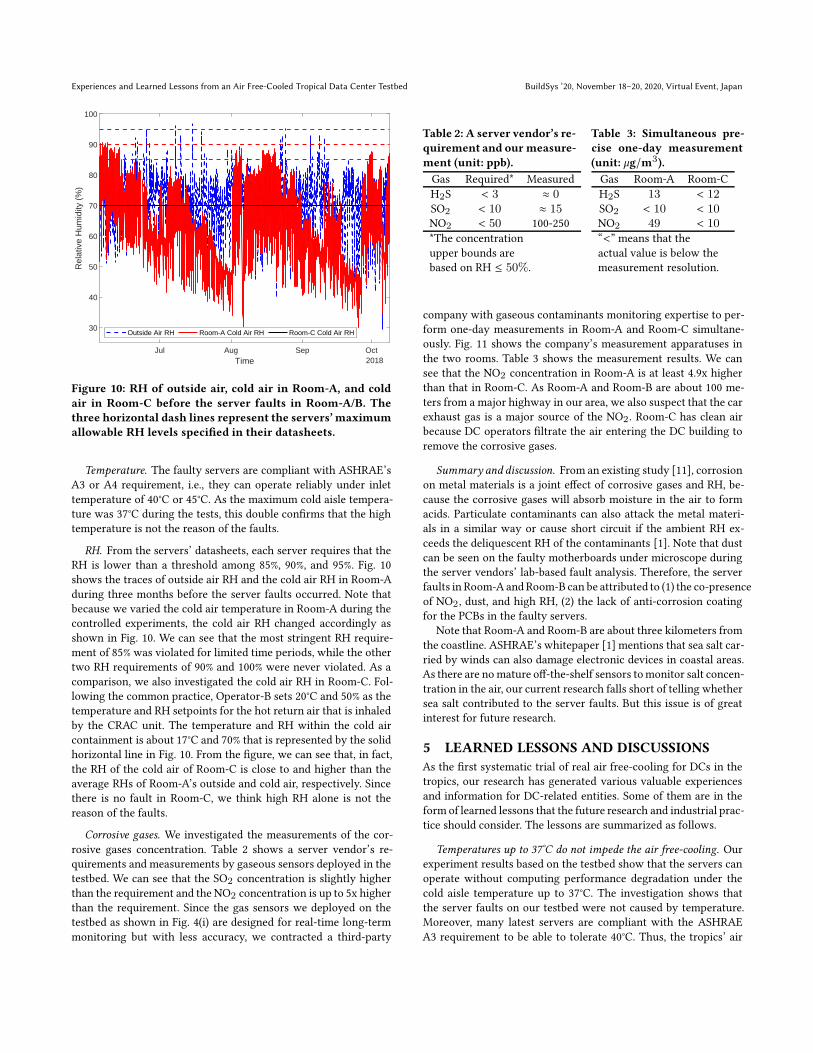
Figure 10: RH of outside air, cold air in Room-A, and cold
air in Room-C before the server faults in Room-A/B. The
three horizontal dash lines represent the servers’ maximum
allowable RH levels specified in their datasheets.
Temperature. The faulty servers are compliant with ASHRAE’s
A3 or A4 requirement, i.e., they can operate reliably under inlet
temperature of 40°C or 45°C. As the maximum cold aisle tempera-
ture was 37°C during the tests, this double confirms that the high
temperature is not the reason of the faults.
RH. From the servers’ datasheets, each server requires that the
RH is lower than a threshold among 85%, 90%, and 95%. Fig. 10
shows the traces of outside air RH and the cold air RH in Room-A
during three months before the server faults occurred. Note that
because we varied the cold air temperature in Room-A during the
controlled experiments, the cold air RH changed accordingly as
shown in Fig. 10. We can see that the most stringent RH require-
ment of 85% was violated for limited time periods, while the other
two RH requirements of 90% and 100% were never violated. As a
comparison, we also investigated the cold air RH in Room-C. Fol-
lowing the common practice, Operator-B sets 20°C and 50% as the
temperature and RH setpoints for the hot return air that is inhaled
by the CRAC unit. The temperature and RH within the cold air
containment is about 17°C and 70% that is represented by the solid
horizontal line in Fig. 10. From the figure, we can see that, in fact,
the RH of the cold air of Room-C is close to and higher than the
average RHs of Room-A’s outside and cold air, respectively. Since
there is no fault in Room-C, we think high RH alone is not the
reason of the faults.
Corrosive gases. We investigated the measurements of the cor-
rosive gases concentration. Table 2 shows a server vendor’s re-
quirements and measurements by gaseous sensors deployed in the
testbed. We can see that the SO2 concentration is slightly higher
than the requirement and the NO2 concentration is up to 5x higher
than the requirement. Since the gas sensors we deployed on the
testbed as shown in Fig. 4(i) are designed for real-time long-term
monitoring but with less accuracy, we contracted a third-party
Table 2: A server vendor’s re-
quirement and our measure-
ment (unit: ppb).
Gas Required* Measured
H2S < 3 ≈ 0
SO2 < 10 ≈ 15
NO2 < 50 100-250
*The concentration
upper bounds are
based on RH ≤ 50%.
Table 3: Simultaneous pre-
cise one-day measurement
(unit: `g/m3).
Gas Room-A Room-C
H2S 13 < 12
SO2 < 10 < 10
NO2 49 < 10
“<” means that the
actual value is below the
measurement resolution.
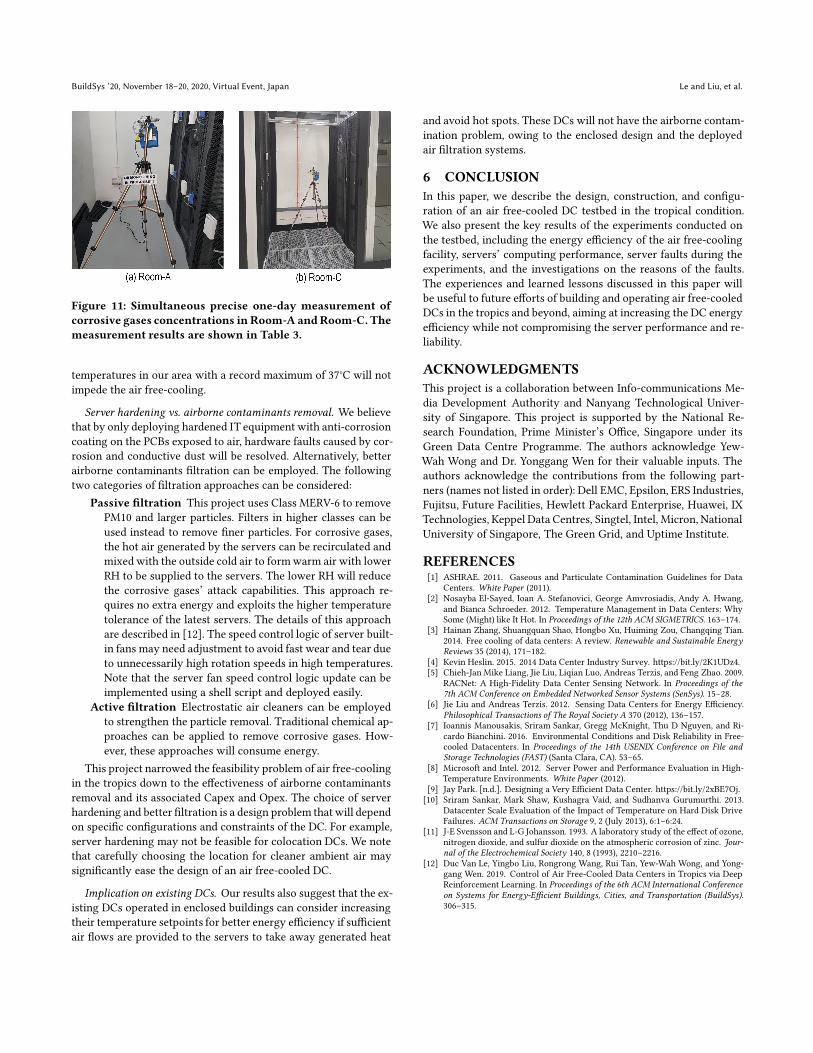
company with gaseous contaminants monitoring expertise to per-
form one-day measurements in Room-A and Room-C simultane-
ously. Fig. 11 shows the company’s measurement apparatuses in
the two rooms. Table 3 shows the measurement results. We can
see that the NO2 concentration in Room-A is at least 4.9x higher
than that in Room-C. As Room-A and Room-B are about 100 me-
ters from a major highway in our area, we also suspect that the car
exhaust gas is a major source of the NO2. Room-C has clean air
because DC operators filtrate the air entering the DC building to
remove the corrosive gases.
Summary and discussion. From an existing study [11], corrosion
on metal materials is a joint effect of corrosive gases and RH, be-
cause the corrosive gases will absorb moisture in the air to form
acids. Particulate contaminants can also attack the metal materi-
als in a similar way or cause short circuit if the ambient RH ex-
ceeds the deliquescent RH of the contaminants [1]. Note that dust
can be seen on the faulty motherboards under microscope during
the server vendors’ lab-based fault analysis. Therefore, the server
faults in Room-A andRoom-B can be attributed to (1) the co-presence
of NO2 , dust, and high RH, (2) the lack of anti-corrosion coating
for the PCBs in the faulty servers.
Note that Room-A and Room-B are about three kilometers from
the coastline. ASHRAE’s whitepaper [1] mentions that sea salt car-
ried by winds can also damage electronic devices in coastal areas.
As there are nomature off-the-shelf sensors tomonitor salt concen-
tration in the air, our current research falls short of telling whether
sea salt contributed to the server faults. But this issue is of great
interest for future research.
5 LEARNED LESSONS AND DISCUSSIONS
As the first systematic trial of real air free-cooling for DCs in the
tropics, our research has generated various valuable experiences
and information for DC-related entities. Some of them are in the
form of learned lessons that the future research and industrial prac-
tice should consider. The lessons are summarized as follows.
Temperatures up to 37°C do not impede the air free-cooling. Our
experiment results based on the testbed show that the servers can
operate without computing performance degradation under the
cold aisle temperature up to 37°C. The investigation shows that
the server faults on our testbed were not caused by temperature.
Moreover, many latest servers are compliant with the ASHRAE
A3 requirement to be able to tolerate 40°C. Thus, the tropics’ air
BuildSys ’20, November 18–20, 2020, Virtual Event, Japan Le and Liu, et al.
Figure 11: Simultaneous precise one-day measurement of
corrosive gases concentrations in Room-A andRoom-C. The
measurement results are shown in Table 3.
temperatures in our area with a record maximum of 37°C will not
impede the air free-cooling.
Server hardening vs. airborne contaminants removal. We believe
that by only deploying hardened IT equipment with anti-corrosion
coating on the PCBs exposed to air, hardware faults caused by cor-
rosion and conductive dust will be resolved. Alternatively, better
airborne contaminants filtration can be employed. The following
two categories of filtration approaches can be considered:
Passive filtration This project uses Class MERV-6 to remove
PM10 and larger particles. Filters in higher classes can be
used instead to remove finer particles. For corrosive gases,
the hot air generated by the servers can be recirculated and
mixed with the outside cold air to formwarm air with lower
RH to be supplied to the servers. The lower RH will reduce
the corrosive gases’ attack capabilities. This approach re-
quires no extra energy and exploits the higher temperature
tolerance of the latest servers. The details of this approach
are described in [12]. The speed control logic of server built-
in fans may need adjustment to avoid fast wear and tear due
to unnecessarily high rotation speeds in high temperatures.
Note that the server fan speed control logic update can be
implemented using a shell script and deployed easily.
Active filtration Electrostatic air cleaners can be employed
to strengthen the particle removal. Traditional chemical ap-
proaches can be applied to remove corrosive gases. How-
ever, these approaches will consume energy.
This project narrowed the feasibility problem of air free-cooling
in the tropics down to the effectiveness of airborne contaminants
removal and its associated Capex and Opex. The choice of server
hardening and better filtration is a design problem that will depend
on specific configurations and constraints of the DC. For example,
server hardening may not be feasible for colocation DCs. We note
that carefully choosing the location for cleaner ambient air may
significantly ease the design of an air free-cooled DC.
Implication on existing DCs. Our results also suggest that the ex-
isting DCs operated in enclosed buildings can consider increasing
their temperature setpoints for better energy efficiency if sufficient
air flows are provided to the servers to take away generated heat
and avoid hot spots. These DCs will not have the airborne contam-
ination problem, owing to the enclosed design and the deployed
air filtration systems.
6 CONCLUSION
In this paper, we describe the design, construction, and configu-
ration of an air free-cooled DC testbed in the tropical condition.
We also present the key results of the experiments conducted on
the testbed, including the energy efficiency of the air free-cooling
facility, servers’ computing performance, server faults during the
experiments, and the investigations on the reasons of the faults.
The experiences and learned lessons discussed in this paper will
be useful to future efforts of building and operating air free-cooled
DCs in the tropics and beyond, aiming at increasing the DC energy
efficiency while not compromising the server performance and re-
liability.
ACKNOWLEDGMENTS
This project is a collaboration between Info-communications Me-
dia Development Authority and Nanyang Technological Univer-
sity of Singapore. This project is supported by the National Re-
search Foundation, Prime Minister’s Office, Singapore under its
Green Data Centre Programme. The authors acknowledge Yew-
Wah Wong and Dr. Yonggang Wen for their valuable inputs. The
authors acknowledge the contributions from the following part-
ners (names not listed in order): Dell EMC, Epsilon, ERS Industries,
Fujitsu, Future Facilities, Hewlett Packard Enterprise, Huawei, IX
Technologies, Keppel Data Centres, Singtel, Intel, Micron, National
University of Singapore, The Green Grid, and Uptime Institute.
REFERENCES[1] ASHRAE. 2011. Gaseous and Particulate Contamination Guidelines for Data
Centers. White Paper (2011).[2] Nosayba El-Sayed, Ioan A. Stefanovici, George Amvrosiadis, Andy A. Hwang,
and Bianca Schroeder. 2012. Temperature Management in Data Centers: WhySome (Might) like It Hot. In Proceedings of the 12th ACM SIGMETRICS. 163–174.
[3] Hainan Zhang, Shuangquan Shao, Hongbo Xu, Huiming Zou, Changqing Tian.2014. Free cooling of data centers: A review. Renewable and Sustainable EnergyReviews 35 (2014), 171–182.
[4] Kevin Heslin. 2015. 2014 Data Center Industry Survey. https://bit.ly/2K1UDz4.[5] Chieh-Jan Mike Liang, Jie Liu, Liqian Luo, Andreas Terzis, and Feng Zhao. 2009.
RACNet: A High-Fidelity Data Center Sensing Network. In Proceedings of the7th ACM Conference on Embedded Networked Sensor Systems (SenSys). 15–28.
[6] Jie Liu and Andreas Terzis. 2012. Sensing Data Centers for Energy Efficiency.Philosophical Transactions of The Royal Society A 370 (2012), 136–157.
[7] Ioannis Manousakis, Sriram Sankar, Gregg McKnight, Thu D Nguyen, and Ri-cardo Bianchini. 2016. Environmental Conditions and Disk Reliability in Free-cooled Datacenters. In Proceedings of the 14th USENIX Conference on File andStorage Technologies (FAST) (Santa Clara, CA). 53–65.
[8] Microsoft and Intel. 2012. Server Power and Performance Evaluation in High-Temperature Environments. White Paper (2012).
[9] Jay Park. [n.d.]. Designing a Very Efficient Data Center. https://bit.ly/2xBE7Oj.[10] Sriram Sankar, Mark Shaw, Kushagra Vaid, and Sudhanva Gurumurthi. 2013.
Datacenter Scale Evaluation of the Impact of Temperature on Hard Disk DriveFailures. ACM Transactions on Storage 9, 2 (July 2013), 6:1–6:24.
[11] J-E Svensson and L-G Johansson. 1993. A laboratory study of the effect of ozone,nitrogen dioxide, and sulfur dioxide on the atmospheric corrosion of zinc. Jour-nal of the Electrochemical Society 140, 8 (1993), 2210–2216.
[12] Duc Van Le, Yingbo Liu, Rongrong Wang, Rui Tan, Yew-Wah Wong, and Yong-gang Wen. 2019. Control of Air Free-Cooled Data Centers in Tropics via DeepReinforcement Learning. In Proceedings of the 6th ACM International Conferenceon Systems for Energy-Efficient Buildings, Cities, and Transportation (BuildSys).306–315.