experience)in)developing)domes1c)mrv)and) accoun1ng ... · examples)of)mi1ga1on)ac1on)and)effects...
TRANSCRIPT

Experience in developing domes1c MRV and accoun1ng system for iNDC
Daniel T. Benefoh & Dr. Emmanuel Techie-‐Obeng Ghana Environment Protec<on Agency
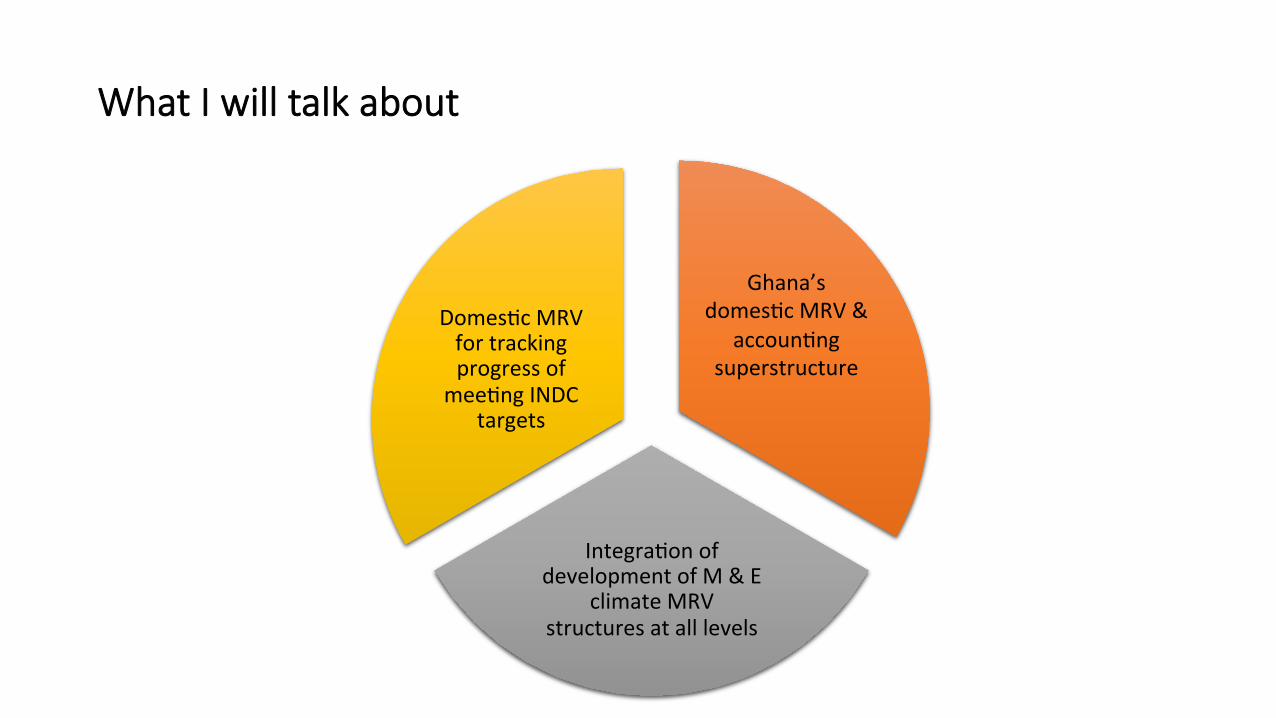
What I will talk about
Ghana’s domes,c MRV &
accoun,ng superstructure
Integra,on of development of M & E
climate MRV structures at all levels
Domes,c MRV for tracking progress of
mee,ng INDC targets

Ghana’s na,onal circumstances

Ghana is vulnerable to the nega1ve impacts of climate change

Although low levels of GHG emissions but high poten1al to grow expon1ally considering economic development trajectory
Sectors & Sub-‐sectors Emissions MtCO2e
% Change
1990 2000 2010 2011 2012 1990-‐2011
2000-‐2011
2011-‐2012
1. All Energy (combusAon & fugiAve) 3.5 5.5 11.3 11.6 13.5 233.0 110.3 15.9
(1.A1,A2&A5) StaAonery energy combusAon
2.0 2.7 6.5 6.2 7.0 206.5 127.8 13.3
(1.A5) Transport 1.5 2.8 4.8 5.4 6.5 268.3 92.5 19.4 (1.B) FugiAve emission 0.0 0.003 0.001 0.001 0.002 50.0 -‐81.2 156.5
2. Industrial Process & Product Use 0.8 0.8 0.2 0.4 0.47 -‐46.0 -‐43.2 6.5 3. AFOLU 8.6 7.7 14.7 14.0 15.2 240.6 94.0 1.6
3A Livestock 1.7 2.20 2.8 16.5 3.0 194.2 91.9 12.0 3B Land -‐3.0 -‐4.00 1.9 14.08 1.8 63.6 82.5 7.7 3C. Aggregated and Non-‐CO2 emissions
9.9 9.52 10.0 2.8
10.3 62.9 27.4 8.9
4. Waste 1.3 2.3 4.2 1.3 4.52 -‐143.3 -‐132.7 40.3 Total emissions (excluding AFOLU) 5.6 8.6 15.8 10.0 18.5 0.6 4.8 3.2 Total net emissions (including AFOLU) 14.2 16.3 30.4 30.6 33.7 115.1 87.5 10.0

Inventory Categories IPCC Code MiAgaAon Sectors Historical Emissions (MtCO2e) ContribuAon to NaAonal Emissions (%) in 2010 2000 2010
Energy 1.A1 Electricity supply 0.48 3.08 10.1% Oil Refinery* 0.07 0.15 0.5%
1.A3 Transporta,on 2.8 4.80 15.7% 1.A4 Residen,al and Commercial 1.48 2.17 7.1% 1.A2 Industry 0.71 1.11 3.6
Industrial Processes 2 0.78 0.24 0.8 AFOLU (Agriculture) 3A Agriculture 2.20 2.82 9.2%
AFOLU (Land) 3B Forest Management -‐4.0 1.85 6.1% AFOLU (Aggregated sources and non-‐CO2 emissions )
3C Other sources 9.52 9.99 32.8%
Waste 4A, 4B 4C and 4D
Waste Management 2.3 4.24 13.9%
Total 16.31 30.49 100%
*Energy supply ac<vi<es other than electricity genera<on (power supply) are oDen reported and analyzed in the sector ac<vi<es such as oil refining under Energy Industries.

Business as usual emissions scenario up 2020, 2030, 2040 MiAgaAon Sectors Emissions (MtCO2e)
Base Year 2010 Year 2020 Intermediate Year 2030
Projec,on End Year 2040
A. Energy sector A.1 Energy supply A.1.1. Electricity supply 3.08 8.24 20.48 45.18 A.2 Energy demand side management A.2.1. ResidenAal and Commercial 2.17 2.20 2.28 13.7
A.2.2.Industry 0.71 2.32 6.17 15.9
A.2.3 Transport 4.80 11.35 22.2 43.14 B. Non-‐energy sector B.1 Forest Management** 1.85 3.07 4.29 5.5 B.2 Solid Waste Management* 1.5 1.57 1.64 1.72
Total 14.11 28.75 57.06 125.14
* Solid waste category only ** focused on CO2 emissions from the Land category only. In 2010, the total emissions of 14.11 MtCO2e cover only the mi<ga<on categories

Cross-‐sec1on of opportuni1es for emission reduc1ons
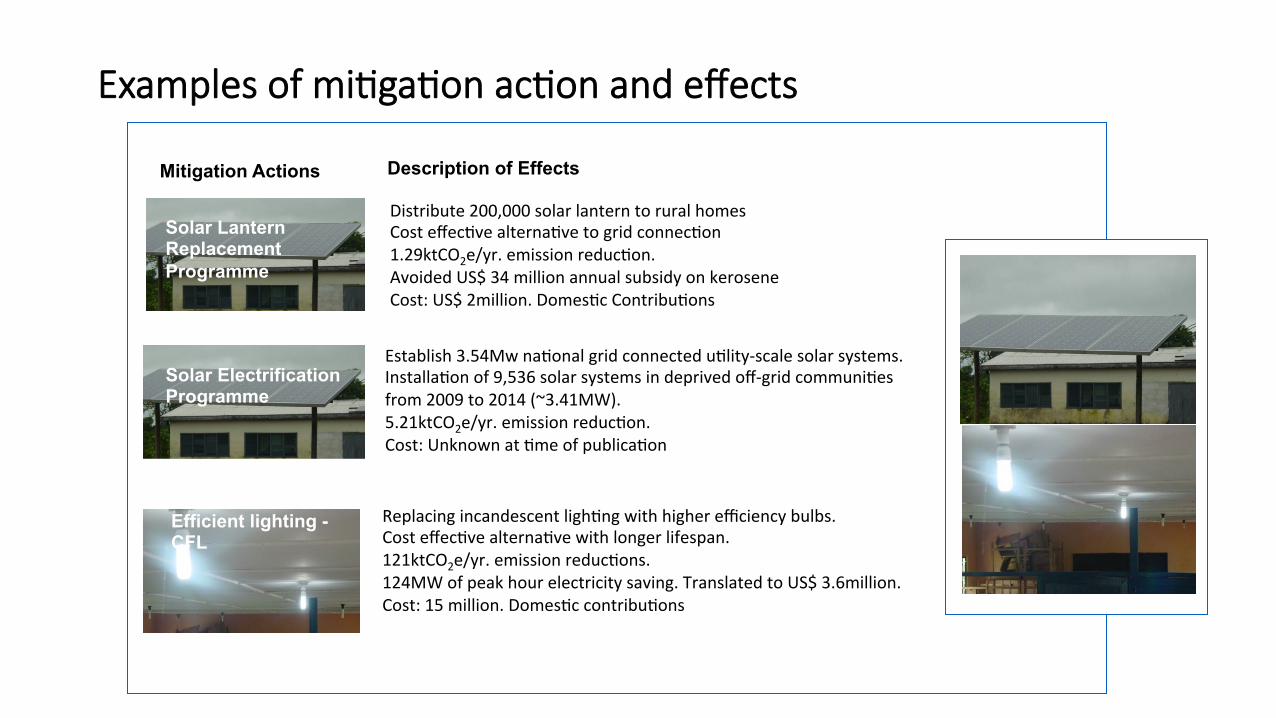
Examples of mi1ga1on ac1on and effects
Solar Lantern Replacement Programme
Mitigation Actions Description of Effects
Distribute 200,000 solar lantern to rural homes Cost effec,ve alterna,ve to grid connec,on 1.29ktCO2e/yr. emission reduc,on. Avoided US$ 34 million annual subsidy on kerosene Cost: US$ 2million. Domes,c Contribu,ons
Replacing incandescent ligh,ng with higher efficiency bulbs. Cost effec,ve alterna,ve with longer lifespan. 121ktCO2e/yr. emission reduc,ons. 124MW of peak hour electricity saving. Translated to US$ 3.6million. Cost: 15 million. Domes,c contribu,ons
Efficient lighting -CFL
Solar Electrification Programme
Establish 3.54Mw na,onal grid connected u,lity-‐scale solar systems. Installa,on of 9,536 solar systems in deprived off-‐grid communi,es from 2009 to 2014 (~3.41MW). 5.21ktCO2e/yr. emission reduc,on. Cost: Unknown at ,me of publica,on

Mitigation Actions Description
• Replacing natural gas from Nigeria with Light Crude oil for electricity generation.
• Lifetime of project expected to save between US$94 million and US$109 million from crude oil cost.
• 235.9ktCO2e/yr. emission reduction. • Cost - US$500 million
• Natural Gas Recovery and Utilization from Jubilee Field that Otherwise be Flared or Vented.
• 120million sscf of gas per day for VRA thermal plants • 148.84ktCO2e/yr. emission reduction. • Annual Fuel cost savings US$ 500,000 • Cost – 1billion. GoG through China Loan.
Fuel Diversification for
electricity generation (Nigeria Gas)
Fuel DiversificaAon for electricity generaAon
(DomesAc Gas))

• Landscape approach to sustainable land and watershed management.
• Livelihood support • 2.6 ktCO2e/yr. emission reduc,on • Cost: 8.75million. GEF/World Bank
Mitigation Actions Description
• Restore the forest cover of 15,300ha of degraded forestlands every year.
• Average 29,000 direct Jobs yearly. • Produce 370Mt food annually. • 44.7ktCO2e/yr. emission reduc,on. • Cost: 52 million. GoG and Private sector
• Promote Climate-‐Smart Cocoa Landscapes in 110,000 ha cocoa landscape
• Conserva,on of biodiversity ecological networks and corridors • 440ktCO2e/yr. emission reduc,on • Cost: 50million. World Bank, IFC, AFDB
• REDD+ Result-‐based payment in Cocoa Landscape • Double yield per ha, average produc,on of 400 kg/ha, and
would result in an addi,onal annual income of $650/ha. • 1,200 ktCO2e/yr. emission reduc,on. • Cost: ~60 million. World Bank
National Forest Plantation
Development Programme
Forest Investment Programme
Cocoa REDD+ Programme
SLM

M & E MRV
Support
GHG Impacts
MiAgaAon acAons
Verifica1on & Repor1ng
Public expenditure
Assessment of impacts or change or transforma1on
Development policies
Audit and Public
Hearing
Ins,tu,ons
System and processes defined by domes,c public policy
Ins,tu,ons System and processes defined by interna,onal rules Rule based accoun,ng
Bench-‐mark for performance
Na,onal level to local government
Na,on wide, project level or sector level
Approach to seSng up our domes1c MRV

Integra1on of development M & E structures and MRV system
Data
IT systemInstitutions
Management
Continuous training
Data collection and data exchanging protocol
Roles and Responsbilities
National APRsSector APRs
Data sharing network
Surveys
Facility reports
APRs Indicators Online climate database
GHG Emission database
Mitigation Actions Registry
“Support” Registry
Data Process and Review
Operations and maintenance rules
Hardware
Software
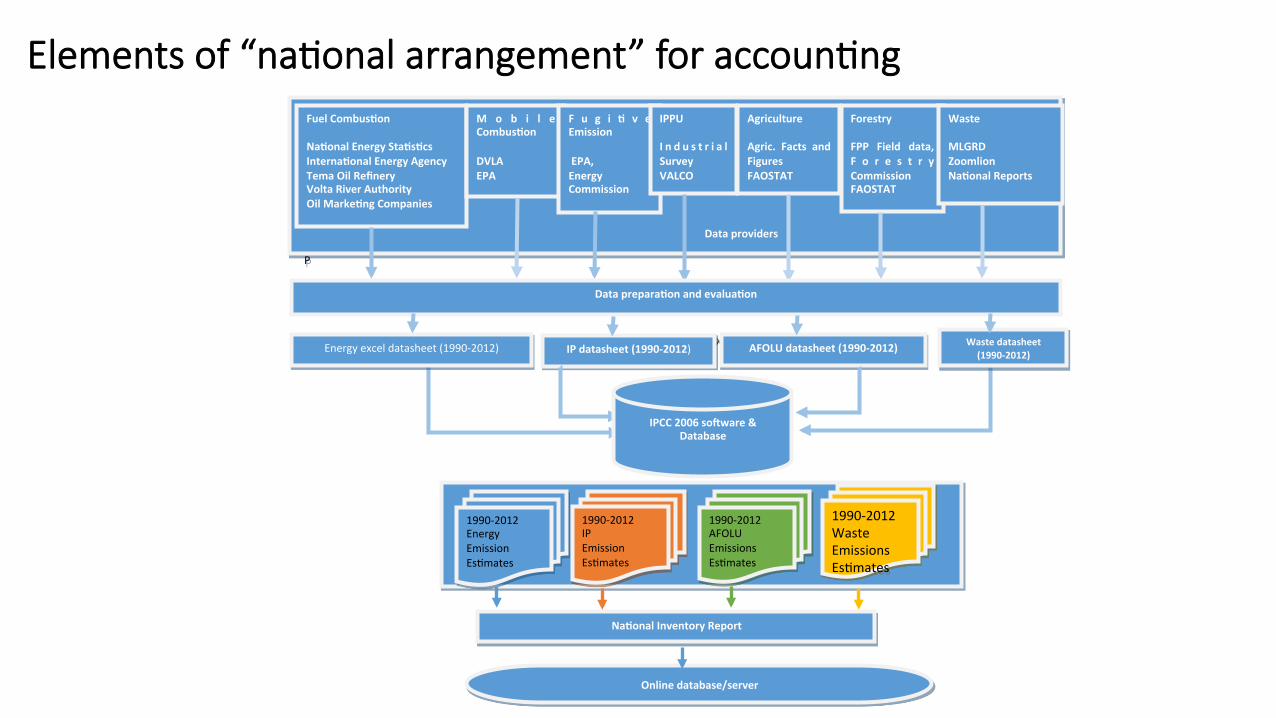
Elements of “na1onal arrangement” for accoun1ng
NaAonal Inventory Report
Data providers
P
Fuel CombusAon NaAonal Energy StaAsAcs InternaAonal Energy Agency Tema Oil Refinery Volta River Authority Oil MarkeAng Companies
M o b i l e CombusAon DVLA EPA
F u g i A v e Emission EPA, Energy Commission
IPPU I n d u s t r i a l Survey VALCO
Agriculture Agric. Facts and Figures FAOSTAT
Forestry FPP Field data, F o r e s t r y Commission FAOSTAT
Waste MLGRD Zoomlion NaAonal Reports
Data preparaAon and evaluaAon
Energy excel datasheet (1990-2012) Energy excel datasheet (1990-‐2012) IP datasheet (1990-‐2012) AFOLU datasheet (1990-‐2012) Waste datasheet (1990-‐2012)
IPCC 2006 soaware & Database
1990-‐2012 Energy Emission Es,mates
1990-‐2012 IP Emission Es,mates
1990-‐2012 AFOLU Emissions Es,mates
1990-‐2012 Waste Emissions Es,mates
Online database/server
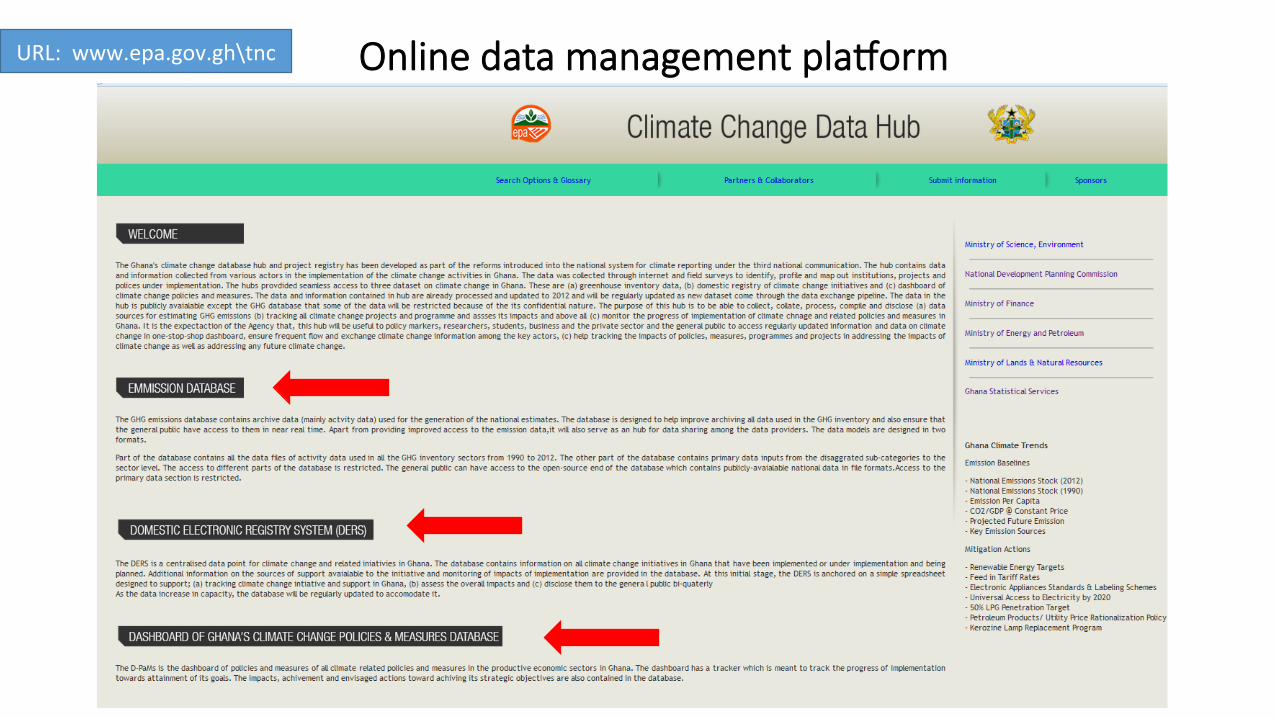
URL: www.epa.gov.gh\tnc Online data management plaWorm

Feedback
Monitor(Mitigation actions, GHG and Support
ReviewICA Process
Report(BUR, GHG Inventory
(Re) Plan
Preparation of GHG Inventory & BUR
Submission to UNFCCC
Records of facilitative exchange of views
New data from APRs, Surveys
Data NetworksDevelopment Policies M &E
Registry
Verification of mitigation actions before publish on domestic registry
Sector Level
Project M &E & Facility level
Programmes
Project scale
National Level
How we are puSng the system to opera1on – the bigger picture
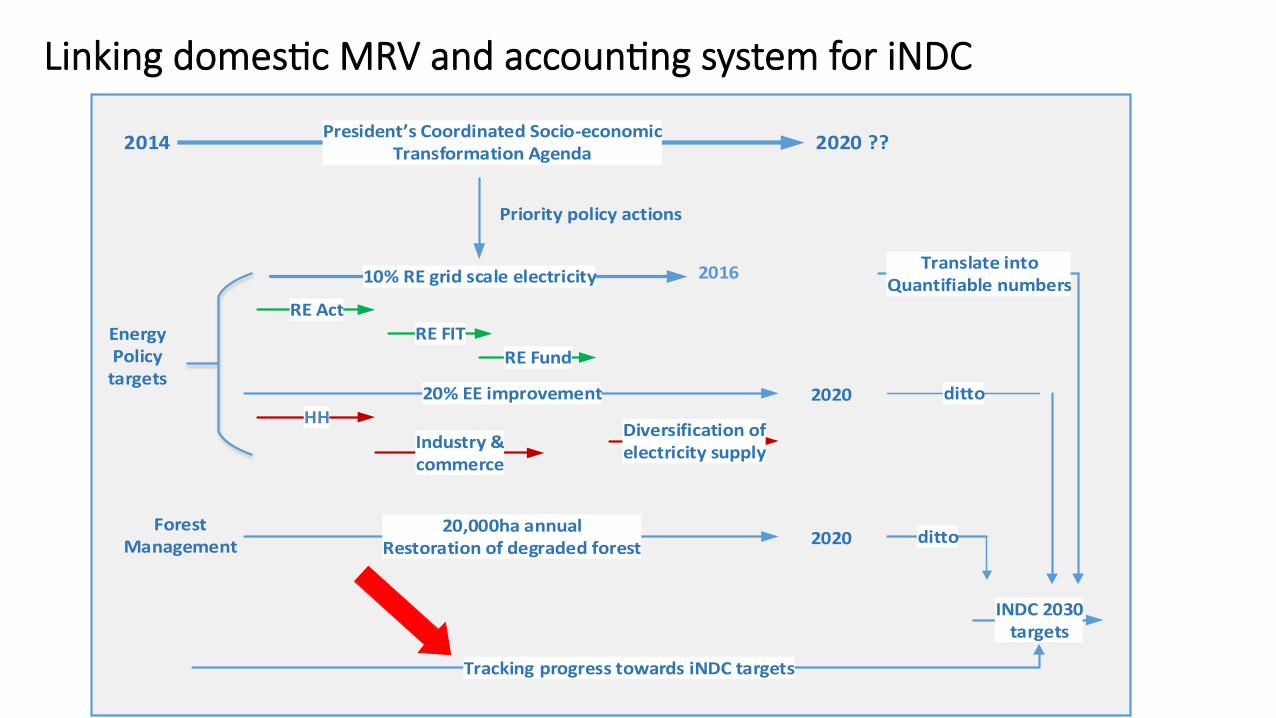
Linking domes1c MRV and accoun1ng system for iNDC
President’s Coordinated Socio-‐economic Transformation Agenda 2020 ??2014
10% RE grid scale electricity 2016
20% EE improvement 2020
Energy Policytargets
RE Fund RE FIT
HHIndustry & commerce
RE Act
Diversification of electricity supply
20,000ha annualRestoration of degraded forest
Forest Management 2020
INDC 2030 targets
Translate intoQuantifiable numbers
ditto
ditto
Priority policy actions
Tracking progress towards iNDC targets

Monitor, report, verify ………….redo
What to monitor? GHG, support, co-‐benefits (SD indicators)
Does scale maner? sectors, city, facility level, project
“Polices and measures” (PaMs) – individual, aggregates, modifica,ons, contribu,ons of PaMs to anain iNDC targets
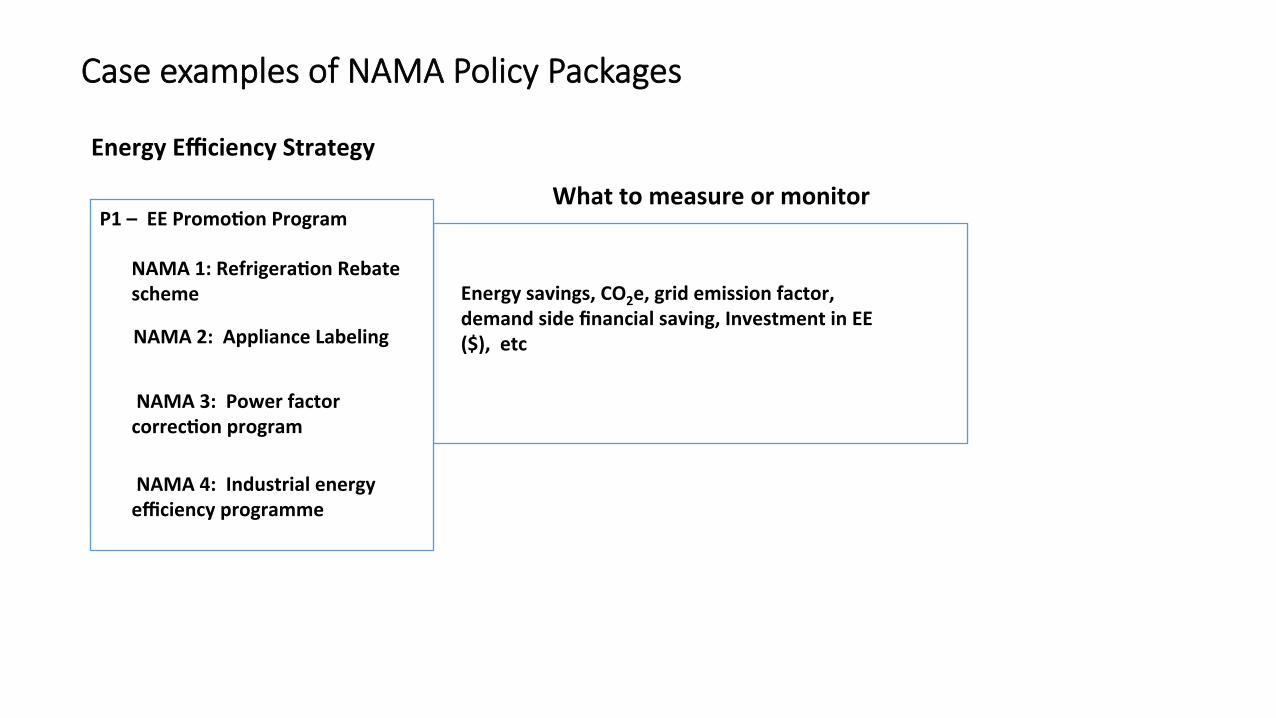
Case examples of NAMA Policy Packages
Energy Efficiency Strategy
P1 – EE PromoAon Program
NAMA 1: RefrigeraAon Rebate scheme
NAMA 2: Appliance Labeling
NAMA 3: Power factor correcAon program
Energy savings, CO2e, grid emission factor, demand side financial saving, Investment in EE ($), etc
What to measure or monitor
NAMA 4: Industrial energy efficiency programme

Structures relevant for tracking financial inflows
Green climate fund
Other International climate funds
Bilateral and Multilateral financial flows
National Budget and Dedicated Funds
Foundations
Private sector
Co-‐financing
Market based inflows or result-‐based payment
Projects
Official ChannelMinistry of Finance
Support Tracking System
NationalAnnual Survey
Annual budgets and ODA and Non-‐ODA Inflows
MMDAs
Disclose to Ministry of Finance
Publish
Feedback from ICA
0
100,000,000
200,000,000
300,000,000
400,000,000
500,000,000
600,000,000
700,000,000
Bilateral Mul,lateral Co-‐financing GEF Na,onal Funds
Mi,ga,on Adapta,on MoI SD Enabling Ac,vi,es
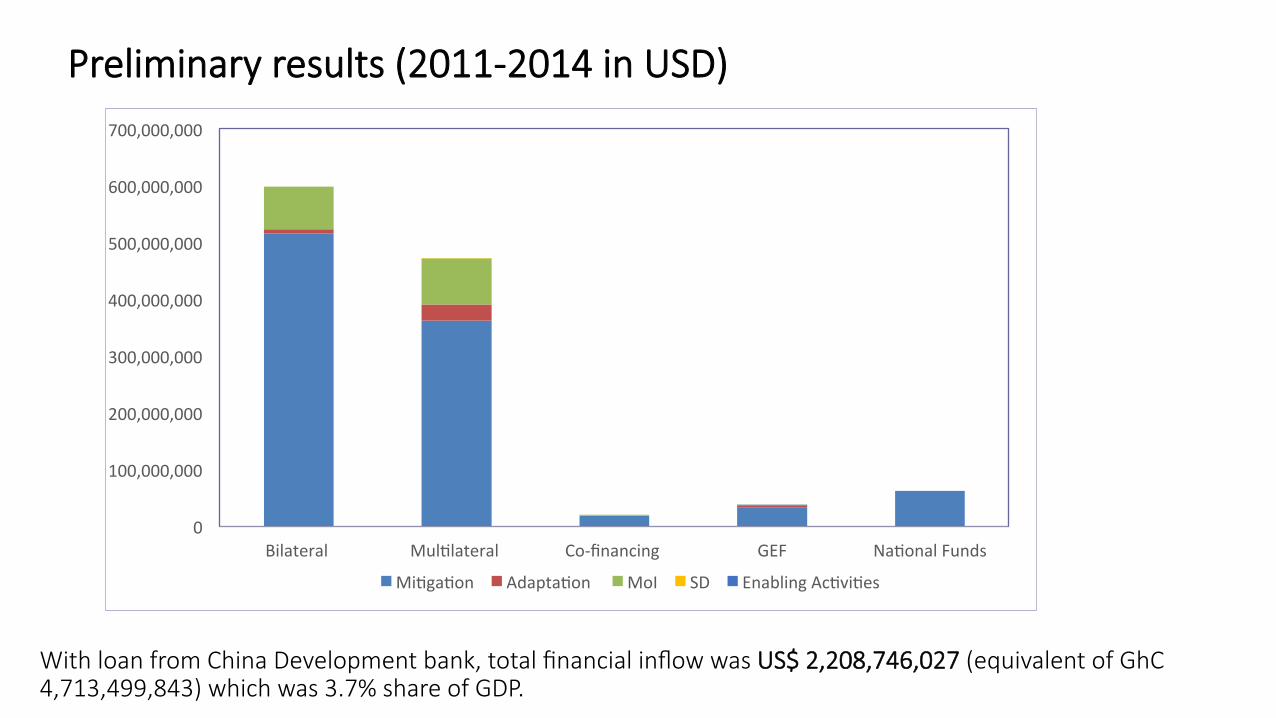
Preliminary results (2011-‐2014 in USD)
With loan from China Development bank, total financial inflow was US$ 2,208,746,027 (equivalent of GhC 4,713,499,843) which was 3.7% share of GDP.

Monitor, report, verify …..redo
Who to monitor and report ? Ins,tu,ons, roles & coordina,on
Data – means/frequency of measurement, plasorm for data exchange (exis,ng data suppliers – energy balance, forestry inventory etc)
Methodology – IPCC methodology, common accoun,ng ,city-‐level protocols, project or facility level methods; selec,on of accoun,ng ac,vi,es and metrics
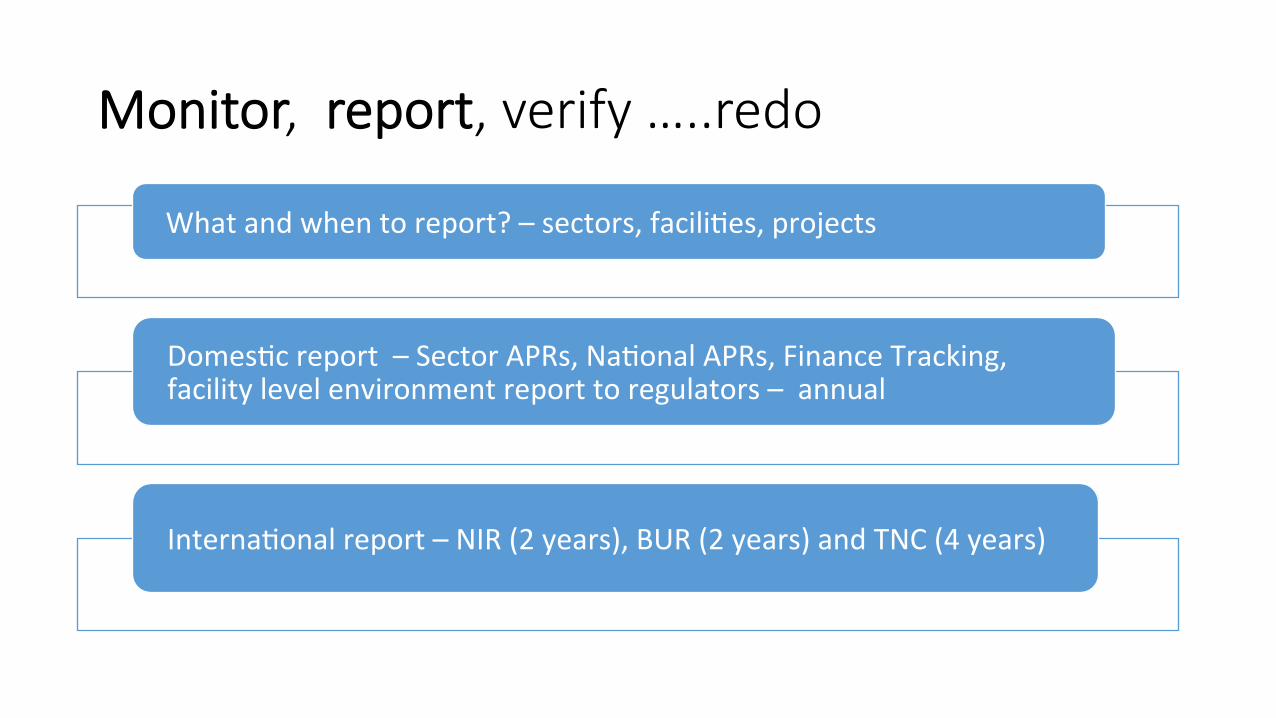
Monitor, report, verify …..redo
What and when to report? – sectors, facili,es, projects
Domes,c report – Sector APRs, Na,onal APRs, Finance Tracking, facility level environment report to regulators – annual
Interna,onal report – NIR (2 years), BUR (2 years) and TNC (4 years)
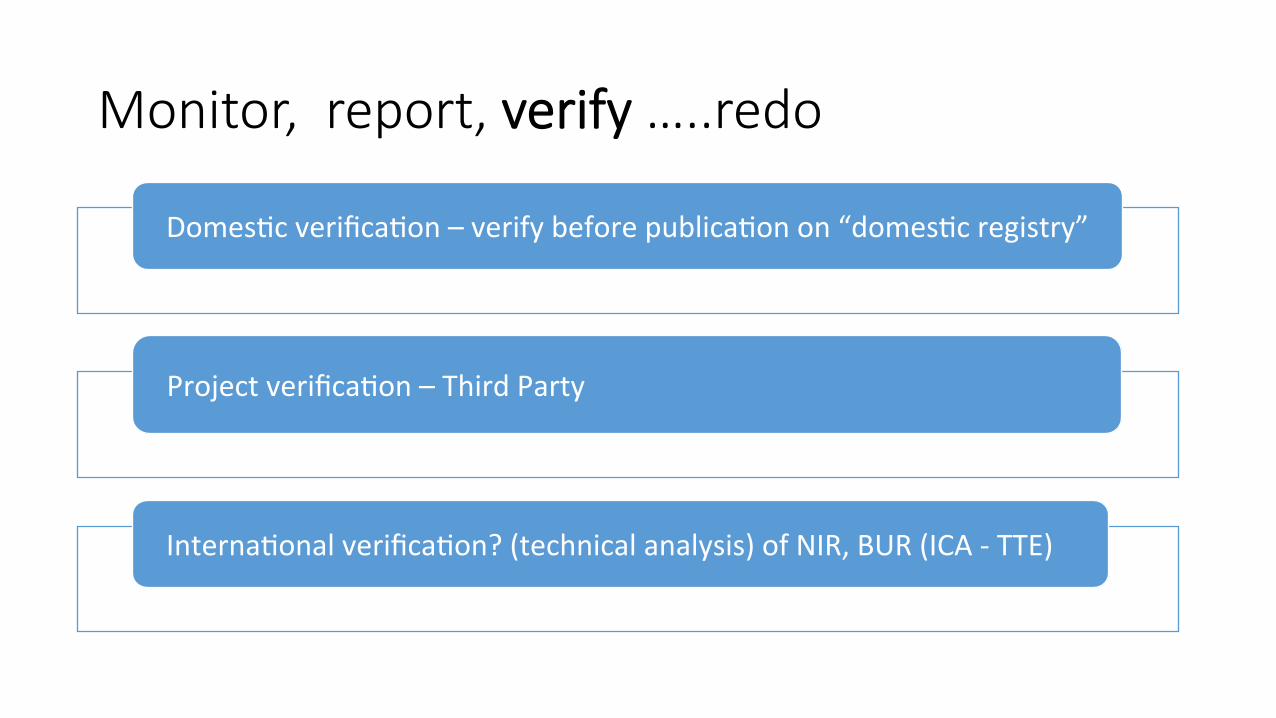
Monitor, report, verify …..redo
Domes,c verifica,on – verify before publica,on on “domes,c registry”
Project verifica,on – Third Party
Interna,onal verifica,on? (technical analysis) of NIR, BUR (ICA -‐ TTE)
Some lessons we have learnt so far
• Climate change MRV in prac,ce works bener with development M & E.
• No need to reinvent the wheel.
• What is needed is coordina,on, greater orienta,on, capacity and use of transparency tools.
• Beginning from ground-‐zero could be expensive and become difficult to start
• Start linle, pay anen,on to what is already working. Ramp up gradually.
• Importance to learn from exis,ng Annex 1 repor,ng to UNFCCC

Thank you