expansion of the dafne databank to new european union
TRANSCRIPT
1
The DAFNE V project
Expansion of the DAFNE databank to new European Union Member States: Data
Food Networking, based on household budget surveys.
Agreement No SPC.2003117
Executive Summary of the final activity report of the DAFNE V project Coordinator Dr. Antonia Trichopoulou Dept. of Hygiene and Epidemiology Medical School, National and Kapodistrian University of Athens 75 Mikras Asias Str, Athens 115 27, GREECE Tel no: +30 210 746 2073 Fax no: +30 210 746 2079 email: [email protected] Participating Institutes Cyprus (CY) Ministry of Health
Latvia (LV) Food and Veterinary Service Food Center
Malta (MT) Health Promotion Department, Ministry of Health
Republic of Slovenia (SI) Institute of Public Health of the Republic of Slovenia
Slovak Republic (SK) Food Research Institute
2
TABLE OF CONTENTS Page List of Partners and Countries involved 3
The Data Food Networking (DAFNE) initiative 5
The DAFNE V project - Objectives 6
The DAFNE V project – Description of tasks 7
The DAFNE V project – Summary of the findings 8
The DAFNE V project – Organization of the project 11
The DAFNE V project – Dissemination Activities 11
List of References 13
Figures 1-44 16
3
I. List of Partners and Countries involved
GREECE (Coordinating Centre)
Trichopoulou A. (co-ordinator)
Department of Hygiene and Epidemiology, School of Medicine, University of Athens.
Naska A.
Department of Hygiene and Epidemiology, School of Medicine, University of Athens.
Bountziouka V.
Department of Hygiene and Epidemiology, School of Medicine, University of Athens.
Oikonomou E.
Department of Hygiene and Epidemiology, School of Medicine, University of Athens.
Tsiotas K.
Department of Hygiene and Epidemiology, School of Medicine, University of Athens.
Douros G
National Statistical Service of Greece
CYPRUS Agrotou A.
Department of Medical and Public Health Services, Ministry of Health
Markidou E.
Department of Medical and Public Health Services, Ministry of Health
Onisiforou K.
Statistical Service of the Republic of Cyprus
LATVIA Šantare D.
Food and Veterinary Service Food Center
Sparite L.
Central Statistical Bureau of Latvia
Petruhina N.
Food and Veterinary Service Food Center
Braznevica V.
Latvian Food Centre
4
MALTA Pace L.
Health Promotion Department, Ministry of Health
Caruanna E.
National Statistics Office
Camilleri N.
National Statistics Office
REPUBLIC OF SLOVENIA Gabrijelčič Blenkuš M.
Institute of Public Health of the Republic of Slovenia
Gregorič M.
Institute of Public Health of the Republic of Slovenia
Adamič M.
Institute of Public Health of the Republic of Slovenia
Remec M.
Statistical Office of the Republic of Slovenia
SLOVAK REPUBLIC Leskova E.
Food Research Institute
Sukenikova H.
Statistical Office of the Slovak Republic
5
II. The Data Food Networking (DAFNE) initiative Both nationally and internationally, nutrition monitoring calls for sources of dietary data that
would provide a regular and comparable flow of information. There are several individual-
based dietary surveys undertaken in Europe, but the lack of periodicity in data collection, the
variability in the methods of both data collection and analysis and the coverage only of some
European regions limit the undertaking of national and international comparisons. Last but
not least, the demanding nature of individual-based dietary surveys, in terms of both
expertise and financial resources, restrict their wide applicability. A central element,
however, in formulating nutrition policy in Europe is comparability and coverage of all the
European Union Member States. Data collected through the national household budget
surveys (HBS) on the other hand, possess several attributes that address the aforementioned
limitations.
The HBS are undertaken using harmonized methodologies in all European countries and the
collected data are nationally representative, detailed enough, linked to explanatory
demographic and socio-economic factors and updated on a regular basis.
The potential of exploiting the food and socio-demographic HBS data in order to develop a
European databank has been evaluated through the DAFNE initiative.1 As evidenced through
a number of publications and reports, DAFNE data have been used to:
(a) identify dietary patterns prevailing in Europe and their socio-demographic determinants2,3
(b) follow-up time trends in the food habits of European populations4,5
(c) develop the methodology to estimate the daily energy and nutrient intake of nationally
representative population samples6
(d) calculate the intake of additives and contaminants, using novel and sophisticated
statistical modelling7
(e) evaluate ecological associations with diet and morbidity/mortality data8, and to
(f) evaluate nutrition action plans and related strategies implemented at national or
international level.9,10
The DAFNE data are integrated in a web-based application, the DafneSoft
(http://www.nut.uoa.gr/Dafnesoftweb/), which allows free access to comparable between
countries information on the daily individual food availability. The application allows the
6
user to monitor dietary choices and patterns within and between countries and to follow
trends in food availability in Europe, using data presented in tables, bars, pie charts and
maps. DafneSoft further allows for cross-linkages of food availability data with socio-
economic and demographic indicators.
When the DAFNE V project was launched, the databank comprised data of 16 European
countries (namely: Austria, Belgium, Finland, France, Germany, Greece, Hungary, Italy,
Ireland, Luxembourg, Norway, Poland, Portugal, Spain, Sweden and the UK) and through
this project, the Coordinating Centre was successful in enriching the databank with
information collected in five new EU Member States (Cyprus, Latvia, Malta, Republic of
Slovenia and the Slovak Republic), as well as with information collected through the most
recent Greek HBS of 2004-05.
III. The DAFNE V project - Objectives The DAFNE V project aimed at establishing in the European Union (EU) and in the new
Member States (MS) a nutrition monitoring system, which will be based on compatible and
comparable between countries dietary data. This nutrition monitoring system will contribute
in:
• increasing the understanding of dietary habits and of the socio-economic factors
shaping them, in countries where such data are limited or non-existent. These data
are essential in supporting national efforts for improving the nutrition of the
population.
• integrating regularly updated food and related data into a cost-effective databank,
which serves as a source of comparable between countries nutrition indicators.
• providing data to tackle inequalities in health that stem from socio-economic
disparities in the dietary choices of the populations.
• following up changes of food availability in the new MS during recent years.
• identifying health challenges that the new MS may face.
• enlarging the already operating DAFNE food databank, so as to include data of 20
EU MS and Norway, strengthening thus the capacity to plan and assess nutrition
strategies and interventions within the enlarged EU.
7
In the context of the DAFNE V project, the Athens Coordinating Centre was further granted
EC support for acquiring the Greek HBS data undertaken in 2004/05. This development
enriched both the project’s objectives and deliverables with the potential of analysing data
from one additional country and reporting on trends in the food choices of the Greek
population from 1981 to 2005.
To better employ the potential of the DAFNE database and to ensure an efficient
dissemination of the results, the Coordinating Center integrated the DAFNE data in the
DafneSoft, which is directly accessible through the website of the DAFNE Coordinating
Centre (http://www.nut.uoa.gr/Dafnesoftweb/).
IV. The DAFNE V project – Description of tasks The tasks undertaken in the context of the DAFNE V project can be summarized in the
following:
♦ management and processing of the raw food, demographic and socio-economic
information collected in the HBS of the participating countries
♦ documentation of the HBS variables, which would be used in the analysis
♦ incorporation of the raw HBS data of each participating country in the central
database, operating at the Coordinating Centre
♦ harmonization of the food, and socio-demographic information collected in the
national HBSs
♦ estimation of the average daily food availability for the overall population and for
population groups, defined according to socio-demographic indicators (locality of the
residence area; education and occupation of the household head; and, composition of
the household).
♦ integration of the derived data into the operating DAFNE databank, which forms
integral part of the DafneSoft programme.
8
V. The DAFNE V project – Summary of the findings Changes in the daily availability of foods and beverages over time, the effect of socio-
economic characteristics on food choices, together with graphical presentations are included
and commented upon in the national reports of the participating countries, which have also
been translated to national languages (both versions are submitted as project deliverables).
To provide an overview of the findings with emphasis on the effect of the socio-demographic
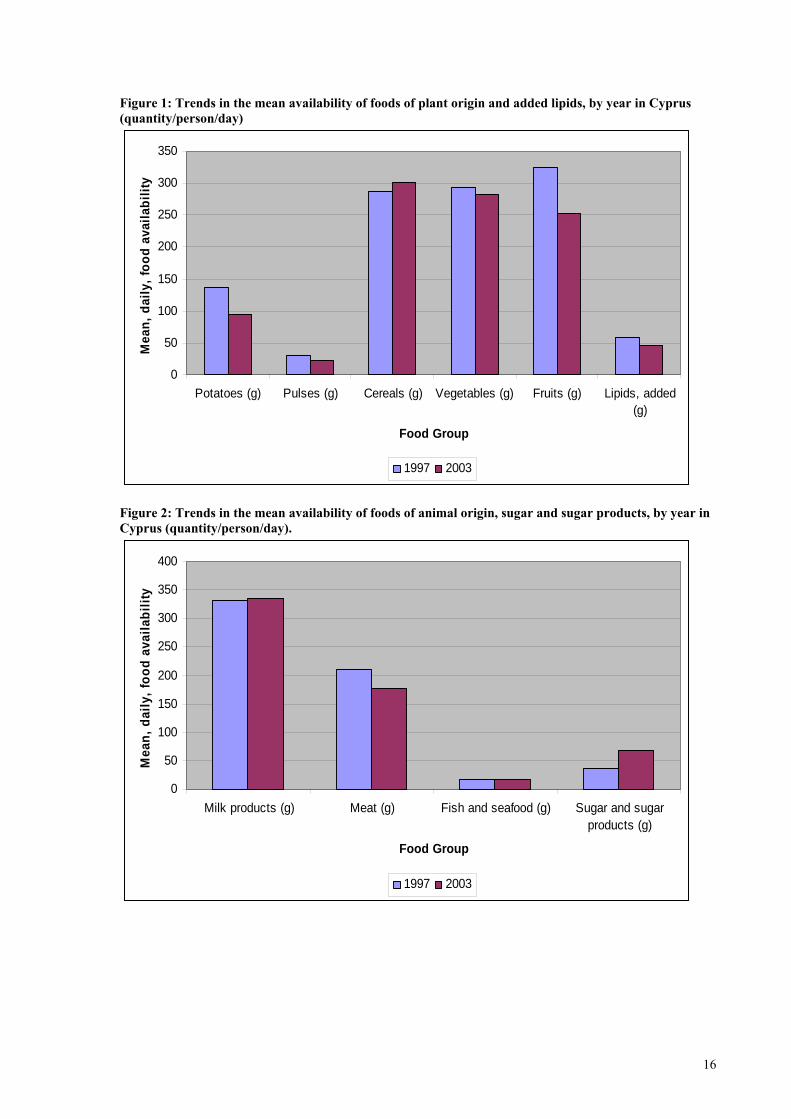
indicators evaluated through the DAFNE V project, Figures 1- 44 are included. In an attempt
to better identify time trends as well as the characteristics of individuals who better adhere to
prudent dietary habits, the figures present disparities in the daily availability of plant foods
and added lipids versus the daily availability of animal foods, sugar and sugar products by
education of the household head (grouped as elementary, secondary and higher); occupation
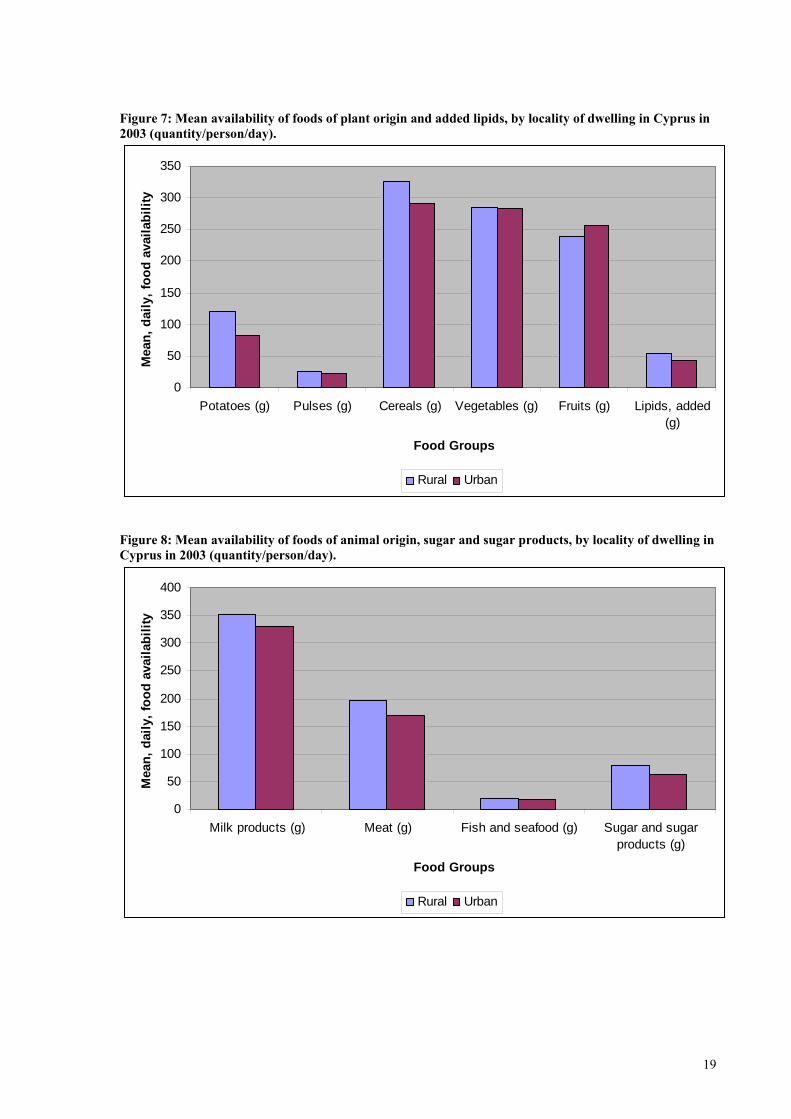
of the household head (data presented for manual, non-manual and retired); and. locality of
the dwelling (generally grouped as rural and urban).
The constellation of countries compared in the present analysis possess several
characteristics, which may explain the inability to identify concise dietary patterns. Cyprus
and Malta for example, are two countries in the Mediterranean sea which for centuries are in
the cross-road of several historical cultures. Latvia, Slovakia and Slovenia, on the other
hand, were undergoing to varying extent through a transition phase during the data collection
period. In addition, the westernisation of the traditional Southern dietary choices is
documented and one should not ignore the diet-related health mandates to which all
European populations are exposed.
Bearing the above in mind, the DAFNE data point towards high availability of almost all
food groups in countries of the South (Cyprus, Greece and Malta). With regards to plant
foods in particular, the higher daily availability of vegetables was recorded in Cyprus (284
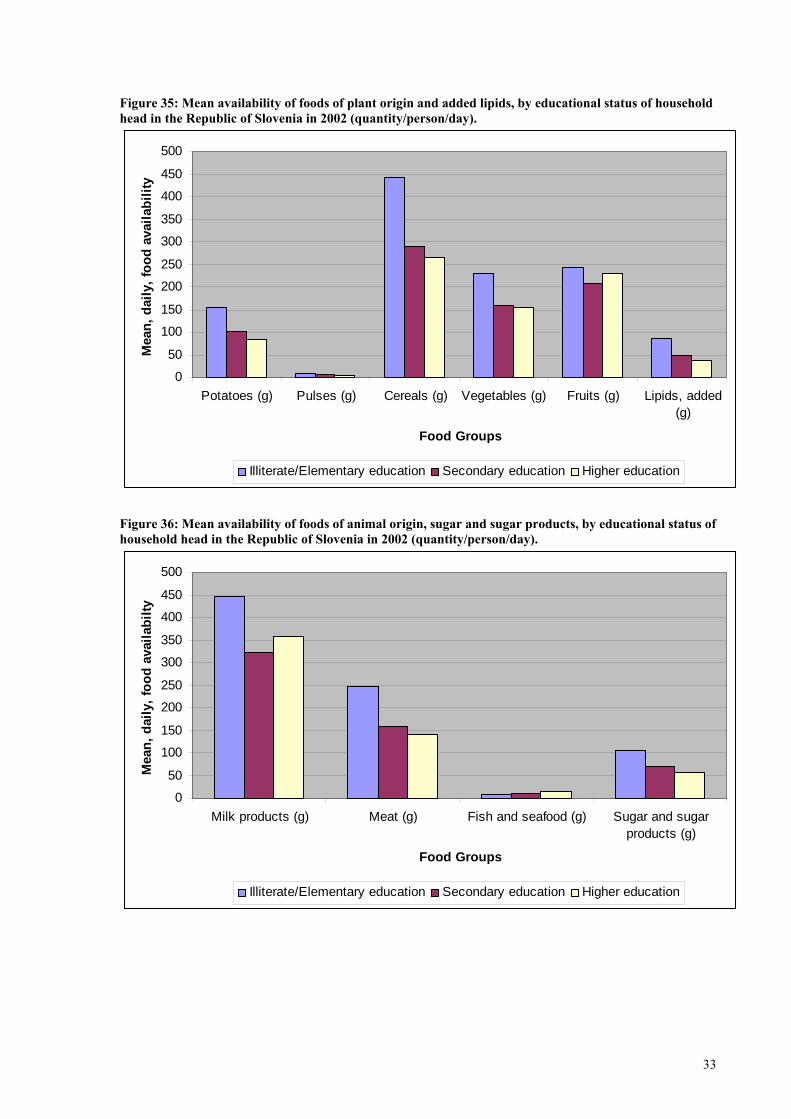
g/person/day, in 2003). In the three Central and Northern European countries (Latvia,
Slovakia and Slovenia) the availability was below the recommended minimum of 250 grams
per day. The daily fruit availability ranged from 264 g/person/day (in Greece and Malta) to
135 g/person/day in Slovenia and 120 g/person/day in Slovakia. Pulses are clearly a food
choice of the South, as Cyprus recorded 23 g/person/day, while in Slovakia the household
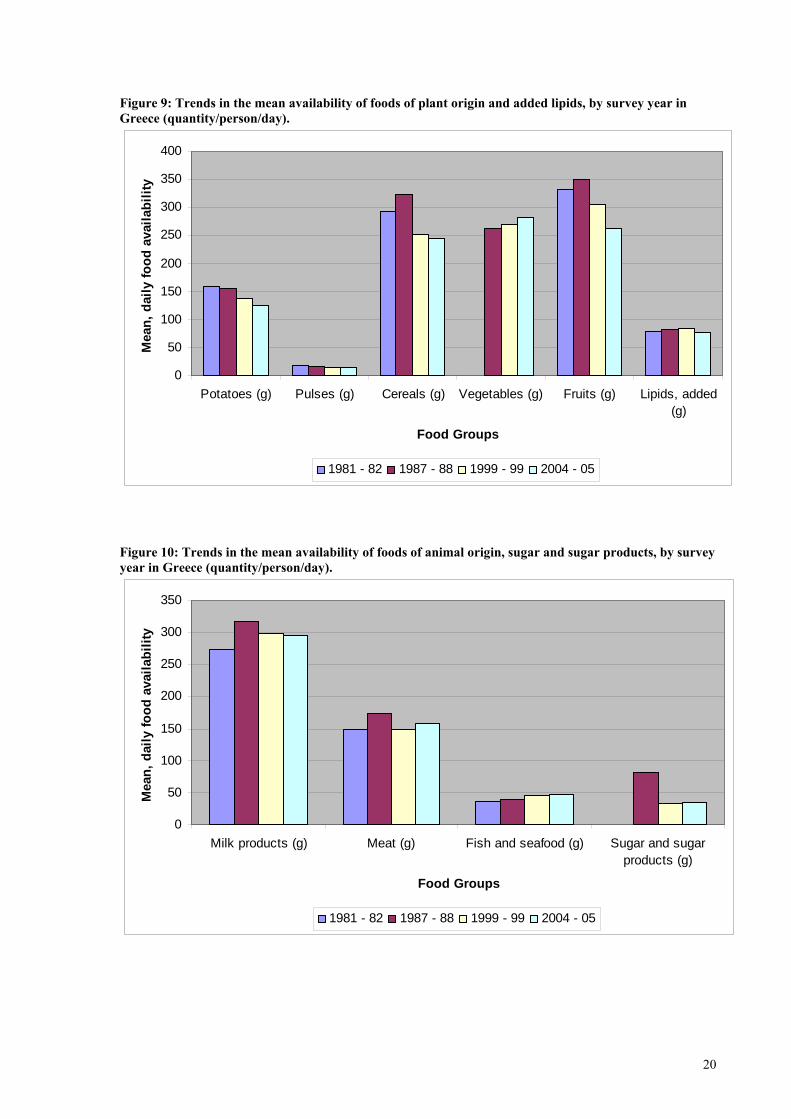
availability barely exceeded 4 g/person/day. With respect to added fats and oils, the higher
9
daily availability was recorded in Greece (77 g/person/day, 58 grams of which are olive oil
and 12 grams are other vegetable oils) and the lowest in Latvia (43 g/person/day, 0.6 grams
of which are olive oil and 23 grams are other vegetable oils).
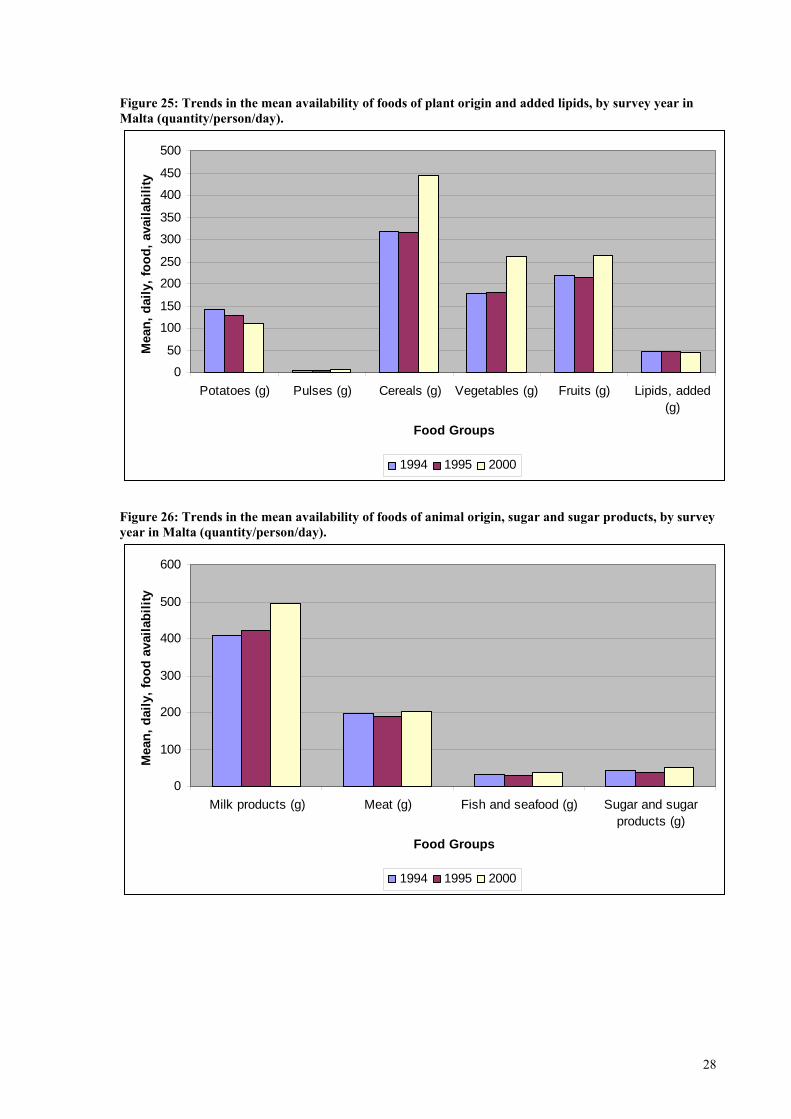
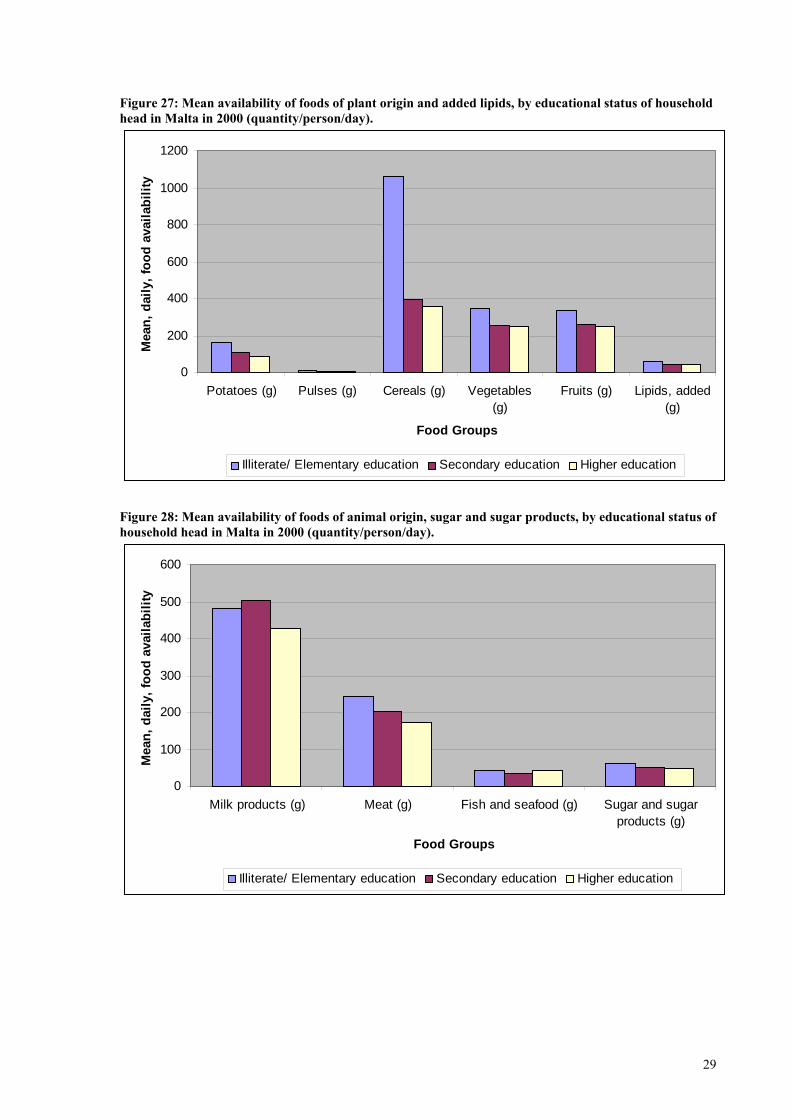
With regards to foods of animal origin, the highest daily availability of meat, milk and
products was recorded in Malta (203 g/person/day and 497 g/person/day, respectively). The
daily availability of meat and meat products was also high in Latvia (185 g/person/day),
followed by Cyprus (178 g/person/day). High availability of milk and milk products was
recorded in Slovenia (355 g/person/day) and Slovakia (337 g/person/day). The higher fish
availability was, however, recorded in Greece (46 g/person/day) and the lowest in Slovakia
(11 g/person/day).
Although the out of home consumption of beverages (alcoholic, non-alcoholic and juices) is
more common than the in-house one, the DAFNE data point towards a general increase in
the household availability of soft drinks, fruit and vegetable juices in the participating
countries. With respect to the daily availability of sugar and sugar products in the household,
the higher values were recorded in Cyprus.
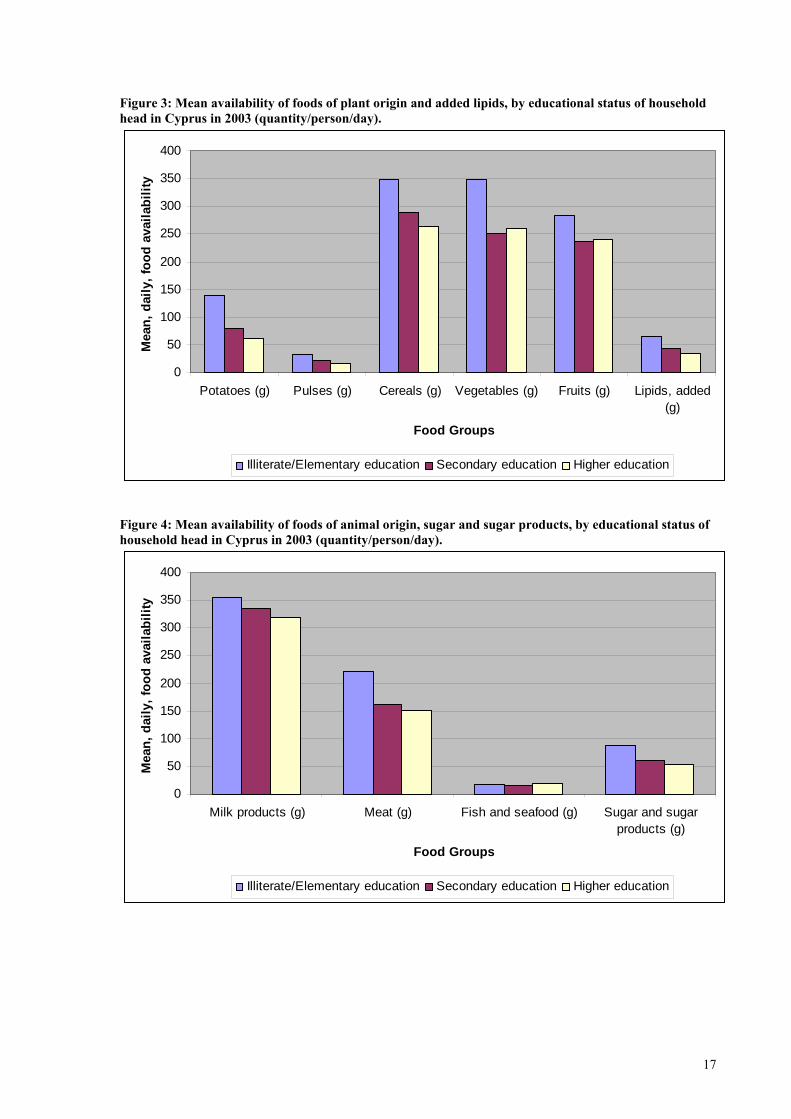
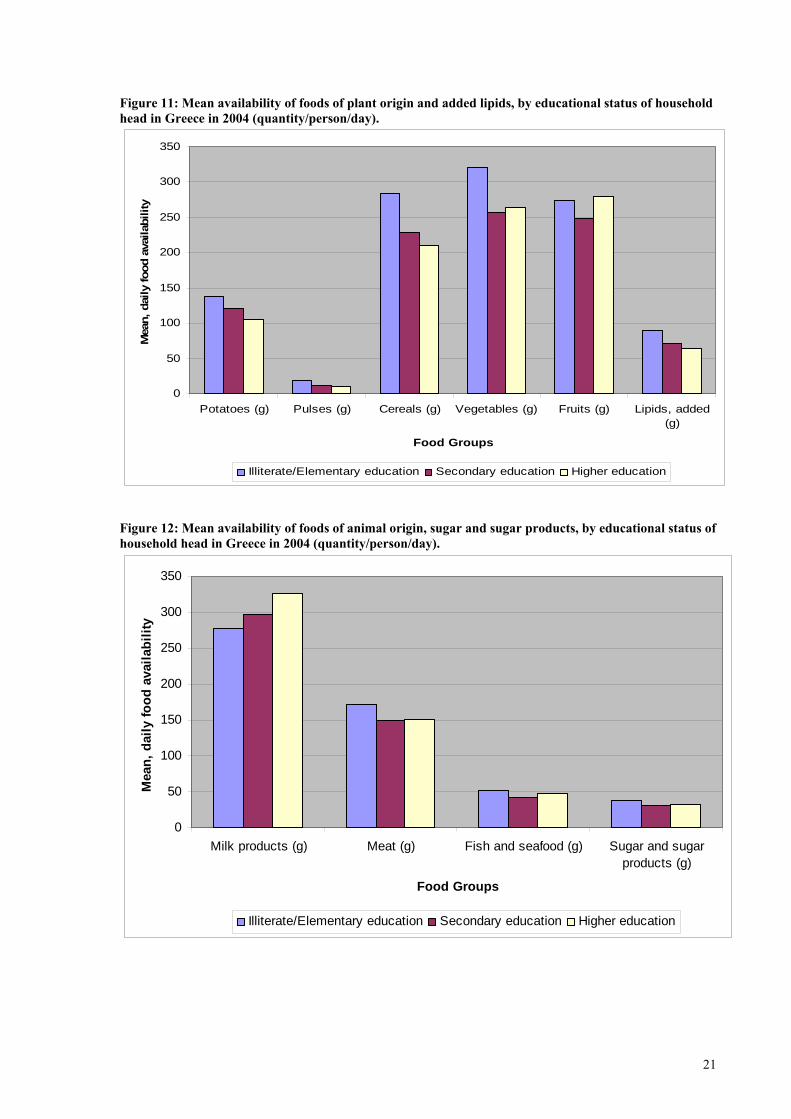
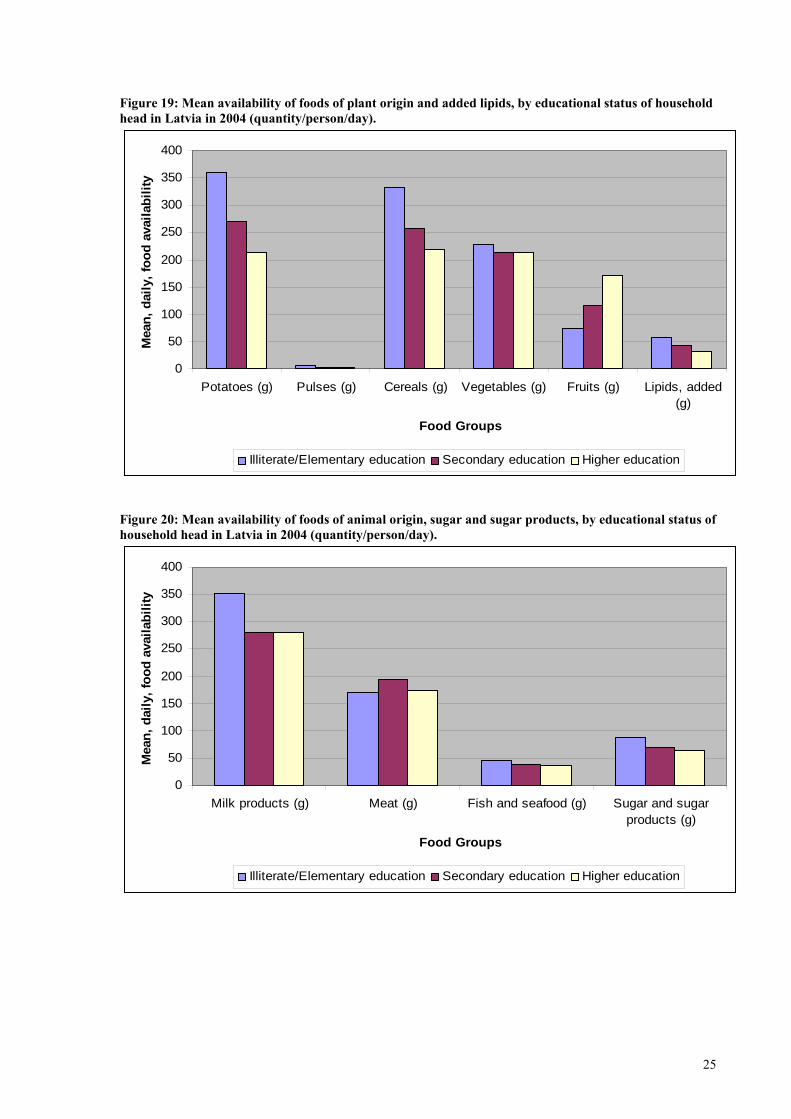
Socio-economic differences in eating practices are often studied in terms of the level of
education achieved. Results show that households with heads of higher educational
attainment generally report lower food acquisitions for household use, with the exception of
nuts (in all countries, but Slovenia), fish and seafood (in Cyprus), non-alcoholic beverages
(in Cyprus, Latvia and Greece), alcoholic beverages (in Latvia) and juices (in all countries).
In Greece and Latvia households with heads of higher education further report higher
availability of fruits. In Latvia in particular, households of higher education report twice as
much daily fruit availability (171 g/person/day), when compared to those of lower
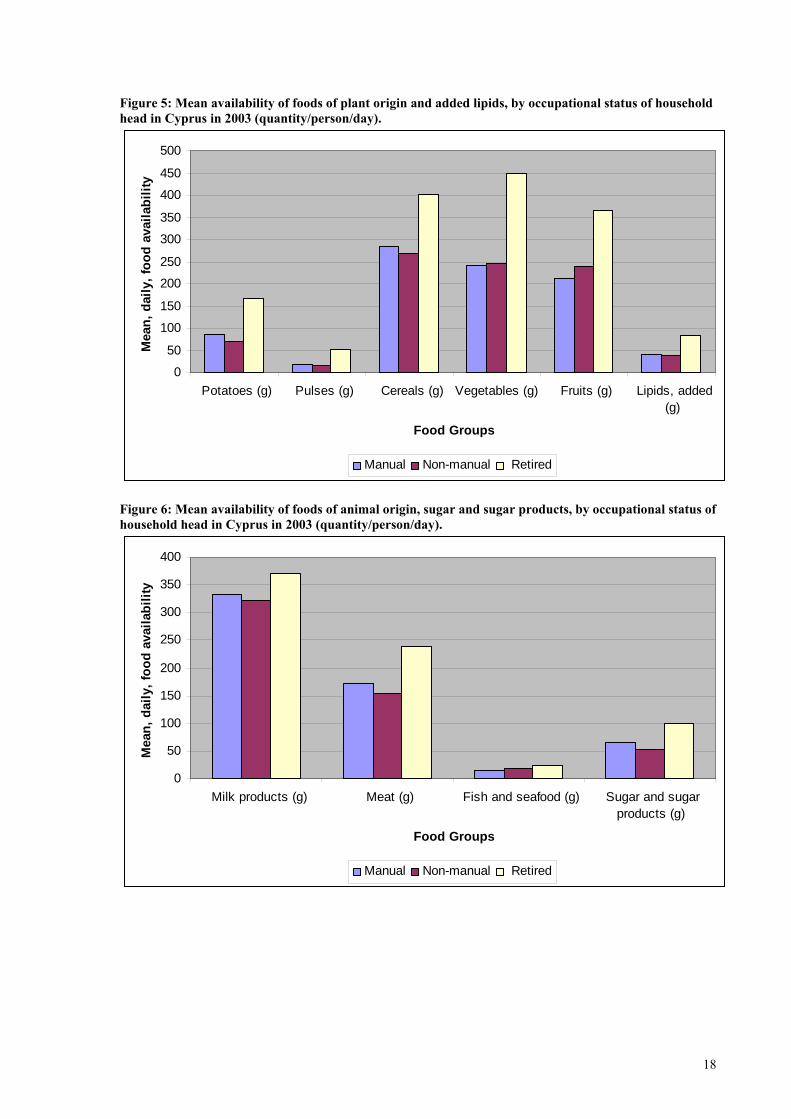
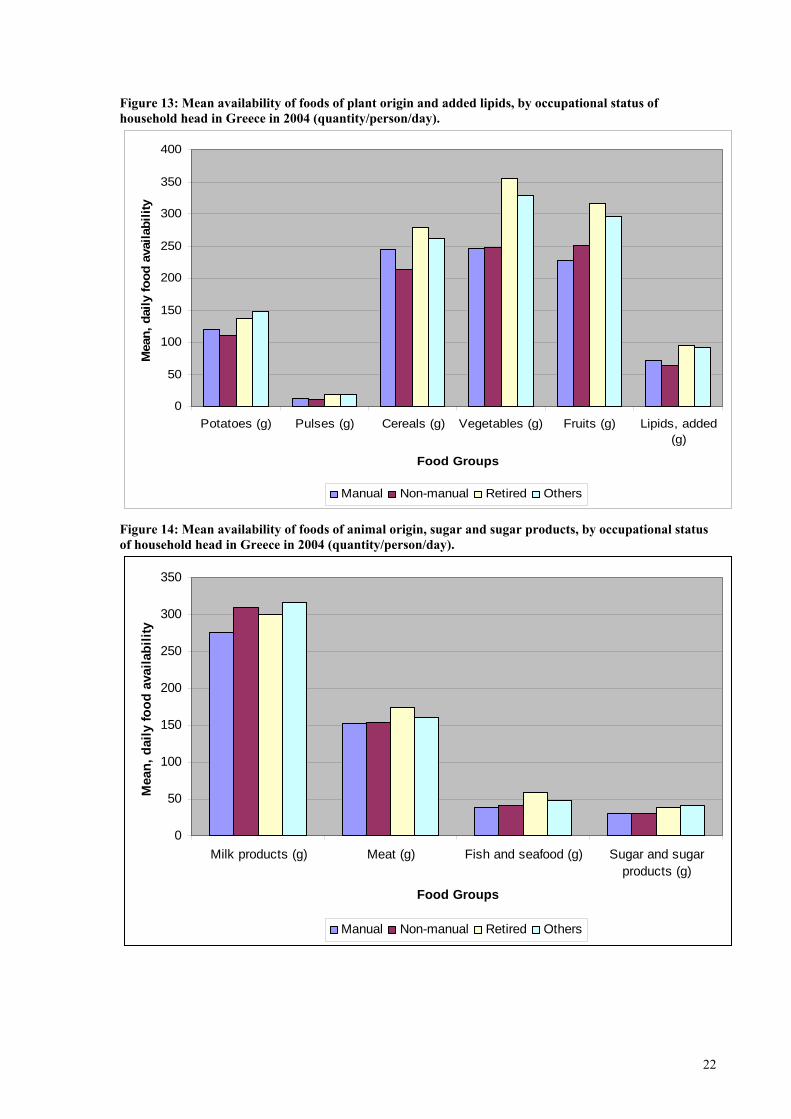
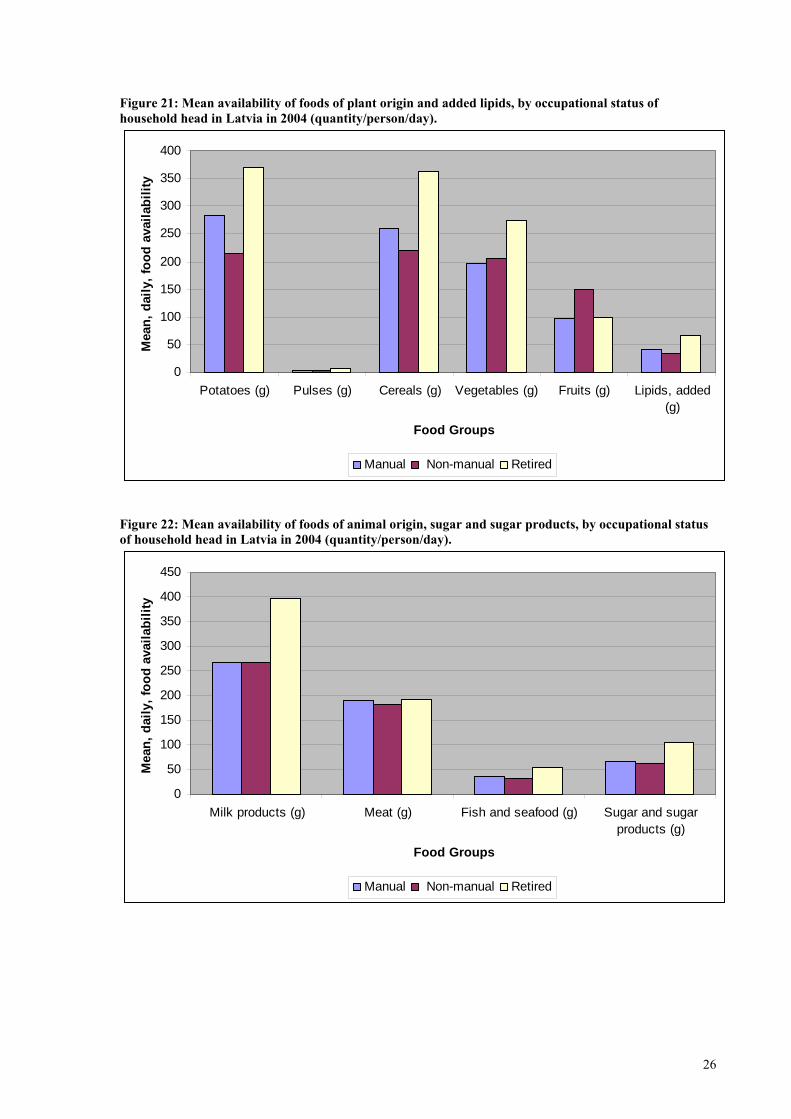
education (74 g/person/day). Household heads exercising non-manual professions are
generally expected to be of higher educational status and results indeed point similar dietary
patterns between non-manual households and households of higher education. Interestingly
enough, in all the countries under study non-manual households further reported higher
daily availability of vegetables.
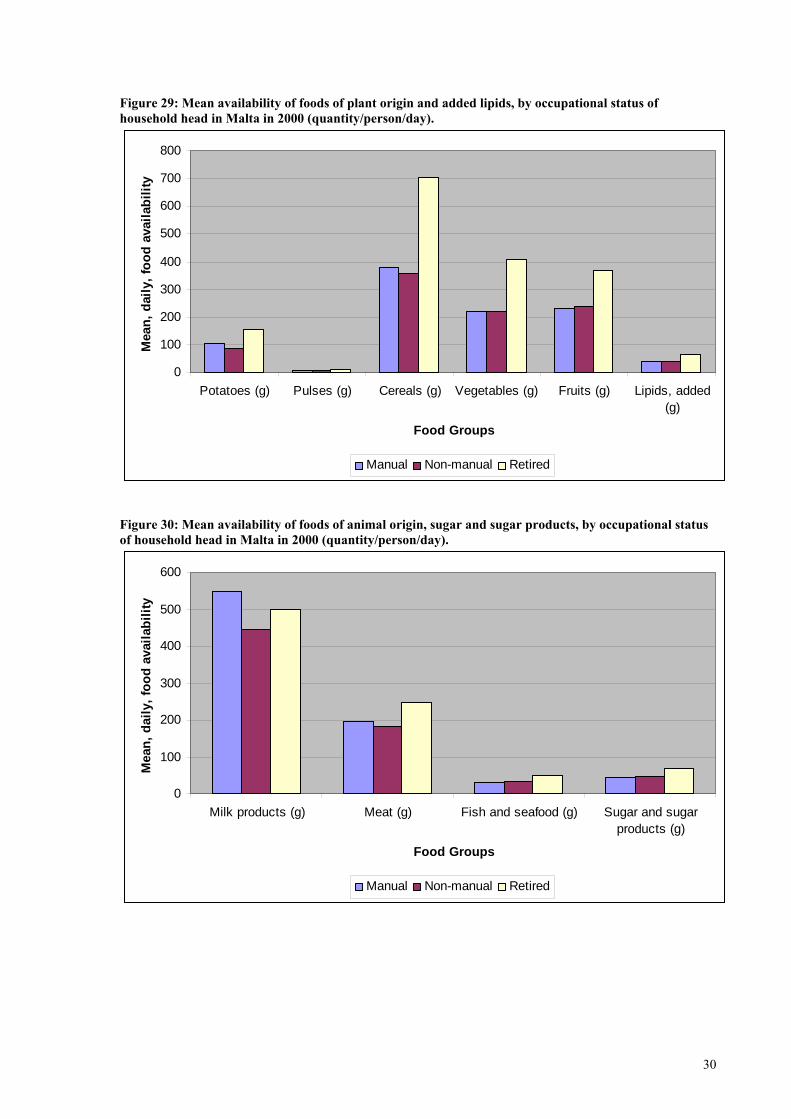
In all datasets, large food acquisitions are more common among households whose head is
retired and elderly, possibly indicating infrequent out of home consumption. In addition,
10
elderly individuals, particularly women living alone, have often been reported to
overpurchase during the survey period and the extra purchasing was occurring throughout
the range of foodstuffs.
The data on daily food availability by types of household composition should be interpreted
with caution, as in the present analysis the individualization of the HBS data has been
performed without taking into consideration the age and gender of the household members.
The HBS are not primarily designed to collect nutritional information and the food data bear
limitations, which need to be considered when interpreting findings: in most cases, no
records are collected on the type and quantity of food items and beverages consumed outside
the home; food losses and waste, foods given to pets, and meals offered to guests are not
consistently collected. Despite their limitations, however, the HBS provide a resource for the
conduct of a wide range of nutritional analyses.
Besides expanding the DAFNE databank to possibly all EU Member States, there is a need
to maintain the dynamic and regularly updated nature of the data, which can further provide
for a realistic way for nutrition monitoring in Europe through the integration of an
individual-based nutrition survey in the national HBS sampling scheme. Thus the HBS data
will provide a comparable overview of the population dietary habits at short time intervals,
which will be complemented by individual-based data collected in a sub-sample of the HBS
in wider time intervals.
In conclusion, a system facilitating the regular update of the DAFNE database, as well as the
expansion of the network to embrace all European countries could provide a ready source of
data for monitoring public health nutrition in Europe at reasonable cost.
11
VI. The DAFNE V project – Organisation of the project The project was coordinated by the Department of Hygiene and Epidemiology, Medical
School University of Athens. Three plenary meetings took place in the course of the project
and three bilateral meetings were undertaken between the Coordinating Center and
participating countries to address country-specific problems. Summaries of the project’s
plenary meetings and bilateral working sessions are given below.
VII. The DAFNE V project – Dissemination Activities
The new updated DAFNE software – the DafneSoft
Upon completion of the DAFNE V project, the enlarged databank was integrated in the
DafneSoft application tool. The DafneSoft is a web-based application, directly accessible
through the Coordinating Centre’s website (www.nut.uoa.gr).
Contribution in the WHO European Ministerial Conference on Counteracting Obesity
(Istanbul, November 2006)
The DAFNE Coordinating Centre was asked to provide supporting data on dietary patterns
in Europe to the participants of the WHO European Ministerial Conference on Counteracting
Obesity. The information was included in a publication providing data on dietary indicators
in European countries through simple pictorial presentations. The publication was introduced
by Drs. John Ryan (Health Information, DG-SANCO) and Francesco Branca (Regional
Advisor for Nutrition and Food Security, WHO Regional Office for Europe) and has been
disseminated to the attendees of the Ministerial Conference. The publication is included
among the project’s deliverables and is available online
(http://www.nut.uoa.gr/english/index.asp?page=301).
Education / Seminars
The presentation of the DAFNE project was included in the programme of the Summer
School “EU Basics in Public Health Nutrition”, organised by the Unit for Preventive
Nutrition of the Karolinska Institute. The Summer School is included in the curriculum of
the EU Masters in Public Health Nutrition.
12
The DAFNE databank and the DafneSoft tool were also presented to postgraduate students
of the University of Athens Medical School, as well as in a series of seminars for health
professionals undertaken from December 2006 to January 2008 on a monthly basis all over
Greece.
Contributions in other projects
The DAFNE data forms an integral part in the evaluation of the health status of European
populations, which will be undertaken in the context of the European Nutrition and Health
report II project, supported by DG-SANCO and coordinated by the University of Vienna
(http://www.univie.ac.at/enhr/).
Actions towards the enlargement and sustainability of the DAFNE databank
Το ensure the continuity of the DAFNE initiative on exploiting the HBS data and to expand
the DAFNE databank, the Athens Coordinating Centre has submitted a proposal to enlarge
the DAFNE databank by including data from two additional Member States, Estonia and
Lithuania, as well as recent HBS data from Portugal.
Printing of DAFNE bookmarks
Bookmarks highlighting the data available through the DafneSoft application tool; indicating
the website of the tool; and, presenting the DAFNE network have been published and sent to
all members of the Consortium for wide dissemination. The bookmarks are included among
the project’s deliverables.
Presentations
The project has been presented in the following occasions:
• oral presentation at the Inter-country Technical Consultation on National Food-Based
Dietary Guidelines. World Health Organization-Eastern Mediterranean Regional Office
(Cairo, December 2004).
• oral presentation at the International Conference on “Traditional Mediterranean Diet
Past, Present and Future Focusing on Olive Oil and Traditional Food Products. (Athens,
April 2005).
• poster presentation at the International Conference on “Traditional Mediterranean Diet
Past, Present and Future Focusing on Olive Oil and Traditional Food Products. (Athens,
April 2005).
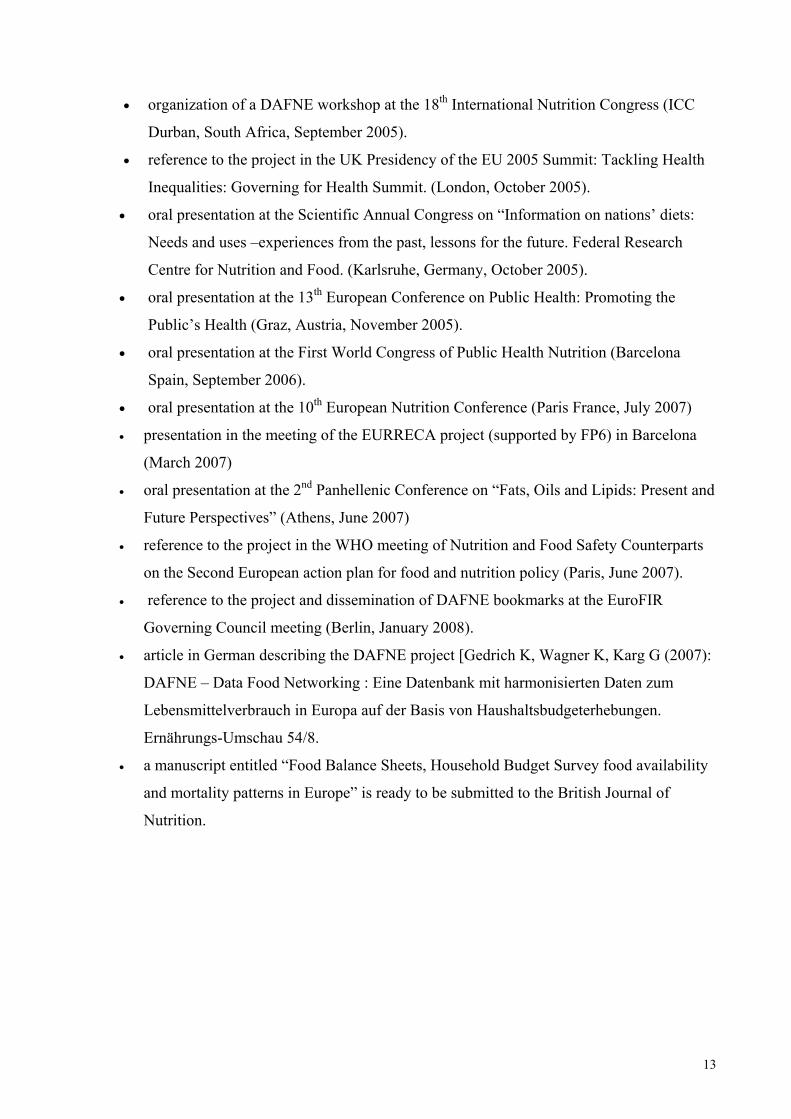
13
• organization of a DAFNE workshop at the 18th International Nutrition Congress (ICC
Durban, South Africa, September 2005).
• reference to the project in the UK Presidency of the EU 2005 Summit: Tackling Health
Inequalities: Governing for Health Summit. (London, October 2005).
• oral presentation at the Scientific Annual Congress on “Information on nations’ diets:
Needs and uses –experiences from the past, lessons for the future. Federal Research
Centre for Nutrition and Food. (Karlsruhe, Germany, October 2005).
• oral presentation at the 13th European Conference on Public Health: Promoting the
Public’s Health (Graz, Austria, November 2005).
• oral presentation at the First World Congress of Public Health Nutrition (Barcelona
Spain, September 2006).
• oral presentation at the 10th European Nutrition Conference (Paris France, July 2007)
• presentation in the meeting of the EURRECA project (supported by FP6) in Barcelona
(March 2007)
• oral presentation at the 2nd Panhellenic Conference on “Fats, Oils and Lipids: Present and
Future Perspectives” (Athens, June 2007)
• reference to the project in the WHO meeting of Nutrition and Food Safety Counterparts
on the Second European action plan for food and nutrition policy (Paris, June 2007).
• reference to the project and dissemination of DAFNE bookmarks at the EuroFIR
Governing Council meeting (Berlin, January 2008).
• article in German describing the DAFNE project [Gedrich K, Wagner K, Karg G (2007):
DAFNE – Data Food Networking : Eine Datenbank mit harmonisierten Daten zum
Lebensmittelverbrauch in Europa auf der Basis von Haushaltsbudgeterhebungen.
Ernährungs-Umschau 54/8.
• a manuscript entitled “Food Balance Sheets, Household Budget Survey food availability
and mortality patterns in Europe” is ready to be submitted to the British Journal of
Nutrition.
14
LIST OF REFERENCES
1. Trichopoulou A, Naska A and DAFNE III Group. European food availability databank
based on household budget surveys: the Data Food Networking initiative. European
Journal of Public Health 2003;13: 24-28.
2. Trichopoulou A, Naska A, Costacou T and DAFNE III Group. Disparities in food habits
across Europe. Proceedings of the Nutrition Society 2002; 61: 553-558.
3. Naska A, Fouskakis D, Oikonomou E, Almeida MD, Berg MA, Gedrich K, Moreiras O,
Nelson M, Trygg K, Turrini A, Remaut AM, Volatier JL, Trichopoulou A. Dietary
patterns and their socio-demographic determinants in 10 European countries: data from
the DAFNE databank. European Journal of Clinical Nutrition 2006; 60: 181-190.
4. European Commission. DG Health and Consumer Protection. Network for the Pan-
European Food Data Bank based on Household Budget Surveys. The DAFNE III project
Available in the web at: http://www.nut.uoa.gr/english/ (accessed on July 2006).
5. European Commission. DG Health and Consumer Protection. Network for the Pan-
European Food Data Bank based on Household Budget Surveys. The DAFNE IV project
Available in the web at: http://www.nut.uoa.gr/english/ (accessed on July 2006).
6. Naska A, Oikonomou E, Trichopoulou A, Wagner K and Gedrich K. Estimations of the
daily energy and nutrient availability based on nationally representative household
budget survey data. The Data Food Networking (DAFNE) project. Public Health Nutr
2007; 10(12): 1422-1429.
7. Vasdekis VG, Stylianou S, Naska A (2001). Estimation of age and gender-specific food
availability from household budget survey data Public Health Nutr. 4(5B): 1149-1151.
8. Lagiou P, Trichopoulou A, Henderickx HK, et al (1999). Household budget survey
nutritional data in relation to mortality from coronary heart disease, colorectal cancer and
female breast cancer in European countries. DAFNE I and II projects of the European
Commission. Data Food Networking. Eur J Clin Nutr.53(4): 328-332.
15
9. Naska A, Vasdekis VG, Trichopoulou A, Friel S, Leonhauser IU, Moreiras O, Nelson M,
Remaut AM, Schmitt A, Sekula W, Trygg KU, Zajkas G. Fruit and vegetable availability
among ten European countries: how does it compare with the 'five-a-day'
recommendation? DAFNE I and II projects of the European Commission. British Journal
of Nutrition 2000; 84(4): 549-556.
10. Trichopoulou A; DAFNE contributors. The DAFNE databank as a simple tool for
nutrition policy. Data Food Networking. Public Health Nutrition 2001; 4(5B): 1187-
1198.
16
Figure 1: Trends in the mean availability of foods of plant origin and added lipids, by year in Cyprus (quantity/person/day)
0
50
100
150
200
250
300
350
Potatoes (g) Pulses (g) Cereals (g) Vegetables (g) Fruits (g) Lipids, added(g)
Food Group
Mea
n, d
aily
, foo
d av
aila
bilit
y
1997 2003
Figure 2: Trends in the mean availability of foods of animal origin, sugar and sugar products, by year in Cyprus (quantity/person/day).
0
50
100
150
200
250
300
350
400
Milk products (g) Meat (g) Fish and seafood (g) Sugar and sugarproducts (g)
Food Group
Mea
n, d
aily
, foo
d av
aila
bilit
y
1997 2003
17
Figure 3: Mean availability of foods of plant origin and added lipids, by educational status of household head in Cyprus in 2003 (quantity/person/day).
0
50
100
150
200
250
300
350
400
Potatoes (g) Pulses (g) Cereals (g) Vegetables (g) Fruits (g) Lipids, added(g)
Food Groups
Mea
n, d
aily
, foo
d av
aila
bilit
y
Illiterate/Elementary education Secondary education Higher education
Figure 4: Mean availability of foods of animal origin, sugar and sugar products, by educational status of household head in Cyprus in 2003 (quantity/person/day).
0
50
100
150
200
250
300
350
400
Milk products (g) Meat (g) Fish and seafood (g) Sugar and sugarproducts (g)
Food Groups
Mea
n, d
aily
, foo
d av
aila
bilit
y
Illiterate/Elementary education Secondary education Higher education
18
Figure 5: Mean availability of foods of plant origin and added lipids, by occupational status of household head in Cyprus in 2003 (quantity/person/day).
0
50
100
150
200
250
300
350
400
450
500
Potatoes (g) Pulses (g) Cereals (g) Vegetables (g) Fruits (g) Lipids, added(g)
Food Groups
Mea
n, d
aily
, foo
d av
aila
bilit
y
Manual Non-manual Retired
Figure 6: Mean availability of foods of animal origin, sugar and sugar products, by occupational status of household head in Cyprus in 2003 (quantity/person/day).
0
50
100
150
200
250
300
350
400
Milk products (g) Meat (g) Fish and seafood (g) Sugar and sugarproducts (g)
Food Groups
Mea
n, d
aily
, foo
d av
aila
bilit
y
Manual Non-manual Retired
19
Figure 7: Mean availability of foods of plant origin and added lipids, by locality of dwelling in Cyprus in 2003 (quantity/person/day).
0
50
100
150
200
250
300
350
Potatoes (g) Pulses (g) Cereals (g) Vegetables (g) Fruits (g) Lipids, added(g)
Food Groups
Mea
n, d
aily
, foo
d av
aila
bilit
y
Rural Urban
Figure 8: Mean availability of foods of animal origin, sugar and sugar products, by locality of dwelling in Cyprus in 2003 (quantity/person/day).
0
50
100
150
200
250
300
350
400
Milk products (g) Meat (g) Fish and seafood (g) Sugar and sugarproducts (g)
Food Groups
Mea
n, d
aily
, foo
d av
aila
bilit
y
Rural Urban
20
Figure 9: Trends in the mean availability of foods of plant origin and added lipids, by survey year in Greece (quantity/person/day).
0
50
100
150
200
250
300
350
400
Potatoes (g) Pulses (g) Cereals (g) Vegetables (g) Fruits (g) Lipids, added(g)
Food Groups
Mea
n, d
aily
food
ava
ilabi
lity
1981 - 82 1987 - 88 1999 - 99 2004 - 05
Figure 10: Trends in the mean availability of foods of animal origin, sugar and sugar products, by survey year in Greece (quantity/person/day).
0
50
100
150
200
250
300
350
Milk products (g) Meat (g) Fish and seafood (g) Sugar and sugarproducts (g)
Food Groups
Mea
n, d
aily
food
ava
ilabi
lity
1981 - 82 1987 - 88 1999 - 99 2004 - 05
21
Figure 11: Mean availability of foods of plant origin and added lipids, by educational status of household head in Greece in 2004 (quantity/person/day).
0
50
100
150
200
250
300
350
Potatoes (g) Pulses (g) Cereals (g) Vegetables (g) Fruits (g) Lipids, added(g)
Food Groups
Mea
n, d
aily
food
ava
ilabi
lity
Illiterate/Elementary education Secondary education Higher education
Figure 12: Mean availability of foods of animal origin, sugar and sugar products, by educational status of household head in Greece in 2004 (quantity/person/day).
0
50
100
150
200
250
300
350
Milk products (g) Meat (g) Fish and seafood (g) Sugar and sugarproducts (g)
Food Groups
Mea
n, d
aily
food
ava
ilabi
lity
Illiterate/Elementary education Secondary education Higher education
22
Figure 13: Mean availability of foods of plant origin and added lipids, by occupational status of household head in Greece in 2004 (quantity/person/day).
0
50
100
150
200
250
300
350
400
Potatoes (g) Pulses (g) Cereals (g) Vegetables (g) Fruits (g) Lipids, added(g)
Food Groups
Mea
n, d
aily
food
ava
ilabi
lity
Manual Non-manual Retired Others
Figure 14: Mean availability of foods of animal origin, sugar and sugar products, by occupational status of household head in Greece in 2004 (quantity/person/day).
0
50
100
150
200
250
300
350
Milk products (g) Meat (g) Fish and seafood (g) Sugar and sugarproducts (g)
Food Groups
Mea
n, d
aily
food
ava
ilabi
lity
Manual Non-manual Retired Others
23
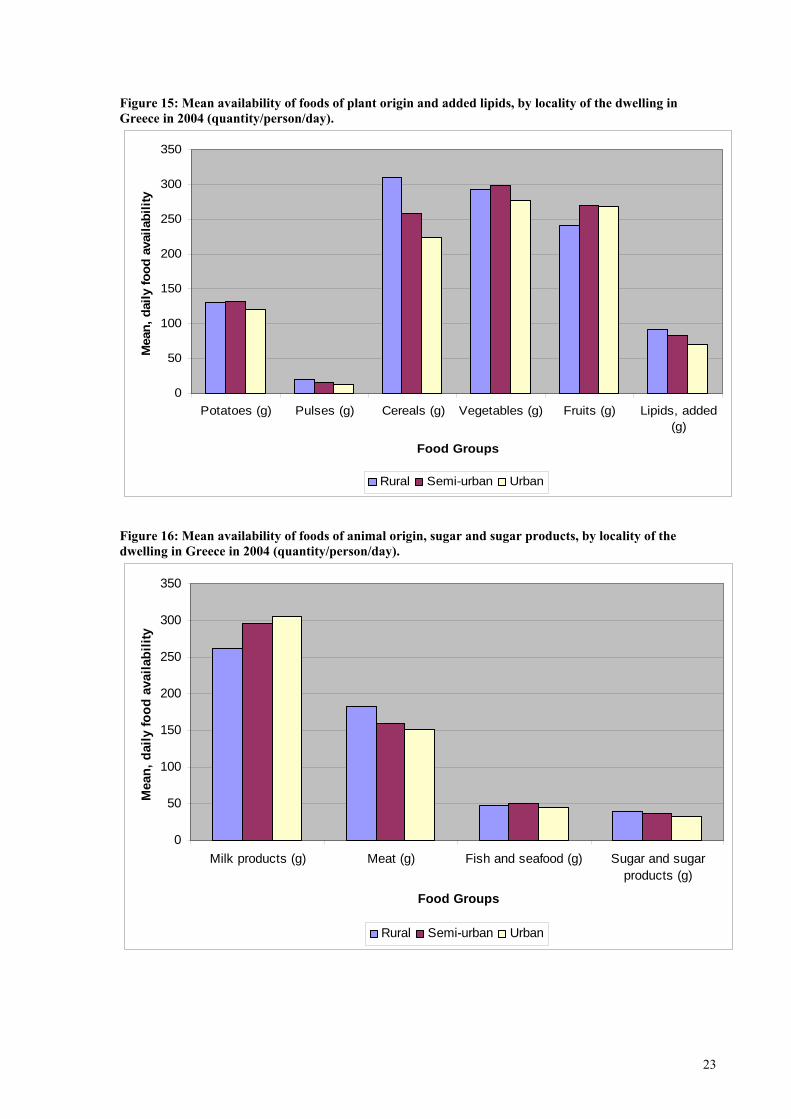
Figure 15: Mean availability of foods of plant origin and added lipids, by locality of the dwelling in Greece in 2004 (quantity/person/day).
0
50
100
150
200
250
300
350
Potatoes (g) Pulses (g) Cereals (g) Vegetables (g) Fruits (g) Lipids, added(g)
Food Groups
Mea
n, d
aily
food
ava
ilabi
lity
Rural Semi-urban Urban
Figure 16: Mean availability of foods of animal origin, sugar and sugar products, by locality of the dwelling in Greece in 2004 (quantity/person/day).
0
50
100
150
200
250
300
350
Milk products (g) Meat (g) Fish and seafood (g) Sugar and sugarproducts (g)
Food Groups
Mea
n, d
aily
food
ava
ilabi
lity
Rural Semi-urban Urban
24
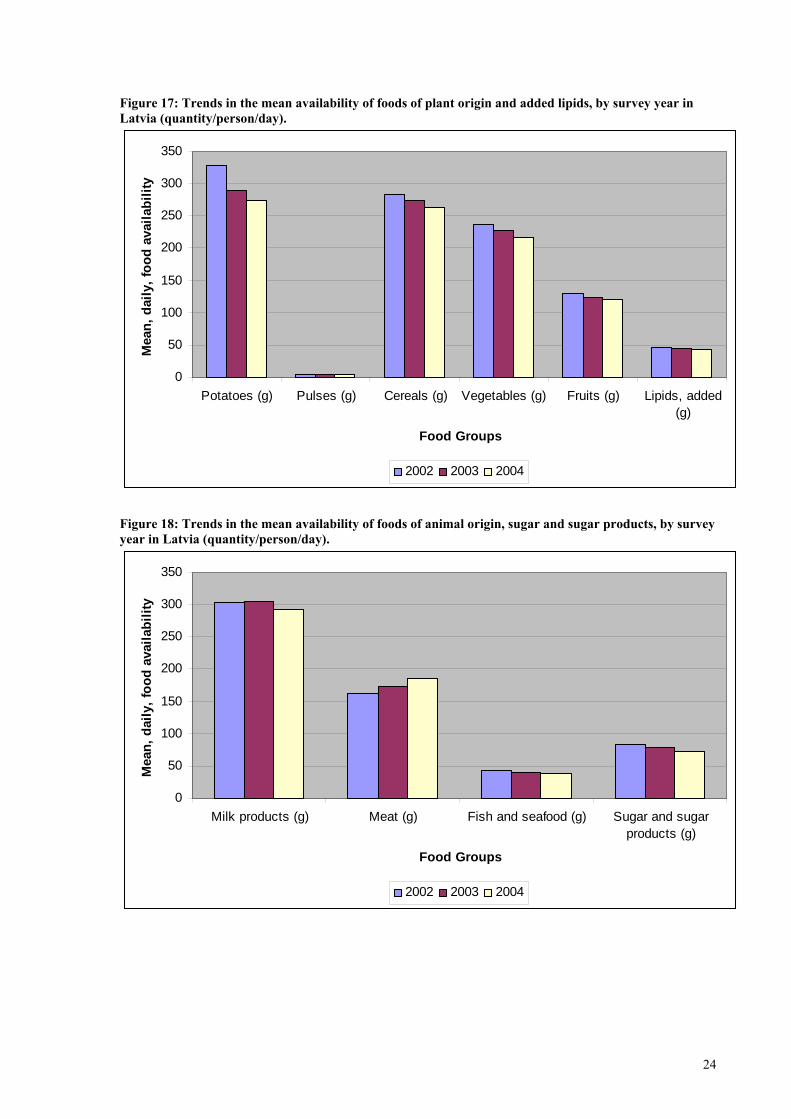
Figure 17: Trends in the mean availability of foods of plant origin and added lipids, by survey year in Latvia (quantity/person/day).
0
50
100
150
200
250
300
350
Potatoes (g) Pulses (g) Cereals (g) Vegetables (g) Fruits (g) Lipids, added(g)
Food Groups
Mea
n, d
aily
, foo
d av
aila
bilit
y
2002 2003 2004
Figure 18: Trends in the mean availability of foods of animal origin, sugar and sugar products, by survey year in Latvia (quantity/person/day).
0
50
100
150
200
250
300
350
Milk products (g) Meat (g) Fish and seafood (g) Sugar and sugarproducts (g)
Food Groups
Mea
n, d
aily
, foo
d av
aila
bilit
y
2002 2003 2004
25
Figure 19: Mean availability of foods of plant origin and added lipids, by educational status of household head in Latvia in 2004 (quantity/person/day).
0
50
100
150
200
250
300
350
400
Potatoes (g) Pulses (g) Cereals (g) Vegetables (g) Fruits (g) Lipids, added(g)
Food Groups
Mea
n, d
aily
, foo
d av
aila
bilit
y
Illiterate/Elementary education Secondary education Higher education
Figure 20: Mean availability of foods of animal origin, sugar and sugar products, by educational status of household head in Latvia in 2004 (quantity/person/day).
0
50
100
150
200
250
300
350
400
Milk products (g) Meat (g) Fish and seafood (g) Sugar and sugarproducts (g)
Food Groups
Mea
n, d
aily
, foo
d av
aila
bilit
y
Illiterate/Elementary education Secondary education Higher education
26
Figure 21: Mean availability of foods of plant origin and added lipids, by occupational status of household head in Latvia in 2004 (quantity/person/day).
0
50
100
150
200
250
300
350
400
Potatoes (g) Pulses (g) Cereals (g) Vegetables (g) Fruits (g) Lipids, added(g)
Food Groups
Mea
n, d
aily
, foo
d av
aila
bilit
y
Manual Non-manual Retired
Figure 22: Mean availability of foods of animal origin, sugar and sugar products, by occupational status of household head in Latvia in 2004 (quantity/person/day).
0
50
100
150
200
250
300
350
400
450
Milk products (g) Meat (g) Fish and seafood (g) Sugar and sugarproducts (g)
Food Groups
Mea
n, d
aily
, foo
d av
aila
bilit
y
Manual Non-manual Retired
27
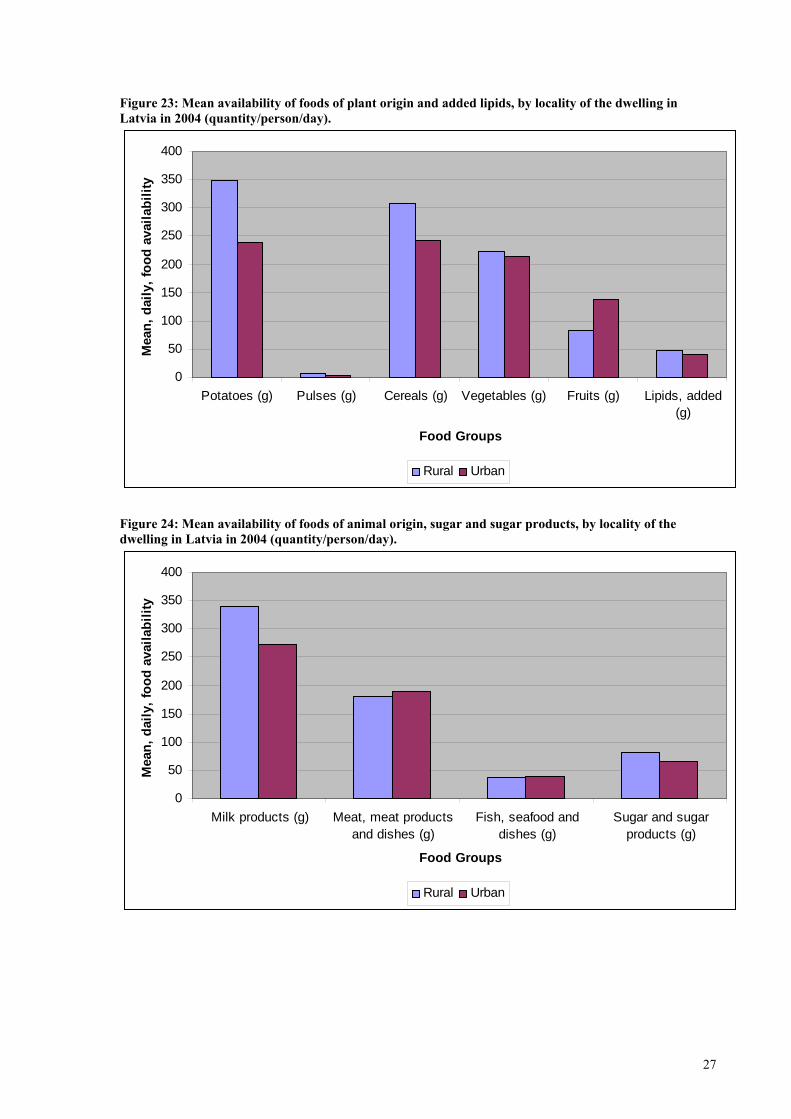
Figure 23: Mean availability of foods of plant origin and added lipids, by locality of the dwelling in Latvia in 2004 (quantity/person/day).
0
50
100
150
200
250
300
350
400
Potatoes (g) Pulses (g) Cereals (g) Vegetables (g) Fruits (g) Lipids, added(g)
Food Groups
Mea
n, d
aily
, foo
d av
aila
bilit
y
Rural Urban
Figure 24: Mean availability of foods of animal origin, sugar and sugar products, by locality of the dwelling in Latvia in 2004 (quantity/person/day).
0
50
100
150
200
250
300
350
400
Milk products (g) Meat, meat productsand dishes (g)
Fish, seafood anddishes (g)
Sugar and sugarproducts (g)
Food Groups
Mea
n, d
aily
, foo
d av
aila
bilit
y
Rural Urban
28
Figure 25: Trends in the mean availability of foods of plant origin and added lipids, by survey year in Malta (quantity/person/day).
0
50
100
150
200
250
300
350
400
450
500
Potatoes (g) Pulses (g) Cereals (g) Vegetables (g) Fruits (g) Lipids, added(g)
Food Groups
Mea
n, d
aily
, foo
d, a
vaila
bilit
y
1994 1995 2000
Figure 26: Trends in the mean availability of foods of animal origin, sugar and sugar products, by survey year in Malta (quantity/person/day).
0
100
200
300
400
500
600
Milk products (g) Meat (g) Fish and seafood (g) Sugar and sugarproducts (g)
Food Groups
Mea
n, d
aily
, foo
d av
aila
bilit
y
1994 1995 2000
29
Figure 27: Mean availability of foods of plant origin and added lipids, by educational status of household head in Malta in 2000 (quantity/person/day).
0
200
400
600
800
1000
1200
Potatoes (g) Pulses (g) Cereals (g) Vegetables(g)
Fruits (g) Lipids, added(g)
Food Groups
Mea
n, d
aily
, foo
d av
aila
bilit
y
Illiterate/ Elementary education Secondary education Higher education
Figure 28: Mean availability of foods of animal origin, sugar and sugar products, by educational status of household head in Malta in 2000 (quantity/person/day).
0
100
200
300
400
500
600
Milk products (g) Meat (g) Fish and seafood (g) Sugar and sugarproducts (g)
Food Groups
Mea
n, d
aily
, foo
d av
aila
bilit
y
Illiterate/ Elementary education Secondary education Higher education
30
Figure 29: Mean availability of foods of plant origin and added lipids, by occupational status of household head in Malta in 2000 (quantity/person/day).
0
100
200
300
400
500
600
700
800
Potatoes (g) Pulses (g) Cereals (g) Vegetables (g) Fruits (g) Lipids, added(g)
Food Groups
Mea
n, d
aily
, foo
d av
aila
bilit
y
Manual Non-manual Retired
Figure 30: Mean availability of foods of animal origin, sugar and sugar products, by occupational status of household head in Malta in 2000 (quantity/person/day).
0
100
200
300
400
500
600
Milk products (g) Meat (g) Fish and seafood (g) Sugar and sugarproducts (g)
Food Groups
Mea
n, d
aily
, foo
d av
aila
bilit
y
Manual Non-manual Retired
31
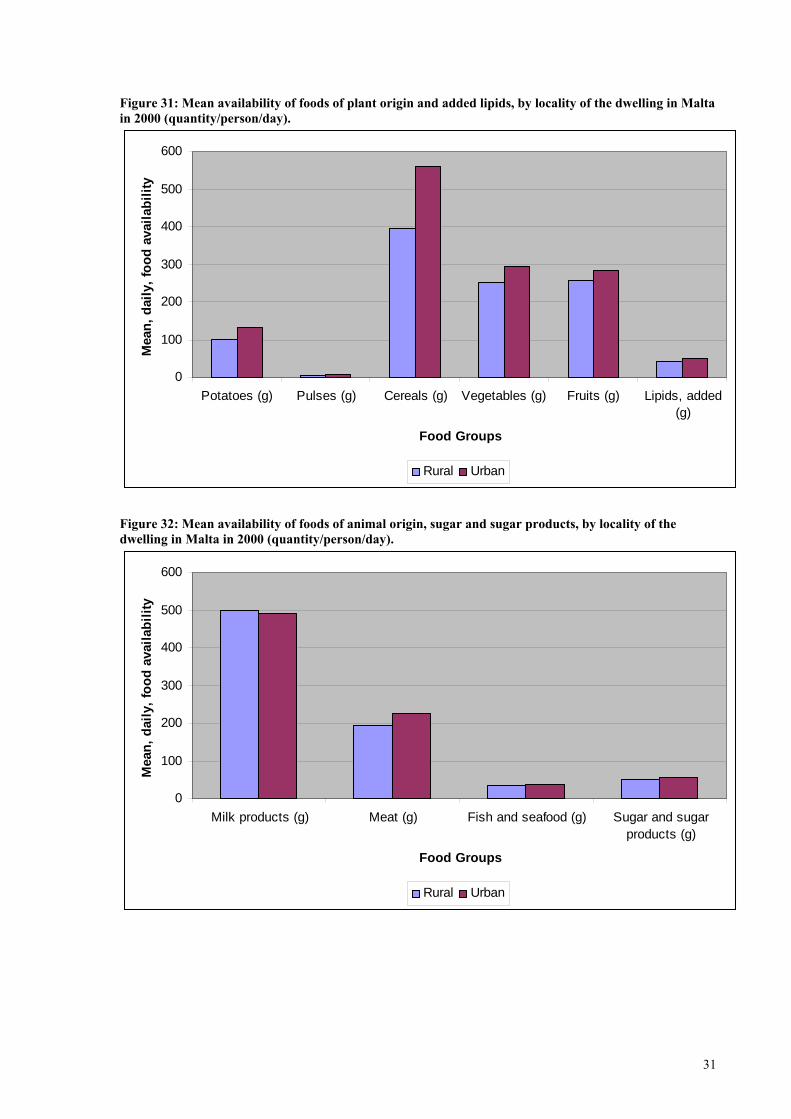
Figure 31: Mean availability of foods of plant origin and added lipids, by locality of the dwelling in Malta in 2000 (quantity/person/day).
0
100
200
300
400
500
600
Potatoes (g) Pulses (g) Cereals (g) Vegetables (g) Fruits (g) Lipids, added(g)
Food Groups
Mea
n, d
aily
, foo
d av
aila
bilit
y
Rural Urban
Figure 32: Mean availability of foods of animal origin, sugar and sugar products, by locality of the dwelling in Malta in 2000 (quantity/person/day).
0
100
200
300
400
500
600
Milk products (g) Meat (g) Fish and seafood (g) Sugar and sugarproducts (g)
Food Groups
Mea
n, d
aily
, foo
d av
aila
bilit
y
Rural Urban

32
Figure 333: Trends in the mean availability of foods of plant origin and added lipids, by survey year in the Republic of Slovenia (quantity/person/day).
0
50
100
150
200
250
300
350
400
Potatoes (g) Pulses (g) Cereals (g) Vegetables (g) Fruits (g) Lipids, added(g)
Food Groups
Mea
n, d
aily
, foo
d av
aila
bilit
y
1998 2000 2002
Figure 34: Trends in the mean availability of foods of animal origin, sugar and sugar products, by survey year in the Republic of Slovenia (quantity/person/day).
0
50
100
150
200
250
300
350
400
Milk products (g) Meat (g) Fish and seafood (g) Sugar and sugarproducts (g)
Food Groups
Mea
n, d
aily
, foo
d av
aila
billi
ty
1998 2000 2002
33
Figure 35: Mean availability of foods of plant origin and added lipids, by educational status of household head in the Republic of Slovenia in 2002 (quantity/person/day).
0
50
100
150
200
250
300
350
400
450
500
Potatoes (g) Pulses (g) Cereals (g) Vegetables (g) Fruits (g) Lipids, added(g)
Food Groups
Mea
n, d
aily
, foo
d av
aila
bilit
y
Illiterate/Elementary education Secondary education Higher education
Figure 36: Mean availability of foods of animal origin, sugar and sugar products, by educational status of household head in the Republic of Slovenia in 2002 (quantity/person/day).
0
50
100
150
200
250
300
350
400
450
500
Milk products (g) Meat (g) Fish and seafood (g) Sugar and sugarproducts (g)
Food Groups
Mea
n, d
aily
, foo
d av
aila
bilty
Illiterate/Elementary education Secondary education Higher education
34
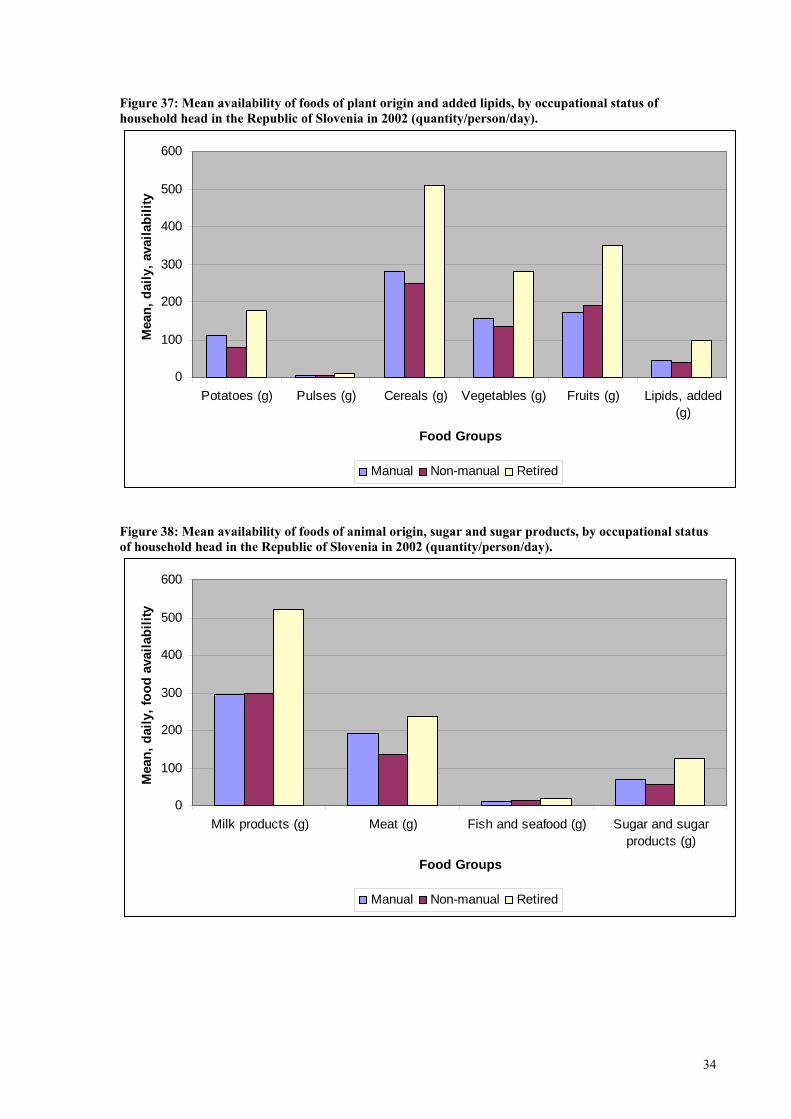
Figure 37: Mean availability of foods of plant origin and added lipids, by occupational status of household head in the Republic of Slovenia in 2002 (quantity/person/day).
0
100
200
300
400
500
600
Potatoes (g) Pulses (g) Cereals (g) Vegetables (g) Fruits (g) Lipids, added(g)
Food Groups
Mea
n, d
aily
, ava
ilabi
lity
Manual Non-manual Retired
Figure 38: Mean availability of foods of animal origin, sugar and sugar products, by occupational status of household head in the Republic of Slovenia in 2002 (quantity/person/day).
0
100
200
300
400
500
600
Milk products (g) Meat (g) Fish and seafood (g) Sugar and sugarproducts (g)
Food Groups
Mea
n, d
aily
, foo
d av
aila
bilit
y
Manual Non-manual Retired
35
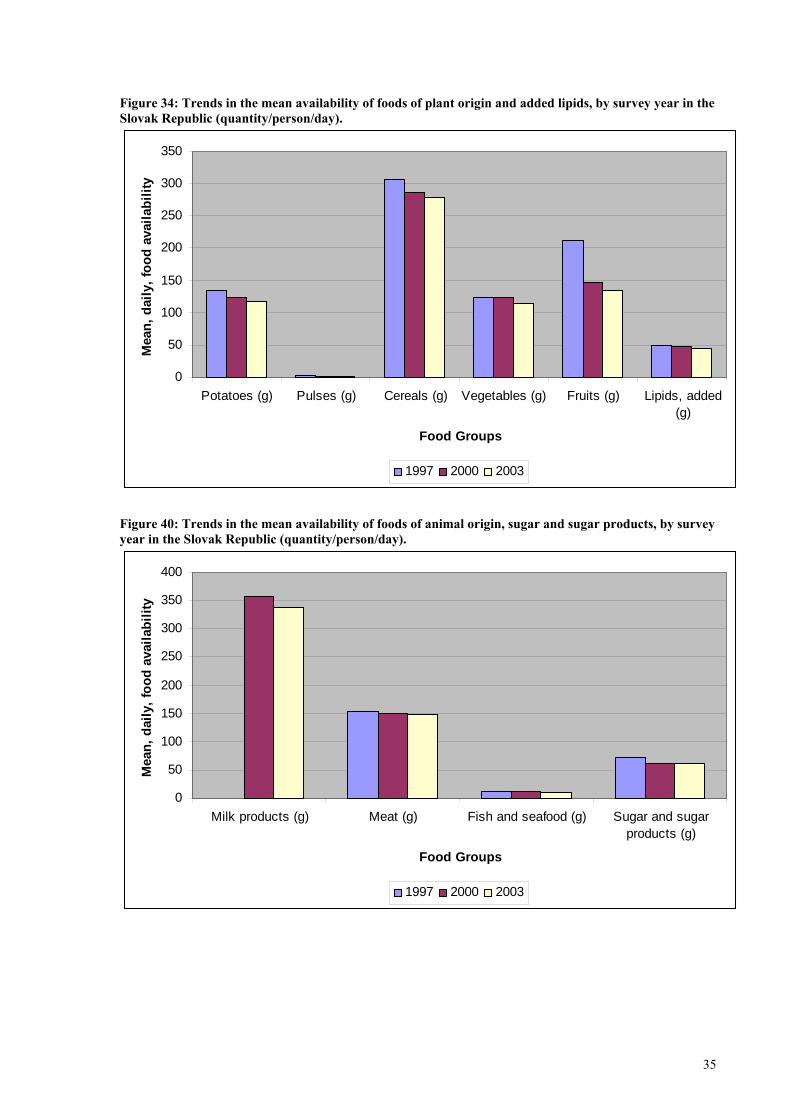
Figure 34: Trends in the mean availability of foods of plant origin and added lipids, by survey year in the Slovak Republic (quantity/person/day).
0
50
100
150
200
250
300
350
Potatoes (g) Pulses (g) Cereals (g) Vegetables (g) Fruits (g) Lipids, added(g)
Food Groups
Mea
n, d
aily
, foo
d av
aila
bilit
y
1997 2000 2003
Figure 40: Trends in the mean availability of foods of animal origin, sugar and sugar products, by survey year in the Slovak Republic (quantity/person/day).
0
50
100
150
200
250
300
350
400
Milk products (g) Meat (g) Fish and seafood (g) Sugar and sugarproducts (g)
Food Groups
Mea
n, d
aily
, foo
d av
aila
bilit
y
1997 2000 2003
36
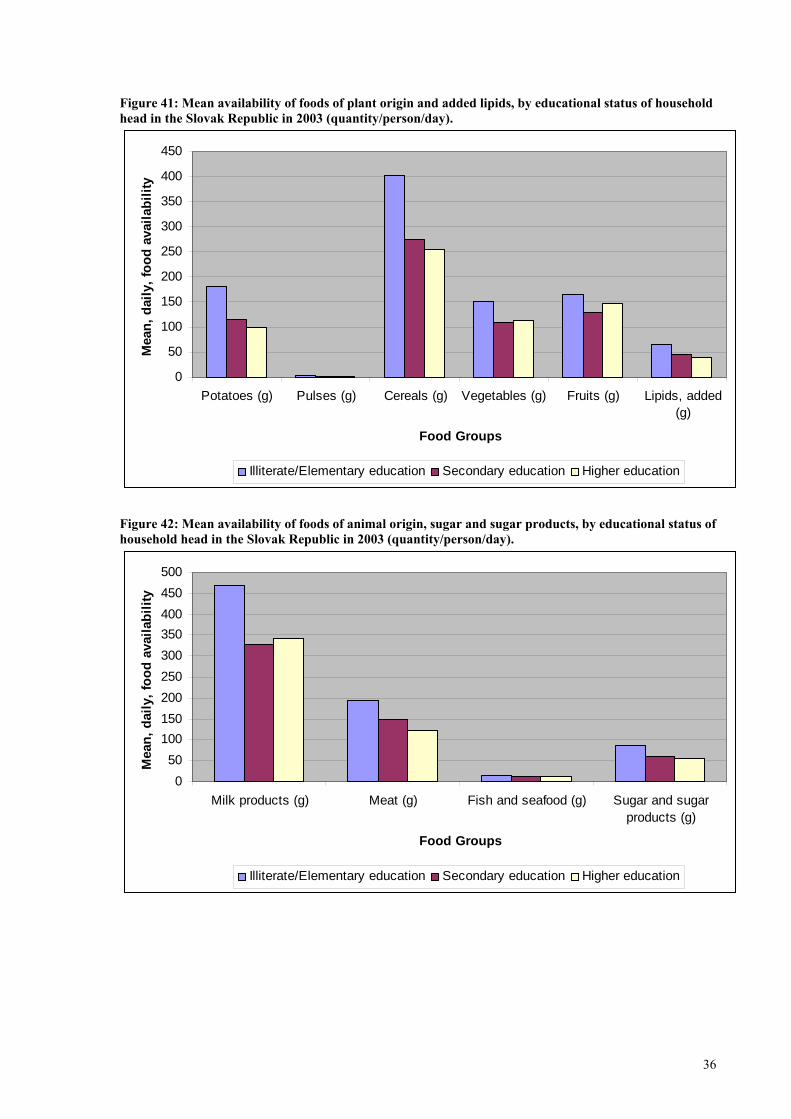
Figure 41: Mean availability of foods of plant origin and added lipids, by educational status of household head in the Slovak Republic in 2003 (quantity/person/day).
0
50
100
150
200
250
300
350
400
450
Potatoes (g) Pulses (g) Cereals (g) Vegetables (g) Fruits (g) Lipids, added(g)
Food Groups
Mea
n, d
aily
, foo
d av
aila
bilit
y
Illiterate/Elementary education Secondary education Higher education
Figure 42: Mean availability of foods of animal origin, sugar and sugar products, by educational status of household head in the Slovak Republic in 2003 (quantity/person/day).
050
100150200250300350400450500
Milk products (g) Meat (g) Fish and seafood (g) Sugar and sugarproducts (g)
Food Groups
Mea
n, d
aily
, foo
d av
aila
bilit
y
Illiterate/Elementary education Secondary education Higher education

37
Figure 43: Mean availability of foods of plant origin and added lipids, by occupational status of household head in the Slovak Republic in 2003 (quantity/person/day).
0
50
100
150
200
250
300
350
400
450
Potatoes (g) Pulses (g) Cereals (g) Vegetables (g) Fruits (g) Lipids, added(g)
Food Groups
Mea
n, d
aily
, foo
d av
aila
bilit
y
Manual Non-manual Retired
Figure 44: Mean availability of foods of animal origin, sugar and sugar products, by occupational status of household head in the Slovak Republic in 2003 (quantity/person/day).
0
100
200
300
400
500
600
Milk products (g) Meat (g) Fish and seafood (g) Sugar and sugarproducts (g)
Food Groups
Mea
n, d
aily
, foo
d av
aila
bilit
y
Manual Non-manual Retired

This report was produced by a contractor for Health & Consumer Protection Directorate General and represents the views of thecontractor or author. These views have not been adopted or in any way approved by the Commission and do not necessarilyrepresent the view of the Commission or the Directorate General for Health and Consumer Protection. The EuropeanCommission does not guarantee the accuracy of the data included in this study, nor does it accept responsibility for any use madethereof.