exp. #1-2 : measurement of the motion of objects by using...
TRANSCRIPT
General Physics Laboratory – Experiment Report
1st Semester, Year 2018
PAGE 1/20
Introductory Physics Office, Department of Physics, College of Science, Korea University Last Update : 2018-02-21
Exp. #1-2 : Measurement of the Motion of Objects by Using a Computer Interface and
Understanding of Newton’s Law of Motion |
Measurement of the Characteristics of the Frictional Force by Using a Computer Interface
Student's
Mentioned
Items
Student ID Major Name Team No. Experiment Lecturer
Experiment Class Date Submission Time Submission PlaceIntroductory Physics Office
Report Box #
※ Students should write down Student’s Mentioned Items at the cover page of Experiment Reports, and then complete Experiment Reports by adding contents
to the attached papers (if needed) in terms of the following sections. Contents of the reports should be written by hand, not by a word processor. Instead, it
is allowed that figures and tables are copied and attached to papers. Completed Experiment Reports should be submitted to the place due to the time specified
by Experiment Lecturers.
▶ The Experiment Report score per each Experiment Class is evaluated by
max. 50 points (basically 15 points).
▶ Solutions of Problems in Experiment Reports are not announced to the
public according to the General Physics Laboratory - Administration Rule.
▶ If a student permits other students to pirate one’s Experiment Reports or
a student pirates Experiment Reports of other students regardless of permission
of original creators, the corresponding Experiment Report score and Active
Participation score will be zero in case of exposure of such situation.
▶ Unless Experiment Reports are submitted to the place due to the time
specified by Experiment Lecturers, the corresponding Experiment Report score
will be zero.
▶ If the submission rate of Experiment Reports is less than or equal to two
thirds, the grade of General Physics Laboratory will be F level.
▶ In order to decide grades of General Physics Laboratory at the end of current
semester, the detailed scores of General Physics Laboratory will be announced
at Introductory Physics Office homepage. Based on the announcement,
students can raise opposition of score error. Since the public evidence is needed
for the confirmation of opposition, students should keep one’s Experiment
Reports completed evaluation by Experiment Lecturers until the Experiment
Report score decision
▶ If a student is absent from the Experiment Class because of proper causes,
the corresponding student should submit documents related to absence causes
to Introductory Physics Office regardless of cause occurrence time until the
grade decision of General Physics Laboratory.
▶ If a student moves the Experiment Class arbitrarily without permission of
Introductory Physics Office, it is noted that the total Experiment Scores will
be zero.
Lecturer's
Mentioned
Items
Submission Time/Place Check Experiment Report Score Evaluation Completion Sign
50

General Physics Laboratory – Experiment Report
1st Semester, Year 2018
PAGE 2/20
Introductory Physics Office, Department of Physics, College of Science, Korea University Last Update : 2018-02-21
1. Objective
A. Measurement of the Motion of Objects by Using a Computer Interface and Understanding of Newton’s Law of Motion : Newton's law of motion will be understood
through the measurement of the relation between the force, the mass, and the acceleration. The basic formulas describing the motion of an object in a straight
line with a constant acceleration will also be understood.
B. Measurement of the Characteristics of the Frictional Force by Using a Computer Interface : The characteristics of the frictional force will be understood through
the measurement of the relation among the frictional force, the normal force, and the roughness of the contact surface.
2. Theory
A. Measurement of the Motion of Objects by Using a Computer Interface and
Understanding of Newton’s Law of Motion
(1) Introduction to Newton's equation of motion
When the mass of an object is constant, the acceleration of the object
increases as the force applied to the object increases. That is, the acceleration
of the object is directly proportional to the force applied to the object
as shown in Fig. 1.
∝ (Eq. 1)
Fig. 1. The relation between acceleration and force for a constant mass.
When the force applied to the object is constant, the acceleration of the
object decreases as the mass of the object increases. That is, the acceleration
of the object is inversely proportional to the mass of the object as shown
in Fig. 2.
∝
(Eq. 2)
Fig. 2. The relation between acceleration and mass for a constant force.
According to Newton's second law of motion, the acceleration of the object
is directly proportional to the force applied to the object and inversely
proportional to the mass of the object which can be summarized as follows:
∝
(Eq. 3)
By introducing the proportionality constant
, the following result can be
obtained.
, (Eq. 4)
Now, let us define the force needed for the object with mass kg to
move with the acceleration ms as kg·ms . From this
definition, so that the following result is obtained.
(Eq. 5)
The SI unit of the force kg·ms is written briefly as N (newton). Since the
force and the acceleration are vectors, the above relation can be rewritten as
follows:
(Eq. 6)
This equation is called as Newton's equation of motion. When various forces
are applied to the object, the net force should be used as follows:
(Eq. 7)
Student ID Name
General Physics Laboratory – Experiment Report
1st Semester, Year 2018
PAGE 3/20
Introductory Physics Office, Department of Physics, College of Science, Korea University Last Update : 2018-02-21
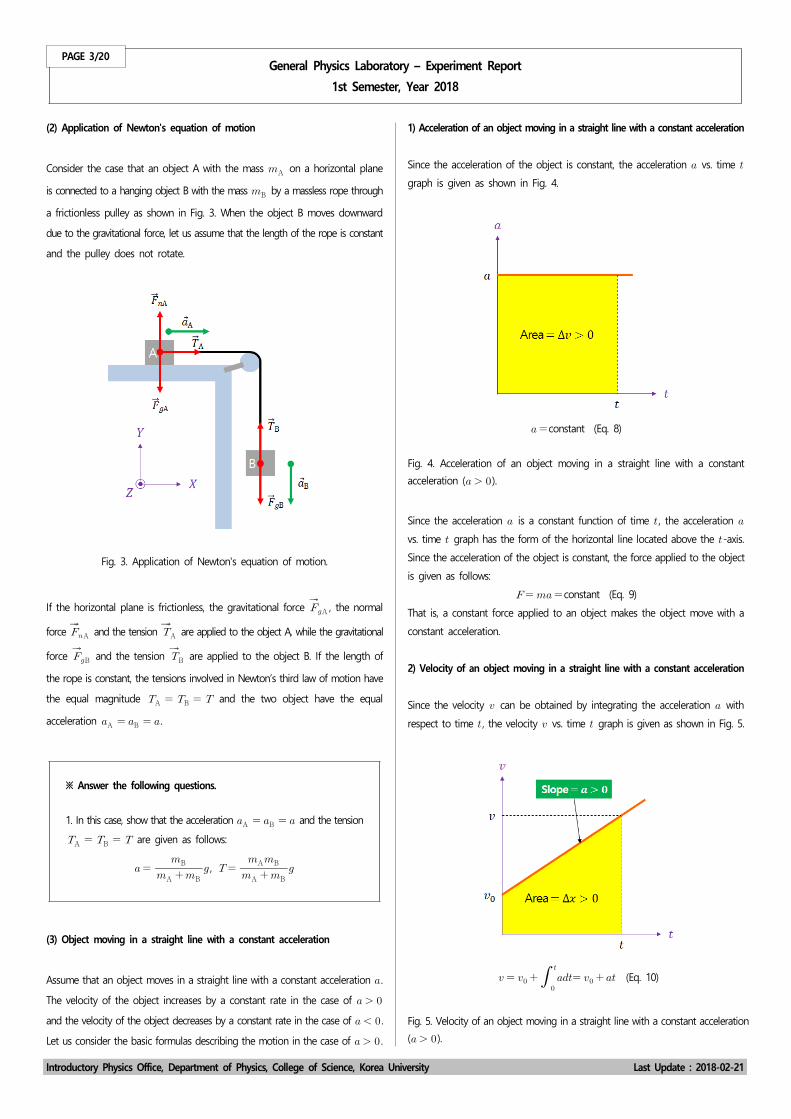
(2) Application of Newton's equation of motion
Consider the case that an object A with the mass A on a horizontal plane
is connected to a hanging object B with the mass B by a massless rope through
a frictionless pulley as shown in Fig. 3. When the object B moves downward
due to the gravitational force, let us assume that the length of the rope is constant
and the pulley does not rotate.
Fig. 3. Application of Newton's equation of motion.
If the horizontal plane is frictionless, the gravitational force A , the normal
force A and the tension A are applied to the object A, while the gravitational
force B and the tension B are applied to the object B. If the length of
the rope is constant, the tensions involved in Newton’s third law of motion have
the equal magnitude A B and the two object have the equal
acceleration A B .
※ Answer the following questions.
1. In this case, show that the acceleration A B and the tension
A B are given as follows:
A B
B , A B
AB
(3) Object moving in a straight line with a constant acceleration
Assume that an object moves in a straight line with a constant acceleration .
The velocity of the object increases by a constant rate in the case of
and the velocity of the object decreases by a constant rate in the case of .
Let us consider the basic formulas describing the motion in the case of .
1) Acceleration of an object moving in a straight line with a constant acceleration
Since the acceleration of the object is constant, the acceleration vs. time
graph is given as shown in Fig. 4.
constant (Eq. 8)
Fig. 4. Acceleration of an object moving in a straight line with a constant
acceleration ( ).
Since the acceleration is a constant function of time , the acceleration
vs. time graph has the form of the horizontal line located above the -axis.
Since the acceleration of the object is constant, the force applied to the object
is given as follows:
constant (Eq. 9)
That is, a constant force applied to an object makes the object move with a
constant acceleration.
2) Velocity of an object moving in a straight line with a constant acceleration
Since the velocity can be obtained by integrating the acceleration with
respect to time , the velocity vs. time graph is given as shown in Fig. 5.
(Eq. 10)
Fig. 5. Velocity of an object moving in a straight line with a constant acceleration
( ).

General Physics Laboratory – Experiment Report
1st Semester, Year 2018
PAGE 4/20
Introductory Physics Office, Department of Physics, College of Science, Korea University Last Update : 2018-02-21
Since the velocity is a linear function of time , the velocity vs. time
graph has the form of the upwardly rising straight line. In the velocity vs.
time graph, the slope corresponds to the acceleration and the intercept
passing across the -axis corresponds to the initial velocity at time .
From (Eq. 10), the area of the acceleration vs. time graph corresponds to
the velocity change which is a positive value.
3) Position of an object moving in a straight line with a constant acceleration
Since the position can be obtained by integrating the velocity with respect
to time , the position vs. time graph is given as shown in Fig. 6.
(Eq. 11)
Fig. 6. Position of an object moving in a straight line with a constant acceleration
( ).
Since the position is a quadratic function of time , the position vs. time
graph has the form of the downwardly convex parabola. In the position
vs. time graph, the slope corresponds to the velocity and the intercept passing
across the -axis corresponds to the initial position at time . The
increasing slope in the position vs. time graph means that the velocity is
increasing. From (Eq. 11), the area of the velocity vs. time graph corresponds
to the position change which has a positive value as follows:
,
(Eq. 12)
In general, the position is not proportional to the square of time ( ). However,
in the special case when the initial position and the initial velocity is zero ( ,
), the relation ∝ can be made.
4) Summary of the basic formulas describing the motion of an object in a straight
line with a constant acceleration
Regarding the initial position and initial velocity as constants and checking
if the velocity , acceleration , time , and position are used as variables
in the basic formulas, they can be summarized as the following table.
Formula
○ ○ ○ ×
? ○ ○ × ○
○ × ○ ○
× ○ ○ ○
In this table, the formula that has the velocity , acceleration , and position
as variables is missing. That formula can be found by inserting
obtained from the formula to the formula
as follows:
,
(Eq. 13)
B. Measurement of the Characteristics of the Frictional Force by Using a Computer
Interface
(1) Introduction to the frictional force
From usual experience, it is well known that the minimum force needed for an
object to move on a surface. Once the object starts to slide on the surface,
the force needed to keep the speed of the object constant is less than the force
needed to start the object to slide. The static frictional force and the kinetic
frictional force were distinguished by Euler in 1784. The static frictional force
opposes the object moving on the surface. If the object keeps stationary, the
magnitude of the external force is equal to that of the static frictional force
until the static frictional force arrives to its maximum value. If the magnitude
of the external force is greater than that of the maximum static frictional force,
the object starts to slide on the surface and the kinetic frictional force will be
applied. When the object starts to slide on the surface, the friction decreases
rapidly. In an actual situation with high speed, the kinetic frictional force is nearly
constant with a slight decrease as the speed increases. In an actual situation
with low speed, the friction is characterized by the combination of the static
frictional force and the kinetic frictional force.
(2) Static frictional force
Assume that the external force is applied to a stationary object lying on the
surface with friction. If the object keeps stationary, the static frictional force
is equal to the external force .
(Eq. 14)

General Physics Laboratory – Experiment Report
1st Semester, Year 2018
PAGE 5/20
Introductory Physics Office, Department of Physics, College of Science, Korea University Last Update : 2018-02-21
If the external force continues to increase until the static frictional force arrives
to its maximum value, the object starts to slide on the surface eventually. The
maximum static frictional force represents the degree of contact between the
object and the surface, and the degree of contact can be described by the normal
force. The maximum static frictional force max is proportional to the normal
force (∝ ), which can be written by introducing the proportionality
constant as follows:
max (Eq. 15)
Here, the subscript means the static state of the object and with no unit
is called as the coefficient of static friction.
(3) Kinetic frictional force
Assume that the object starts to move on the surface due to the external force
greater than the maximum static frictional force. If no external force is applied
after the start of the motion, the object becomes slower to stop eventually due
to the kinetic frictional force. Therefore, the external force equal to the kinetic
frictional force is needed for the object to keep its speed constant. The kinetic
frictional force is proportional to the normal force (∝ ), which can
be written by introducing the proportionality constant as follows:
(Eq. 16)
Here, the subscript means the kinetic state of the object and with no unit
is called as the coefficient of kinetic friction.
(4) Properties of the frictional force
From the external force vs. the frictional force graph as shown in Fig. 7,
the properties of the frictional force can be summarized as follows:
Fig. 7. Relation between the external force and frictional force.
(i) The straight line describing the static frictional force has the angle of ,
if the scales of horizontal and vertical axes are equal.
(ii) Since the maximum static frictional force is greater than the kinetic frictional
force (max ), the coefficient of static friction is greater than the coefficient
of kinetic friction ( ).
(iii) The horizontal line describing the kinetic frictional force implies that the kinetic
frictional force is independent of the magnitude of the external force. In a
theoretical situation, the kinetic frictional force is a constant without regard to
the speed of the object.
(5) Frictional force applied to the object lying on the horizontal plane
Consider the case that the object with the mass lies on the horizontal plane
as shown in Fig. 8. In this case, the gravitational force , the normal force
, the external force , and the frictional force are applied to the object.
Fig. 8. Frictional force applied to the object lying on the horizontal plane.
1) Case of the static state
In the case of the static state, the magnitude of the external force is equal
to that of the static frictional force . Therefore, applying Newton’s
equation of motion, the following results about the net force are obtained.
,
,
Form (Eq. 15), the maximum static frictional force max and the acceleration
of the object are given as follows.
max (Eq. 17)
2) Case of the kinetic state
In the case of the kinetic state, the magnitude of the external force is greater
than that of the kinetic frictional force . Therefore, applying Newton’s
equation of motion, the following results about the net force are obtained.
,
Form (Eq. 16), the kinetic frictional force and the acceleration of the object
are given as follows.
(Eq. 18)

General Physics Laboratory – Experiment Report
1st Semester, Year 2018
PAGE 6/20
Introductory Physics Office, Department of Physics, College of Science, Korea University Last Update : 2018-02-21
(i) (Eq. 17) and (Eq. 18) imply that the frictional force is independent of the area
of the contact surface. The coefficients of static and kinetic friction representing
the roughness of the contact surface are independent of the area of the contact
surface also.
(ii) As the roughness of the contact surface decreases, the coefficient of static
and kinetic friction decreases. However, if the contact surface is ground to the
level of atoms or molecules, the object adheres to the contact surface. This
phenomena is called as cold welding unlike welding which requires much heat.
※ Answer the following questions.
2. Investigate other procedures measuring the coefficients of static and
kinetic friction.

General Physics Laboratory – Experiment Report
1st Semester, Year 2018
PAGE 7/20
Introductory Physics Office, Department of Physics, College of Science, Korea University Last Update : 2018-02-21
3. Experimental Instruments
A. Measurement of the Motion of Objects by Using a Computer Interface and Understanding of Newton’s Law of Motion
Items Quantity Usage Clean up method
Computer 1 set It is used to acquire and analyze data.It should be placed at the center of the
experiment table.
Computer interface 1 set It is used to convert analog signals to digital signals.It should be placed inside the basket of
the experiment table.
Computer interface
-to-power adaptor &
connection cable
1 ea. It is used to connect the computer interface to the wall power.It should be placed inside the basket of
the experiment table.
Motion sensor
-to-computer interface
connection cable
1 ea. It is used to connect the motion sensor to the computer interface.It should be placed inside the basket of
the experiment table.
USB cable 1 ea. It is used to connect the computer interface to the computer.It should be placed inside the basket of
the experiment table.
Force sensor 1 set It is used to measure the force applied to a mechanical cart.It should be attached to a mechanical
cart.
Motion sensor 1 setIt is used to measure the position, velocity, and acceleration of
a mechanical cart.It should be placed on the track.
General Physics Laboratory – Experiment Report
1st Semester, Year 2018
PAGE 8/20
Introductory Physics Office, Department of Physics, College of Science, Korea University Last Update : 2018-02-21
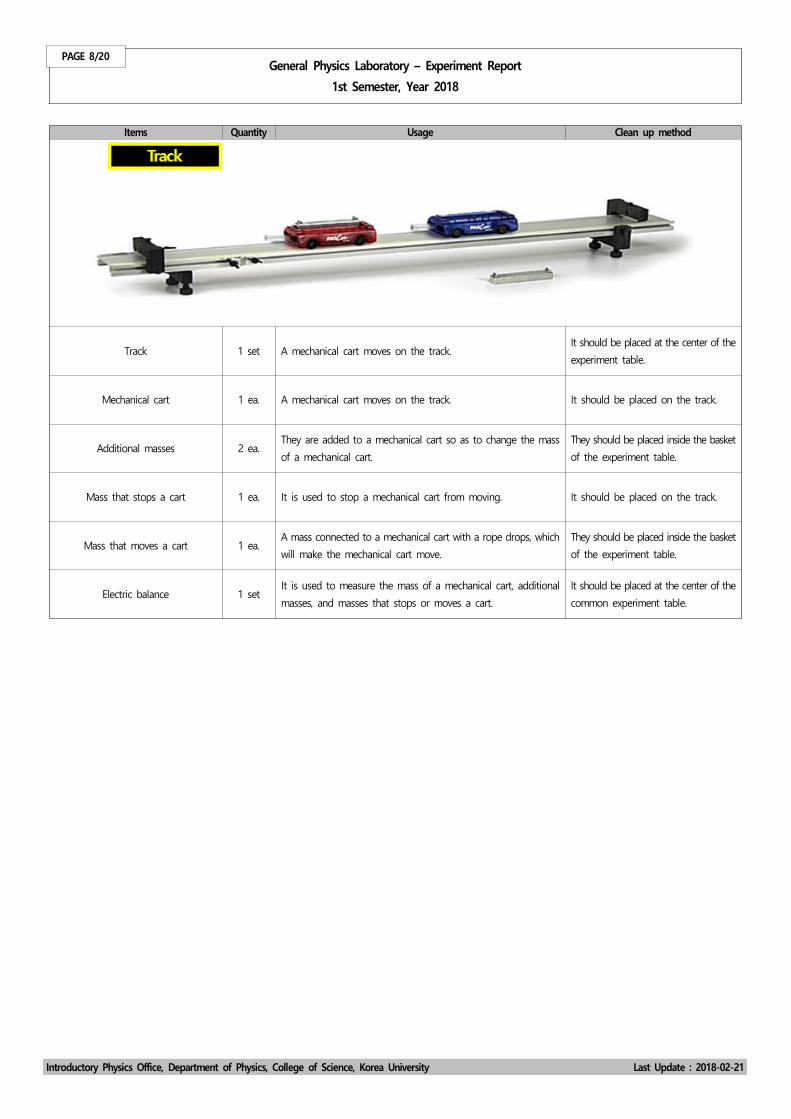
Items Quantity Usage Clean up method
Track 1 set A mechanical cart moves on the track.It should be placed at the center of the
experiment table.
Mechanical cart 1 ea. A mechanical cart moves on the track. It should be placed on the track.
Additional masses 2 ea.They are added to a mechanical cart so as to change the mass
of a mechanical cart.
They should be placed inside the basket
of the experiment table.
Mass that stops a cart 1 ea. It is used to stop a mechanical cart from moving. It should be placed on the track.
Mass that moves a cart 1 ea.A mass connected to a mechanical cart with a rope drops, which
will make the mechanical cart move.
They should be placed inside the basket
of the experiment table.
Electric balance 1 setIt is used to measure the mass of a mechanical cart, additional
masses, and masses that stops or moves a cart.
It should be placed at the center of the
common experiment table.

General Physics Laboratory – Experiment Report
1st Semester, Year 2018
PAGE 9/20
Introductory Physics Office, Department of Physics, College of Science, Korea University Last Update : 2018-02-21
B. Measurement of the Characteristics of the Frictional Force by Using a Computer Interface
Items Quantity Usage Clean up method
Computer 1 set It is used to acquire and analyze data.It should be placed at the center of the
experiment table.
Computer interface 1 set It is used to convert analog signals to digital signals.It should be placed inside the basket of
the experiment table.
Computer interface
-to-power adaptor &
connection cable
1 ea. It is used to the computer interface to the wall power.It should be placed inside the basket of
the experiment table.
USB cable 1 ea. It is used to connect the computer interface to the computer.It should be placed inside the basket of
the experiment table.
Economy force sensor 1 set It is used to measure the force applied to a block.It should be placed inside the basket of
the experiment table.
General Physics Laboratory – Experiment Report
1st Semester, Year 2018
PAGE 10/20
Introductory Physics Office, Department of Physics, College of Science, Korea University Last Update : 2018-02-21
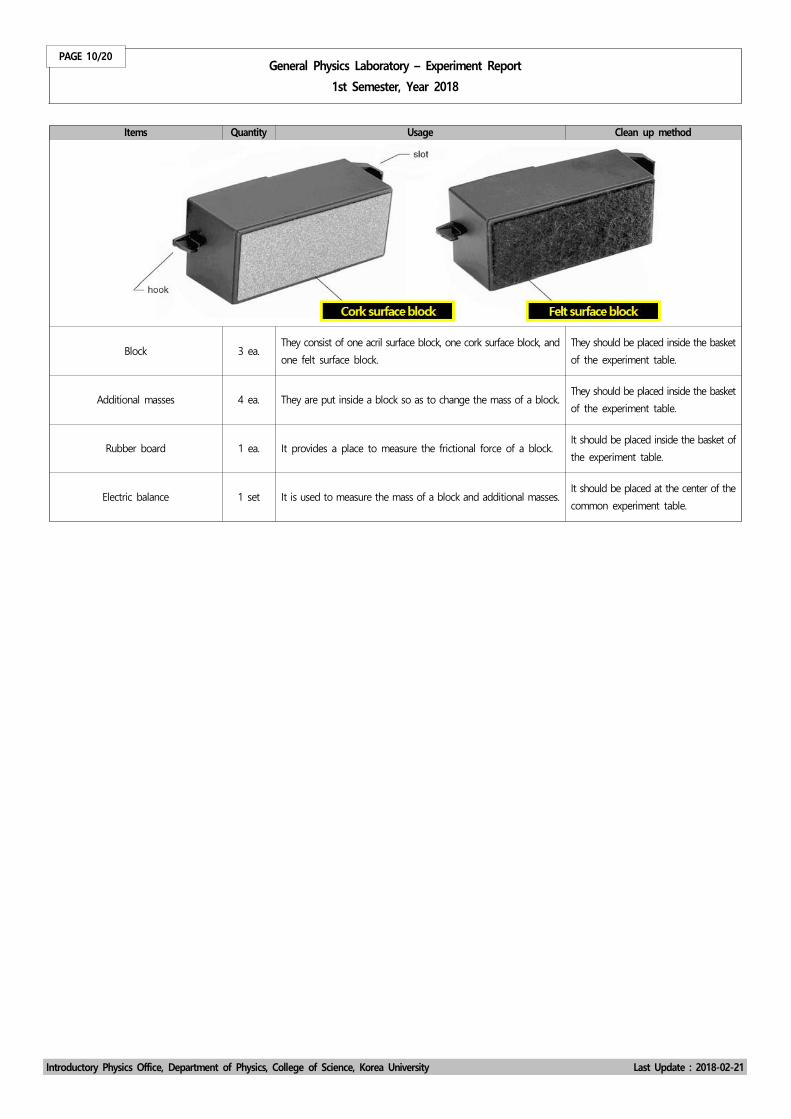
Items Quantity Usage Clean up method
Block 3 ea.They consist of one acril surface block, one cork surface block, and
one felt surface block.
They should be placed inside the basket
of the experiment table.
Additional masses 4 ea. They are put inside a block so as to change the mass of a block.They should be placed inside the basket
of the experiment table.
Rubber board 1 ea. It provides a place to measure the frictional force of a block.It should be placed inside the basket of
the experiment table.
Electric balance 1 set It is used to measure the mass of a block and additional masses.It should be placed at the center of the
common experiment table.

General Physics Laboratory – Experiment Report
1st Semester, Year 2018
PAGE 11/20
Introductory Physics Office, Department of Physics, College of Science, Korea University Last Update : 2018-02-21
< How to Use the Computer Interface) >
[1] After confirming that the computer interface is off, use the computer
interface-to-power adaptor & connection cable to connect the computer
interface to the wall power and keep the computer interface off.
[2] Connect the sensors to the proper analog channels or digital channels and
use the USB cable to connect the computer interface to the computer. Note
that the connection among all experimental instruments should be completed
before the computer interface is turned on. Note that the computer interface
must not be damaged by connecting the computer interface to the computer
while the computer interface is on.
[3] After turning on the computer and the computer interface, open the
Capstone program. If the Capstone window appears, select “Tools → Hardware
Setup → Choose Interface → PASPORT or ScienceWorkshop 750”.
[4] Select the sensors at the positions in the screen that are equivalent to
the positions of the computer interface in the actual experiment by clicking.
[5] After selecting “Displays → Graph or Table” by double-clicking, show graphs
or tables on the screen.
[6] Click the “Record” button of the Capstone program to start the measurement
and check if the acquired data is displayed in the screen. After checking if
the zero status is displayed in the data, click the “Stop” button of the Capstone
program to stop the measurement.
[7] After completing the check of the zero status, click the “Record” button
of the Capstone program again to start the measurement. If the data is
acquired, click the “Stop” button of the Capstone program to stop the
measurement. Repeat this procedure to acquire the correct data.
[8] Save the data in the computer by selecting “File → Export Data → ******.txt”
in the menu of the Capstone program and copy the text files to a USB memory
prepared beforehand.
[9] After the experiment is finished, close the Capstone program and turn off
the computer interface and the computer. Clean up the experimental
instruments according to the suggested method.
General Physics Laboratory – Experiment Report
1st Semester, Year 2018
PAGE 12/20
Introductory Physics Office, Department of Physics, College of Science, Korea University Last Update : 2018-02-21
4. Experimental Procedures
A. Measurement of the Motion of Objects by Using a Computer Interface and
Understanding of Newton’s Law of Motion
(1) After confirming that the computer interface is off, use the computer
interface-to-power adaptor & connection cable to connect the computer
interface to the wall power and keep the computer interface off.
(2) After measuring the mass A of a mechanical cart and additional masses
located on a mechanical cart by using an electric balance, place the mechanical
cart without additional masses on the track. Control the horizontal status of the
track to keep the mechanical cart at rest. Place the motion sensor on the track.
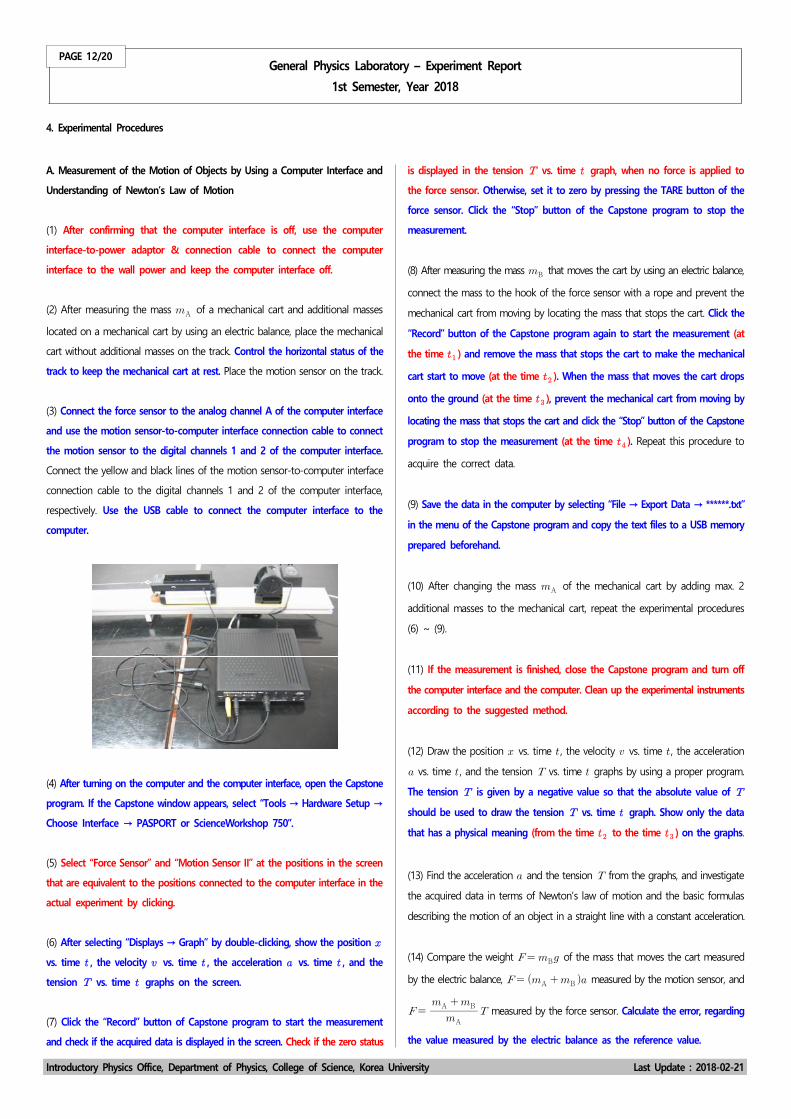
(3) Connect the force sensor to the analog channel A of the computer interface
and use the motion sensor-to-computer interface connection cable to connect
the motion sensor to the digital channels 1 and 2 of the computer interface.
Connect the yellow and black lines of the motion sensor-to-computer interface
connection cable to the digital channels 1 and 2 of the computer interface,
respectively. Use the USB cable to connect the computer interface to the
computer.
(4) After turning on the computer and the computer interface, open the Capstone
program. If the Capstone window appears, select “Tools → Hardware Setup →
Choose Interface → PASPORT or ScienceWorkshop 750”.
(5) Select “Force Sensor” and “Motion Sensor II” at the positions in the screen
that are equivalent to the positions connected to the computer interface in the
actual experiment by clicking.
(6) After selecting “Displays → Graph” by double-clicking, show the position
vs. time , the velocity vs. time , the acceleration vs. time , and the
tension vs. time graphs on the screen.
(7) Click the “Record” button of Capstone program to start the measurement
and check if the acquired data is displayed in the screen. Check if the zero status
is displayed in the tension vs. time graph, when no force is applied to
the force sensor. Otherwise, set it to zero by pressing the TARE button of the
force sensor. Click the “Stop” button of the Capstone program to stop the
measurement.
(8) After measuring the mass B that moves the cart by using an electric balance,
connect the mass to the hook of the force sensor with a rope and prevent the
mechanical cart from moving by locating the mass that stops the cart. Click the
“Record” button of the Capstone program again to start the measurement (at
the time ) and remove the mass that stops the cart to make the mechanical
cart start to move (at the time ). When the mass that moves the cart drops
onto the ground (at the time ), prevent the mechanical cart from moving by
locating the mass that stops the cart and click the “Stop” button of the Capstone
program to stop the measurement (at the time ). Repeat this procedure to
acquire the correct data.
(9) Save the data in the computer by selecting “File → Export Data → ******.txt”
in the menu of the Capstone program and copy the text files to a USB memory
prepared beforehand.
(10) After changing the mass A of the mechanical cart by adding max. 2
additional masses to the mechanical cart, repeat the experimental procedures
(6) ~ (9).
(11) If the measurement is finished, close the Capstone program and turn off
the computer interface and the computer. Clean up the experimental instruments
according to the suggested method.
(12) Draw the position vs. time , the velocity vs. time , the acceleration
vs. time , and the tension vs. time graphs by using a proper program.
The tension is given by a negative value so that the absolute value of
should be used to draw the tension vs. time graph. Show only the data
that has a physical meaning (from the time to the time ) on the graphs.
(13) Find the acceleration and the tension from the graphs, and investigate
the acquired data in terms of Newton's law of motion and the basic formulas
describing the motion of an object in a straight line with a constant acceleration.
(14) Compare the weight B of the mass that moves the cart measured
by the electric balance, A B measured by the motion sensor, and
A
A B measured by the force sensor. Calculate the error, regarding
the value measured by the electric balance as the reference value.
General Physics Laboratory – Experiment Report
1st Semester, Year 2018
PAGE 13/20
Introductory Physics Office, Department of Physics, College of Science, Korea University Last Update : 2018-02-21
B. Measurement of the Characteristics of the Frictional Force by Using a Computer
Interface
(1) After confirming that the computer interface is off, use the computer
interface-to-power adaptor & connection cable to connect the computer
interface to the wall power and keep the computer interface off.
(2) Connect the economy force sensor to the analog channel A of the computer
interface and use the USB cable to connect the computer interface to the
computer.
(3) After turning on the computer and the computer interface, open the Capstone
program. If the Capstone window appears, select “Tools → Hardware Setup →
Choose Interface → PASPORT or ScienceWorkshop 750”.
(4) Select “Force Sensor, Economy” at the position in the screen that is equivalent
to the position connected to the computer interface in the actual experiment
by clicking.
(5) After selecting “Displays → Graph” by double-clicking, show the frictional
force vs. time graph on the screen.
(6) Click the “Record” button of the Capstone program to start the measurement
and check if the acquired data is displayed on the screen. Check if the zero
status is displayed in the frictional force vs. time graph, when no force
is applied to the economy force sensor. Otherwise, set it to zero by pressing
the TARE button of the economy force sensor. Click the “Stop” button of the
Capstone program to stop measurement.
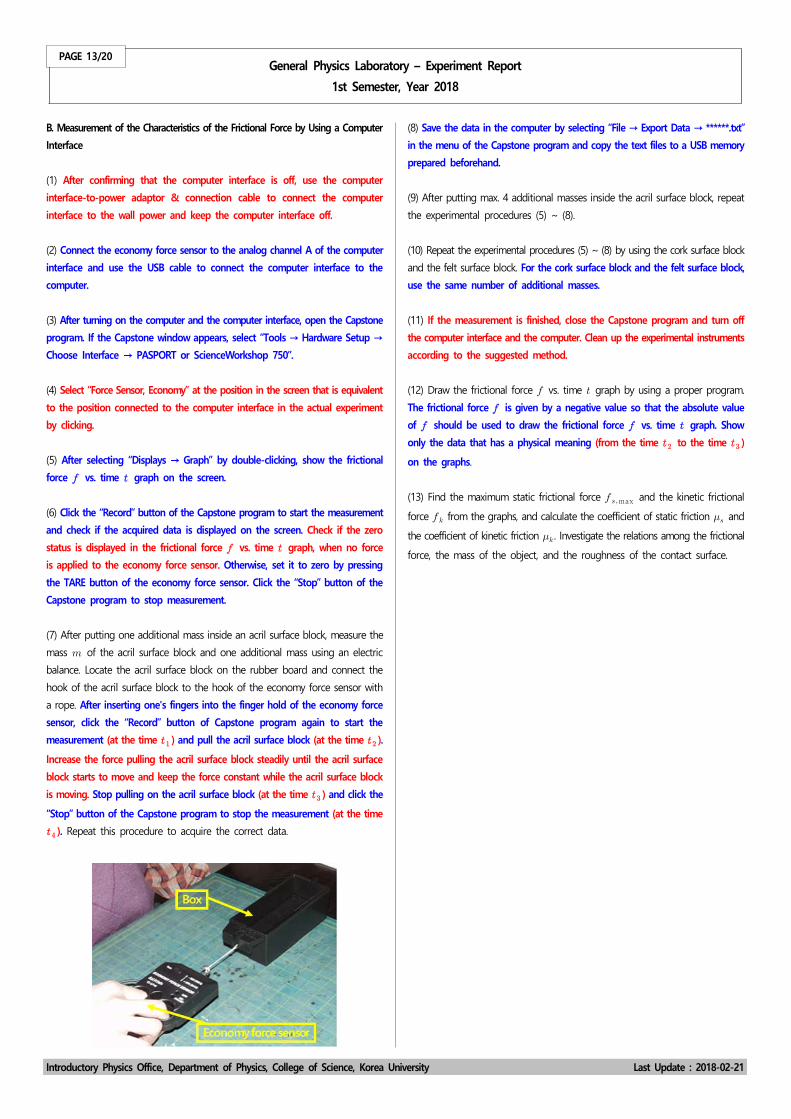
(7) After putting one additional mass inside an acril surface block, measure the
mass of the acril surface block and one additional mass using an electric
balance. Locate the acril surface block on the rubber board and connect the
hook of the acril surface block to the hook of the economy force sensor with
a rope. After inserting one's fingers into the finger hold of the economy force
sensor, click the “Record” button of Capstone program again to start the
measurement (at the time ) and pull the acril surface block (at the time ).
Increase the force pulling the acril surface block steadily until the acril surface
block starts to move and keep the force constant while the acril surface block
is moving. Stop pulling on the acril surface block (at the time ) and click the
“Stop” button of the Capstone program to stop the measurement (at the time
). Repeat this procedure to acquire the correct data.
(8) Save the data in the computer by selecting “File → Export Data → ******.txt”
in the menu of the Capstone program and copy the text files to a USB memory
prepared beforehand.
(9) After putting max. 4 additional masses inside the acril surface block, repeat
the experimental procedures (5) ~ (8).
(10) Repeat the experimental procedures (5) ~ (8) by using the cork surface block
and the felt surface block. For the cork surface block and the felt surface block,
use the same number of additional masses.
(11) If the measurement is finished, close the Capstone program and turn off
the computer interface and the computer. Clean up the experimental instruments
according to the suggested method.
(12) Draw the frictional force vs. time graph by using a proper program.
The frictional force is given by a negative value so that the absolute value
of should be used to draw the frictional force vs. time graph. Show
only the data that has a physical meaning (from the time to the time )
on the graphs.
(13) Find the maximum static frictional force max and the kinetic frictional
force from the graphs, and calculate the coefficient of static friction and
the coefficient of kinetic friction . Investigate the relations among the frictional
force, the mass of the object, and the roughness of the contact surface.

General Physics Laboratory – Experiment Report
1st Semester, Year 2018
PAGE 14/20
Introductory Physics Office, Department of Physics, College of Science, Korea University Last Update : 2018-02-21
5. Experimental Values
A. Measurement of the Motion of Objects by Using a Computer Interface and Understanding of Newton’s Law of Motion
(1) Mechanical cart + 0 additional mass
# of additional masses Mass A of the mechanical cart
+ additional masses (g )
Mass B that moves the cart (g ) Gravitational acceleration (ms )
1) Position measured by the motion sensor 2) Velocity measured by the motion sensor
3) Acceleration measured by the motion sensor
Acceleration (ms )
4) Tension measured by the force sensor
Tension (N )
Experiment FormulaWeight of the mass
that moves the cart (N )
Error
(%)Value measured by the
electric balance [Reference value] B
Value measured by the
motion sensor A B
Value measured by the
force sensor A
A B

General Physics Laboratory – Experiment Report
1st Semester, Year 2018
PAGE 15/20
Introductory Physics Office, Department of Physics, College of Science, Korea University Last Update : 2018-02-21
(2) Mechanical cart + 1 additional mass
# of additional masses Mass A of the mechanical cart
+ additional masses (g )
Mass B that moves the cart (g ) Gravitational acceleration (ms )
1) Position measured by the motion sensor 2) Velocity measured by the motion sensor
3) Acceleration measured by the motion sensor
Acceleration (ms )
4) Tension measured by the force sensor
Tension (N )
Experiment FormulaWeight of the mass
that moves the cart (N )
Error
(%)Value measured by the
electric balance [Reference value] B
Value measured by the
motion sensor A B
Value measured by the
force sensor A
A B
General Physics Laboratory – Experiment Report
1st Semester, Year 2018
PAGE 16/20
Introductory Physics Office, Department of Physics, College of Science, Korea University Last Update : 2018-02-21
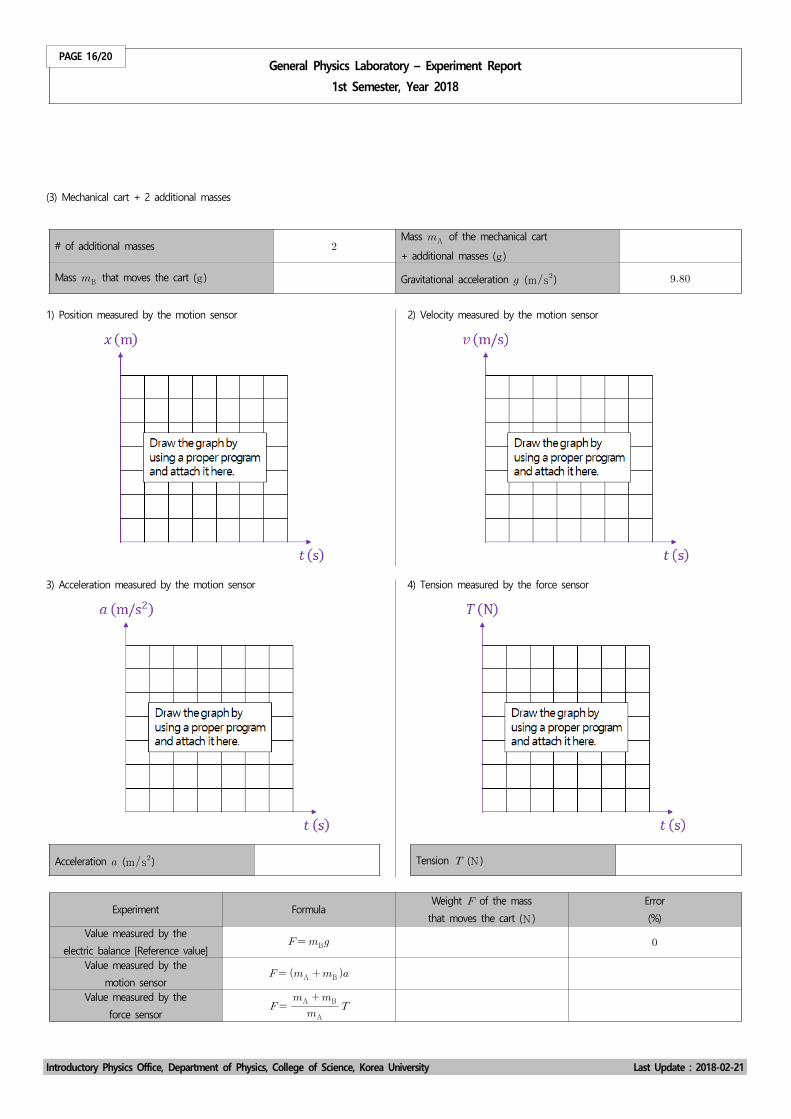
(3) Mechanical cart + 2 additional masses
# of additional masses Mass A of the mechanical cart
+ additional masses (g )
Mass B that moves the cart (g ) Gravitational acceleration (ms )
1) Position measured by the motion sensor 2) Velocity measured by the motion sensor
3) Acceleration measured by the motion sensor
Acceleration (ms )
4) Tension measured by the force sensor
Tension (N )
Experiment FormulaWeight of the mass
that moves the cart (N )
Error
(%)Value measured by the
electric balance [Reference value] B
Value measured by the
motion sensor A B
Value measured by the
force sensor A
A B

General Physics Laboratory – Experiment Report
1st Semester, Year 2018
PAGE 17/20
Introductory Physics Office, Department of Physics, College of Science, Korea University Last Update : 2018-02-21
B. Measurement of the Characteristics of the Frictional Force by Using a Computer Interface
(1) Acril surface block
1) Acril surface block + 1 additional mass
# of additional masses
Mass of the block + additional masses (g )
Maximum static frictional force max (N )
Kinetic frictional force (N )
2) Acril surface block + 2 additional masses
# of additional masses
Mass of the block + additional masses (g )
Maximum static frictional force max (N )
Kinetic frictional force (N )
3) Acril surface block + 3 additional masses
# of additional masses
Mass of the block + additional masses (g )
Maximum static frictional force max (N )
Kinetic frictional force (N )
4) Acril surface block + 4 additional masses
# of additional masses
Mass of the block + additional masses (g )
Maximum static frictional force max (N )
Kinetic frictional force (N )

General Physics Laboratory – Experiment Report
1st Semester, Year 2018
PAGE 18/20
Introductory Physics Office, Department of Physics, College of Science, Korea University Last Update : 2018-02-21
(2) Cork surface block
# of additional masses
Mass of the block + additional masses (g )
Maximum static frictional force max (N )
Kinetic frictional force (N )
(3) Felt surface block
# of additional masses
Mass of the block + additional masses (g )
Maximum static frictional force max (N )
Kinetic frictional force (N )
※ For the cork surface block and the felt surface block, use the same number of additional masses.
(4) Calculation of the coefficient of friction
Gravitational acceleration (ms )
Block# of additional
masses
Mass of the block
+ additional masses
(g )
Maximum
static frictional force
max (N )
Kinetic frictional force
(N )
Coefficient of
static friction
max
Coefficient of
kinetic friction
Acril
surface block
Average
Cork
surface blockFelt
surface block
General Physics Laboratory – Experiment Report
1st Semester, Year 2018
PAGE 19/20
Introductory Physics Office, Department of Physics, College of Science, Korea University Last Update : 2018-02-21
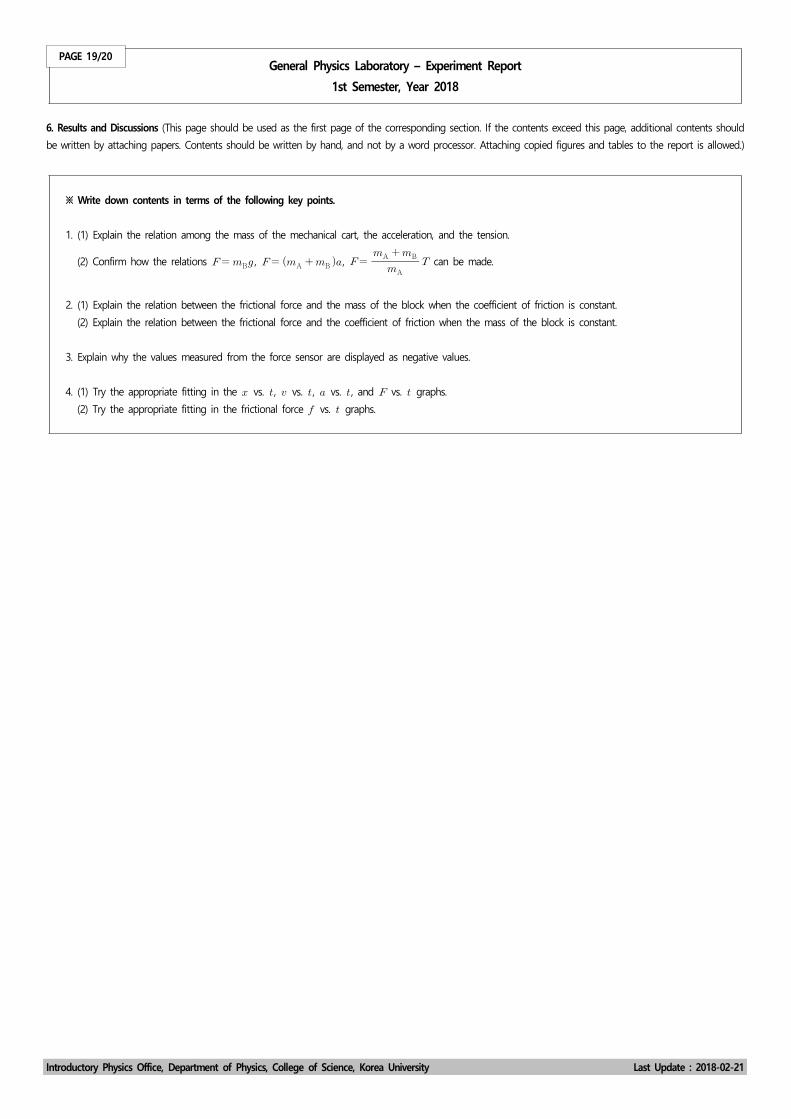
6. Results and Discussions (This page should be used as the first page of the corresponding section. If the contents exceed this page, additional contents should
be written by attaching papers. Contents should be written by hand, and not by a word processor. Attaching copied figures and tables to the report is allowed.)
※ Write down contents in terms of the following key points.
1. (1) Explain the relation among the mass of the mechanical cart, the acceleration, and the tension.
(2) Confirm how the relations B , A B , A
A B can be made.
2. (1) Explain the relation between the frictional force and the mass of the block when the coefficient of friction is constant.
(2) Explain the relation between the frictional force and the coefficient of friction when the mass of the block is constant.
3. Explain why the values measured from the force sensor are displayed as negative values.
4. (1) Try the appropriate fitting in the vs. , vs. , vs. , and vs. graphs.
(2) Try the appropriate fitting in the frictional force vs. graphs.

General Physics Laboratory – Experiment Report
1st Semester, Year 2018
PAGE 20/20
Introductory Physics Office, Department of Physics, College of Science, Korea University Last Update : 2018-02-21
7. Solution of Problems (This page should be used as the first page of the corresponding section. If the contents exceed this page, additional contents should
be written by attaching papers. Contents should be written by hand, and not by a word processor. Attaching copied figures and tables to the report is allowed.)
8. Reference