xiaoyangmeng john crittenden - home | bbiss€¦ · tce exp formic acid exp oxalic acid exp 20 ×...
TRANSCRIPT

1
Review of Advanced Oxidation Technologies for the Removal of
Emerging Contaminants
Xiaoyang MengJohn Crittenden
Brook Byers Institute for Sustainable SystemsSchool of Civil and Environmental Engineering
Georgia Institute of Technology
Government Accountability Office (GAO) -Municipal Water Technology WorkshopJanuary 29-30, 2015 Washington, DC

Impaired Water Quality
Coastal Waters and Estuaries have not improved. In fact there is evidence that they are getting worse due to:– Increasing population anddevelopment– Slow build‐up of polluted sediments(anoxia, metals, PCBs, pesticides)National Coastal ConditionReport, EPA‐620/R‐01/005
In 80 percent of the 139 streams sampled by USGS in 2001, one or more of the 95 organic wastewater contaminants were detected. Mixtures of the chemicals were common; 75 percent of the streams had more than one, 50 percent had 7 or more, and 34 percent had 10 or more."
Graphic courtesy of Environment America: Wasting our Waterways 2012
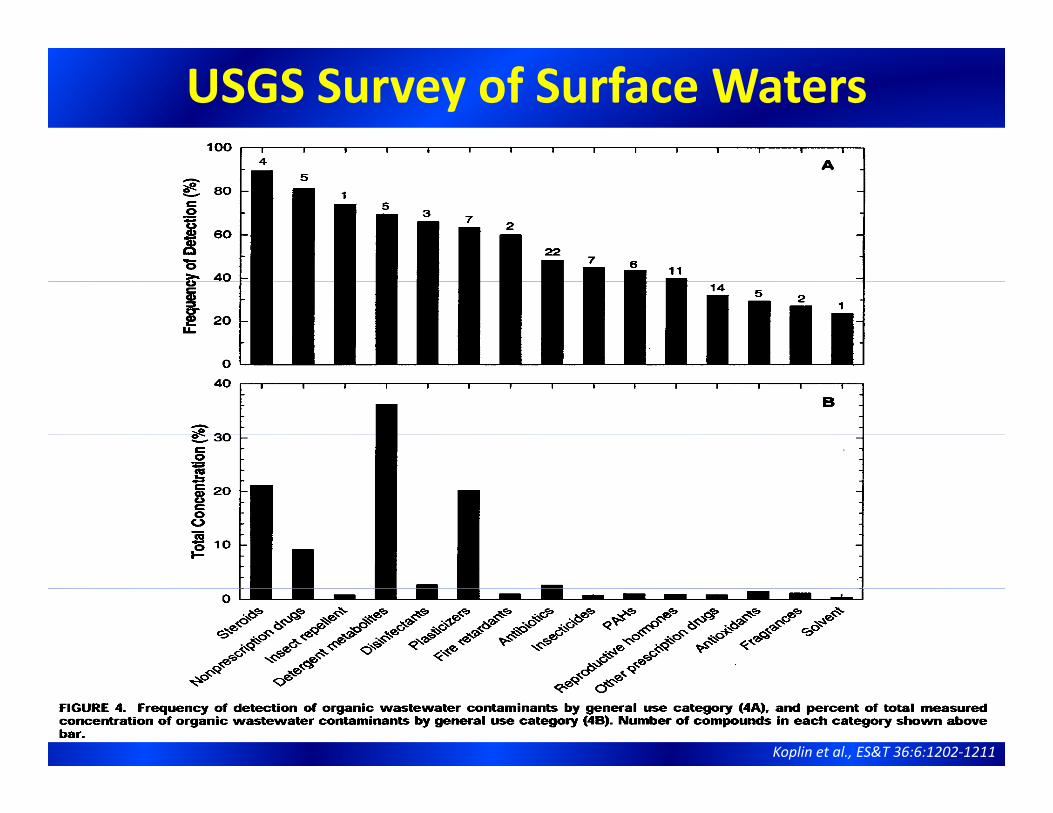
USGS Survey of Surface Waters
Koplin et al., ES&T 36:6:1202‐1211
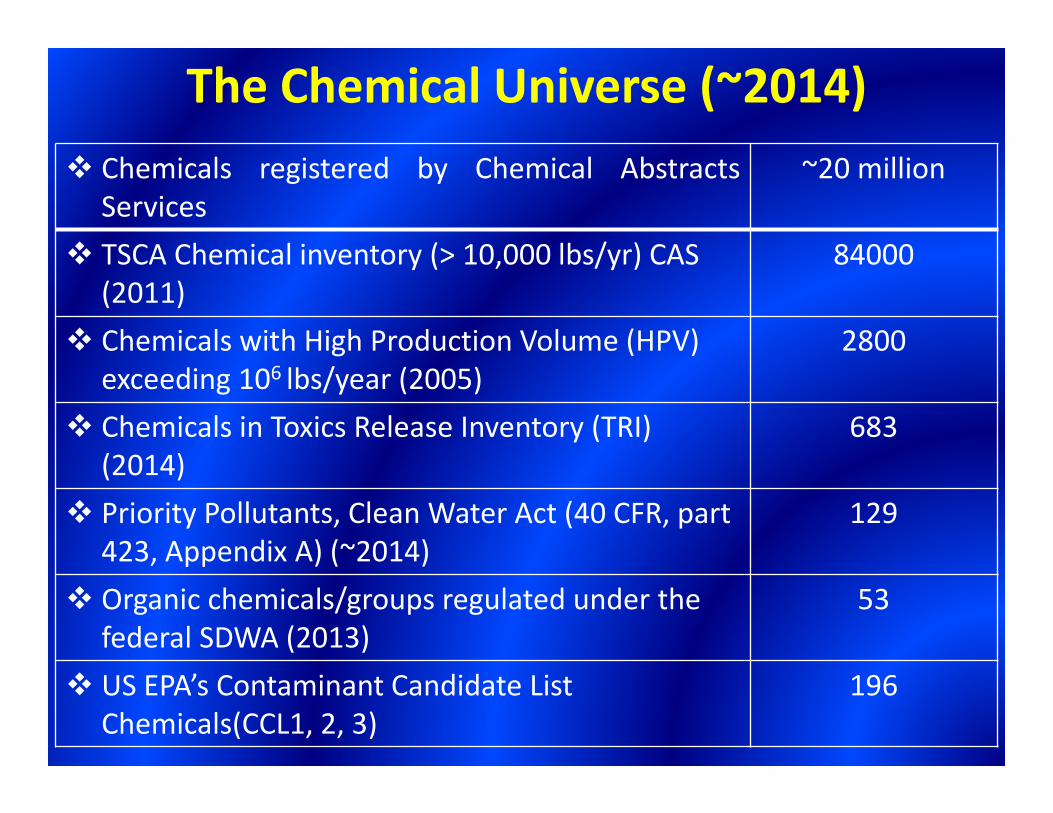
The Chemical Universe (~2014) Chemicals registered by Chemical Abstracts
Services~20 million
TSCA Chemical inventory (> 10,000 lbs/yr) CAS (2011)
84000
Chemicals with High Production Volume (HPV) exceeding 106 lbs/year (2005)
2800
Chemicals in Toxics Release Inventory (TRI) (2014)
683
Priority Pollutants, Clean Water Act (40 CFR, part 423, Appendix A) (~2014)
129
Organic chemicals/groups regulated under the federal SDWA (2013)
53
US EPA’s Contaminant Candidate List Chemicals(CCL1, 2, 3)
196
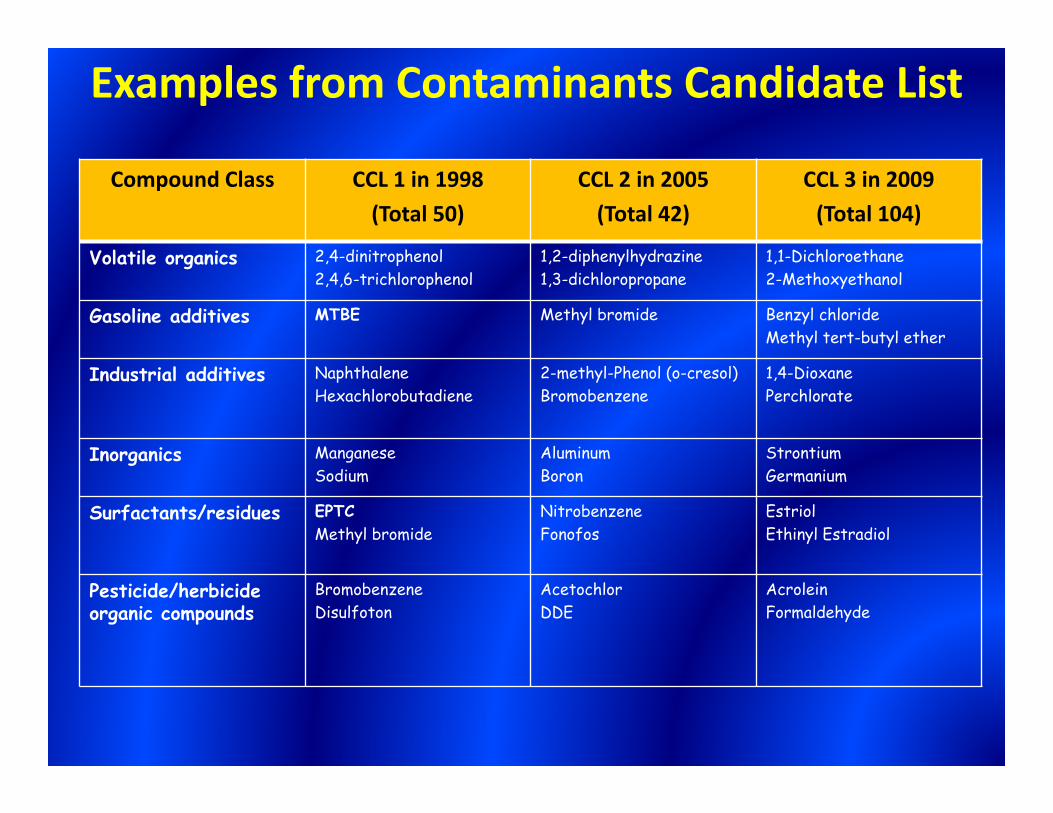
Examples from Contaminants Candidate List
Compound Class CCL 1 in 1998(Total 50)
CCL 2 in 2005(Total 42)
CCL 3 in 2009(Total 104)
Volatile organics 2,4-dinitrophenol2,4,6-trichlorophenol
1,2-diphenylhydrazine1,3-dichloropropane
1,1-Dichloroethane2-Methoxyethanol
Gasoline additives MTBE Methyl bromide Benzyl chlorideMethyl tert-butyl ether
Industrial additives NaphthaleneHexachlorobutadiene
2-methyl-Phenol (o-cresol)Bromobenzene
1,4-DioxanePerchlorate
Inorganics ManganeseSodium
AluminumBoron
StrontiumGermanium
Surfactants/residues EPTCMethyl bromide
NitrobenzeneFonofos
EstriolEthinyl Estradiol
Pesticide/herbicide organic compounds
BromobenzeneDisulfoton
AcetochlorDDE
AcroleinFormaldehyde


Current Treatment Processes for Removal of Emerging Contaminants
10
• Adsorption is effective to organic compounds which are large (MW> 300‐150) and /or have low solubility (<1 mM).
• Stripping is effective for organic compounds which have low solubility and intermediate vapor pressure (H=0.01). We have to control the contaminants of off gas, gas phase adsorption and incineration.
• AOPs is effective for organic compounds which have second order rate constants 108 , kR.
HOR R Rr k C C

Follow the
Energy
11
Advanced Oxidation Processes (AOPs) that producehydroxyl radicals (HO• radicals) at ambienttemperature and atmospheric pressure arepromising water treatment technology.
HO• radicals are highly reactive electrophiles, thatreact rapidly and non‐selectively with the electron‐rich sites of compounds.
HO• radicals are capable of mineralizing organiccompounds into carbon dioxide CO2 and water.
Introduction ‐What are AOPs? 1/2
12

According to Bolton and Carter (Bolton and Cater,1994), the following general pattern of oxidation isobserved for AOPs.
The most significant observed by‐products are thecarboxylic acids, due to the fact that the second orderrate constants for these compounds are much lowerthan those for most organics. However, if adequatereaction time is provided, all by‐products (>99% asmeasured by a TOC mass balance) are destroyed.
What are AOPs? 2/2
Organic Carboxylic Carbon dioxideAldehydespollutant acids and mineral acids
13

15
Factors Affecting AOP Performance 1/5• Destruction rate of targeted compound R by HO•
• Rate raw for HO• that reacts with an organic compound
R R HO R
HO + R byproductsr k C C
HOR R Rr k C C Typical kR: 107-109 M-1s-1,
CR: μM or nM, CHO•: 10-11 ~ 10-9 M
• Half‐life of an organic compoundfor CMBR
RR HO
ln(2)tk C
Compoundk HO•
M-1
s-1 [HO•]=10-9 M [HO•]=10-10 M [HO•]=10-11 M
MtBE 1.6×10⁹ 0.01 0.1 1Oxalic acid 1.4×10⁶ 8 83 825Acetate ion 7×10⁷ 0.2 2 17
Trichloromethane 5.0×10⁶ 2 23 2311,1,2-Trichloroethane 1.1×10⁸ 0.11 1 11
Chloroform 5×10⁶ 2 23 231Chloroacetic cid 4.3×10⁷ 0.3 2.7 27
Glycolic acid 6×10⁸ 0.02 0.2 21,1,1-Trichloroethane 4×10⁷ 0.3 3 29
Benzene 7.8×10⁹ 0.001 0.01 0.1Phenol 6.6×10⁹ 0.002 0.02 0.2
Halflife, min

Various AOP Technologies
20

21
H2O2/UV
Advantages Disadvantages
• Long stability and can be preserved prior to use of H2O2.• H2O2+UV → 2HO•
• Poor UV absorption of H2O2• Interface of UV with the water matrix• Special reactors required for UV illumination• H2O2 Residuals
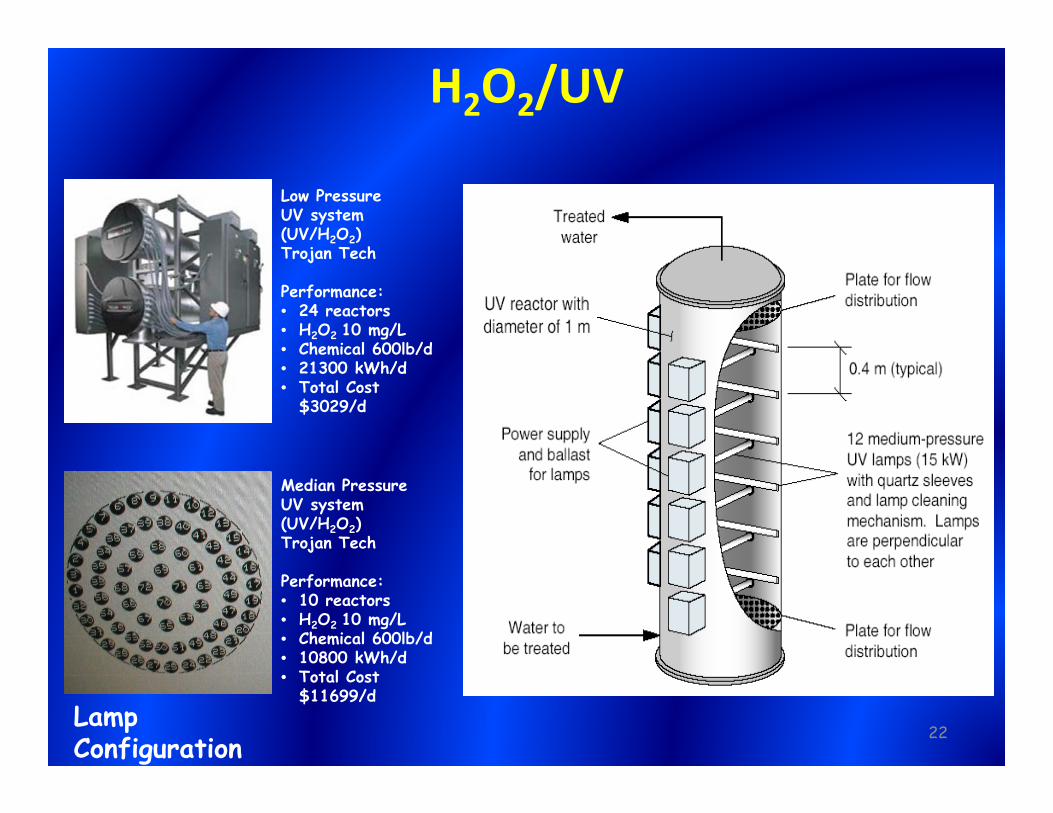
Low PressureUV system (UV/H2O2)Trojan Tech
Performance:• 24 reactors• H2O2 10 mg/L• Chemical 600lb/d• 21300 kWh/d• Total Cost
$3029/d
H2O2/UV
Lamp Configuration
22
Median PressureUV system (UV/H2O2)Trojan Tech
Performance:• 10 reactors• H2O2 10 mg/L• Chemical 600lb/d• 10800 kWh/d• Total Cost
$11699/d
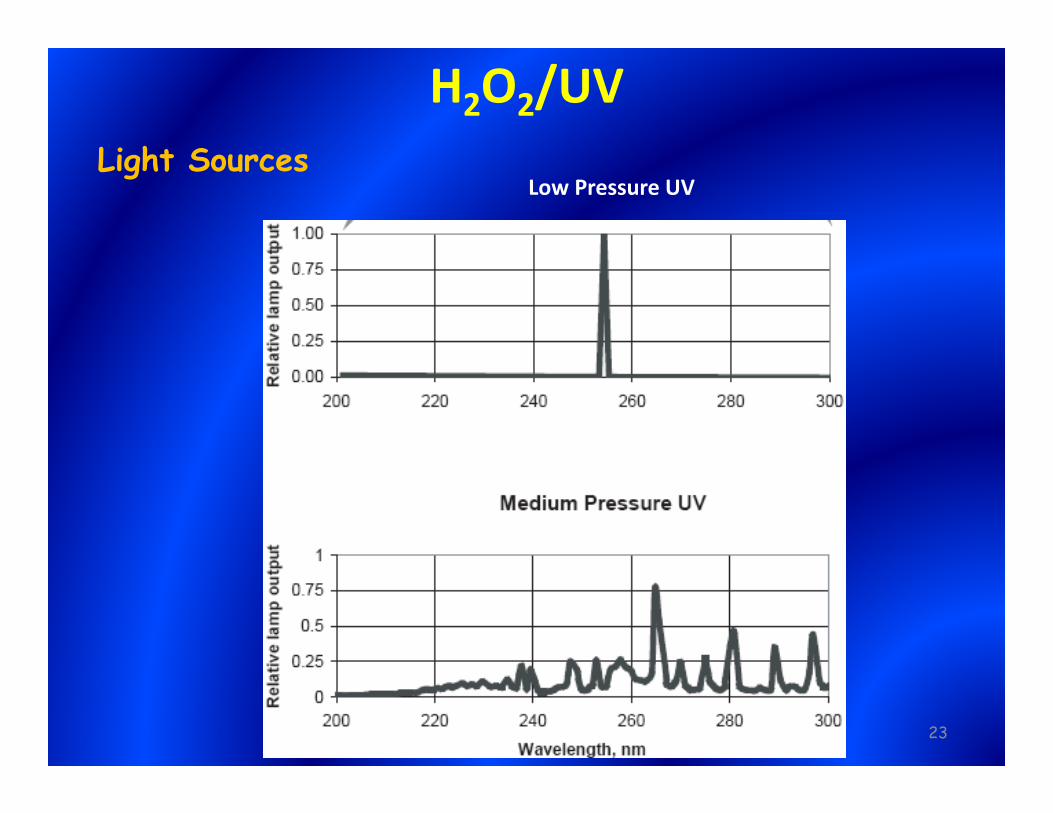
H2O2/UV
23
Low Pressure UVLight Sources

Predicted Concentration Profiles of Acetone and Stable‐byproducts in UV/H2O2 AOP
Type of mechanism Number of species
Number of reactions
Full mechanism 285 3639
Reduced mechanism 59 103
The criterion for DRG method is 0.1%.
Reaction rate constants are obtained from group contribution method (Minakata et al., 2009 ES&T 43, 6220-6227) and literature including:Nate et al., 1990 J. Phys. Chem. Ref. Data. 19, 413-513.Nate et al., 1995 J. Phys. Chem. Ref. Data. 25, 709-1050.Buxton et al., 1988 J. Phys. Chem. Ref. Data. 17, 513-886.von Sonntag et al., 1991 Angeuz. Chem. Int. Ed. Engl. 30, 1229-1253.Li et al., 2009 ES&T 43, 2831-2837.Stefan et al., 1996 ES&T 30, 2382-2390
Initial concentration of acetone 1.02 mM
Initial concentration of O2 2.2 mM
Initial concentration of H2O2 15.6 mM
Initial pH 5.9
Wave length of UV 200~300 nm
Light intensity 7.79×10⁻⁶
Einstein/L∙s
Reactor typeCompletelymixed batch reactor
Reaction time 80 min
Comparison of concentration profiles of major species for experimental data (Stefan, Hoy, Bolton, 1999 ES&T 33, 870-873) and simulations results
The reaction between pyruvic acid and hydrogen peroxide was added manually because it is not included in this version of the pathway generator. (CH3COCOOH + H2O2 = CH3COOH + CO2 + H2O)
0.0
2.0
4.0
6.0
8.0
10.0
12.0
14.0
16.0
0.0
0.2
0.4
0.6
0.8
1.0
1.2
0 10 20 30 40 50 60 70 80
[H2O
2] (m
M)
[Maj
or sp
ecie
s] (
mM
)
Time (min)
acetone_exppyruvic aldehyde_expacetic acid_exppyruvic acid_expoxalic acid_expformic acid×2_expacetone_calpyruvic aldehyde_calacetic acid_calpyruvid acid_caloxalic acid_calformic acid×2_calH2O2_expH2O2_cal

Type of mechanism Number of species
Number of reactions
Full mechanism 120 370
Reduced mechanism 41 89
The criterion for DRG method is 1%.
Reaction rate constants are obtained from group contribution method (Minakata et al., 2009 ES&T 43, 6220-6227) and literature including:Nate et al., 1990 J. Phys. Chem. Ref. Data. 19, 413-513.Nate et al., 1995 J. Phys. Chem. Ref. Data. 25, 709-1050.Buxton et al., 1988 J. Phys. Chem. Ref. Data. 17, 513-886.von Sonntag et al., 1991 Angeuz. Chem. Int. Ed. Engl. 30, 1229-1253.Li et al., 2009 ES&T 43, 2831-2837.Li et al., 2007 ES&T 41, 1696-1703.
Initial concentration of TCE 1.08 mM
Initial concentration of O2 2.2 mM
Initial concentration of H2O2 10.4 mM
Initial pH 5.9
Wave length of UV 200~300 nm
Light intensity 7.79×10⁻⁶
Einstein/L∙s
Reactor typeCompletelymixed batch reactor
Reaction time 30 min
Comparison of concentration profiles of major species for experimental data (Li, Stefan, Crittenden, 2007 ES&T 41, 1696-1703) and simulation results
0.0
2.0
4.0
6.0
8.0
10.0
12.0
0.0
0.2
0.4
0.6
0.8
1.0
1.2
0 5 10 15 20 25 30
[H2O
2] (m
M)
[Maj
or sp
ecie
s] (m
M)
Time(min)
TCE expformic acid expoxalic acid exp20 × DCA exp20 × MCA expTCE calformic acid caloxalic acid cal20 × DCA cal20 × MCA calH2O2 expH2O2 cal
The photolysis of TCE was added manually because it is not included in this version of the pathway generator.
Predicted Concentration Profiles of Trichloroethene (TCE) and Stable‐byproducts in UV/H2O2 AOP

26
H2O2/O3
Advantages Disadvantages
• Suitability for waters with poor UV light transmission• Special reactors requirement for UV illumination2• 2O3+H2O2 →2HO•+3O2
• Stripped volatile organics• Expensive and inefficient to produce O3• Residues of gaseous O3• Difficulty of maintenance (O3/H2O2 dosages)• Low pH is detrimental• When only ozonation is used, bromate formation is of concern if source water contains bromide ion.
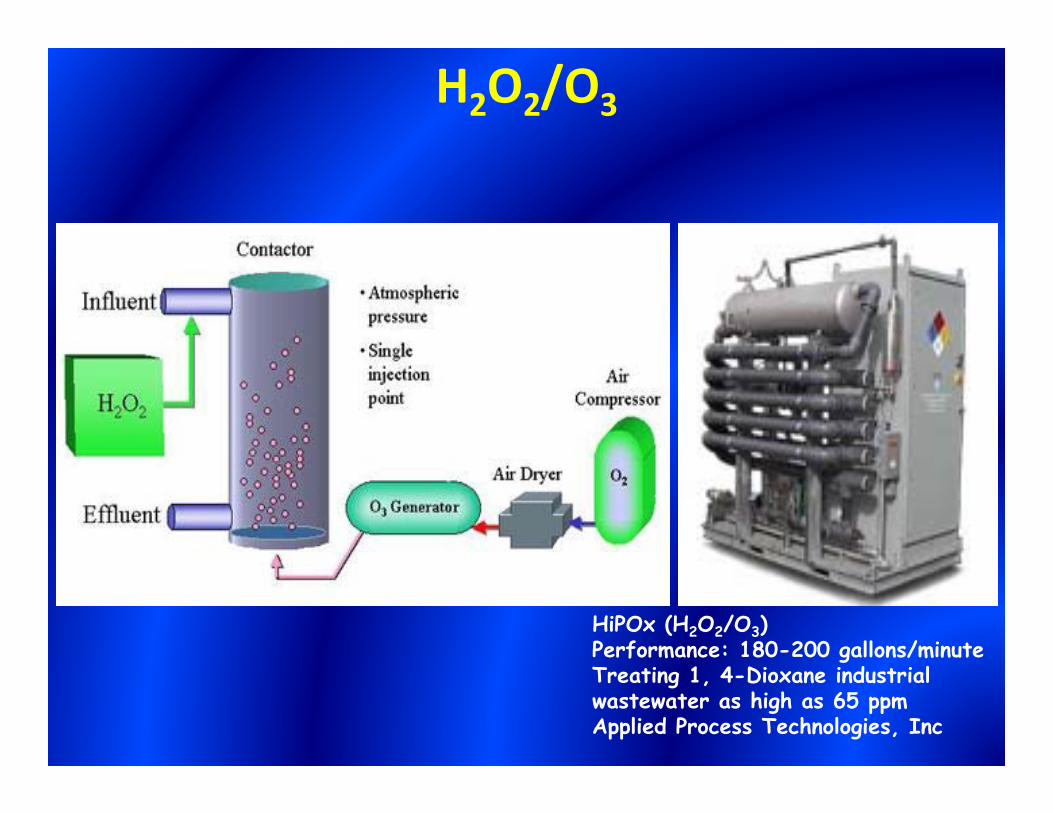
H2O2/O3
HiPOx (H2O2/O3)Performance: 180-200 gallons/minuteTreating 1, 4-Dioxane industrial wastewater as high as 65 ppmApplied Process Technologies, Inc
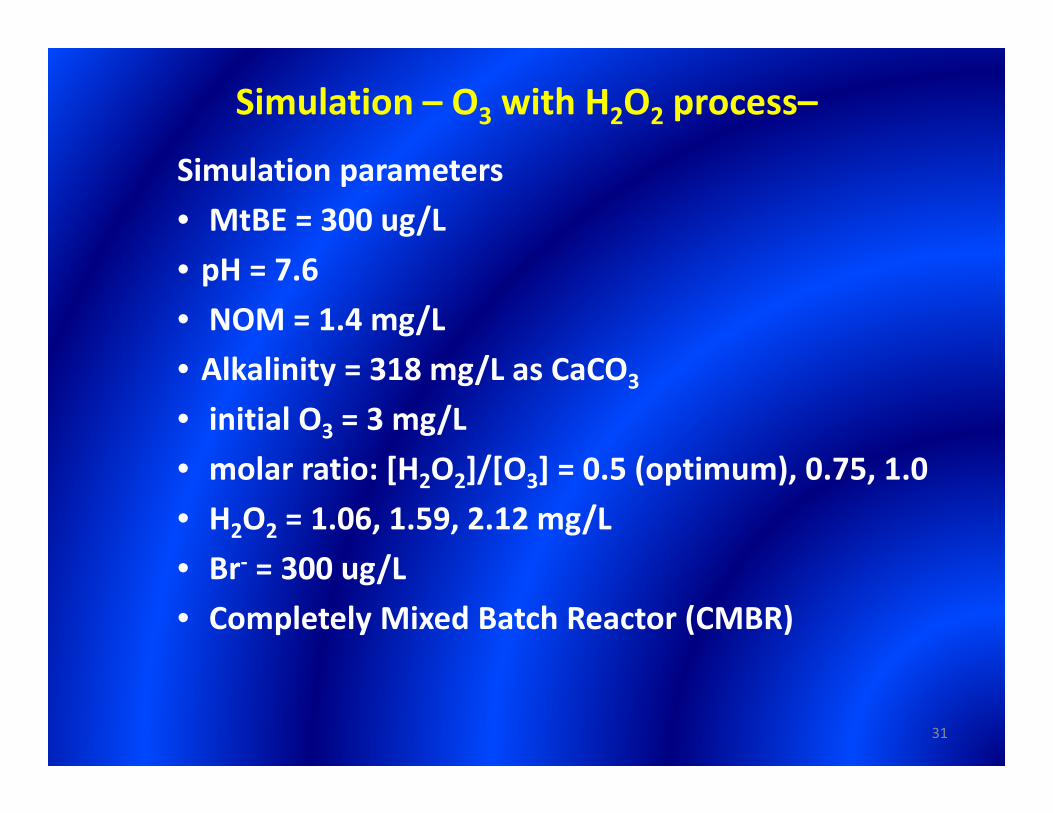
Simulation – O3 with H2O2 process–
Simulation parameters • MtBE = 300 ug/L• pH = 7.6 • NOM = 1.4 mg/L • Alkalinity = 318 mg/L as CaCO3
• initial O3 = 3 mg/L • molar ratio: [H2O2]/[O3] = 0.5 (optimum), 0.75, 1.0• H2O2 = 1.06, 1.59, 2.12 mg/L • Br‐ = 300 ug/L • Completely Mixed Batch Reactor (CMBR)
31

Simulation results – O3 with H2O2 process–
0.0
0.5
1.0
1.5
2.0
2.5
3.0
[O3]
(mg/
L)
[H2O2]/[O3]=0.5[H2O2]/[O3]=0.75[H2O2]/[O3]=1.0
0.0
0.5
1.0
1.5
2.0
0 20 40 60 80 100 120
[H2O
2] (m
g/L
)
Time (sec)
0
5
10
15
20
25
30
0
50
100
150
200
250
300
[tBA
] (ug/L)
[MtB
E] (
ug/L
)
MtBE tBA
0
1
2
3
4
5
6
7
0 20 40 60 80 100 120
[BrO
3-] (
ug/L
)
Time (sec) 32
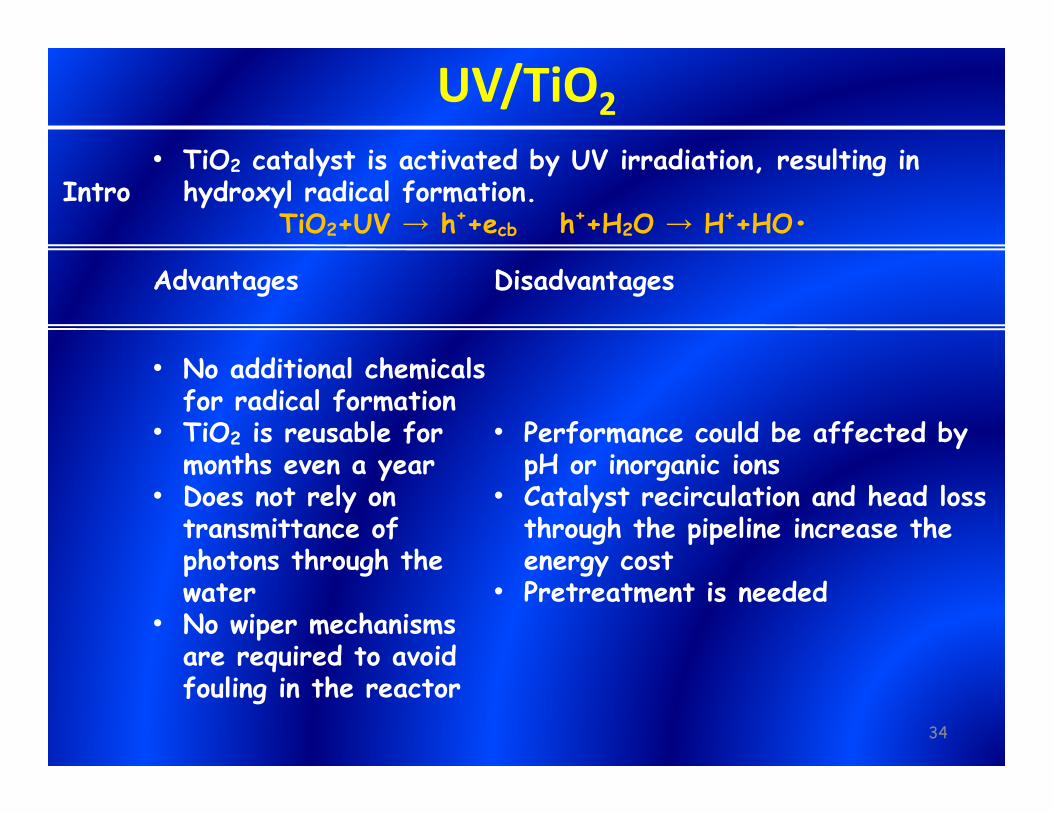
UV/TiO2
Intro• TiO2 catalyst is activated by UV irradiation, resulting in
hydroxyl radical formation. TiO2+UV → h++ecb h++H2O → H++HO•
Advantages Disadvantages
• No additional chemicals for radical formation
• TiO2 is reusable for months even a year
• Does not rely on transmittance of photons through the water
• No wiper mechanisms are required to avoid fouling in the reactor
• Performance could be affected by pH or inorganic ions
• Catalyst recirculation and head loss through the pipeline increase the energy cost
• Pretreatment is needed
34
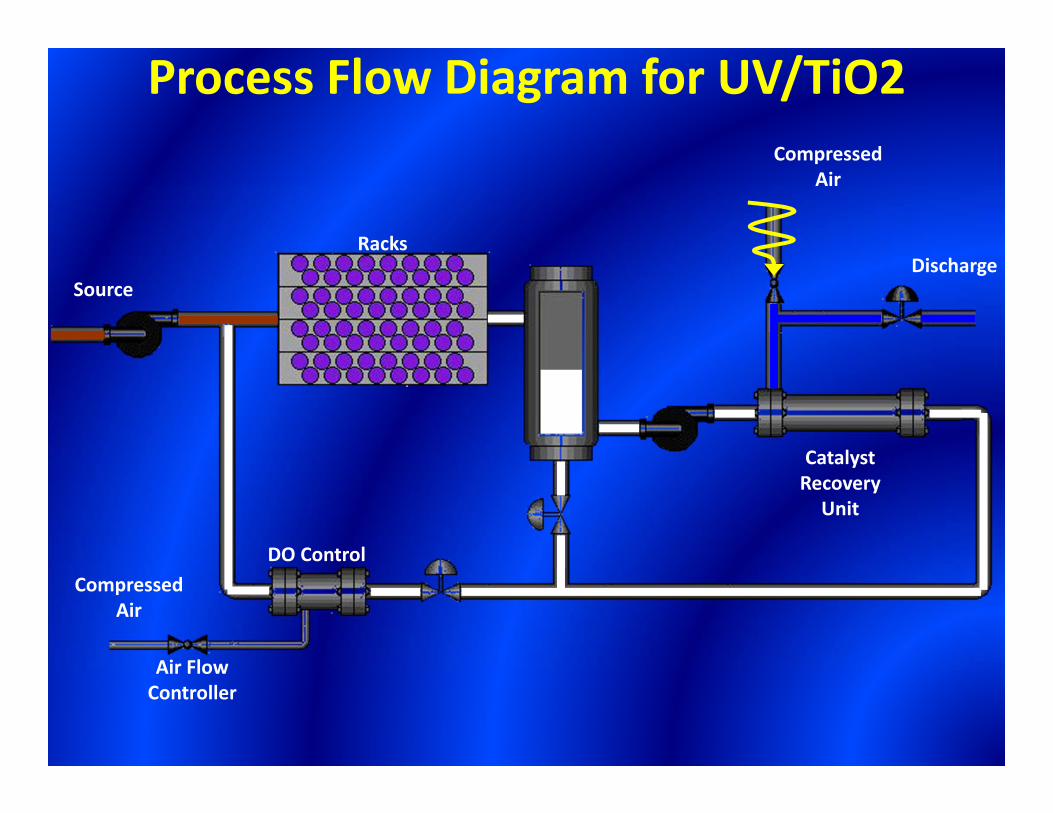
Process Flow Diagram for UV/TiO2
Racks
Source
Compressed Air
DO Control
Air Flow Controller
Compressed Air
Discharge
Catalyst Recovery Unit

37
UV/TiO2, Photo‐Cat OFS
Sand
Oil
Bitumen
CF-CMS OILS AOP+
Oil Sands Wastewater
Reuse Water
Naptha Toxicity
NVTOC

38
UV/TiO2, Photo‐Cat OFS
Before After

List of Other AOPsElectroOxidation Modified TiO2 coating PbO2 electrode generate HO• from water.
Ultrasonic/Ozone Oxiadation
Increases the mass transfer efficiency of ozone to destroy bacteria and revitalize contaminated water for reuse.Submerged electrodes create a secondary oxidation process with production of hydroxyl radicals.
Ferrate FeO42- oxidizes contaminants and is reduced to Fe3+, which acts as
coagulant and finally flocculent.
Persulfate Oxidation
S2O82- oxidizes contaminants and is reduced to SO4
-•, which attack some non-degradable chemicals by HO•, like PFOA.
Zero Valent IronIn the presence of O2, Low pH, and Fe0, hydroxyl radical can be created in water. This formation is similar with Fenton reaction.
FBR Fenton (Fenton IV)
Using a fluidized bed reactor (FBR) to introduce a secondary catalyst, iron oxyhydroxide (FeOOH), to the process.
ElectroCoagulation Fe2+ and Fe3+ are released from iron blades where direct current is applied. Particles neutralization and precipitation occur.
2H O HO H e
39
22 8 4S O 2SO 2 3
2 8 4F e (0 ) S O S O F e
0 2 32 2 22H O Fe H O Fe HO HO Fe
2 32 2 3H O Fe HO HO Fe Fe(OH)
Modeling AOPs:
Simplified Pseudo-Steady-State Model
41

3. H2O2 is added to a water containing O3, i.e. [O3]0 is known.
42
2. H2O2 and O3 are added simultaneously
3 3O Oss, 0
9 2 10 2 2 11 3 12 130 0 00 0
HOHO H O HCO R NOM
LK a P H
k k k k k
UV/H2O2 H2O2/O3 Simplified pseudo‐steady‐state model
R 12 ss, 0HOk k
H O2 2pH p1 2 2 30 res
ss, 011 3 12 130 00
2 H O 10 OHO
HCO R NOM
Kk
k k k
2 2 2 2
-AH O 0 H O
ss,010 2 2 0 11 3 0 12 0 13 0
2 I f (1- e )[HO ]
k [H O ] k [HCO ] k [R] k [NOM]
1. UV/H2O2

43
Flow Models: Ideal flow at steady state (1st order reaction)
1. Plug Flow Reactor (PFR)
k0C C e
2. Completely Mixed Flow Reactor (CMFR)
0CC (1 k)
3. Tank-in-series (TIS)
0n
CC1 k
n
1/ n
0C nQV 1C k
0Q C C
Vr
0CQV ln
k C

44
Flow Models: Non‐ideal flow
4. Dispersed flow model closed system
A
2 2Ao
1 vL4a exp2 EC
a vL a vLC (1 a exp (1 a exp) )2 E 2 E
a 1 4k (E / vL)

45
Essence is same as the GCM for the gaseous phase developed by Dr. Roger Atkinson (EPA software AOPWIN)
Hypothesis Observed experimental reaction rate constant for a given organic
compound is the combined rate of all elementary reactions involving HO•, which can be estimated using Arrhenius kinetic expression.
The Ea consists of two parts based on Benson’s thermochemicaladditivity concept (Benson, 1976): (1) Base part from main reaction mechanisms (i.e., H-atom
abstraction, HO• addition to alkenes and aromatic compounds and HO• interaction with S, N, or P-atom-containing compounds).
(2) Functional group contribution partially from neighboring and/or next nearest neighboring functional group.
= aE
RTk Ae
Group Contribution Method (GCM) for predicting kHO•
Acknowledgement• National Science Foundation (NSF): 0607332
and 0854416• Water Reuse Foundation: WRF-05-010• Georgia Tech College of Computing, Office of
Information Technology and CEE IT Services for high computational resources.
• High Tower Chair and Georgia Research Alliance at Georgia Tech
• Brook Byers Institute for Sustainable Systems• University of Notre Dame Radiation Center and
Department of Energy
47
48
References • Li, K.; Crittenden, J.C. Computerized pathway elucidation for hydroxyl radical induced chain reaction
mechanisms in aqueous phase AOPs. ES&T. 2009, 43(8), 2831-2837.• Minakata, D.; Li, K.; Westerhoff, P.; Crittenden, J. Development of a group contribution method to predict
aqueous phase hydroxyl radical reaction rate constants. ES&T. 2009, 43, 6220-6227.• Minakata, D.; Crittenden, J. Linear Free Energy Relationships between the Aqueous Phase Hydroxyl Radical
(HO•) Reaction Rate Constants and the Free Energy of Activation. Environ. Sci. & Technol. 2011a, 45, 3479-3486.• Minakata, D.; Song, W.; Crittenden, J. "Reactivity of aqueous phase hydroxyl radical with halogenated
carboxylate anions: Experimental and theoretical studies". Environ. Sci. & Technol. 2011, 45, 6057-6065.• Minakata, D.; Mezyk, S.; Crittenden, J.C. Mechanistic Elucidation of Aqueous Phase Addition of Oxygen
Molecule to Carbon Centered Radical and Rate Constant Prediction. PNAS. 2012, in preparation.• Minakata D.; Crittenden, J.C. Theoretical study in the aqueous-phase subsequent free-radical reactions induced
by hydroxyl radicals. ACS National Meeting in Denver, CO. August 29, 2011b.• Herrmann, H.; Hoffmann, D.; Schaefer, T.; Bräuer, P.; Tilgner, A. Tropospheric aqueous-phase free-radical
chemistry: Radical sources, spectra, reaction kinetics and prediction tools. ChemPhysChem., 2010, 11, 3796-3822.• Atkinson, R. Kinetics and mechanisms of the gas-phase reactions of the hydroxyl radical with organic compounds
under atmospheric condition. Chem. Rev. 1986, 86, 69-201• A division of the American Chemical Society. CAS (Chemical Abstract Service).
http://www.cas.org/expertise/cascontent/index.html (accessed June 12, 2009).• Benson, S.W. “Thermochemical Kinetics”, 2nd ed. Wiley, Interscience, New York, 1976.• Marenich, A. V.; Kelly, C. P.; Thompson, J. D.; Hawkins, G. D.; Chambers, C. C.; Giesen, D. J.; Winget, P.;
Cramer, C. J.; Truhlar, D. G. Minnesota Solvation Database – version 2009, University of Minnesota, Minneapolis,2009.
• Klamt, A. Estimation of gas-phase hydroxyl radical rate constants of oxygenated compounds based on molecularorbital calculations. Chemosphere. 1996, 32(4), 717-726.
• Klamt, A.; Jonas, V.; Bürger, T.; Lohrenz, J.C.W. Refinement and parametrization of COSMO-RS. J.Phys.Chem.A. 1998, 102, 5074-5085
• Cossi, M.; Rega, N.; Scalmani, G.; Barone, V. Energies, structures, and electronic properties of molecules insolution with the C-PCM solvation model. J. Comp. Chem. 2003, 24(6), 669-681
• Barone, V.; Cossi, M. Quantum calculation of molecular energies and energy gradients in solution by a conductorsolvent model. J.Phys. Chem. A, 1998, 102, 1995-2001.

49
• Bahnemann, D. (2004). Photocatalytic water treatment: solar evergy applications. Solar Energy 77, 445-459.• Drzewicz, P.; Perez-Estrada, L.; Alpatova, A.; Martin, J. W.; Gamal El-Din, M., Impact of Peroxydisulfate in the
Presence of Zero Valent Iron on the Oxidation of Cyclohexanoic Acid and Naphthenic Acids from Oil SandsProcess-Affected Water. Environmental science & technology 2012, 46 (16), 8984-8991.
• Anipsitakis, G. P.; Dionysiou, D. D., Degradation of Organic Contaminants in Water with Sulfate RadicalsGenerated by the Conjunction of Peroxymonosulfate with Cobalt. Environmental science & technology 2003, 37(20), 4790-4797.
• Kjeldsen, P.; Barlaz, M. A.; Rooker, A. P.; Baun, A.; Ledin, A.; Christensen, T. H., Present and long-termcomposition of MSW landfill leachate: A review. Crit. Rev. Environ. Sci. Technol. 2002, 32 (4), 297-336.
• Deng, Y.; Ezyske, C. M., Sulfate radical-advanced oxidation process (SR-AOP) for simultaneous removal ofrefractory organic contaminants and ammonia in landfill leachate. Water Res. 2011, 45 (18), 6189-6194.
• Xia P F, Wei X Y, Liu X Y, Liu R P, Zhao X, Liu H J, Qu J H. 2011 Treatment of landfill leachate by an enhancedcoagulation and photoelectro-oxidation process [J]. Acta Scientiae Circumstantiae, 31 (1): 13-19.
• Xiao, S. H.; Qu, J. H.; Zhao, X.; Liu, H. J.; Wan, D. J., Electrochemical process combined with UV lightirradiation for synergistic degradation of ammonia in chloride-containing solutions. Water Res. 2009, 43 (5), 1432-1440.
• Gu, L.; Zhang, X. W.; Lei, L. C., Degradation of aqueous p-nitrophenol by ozonation integrated with activatedcarbon. Ind. Eng. Chem. Res. 2008, 47 (18), 6809-6815.
• Takahashi, M.; Chiba, K.; Li, P., Free-Radical Generation from Collapsing Microbubbles in the Absence of aDynamic Stimulus. The Journal of Physical Chemistry B 2007, 111 (6), 1343-1347.
References