exhaustion among university students: a cross...
TRANSCRIPT
Department of Psychology
Master of Science Program in Psychology
Exhaustion among university students: A cross-sectional
study of self-esteem, social support, gender, physical
activity and being in nature as predictors
Rebecka Hektor Master Thesis Science Program in Psychology, 2017
Supervisor: Lars-Gunnar Lundh
Examiner: Erwin Apitzsch

Abstract
The purpose of the study was to examine how common exhaustion was among
students of Lund’s University. An additional aim was to investigate to what extent
the factors self-esteem, gender, social support, physical activity and being in
nature could predict exhaustion in the sample. A cross-sectional web-survey
consisting of Karolinska Exhaustion Disorder Scale (KEDS), Rosenberg’s Self-
esteem Scale (RSES), The Multidimensional Scale of Perceived Social Support
(MSPSS), Saltin Grimby Physical Activity Scale (SGPALS), 4 questions
concerning being in nature, as well as demographic questions were used. The
sample consisted of 253 participants (76.3% women and 23.3% men), most were
students of the Social Sciences Faculty and the Faculty of Medicine. The results
showed that self-esteem, social support from friends, gender and physical activity
were significant predictors of exhaustion. Self-esteem was clearly the strongest
predictor. 33% of the participants had exhaustion scores above cutoff, indicating
high levels of exhaustion. There were significant differences in level of
exhaustion between women and men, with higher levels of exhaustion among
women. The results to a great extent corroborated previous research; however
longitudinal designs are requested to investigate the direction of the associations.
Keywords: exhaustion, self-esteem, gender, social support, physical activity,
being in nature, burnout, students

Sammanfattning
Syftet med studien var att undersöka hur vanligt utmattning var bland studenter
vid Lunds universitet. Ytterligare ett mål var att undersöka i vilken grad
faktorerna självkänsla, socialt stöd, fysisk aktivitet, kön och att vara i naturen
kunde predicera utmattning i urvalet. En tvärsitts- webenkät bestående av
Karolinska Exhaustion Disorder Scale (KEDS), Rosenberg’s Self-esteem Scale
(RSES), The Multidimensional Scale of Perceived Social Support (MSPSS),
Saltin Grimby Physcial Activity Scale (SGPALS), 4 frågor angående att vara i
naturen samt demografiska frågor användes. Urvalet bestod av 253 deltagare
(76,3% kvinnor och 23,3% män), de flesta var studenter på samhällsvetenskapliga
och medicinska fakulteterna. Resultaten visade att självkänsla, socialt stöd från
vänner, kön samt fysisk aktivitet var signifikanta prediktorer för utmattning.
Självkänsla var utan tvekan den starkaste prediktorn. 33% av deltagarna hade
utmattningspoäng över gränsvärdet, vilket innebär höga nivåer av utmattning. Det
fanns signifikanta skillnader i utmattningsnivå mellan kvinnor och män, med
högre utmattningsnivåer bland kvinnor. Resultaten bekräftade till stor del tidigare
forskning, men longitudinell forskning efterfrågas för att undersöka riktningen i
sambanden.
Nyckelord: utmattning, självkänsla, socialt stöd, kön, fysisk aktivitet, att vara i
naturen, utbrändhet, studenter
Table of contents
Introduction .............................................................................................................................. 1
Definitions of burnout and exhaustion ................................................................................... 1
Theories of stress and exhaustion ........................................................................................... 3
Biological stress theory ....................................................................................................... 3
Phases of exhaustion ........................................................................................................... 4
The demand-control-support theory of job stress ............................................................... 4
The effort-reward imbalance model ................................................................................... 5
The conservation of resources theory ................................................................................. 6
Academic burnout ................................................................................................................... 6
Levels of burnout .................................................................................................................... 8
Risk factors for burnout and exhaustion ................................................................................. 9
Social support ..................................................................................................................... 9
Self-esteem ........................................................................................................................ 11
Physical activity ................................................................................................................ 12
Gender ............................................................................................................................... 14
Being in nature .................................................................................................................. 16
Summary ............................................................................................................................... 17
Purpose ................................................................................................................................. 18
Research questions ................................................................................................................ 18
Method ..................................................................................................................................... 18
Design and procedure ........................................................................................................... 19
Participants ........................................................................................................................... 19
Sampling ............................................................................................................................... 20
Instruments ........................................................................................................................... 20
KEDS ................................................................................................................................ 20
RSES ................................................................................................................................. 21
SGPALS ............................................................................................................................ 22
MSPSS .............................................................................................................................. 22
Being in nature .................................................................................................................. 23
Statistical analyses ................................................................................................................ 24
Ethical considerations ........................................................................................................... 24
Results ..................................................................................................................................... 25
Reliability ............................................................................................................................. 27
Correlations ........................................................................................................................... 28
Physical activity and exhaustion ........................................................................................... 29
Multiple regression analysis ................................................................................................. 30
Discussion ................................................................................................................................ 32
Self-esteem ........................................................................................................................... 34
Gender ................................................................................................................................... 35
Social support ....................................................................................................................... 36
Physical activity .................................................................................................................... 38
Being in nature ...................................................................................................................... 38
Strengths and limitations ..................................................................................................... 39
Design and procedure ....................................................................................................... 39
Participants ........................................................................................................................ 41
Instruments ........................................................................................................................ 41
Practical implications and suggestions for further research ................................................ 43
Conclusion ........................................................................................................................... 44
References ............................................................................................................................... 45
Appendix ................................................................................................................................. 55

1
Introduction
Stress-related health issues are a major problem for most societies today (World
Health Organization [WHO], 2001). Between 1999 and 2014 long-term sick leave because of
psychiatric illnesses, has increased from 18% to 35% of the long-term sick leaves in Sweden.
The most common psychiatric illnesses that result in sickness absence in Sweden are different
stress reactions, depression and anxiety (Försäkringskassan, 2015).
Exhaustion is a stress-related disorder, and can be seen as the result of being exposed
to chronic stressors for a long period of time, without the possibility of recovery. It results in
problems such as emotional exhaustion and irritability, physical symptoms such as
stomachache and headache, and cognitive difficulties such as problems with memory and
concentration (Åsberg et al., 2010).
Research on burnout has historically focused on people-oriented occupations such as
health care workers (Maslach & Jackson, 1981). However, research suggests that university
students are at risk of developing burnout as well (Cecil, McHale, Hart, & Laidlaw, 2014;
Dahlin & Runeson, 2007; Fares et al., 2016; Rudman & Gustavsson, 2012). University
students experience a variety of different stressors; finding new friends, coping with new
responsibilities and adapting to new situations and a high workload (Seyedfatemi, Tafreshi, &
Hagani, 2007) and they are constantly exposed to a conflict between academic and social
demands (Pluut, Curseu, & Ilies, 2015).
It is of importance to understand the underlying factors contributing to stress and
exhaustion among university students, in order to prevent exhaustion in the long run. Thus,
the aim of this study is to investigate whether the factors social support, self-esteem, gender,
physical activity and being in nature can predict exhaustion among university students.
Definitions of burnout and exhaustion
There are a few concepts that are commonly used interchangeably but that are defined
in different ways. The term burnout emerged in the professions of human service institutions
and it refers to the effect of being exposed to chronic stressors at work. People working with
helping others are at a risk of getting emotionally exhausted, or burned out. Burnout is
characterized by a lack of energy, feelings of cynicism and a decrease in passion for one’s
job. Exhaustion can be defined as a lack of individual resources, both physical and emotional.
Cynicism is an interpersonal component, and refers to a detached attitude to the job.
Inefficacy is defined as a lack of productivity and a decreased passion for the work. Burnout
2
leads to feelings of negativity towards oneself and clients at work, and burned out workers
tend to be unhappy (Maslach & Jackson, 1981).
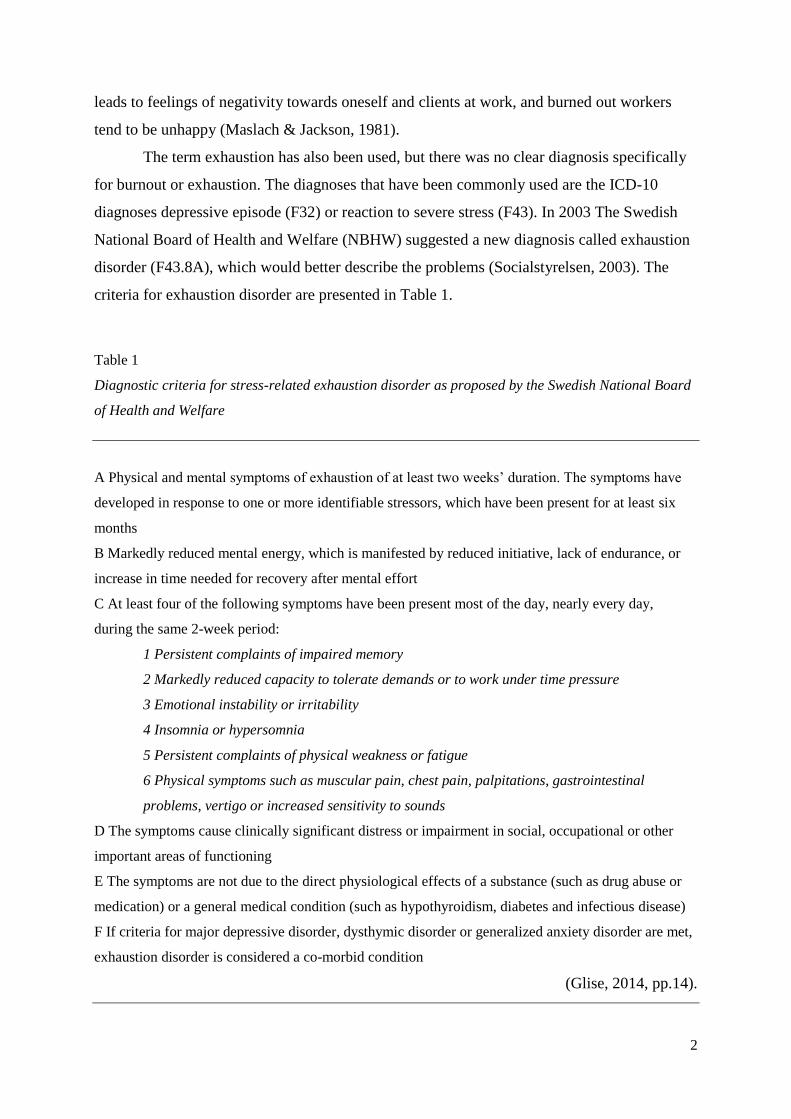
The term exhaustion has also been used, but there was no clear diagnosis specifically
for burnout or exhaustion. The diagnoses that have been commonly used are the ICD-10
diagnoses depressive episode (F32) or reaction to severe stress (F43). In 2003 The Swedish
National Board of Health and Welfare (NBHW) suggested a new diagnosis called exhaustion
disorder (F43.8A), which would better describe the problems (Socialstyrelsen, 2003). The
criteria for exhaustion disorder are presented in Table 1.
Table 1
Diagnostic criteria for stress-related exhaustion disorder as proposed by the Swedish National Board
of Health and Welfare
A Physical and mental symptoms of exhaustion of at least two weeks’ duration. The symptoms have
developed in response to one or more identifiable stressors, which have been present for at least six
months
B Markedly reduced mental energy, which is manifested by reduced initiative, lack of endurance, or
increase in time needed for recovery after mental effort
C At least four of the following symptoms have been present most of the day, nearly every day,
during the same 2-week period:
1 Persistent complaints of impaired memory
2 Markedly reduced capacity to tolerate demands or to work under time pressure
3 Emotional instability or irritability
4 Insomnia or hypersomnia
5 Persistent complaints of physical weakness or fatigue
6 Physical symptoms such as muscular pain, chest pain, palpitations, gastrointestinal
problems, vertigo or increased sensitivity to sounds
D The symptoms cause clinically significant distress or impairment in social, occupational or other
important areas of functioning
E The symptoms are not due to the direct physiological effects of a substance (such as drug abuse or
medication) or a general medical condition (such as hypothyroidism, diabetes and infectious disease)
F If criteria for major depressive disorder, dysthymic disorder or generalized anxiety disorder are met,
exhaustion disorder is considered a co-morbid condition
(Glise, 2014, pp.14).

3
Theories of stress and exhaustion
The link between work environment and exhaustion is presumably stress. There is
some confusion concerning the word stress. In physics stress is the pressure that results in a
reaction; “strain”. However, when it comes to mental stress, the word stress is often used in
reference to the reaction, which has resulted in the use of the word stressor when referring to
the threatening situation or event. In literature the word stress is still used both in reference to
the stressor and the stress reaction (Jonsdottir & Folkow, 2013).
Biological stress theory. Evolution has prepared human beings for stressors through
adapting the physiological reactions to stressful stimuli. The body prepares for an acute stress
situation through activating the limbic system and the sympathetic branch of the autonomous
nervous system which results in changes in different bodily processes (Jonsdottir & Folkow,
2013). A stressful event activates the hypothalamic-pituitary-adrenal (HPA) axis which results
in increased cortisol-levels. Cortisol mobilizes energy to help the individual cope with
stressful situations. The hormonal system also regulates hormones such as adrenaline, which
activates and prepares the body for a fight or flight reaction (Kalat, 2013). Selye (1951)
argued that a response to stressful stimuli always follows the same pattern, which he called
the General Adaptation Syndrome. Selye describes the way of responding to stressors in three
stages; alarm-reaction, resistance and exhaustion. However, according to Jonsdottir and
Folkow (2013) stress reactions vary among individuals, because of the unique set of
experiences and biological conditions that each human being carries. The advanced neocortex
of humans evaluates and interprets the same situation in different ways, resulting in various
reactions. Human beings can suppress and regulate emotions which help us cope with the
different situations that we encounter (Jonsdottir & Folkow, 2013).
The bodily activation when encountering a stressful event is important and protects
the individual against dangers through preparing to react. However, when the body’s stress
system is activated too frequently and for too long periods it results in stress related health
problems such as exhaustion disorder (Åsberg et al., 2010).
The biological adaptation to stressors has been referred to as allostasis which is the
maintenance of stability in bodily processes when exposed to changes. An adequate allostatic
response is activated by a stressor, helps the individual handle the situation, and when danger
is gone deactivation of the system occurs, and the individual can rest. When there is an
excessive stimulation of the allostatic system allostatic load occurs. Allostatic load can be the
result of too frequent activation of the system, an inability to shut off the allostatic activation
after stressful events or inadequate responses of the allostatic systems, which affects other
4
bodily systems. Because of the strain caused by the allostatic load the individual is at risk of
developing diseases such as coronary heart disease, viral infections and asthma, but also
psychiatric illnesses such as depression and PTSD (McEwen, 1998).
Phases of exhaustion. Stress reactions are natural consequences of being exposed to
threats and challenges. Long-term exposure to stressors without time for recovery can lead to
physical as well as psychiatric illnesses, such as exhaustion disorder. The course of
exhaustion can be divided into three different phases; the prodromal phase, the acute phase
and the recovery phase. The prodromal phase is a “warning phase” with symptoms such as
back- and neck pain, sleeping problems, stomach problems, concentration difficulties as well
as irritability and panic. The symptoms can come and go, and if the person reduces the
stressors or increases the time for recovery the symptoms can disappear. The acute phase
often starts suddenly and is characterized by extreme physical and mental exhaustion without
the ability to recover after sleep and rest. Cognitive difficulties such as problems with
memory, orientation and finding words are common, as well as sensitivity to sensory
impressions. The recovery phase is a slow recuperation of the symptoms, and the individual
often continues to be sensitive to stress. Comorbidity in the form of depression and anxiety is
common (Åsberg et al., 2010).
The demand-control-support theory of job stress. The job demand – control model
was created by Karasek (1979) and it is one of the most influential theories concerning work
stress and organizational health and wellbeing. The theory was later expanded by adding
social support to the model (Karasek & Theorell, 1990). The model now consists of the three
dimensions psychological demands (job demands), decision latitude (job control) and social
support. Job demands are the psychological stressors of work, such as personal conflicts, time
pressure and high work load. Too many and high demands can cause strain, while too low
demands may lead to a lack of motivation. Decision latitude is the amount of control that a
worker has over his/her tasks and work performance. It includes social authority to make
decisions as well as high levels of skills which contributes to the ability to utilize specific
skills depending on the situation. Social support refers to helpful social interaction from
colleagues and supervisors. It is thought to promote health through acting as a buffer between
stressors and strain, affecting physiological responses of the individual as well as promoting
coping strategies. According to Karasek and Theorell (1990) social support also enhances a
positive self-identity, which contributes to health.
When job demands are high and job control and/or social support are low job strain
occurs. When there are high job demands but also high control and social support workers
5
tend to be the most healthy and satisfied. Apart from the health effects the levels of demands,
control and support affect productivity, skill utilization and motivation (Karasek & Theorell,
1990).
Lee, Puig, and Lee (2012) studied the relationships between demand-control and
burnout among students in South Korea. The results showed that demand was positively
correlated with burnout, while control was negatively correlated with burnout. The association
between demand-control imbalance and burnout was even stronger, suggesting that the
students experiencing both high demands and low control were at greater risk of experiencing
burnout.
The effort-reward imbalance model. According to the effort-reward imbalance
model (ERI) stress reactions arise as a result of the interaction between the individual and the
psychosocial work environment. There ought to be a balance between work-related costs
(effort) and occupational gains (reward). Effort represents work demands, such as finishing a
piece of work on a time limit. Reward consists of material gains such as money, but also job
security, job opportunities, respect and self-esteem. An imbalance of the two factors could
lead to emotional distress (Siegrist, 1996).
According to the model individuals react differently to an effort-reward imbalance.
Some individuals are characterized by overcommitment; an excessive commitment to work
and an extreme striving for approval. Overcommited individuals are at greater risk of putting
themselves in situations with high demands, where they have to put down a lot of effort, and
they also tend to expect more and higher rewards than other people. Overcommitment is seen
as a moderator which increases the health effects produced by an effort-reward imbalance
(Siegrist et al., 2004).
Feuerhahn, Kühnel and Kudielka (2012) as well as Bakker, Killmer, Siegrist and
Schaufeli (2000) found that effort-reward imbalance was significantly positively correlated to
emotional exhaustion. Bakker et al. (2000) also found a significant positive correlation
between ERI and depersonalization. Rasmussen et al. (2016) found that high effort was
positively associated with emotional exhaustion and low reward was negatively associated
with emotional exhaustion. However; the interaction of high effort-low reward could not
predict emotional exhaustion.
Lee et al. (2012) studied the associations between effort-reward and burnout among
students in South Korea. They found significant associations between effort, reward and
burnout, as well as between effort-reward imbalance and burnout. Effort was positively
correlated with burnout; with the strongest correlation with the exhaustion subscale of the
6
burnout measure. Reward was negatively related to burnout, suggesting that a low level of
reward increases the risk of burnout. An effort-reward imbalance, however, had the greatest
association with burnout, suggesting that the combination of high effort and low reward puts
students in greater risk of experiencing burnout.
The conservation of resources theory. The conservation of resources theory is based
on the assumption that people attempt to gain and retain resources and that the loss of
resources threatens the individual. According to the model, stress can be defined as a threat of
loss of resources, actual loss of resources or a lack of resource gain when investing resources.
Examples of resources are self-esteem, socioeconomic status and money. According to the
theory people will try to gain resources when not stressed, and when facing stressful events
the individual will try to minimize the loss of resources (Hobfoll, 1989).
According to Alarcon, Edwards and Menke (2011) coping is central to the
conservation of resources theory. When facing a stressful situation with many resources the
demands of the situation are experienced as less threatening which results in a more adequate
coping. Alarcon et al. (2011) argue that burnout is the result of a continuous loss of resources.
When losing resources coping strategies become malfunctioning, which results in further loss
of resources.
Academic burnout
Much of the research on burnout has focused on work-related burnout, but burnout
can also be a consequence of other stressors than work-related (Maslach, 1981). Pines (1987)
studied burnout in marriage, and work-family conflicts have also been associated with
exhaustion (Canivet, Östergren, & Lindeberg, 2010). These findings suggest that exhaustion
ought to be studied in a wider context than work, and that there are many possible stressors in
different areas of life. As well as stressors in the family situation, some studies show that
students are at risk of burnout (Cecil et al., 2014; Fares et al., 2016; Rudman & Gustavsson,
2012).
Law (2007) compared exhaustion levels of Business University students with levels
found in high-stress occupations such as teachers, health care and human service workers,
social workers and accountants. He found that the mean value of exhaustion in the student
group was higher than in all except one of the high-stress occupation groups; public
accountants during a busy season. Although the study was conducted during the final weeks
of the semester Law argues that the levels of exhaustions found in the study are noteworthy

7
and have important implications for the organization of university educations. Law also
studied whether or not coursework involvement and workload were significant predictors of
exhaustion. Both factors were significant as predictors and explained 17% of the variance in
exhaustion. However, coursework involvement had a higher predictive value. Although
coursework involvement often is seen as a positive characteristic, the downside is the risk of
developing exhaustion. Law also discusses the relatively high freedom that students have,
which can be both productive and destructive, depending on individual differences among the
students.
One hypothesis concerning how and why burnout is developed among students is the
transition into a new professional role. Professional socialization is described as the
assimilation of competence, attitudes and values that are associated with a specific profession.
It starts during education and continues throughout work life (Andersson, 1993). The
socialization into the new role has been described as a “transition shock” and it can cause
stressful reactions (Cherniss, 1980, reference in Rudman & Gustavsson, 2012).
The effects of academic burnout can have long-term effects. There is research
suggesting that burnout during higher education (nursing school) is associated with lower
performance and control over occupational tasks one year after finishing school, especially for
those who showed signs of burnout early in the education. Burnout during nursing school was
also associated with making less use of research in the clinical work as well as an increased
risk of considering leaving the profession. The research also showed that burnout levels
increased during the education, and were the highest during the last year of nursing school
(Rudman & Gustavsson, 2012). This suggests that academic burnout has implications in the
long run, and that understanding burnout among university students is important to be able to
reduce burnout at later stages in life.
In 2014 Sweden’s Association of Student Unions evaluated the sick leave system for
students in Sweden. According to the study students that need to be on sick leave encounter a
variety of problems. It is not possible to be on part-time sick leave, which means that students
with health problems either have to continue studying full-time or be on full time sick leave.
That leads to problems with a stepwise return to studies, which means that it is common with
a longer way back to studies than necessary. Some students even drop out of school because
of the difficulties with coming back. According to the study the support and routines for
students who return to their studies after a period of sick leave are often deficient. The student
support services of the universities request better rehabilitation plans and individual study
plans for students who have been on sick leave. Individual study plans could increase the
8
adjustment to students’ capacities which would increase the possibility of managing their
studies (Sveriges Förenade Studentkårer, [SFS], 2014).
First year university students are entering a new phase of life, and encounter new
challenges and stressors, such as moving to a new city, adapting to a new way of studying and
getting to know new friends (Seyedfatemi et al., 2007). The deficiencies of sick leave systems
may also aggravate the situations of already vulnerable students. This makes university
students an important group to study in relation to exhaustion, to be able to understand, help
and prevent university students from burning out before they have even entered work-life.
Levels of burnout
Exhaustion disorder is a relatively new diagnosis which means there are no
epidemiological studies of the prevalence (Glise, 2014). However, there is a variety of studies
examining levels of burnout, from different countries and populations. In a working
population in Sweden it was found that 13% had a high level of burnout, measured with the
Shirom Melamed Burnout Questionnaire. Women had higher burnout ratings than men, which
partly could be explained by work related and life situational factors (Norlund et al., 2010).
Fares et al. (2016) examined how common burnout was among medical students in
Lebanon. They found that 62% of the students suffered from stress (measured with GHQ-12)
and 75% from burnout (measured with Maslach Burnout Inventory-Student version). First
year students had higher scores, as well as women. The authors do not discuss reasons for the
higher level of burnout than stress found in the study, which is a limitation of the study. Cecil
et al. (2014) examined burnout among medical students in the UK. Around 55% were
emotionally exhausted and a slightly smaller number of students reported high levels of
depersonalization.
In a study of medical students in Brazil 15% of the students rated levels of burnout
above cutoff on the Maslach Burnout Inventory – Human Services Survey (MBI-HSS),
although as many as 58% were at risk of developing burnout (Gilson de Cavalcante, Hercílio
Ribeiro, Paulo César, Beatriz de Cavalcante, & Gilson Holanda, 2016).
Mazurkiewicz, Korenstein, Fallar, and Ripp (2012) reported that 71% of pre-clinical
medical students in New York had burnout levels above cutoff on the Maslach Burnout
Inventory – General Survey (MBI-GS). 22% of preclinical dental students in Turkey showed
signs of emotional exhaustion, and between 16 – 18% showed signs of cynicism and low

9
academic efficacy. Burnout was measured with the Maslach Burnout Inventory- Student
Version (Atalayin, Balkis, Tezel, Onal, & Kayrak, 2015).
In summary, the levels of burnout vary in different populations and countries, also
depending on what measures have been used. Burnout has been measured with different self-
rating instruments, which makes it possible to find how many participants are above a cutoff
level, but not whether or not they would fulfill the criteria for exhaustion disorder. It is clear
though, that exhaustion or burnout is a problem, both in work-life and among students.
Risk factors for burnout and exhaustion
Burnout has been associated with a variety of factors, sometimes in cross-sectional
studies and sometimes in longitudinal studies. The longitudinal designs can investigate the
cause and effect of the factors associated with burnout, while it is not possible to claim causal
relationships from the results of cross-sectional studies. Five factors that have been
associated with burnout or exhaustion will be presented below; social support, self-esteem,
physical activity, gender and being in nature.
Social support. Cobb (1976) defines social support as “information leading the
subject to believe that he is cared for and loved, esteemed, and a member of a network of
mutual obligations.” (p. 300).
Social support can also be seen as “a social network’s provision of psychological and
material resources intended to benefit an individual’s ability to cope with stress.” (Cohen,
2004, p.676). Cohen (2004) suggests that social support can be divided into three types of
support; instrumental, informational, and emotional support. Material aid such as practical or
financial help is instrumental support. Informational support includes the provision of
information with the aim of enhancing the individual’s ability to cope. Emotional support
refers to someone listening empathically and showing care and trust. Previous research has
differentiated perceived social support and received social support (Mitchell, Evans, Rees, &
Hardy, 2014).
Social support as a main effect or a stress buffer. Cohen and Wills (1985) propose
two theories of how social support affects health and wellbeing; the main effect theory and the
buffering hypothesis. According to the main effect theory social support will be beneficial for
an individual’s wellbeing regardless of the existence of a stressful event or not. Social support
directly affects wellbeing, since it provides people with positive experiences, feelings of self-
worth and stability.
10
The buffering hypothesis suggests that social support may act as a stress buffer, so
that social support is beneficial for health only when experiencing a stressful event. Stress
buffering can operate at different points in the assumed link between a stressor and the
pathological response. It may prevent a stress appraisal, by making the individual evaluate the
situation as less threatening and oneself as more capable of handling the situation. Stress
buffering can also occur between the stress experience and the pathological reactions, by
making the individual reappraise the responses and find alternative reactions (Cohen & Wills,
1985).
There is evidence of social support as a main effect on stress experience, but also of
social support as a buffer of stress. In a study by Mitchell et al. (2014) it was found that
psychological reactions to an injury were lower in the cases that reported high levels of
perceived social support, which suggests that perceived social support acts as a stress buffer.
Perceived social support was the experience that one had available support if needed. The
main effects of perceived social support could explain between 3 and 11% of psychological
reactions. The authors also investigated the effect of received social support on psychological
reaction to a physical injury. Received social support was the extent to which someone had
given them social support. In that case social support did not act as a buffer; it acted solely as
a main effect. The main effect of received social support could explain between 9 and 21% of
psychological reactions to a physical injury. If the social support matched the injury stressor
(e.g., isolation, loss of confidence) the effect of social support was greater. That is called the
stress-support matching hypothesis.
Empirical studies of the association between social support and burnout. Olwage
and Mostert (2014) studied predictors of burnout among university students in South Africa,
and they found that the levels of social support from parents significantly predicted burnout,
as well as engagement, which is often seen as the opposite of burnout. Low levels of parental
support were associated with burnout, while high levels of parental support were associated
with engagement. However, the authors did not find any significant effect of general support
on burnout. Moreover, Yang and Farn (2005) examined predictors of burnout among students
in a technical-vocational college in Taiwan. They found that social support, self-efficacy and
femininity were significant predictors of burnout. Social support was negatively correlated
with burnout, meaning that the students with low social support had high rates on burnout-
scales. This suggests that social support may be an important factor in helping students to
cope with stressful events. Similar results were found by Bonafé, Maroco and Campos (2014),
who investigated the role of social support and demographic factors in predicting burnout

11
among dentistry students. They found that social support, gender, housing and student
performance could be used as predictors of burnout. Low levels of social support were
associated with higher levels of burnout.
Yildirim (2008) studied counsellors in Turkish schools, to see if social support and
sociodemographical factors were associated with burnout. The results showed negative
associations between social support from principals, colleagues and friends, and burnout, so
that low levels of social support predicted high levels of burnout. Support from partner was
only associated with the personal accomplishment dimension and family support was
associated with personal accomplishment and emotional exhaustion.
Alarcon et al. (2011) found that social support was associated with problem-focused
coping, suggesting that social support might enhance coping strategies. Social support was not
a direct predictor of burnout or engagement. However, the authors suggest that it has an
indirect effect on engagement through coping strategies.
In summary, social support is portrayed as a broad and complex phenomenon, with
several categories and types of social support. Some research point to associations between
social support and burnout, however what type of social support that has been associated with
burnout varies among studies. Some studies also suggest that there is no direct association
between social support and burnout; rather that social support affects other factors such as
coping and self-evaluation, which could have an effect on burnout.
Self-esteem. Self-esteem is a global evaluation of the self; attitudes and judgments
about worthiness and competence. Self-esteem affects emotions, cognitions and behavior so
that a person with a high self-esteem shows more acceptance, respect and positive attitudes
towards oneself, while a person with a low self-esteem has a more negative and unaccepting
attitude towards the self (Rosenberg, 1965). Deci and Ryan (1995) have argued that self-
esteem is a more complex construct than portrayed by Rosenberg’s global definition of self-
esteem. Deci and Ryan present different aspects of self-esteem such as contingent self-esteem
and true self-esteem, where the first is feelings and evaluations of oneself based on some
standard or expectation. True self-esteem refers to a more stable attitude towards oneself,
which is based on a more secure and robust self. A contingent self-esteem is associated with
the need for performance to be worthy, while a true self-esteem is developed when acting in
accordance with ones values.
Afari, Ward and Khine (2012) suggested that self-esteem is developed within a social
context because of the comparisons made with people of the same group or culture. A high
12
perceived performance in comparison to other group members would lead to higher
confidence and perception of self-worth.
Rosse, Boss, Johnson, and Crown (1991) studied two groups consisting of police
officers and hospital workers. In total the samples included 1,657 participants, with a majority
in the police officer group. Rosse et al. (1991) found significant negative correlations (r=-.45
for hospital workers, r=-.37 for police) between self-esteem (measured with RSES) and
burnout (measured with MBI); those with low self-esteem rated higher levels of burnout. Of
the three components of Maslach’s burnout-definition emotional exhaustion had the strongest
correlation with self-esteem. They also found that gender did not play a role in the
relationship; the correlation was as strong for men as for women. Furthermore they tested
whether self-esteem could be a moderator of burnout and work characteristics, but the results
showed that the effect was a main effect rather than an interaction effect, suggesting that self-
esteem has a direct effect on burnout. It is not clear whether self-esteem is an antecedent or
consequence of burnout; presumably both.
Rosse et al. (1991) suggested that people with low self-esteem have problems in the
interaction with other people, and thus experience incompetence in relationships, as well as
having fewer resources to cope with stress or other challenges. This could make people with
low self-esteem more vulnerable to burnout.
In a study of Iranian and Turkish teachers it was found that burnout was associated
with professional self-esteem (Khezerlou, 2017). Khezerlou (2017) suggested that low self-
esteem posits an individual at greater risk of developing mental health problems, such as
exhaustion or burnout, because they are more emotionally vulnerable.
Dahlin, Joneborg and Runeson (2007) examined the association between
performance-based self-esteem (PBSE) and the burnout dimensions exhaustion and
disengagement. They found that 41.7% of the participants had performance-based self-
esteem, which was higher than in other populations. Women had higher exhaustion rates than
men. Exhaustion was positively correlated with performance-based self-esteem (r=.37) and
with disengagement (r=.30).
Altogether the research found point to a negative association between self-esteem and
burnout, where high levels of self-esteem have been associated with low levels of burnout.
The direction of the association is not clear, however.
Physical activity. According to the World Health Organization (“Physical activity”,
2017, para.1) physical activity can be defined as “any bodily movement produced by skeletal
muscles that requires energy expenditure.”. It is well documented that physical activity has a

13
positive effect on health and wellbeing. It does not only prevent illnesses, but it also
contributes to feelings of wellness and a higher quality of life (Ohuruogu, 2016). Physical
activity affects the levels of serotonin, dopamine, noradrenaline and endorphins, which
contributes to feelings of wellbeing, alertness and pain relief. Physical activity also affects
memory and ability to concentrate, which could be explained by an increase in brain cells in
hippocampus and the prefrontal cortex. Physical activity has been associated with a lower risk
of developing diseases such as cardiovascular diseases, diabetes, dementia, anxiety and
depression (Hansen & Sundberg, 2014). Mental health in general is also associated with
physical activity. Kim et al. (2012) found a curvilinear relationship between physical activity
and mental health, so that between 2.5 and 7.5 hours of physical activity per week was an
optimal threshold for better mental health. Moreover, Cecil et al. (2014) found that physical
activity was associated with lower emotional exhaustion and higher personal accomplishment,
in a university student population in the UK.
Jonsdottir, Rödjer, Hadzibajramovic, Börjesson, and Ahlborg (2010) used a
longitudinal design to investigate the associations between physical activity during leisure
time and perceived stress, burnout, depression and anxiety. All factors were measured using
self-report instruments. Physical activity was measured with SGPALS. Participants rating
performance of light, moderate or vigorous physical activity were more likely to rate low
levels of experienced stress, burnout, depression and anxiety than those who rated sedentary.
At a two year follow up the symptoms of depression, stress and burnout were lower for those
who had engaged in physical activity than for those who were sedentary. Moderate to
vigorous physical activity was also associated with lower anxiety ratings two years later.
Toker and Biron (2012) also used a longitudinal design to examine the role of physical
activity in increasing or decreasing job burnout and depression. They found that depression
and burnout was highest among the participants who were not physically active and that the
participants who were more physically active were not as often and as depressed or burned
out.
Lindwall, Gerber, Jonsdottir, Börjesson, and Ahlborg (2014) studied the relationships
of change in physical activity with changes in depression, anxiety and burnout. They used a
longitudinal design and used 4 measurements over a period of 6 years. The participants were
health care workers. Lindwall et al. (2014) found that there was a relationship between change
in physical activity and the three measures of mental health so that being more physically
active correlated with lower levels of depression, anxiety and burnout.
14
Armon (2014) investigated the relationship between type D (distressed) personality
and job burnout and looked at physical activity as a possible moderator. She found a
relationship between type D personality and job burnout, but those who were more physically
active had lower scores of burnout than those who were not physically active, suggesting that
physical activity might be a moderator in the association.
Henwood, Tuckett, and Turner (2012) studied nurses in New Zealand and Australia to
see if there was a difference in health in the nurses who engaged in workplace physical
activity and those who engaged in leisure time physical activity. They found a positive
association between leisure physical activity and health, but not for workplace physical
activity.
In summary, physical activity has been associated with both physical and mental
health, and research suggests that burnout levels are affected by physical activity too.
Gender. Gender is one of the most common categorizations that people experience.
With that categorization comes different expectations of how to behave and react, which also
affects the health and wellbeing of men and women (Magnusson & Marecek, 2010). Based on
that it is of interest to understand what role gender plays in the experience of exhaustion.
Canivet et al. (2010) investigated the gender differences in conflict between work and
family and its relationship with exhaustion. Work-to-family conflict (WFC) is when the job
affects the family negatively by reducing time spent with the family, as well as impairing the
quality of the time spent with the family. Family-to-work conflict (FWC) is when family
worries or obligations affect work negatively, by distractions, too little sleep or too little time
spent on the job. Canivet et al. (2010) found differences between men and women in most
measures. Women spent more time doing household chores, reported lower general health
than men, were more prone to smoking, had a lower socioeconomic status, experienced job
strain to a higher degree and were more likely to live alone. Men were more likely to have a
less social life, they worked overtime more often and they were more likely to be high-risk
alcohol consumers. Work-to-family conflict was more common for men while the opposite
was more common for women; however both WFC and FWC predicted exhaustion for both
men and women. Even though WFC was more common among men, it was a stronger
predictor for exhaustion in women. The explanatory power of WFC and FWC was stronger in
women, as 22% of the variance in exhaustion could be explained by the model for women as
compared with 14% for men. Women also experienced exhaustion more often than men;
approximately 16% of women experienced exhaustion while only 8% of men did.
15
Although most students do not live in a family the research by Canivet et al. (2010)
helps clarifying the differences in how factors contribute to exhaustion in men and women.
The study also elucidates the difference in pressure or strains that men and women
experience, as factors such as low socioeconomic status, high job strain and spending more
time on household work was more common among women.
Anitei, Chraif, and Ionită (2015) studied whether there were any gender differences in
the relationship between workload and burnout. They found significant differences between
men and women; women experienced higher workload and burnout than men. Dahlin et al.
(2007) found higher exhaustion rates in women than men in a student population.
Fares et al. (2016) found that women rated higher levels of experienced stress and
burnout than men in a population of medical students in Lebanon. Norlund et al. (2010) found
that women had higher levels of burnout than men, especially in the group aged 35-44 years.
Glise (2014) found that women were over-represented in the diagnosis of exhaustion disorder,
but there were no differences in the course of the illness and how it developed.
There is research suggesting gender differences in exhaustion, but there are also
contradicting findings. Onuoha and Akintola (2016) studied academic burnout in Nigeria, and
found no gender differences in the reports of burnout. Cecil et al. (2014) studied burnout
among university students in the UK and the results showed that men rated higher levels of
depersonalization and lower levels of personal accomplishment, suggesting that men were at
greater risk of experiencing burnout than women.
In a meta-analysis by Purvanova and Muros (2010) it was found that the research
conducted regarding gender differences in burnout has yielded inconsistent results. According
to the results of the meta-analysis there is no clear difference between overall burnout scores
of women and men, however, women rate slightly higher scores on emotional exhaustion
while men have slightly higher scores on depersonalization. The results also showed a
tendency towards greater gender differences in burnout scores in the USA than in the
European Union.
The results concerning the association between gender and exhaustion are ambiguous,
with some research pointing to gender differences while others could not find any differences.
Furthermore, the gender differences found vary in direction, with some studies showing
higher levels of burnout among women and others among men. According to the Swedish
agency for health technology assessment and assessment of social services (SBU, 2014) men
and women in similar work situations tend to have similar levels of exhaustion and
depression.

16
Being in nature. The concepts nature and natural environments are used in reference
to non-man-made environments or areas created to resemble non-man-made environments.
Natural environments often include either water or some type of vegetation (Ulrich et al.,
1991).
Being in green space has been associated with health benefits. Maas et al. (2009)
found that the prevalence of 15 out of 24 physical and mental illnesses was lower for people
in areas with a high proportion of green space. The relationship was strongest for anxiety and
depression, and the associations were stronger in lower socioeconomic groups. The results
suggest that access to green space has a positive effect on health, particularly mental health.
The authors suggest several explanations for the relationship; green space may enhance
recovery from stress and attention fatigue, access to green space may increase physical
activity which positively affects health, the air quality is better and green space may increase
social activities (Maas et al., 2009).
Nielsen and Hansen (2007) also found that short distance to a garden or other green
areas was associated with lower levels of experienced stress. The authors suggest that access
to green areas increases the likelihood of engaging in outdoor activities and in using healthy
ways of traveling, such as bicycling or walking, which could explain the lower stress levels.
Attention restoration theory. According to the attention restoration theory natural
environments help a person restore from attention fatigue. Directed attention is needed to be
able to focus on a task; it is a key to effectiveness. Directed attention is tiring and leads to
attention fatigue. To restore the attention ability one needs rest, both in the form of sleep, but
also in attending to the world in a different way than with directed attention, attention that
doesn’t demand effort. Being in nature doesn’t require directed attention, according to Kaplan
(1995). There is more than one reason for the restorative effects of nature; being away, freeing
one’s mind from activities that need directed attention, the environment is rich in a way that it
is fascinating and engages an individual in looking, feeling and experiencing (Kaplan, 1995).
Ulrich’s psycho-evolutionary theory. Human beings like to relax in natural
environments because nature plays an evolutionary important role for us. Nature has secured
human beings’ survival through water and open spaces, as well as places to hide. Humans
have adapted to the natural environment, but not yet to the urban environment, thus we have
an innate way of responding to the natural environment, which is with positive feelings and
restoration. Ulrich describes it as an unconscious emotional reaction to the environment
(Ulrich et al., 1991).

17
Ulrich et al. (1991) found that stress recovery was faster and more complete when
exposed to a natural environment rather than an urban. In this study the participants watched
videotapes of the surroundings, meaning that even though the participants did not physically
experience the environment, the recovery was better (measured with both self-rating and a
variety of physiological measures). The videotapes of the urban areas were associated with a
sympathetic mobilization, suggesting that the body made itself ready for risk, in the form of
defense setting of the body.
Ewert et al. (2016) measured the levels of cortisol before and after visiting a natural
environment; a track around a lake, with a forest surrounding. The results showed that the
levels of cortisol were reduced from the first to the second measure, suggesting that spending
time in nature reduces stress levels. It is not clear, however, if it is the physical activity, the
leisure time or the presence of nature that reduces the experienced stress.
Sahlin, Ahlborg, Matuszczyk, and Grahn (2014) studied the effects a nature-based
stress management course on women at risk for stress related problems. The results showed
lower burnout scores and stress related symptoms, decreased long-term sick-leaves as well as
an increased ability to work. Apart from individuals learning coping strategies and tools,
nature played an important role in the reduction of burnout and stress symptoms.
To sum up, previous research points to an association between spending time in nature
and stress related health problems. It is not clear, however, whether it is the nature in itself
that matters, or other factors such as physical activity, leisure time and relaxation that
contribute to the association with stress. Furthermore, the research concerning the link
between being in nature and exhaustion specifically is limited.
Summary
Exhaustion is a relatively new concept; however it is closely related to the concept
burnout. There is a large amount of research concerning work-related burnout but studies on
academic burnout are more limited, even though research on the topic has increased the last
years. Most studies investigating risk factors for burnout or exhaustion are cross-sectional.
There are some longitudinal studies, primarily when it comes to physical activity and being in
nature. Because of the high number of cross-sectional studies it is difficult to know what role
the factors have in the associations with burnout.

18
Purpose
Based on the research and theories outlined above the factors social support, self-
esteem, gender, physical activity and being in nature are possible predictors of exhaustion.
Some factors have well-documented associations with burnout or exhaustion, while some
factors are less studied or the results are contradictory. Since the research on exhaustion
among university students is limited, it is an important group to study. If academic burnout
has an effect in the long run, it is of importance to understand the underlying factors to be able
to prevent burnout.
Thus, the purpose of this study is to examine how common exhaustion is among
university students and to what extent the factors social support, self-esteem, physical activity,
gender and being in nature can predict exhaustion.
Research questions
1. How common is exhaustion among students at Lund University?
2. Can the factors social support, self-esteem, physical activity, gender and being in
nature be used to predict exhaustion?
3. To what extent can the factors predict exhaustion?
4. Which factor is the best predictor of exhaustion?
Method
Both the terms burnout and exhaustion have been used throughout the thesis, because
of the variations in studies measuring the concepts. The present study measured exhaustion,
depending on the choice of the instrument (KEDS), while much of the research that has been
conducted has measured burnout. Even though the concepts are slightly different they are
related and similar, which justifies the choice to include studies using both terms.
Firstly, a literature review was conducted to see what factors had been found
associated with burnout and exhaustion in previous research, as well as what instruments had
been used to measure the constructs. The databases Lubsearch, Google Scholar and PsycInfo
were utilized to collect research articles, and the references of articles were also reviewed to
find relevant research.
Based on the literature review different possible predictors of burnout emerged and
the ones used in this research were chosen based on the aim of the study and availability of
instruments as well as psychometric properties of the instruments. Due to problems finding

19
instruments in Swedish the options were limited. Based on the literature review and
discussions with the supervisor a purpose was set.
The population university students, was chosen based on the fact that the research on
university students and burnout or exhaustion was limited compared to the extensive mass of
research on work-related burnout. A majority of the research done on academic burnout was
done on medical students, so this study was designed to examine exhaustion among students
of all faculties at Lund University, to increase the generalizability of the results.
Design and procedure
The study used a quantitative approach, and a cross-sectional design was chosen
because of the restriction in time for the thesis. A longitudinal design would have given the
possibility to make causal inferences, however it would be too time-consuming. A number of
demographic control variables were included to strengthen the design and decrease the risk of
Type II error (Shadish, Cook, & Campbell, 2002). A web-survey was used since it is quick
and easy to administrate, and available at any time. It is also an inexpensive way of collecting
data and an effective way of getting a large number of participants.
When the structure of the questionnaire had been formed the questionnaire was pilot-
tested to detect any ambiguities as well as to find out how long time the questionnaire would
take to fill in. 5 students participated in the pilot-survey (in the middle of January, 17-20) and
based on the comments a few questions were clarified, and a couple of demographic questions
were added. No analysis was done on the pilot-responses, because of the low number of
participants. All questions were made mandatory to eliminate non-response analyses. The
survey was distributed from the end of January to the end of February 2017.
Participants
Inclusion criteria for the study were that the participants should be full time students
(not distance students) at Lund University. Distance students were excluded because of an
assumption that distance students can have other primary occupations, which means they are
not the target population. The inclusion criteria “full time student” was there to exclude those
who were part-time students, as that could affect the results as well.
Students at Lund University were chosen to delimit the population and to limit the
confounding variables in the study. To be able to detect possible differences between students
of different faculties only students from Lund University were accepted, since other
universities may have other faculties which would make a comparison difficult.

20
253 individuals participated in the survey. 76.3% were women and 23.3% were men.
1 person (.4%) reported gender “other”. 62.5% were between 21-25 years old and 20% were
between 26 and 30. 36% studied at the Social Science’s Faculty and 47% at the Faculty of
Medicine. The rest of the participants were students from the School of Economics and
Management, the Faculty of Engineering, the Natural Science Faculty, the Faculty of Law,
and the Faculty of Humanities and Theology. 37% lived with a partner, 27% alone, 11% with
parents and 26% in a corridor. 47% of the participants had an extra job.
Sampling
A convenience sampling method was used. Recruitment of participants was done
mainly through information on social media (Facebook). The information was spread among
friends and in Facebook-groups that were related to the university. Administrators of different
educations were also asked to send out information by e-mail to the students, and those who
were willing to, sent the information to the student-emails. Around 1,000 e-mails were sent to
students at the Faculty of Medicine, the Social Science’s Faculty and the Faculty of
Engineering. A minimum of 100 participants was anticipated.
Instruments
The survey consisted of demographical questions (age, gender, field of study, the
number of semesters studied, living conditions, extra job or not), the Karolinska Exhaustion
Disorder Scale (KEDS), Rosenberg Self-esteem Scale (RSES), Saltin Grimby Physical
Activity Level Scale (SGPALS), the Multidimensional Scale of Perceived Social Support
(MSPSS) as well as four questions concerning being in nature. Although gender was only
measured with one question, the concept gender will be used throughout the thesis, in
reference to the social categorization of men, women and others, rather than the categorization
of biological sexes.
Karolinska Exhaustion Disorder Scale – KEDS. The Karolinska Exhaustion
Disorder Scale was chosen as a measure of exhaustion since it shows good reliability and
validity and it was developed specifically to measure symptoms of exhaustion disorder, which
makes the instrument appropriate for the current thesis. KEDS consists of 9 items with
response alternatives ranging from 0-6, meaning that the total result can range from 0 to 54.
The items were developed based on the criteria for exhaustion disorder, as well as on
symptoms that many patients with exhaustion disorder reported. The 9 items measure ability
to concentrate, memory, physical stamina, mental stamina, recovery, sleep, sensory

21
impressions, experience of demands and irritation and anger. KEDS has shown good validity
and reliability for clinical settings as well as in research. Besèr et al. (2014) validated the
instrument through examining the ratings of two groups; one consisting of patients diagnosed
with exhaustion disorder (N=203), and a group consisting of healthy controls (N=117). Factor
analysis was done and the results indicated that the scale was unidimensional. Internal
consistency was measured through Cronbachs alpha. For all participants α= .94, in the patient
group α=.74 and in the control group α=.81. Discriminative validity was found to be very
good; the results showed that 19 can be used as a cut-off for exhaustion problems, with a 95%
specificity and sensitivity.
The internal consistency of KEDS in this study was α=.84.
Rosenberg self-esteem scale – RSES. The Rosenberg self-esteem scale is a global
measure of self-esteem which has been used in a variety of studies and among different
populations. The scale measures a unidimensional concept. The scale consists of 10 items that
are measured using a 4-point, 5-point or 7-point Likert scale (Gray-Little, Williams, &
Hancock, 1997). In this study the 4-point scale was used. The RSES was chosen since it is a
widely used and well developed instrument to measure self-esteem, and it shows good
psychometric properties.
Validation studies of the RSES have found good psychometric properties; α=.86; α=
.88; α=.81; (Collison, Banbury & Lusher, 2016; Fleming & Courtney, 1984; Meurer, Luft,
Benedetti & Mazo, 2012). Fleming and Courtney also found test-retest reliability to be .82.
Gray-Little et al. (1997) reported the following psychometric properties: Cronbach’s
alpha was α=.88, inter-item correlations ranged from r4,9= .21 to r1,2=.66 and the item-total
correlations ranged from rT4=.61 to rT6=.76. Gray-Little et al. (1997) also did an item response
theory analysis of the RSES to complement and refine the analyses done with other
psychometric procedures. Gray-Little et al.’s finding corroborate that the scale is
unidimensional as proposed by Rosenberg (1965). The results also indicated that the 10
factors were not equally discriminating. The items 8, 9 and 10 were slightly less related to the
construct and were, therefore, not as good at differentiating levels of self-esteem as the other
items. A weighted scoring of the scale would therefore yield more reliable scores, however it
would complicate the counting of scores. Gray-Little et al. also discuss the limited gains in
reliability that a weighted scoring would yield.
The unidimensionality of the RSES has been questioned in some research. Ang,
Neubronner, Oh, and Leong (2006) found that the scale consisted of two factors; positive and
negative self-esteem, and that the positive self-esteem factor could be used as a predictor of

22
self-efficacy and mastery-goal orientation, while the negative self-esteem factor could predict
disruptive behavior.
The internal consistency of RSES in this study was α=.90, which is considered
excellent reliability.
Saltin Grimby Physical Activity Level Scale – SGPALS. The Saltin Grimby
Physical Activity Level Scale was developed by Saltin and Grimby (1968) who used the
instrument to evaluate the physical activity level of middle-aged male former athletes. The
instrument has thereafter been used in a variety of studies in the Nordic countries, with some
modifications of the instrument in some cases (Grimby et al., 2015). The SGPALS was used
since it attempts to measure levels of physical activity, despite the limitation of consisting of
only one question. This was due to problems finding available and free instruments in
Swedish.
The scale consists of alternatives regarding level of physical activity: mostly
sedentary, light physical activity (e.g., walking or bicycling to work), moderate physical
activity (e.g., swimming, playing tennis and running) and vigorous physical activity (activities
with high intensity several times a week) (Grimby et al., 2015).
Aires, Selmer, and Thelle (2003) evaluated the validity of SGPALS in their population
based study of 332,182 men and women in Norway, by comparing the ratings of the
questionnaire with biological measures. The biological measures were blood lipids, body
mass index and blood pressure. The authors also investigated the consistency of the
associations over a period of 25 years. The results showed that BMI and serum cholesterol
were associated with the measures of physical activity, and the association was consistent
over the 25 years.
Jonsdottir, Rödjer, Hadzibajramovic, Börjesson, and Ahlborg (2010) used the
instrument in their prospective study on physical activity and mental health. This suggests that
the scale is a good measure for studying the relationship between physical activity and
exhaustion too.
Sjøl, Thomsen, Schroll and Andersen (2003) found that 83% of the participants rated
the same physical activity group when they filled in SGPALS one month after they had filled
it in the first time. That indicated decent test-retest reliability.
Multidimensional scale of Perceived Social Support - MSPSS. The MSPSS
measures an individual’s perceived social support through three dimensions; family, friends
and significant others. The scale was chosen since it is a measure of perceived social support,
which was attempted to be measured in the thesis, and the instrument shows good
23
psychometric properties. There are 12 items with a seven point Likert scale resulting in a
score range between 12 and 84 with the higher results indicating a higher perceived social
support. Zimet, Powell, Farley, Werkman, and Berkoff (1990) investigated the psychometric
properties of the original MSPSS. They found internal consistency between α=.81 and α=.98
for the subscales and the whole scale, which indicates good or excellent internal reliability.
Test-retest values also indicated good stability (.72 to .85). The factor analysis also showed
that the three subscales are distinct factors.
The Swedish version of MSPSS was validated in 2013 and shows good psychometric
properties. The internal consistency ranged between α=.91 and α=.95 for all scales. The factor
structure of the three dimensions was reproduced. The scales showed clinically significant
differences (Cohen’s d ranging from .54 to .90) between the main group (nursing students)
and the reference group (women with hirsutism), indicating discriminative validity. Test-
retest showed satisfactory reproducibility. The item and scale scores showed a skewed
distribution, with a ceiling effect. The majority of the participants of the validation study were
women (Ekbäck, Lindberg, Benzein, & Årestedt, 2013).
The internal consistency of MSPSS whole scale in this study was α=.93, and the
Cronbach’s alpha values for the friends, family and significant other- subscales were .94, .92
and .92, respectively, which is considered excellent reliability.
Being in nature. No instrument regarding being in nature could be found, so four
questions were constructed by the author and were then discussed together with the
supervisor. The questions regarded how much time was spent in nature, what the purpose of
being in nature was and if the person liked being in nature or not. Before the questions,
examples of what “being in nature” was, was given. The examples included both non-man-
made environments and environments resembling non-made made environments, such as
parks and gardens. The questions were pilot-tested on five students to see whether the
response alternatives were sufficient, and if aspects of being in nature were missed. Some
alternative responses were added after the pilot. No statistical analyses were done on the pilot-
answers because of the low number of participants.
The reliability of being in nature was tested through Spearman’s correlation between
the questions “How often do you spend time in nature?” and “How many hours per week do
you spend in nature?”. The correlation was r=.65, indicating acceptable reliability.

24
Statistical analyses
SPSS version 24 was used for the statistical analyses. Firstly, descriptive data-
analyses (mean, standard deviation) and tests of basic assumptions such as normality and
homogeneity of variance were done. The reliability of the scales was assessed through
Cronbach’s alpha. Spearman’s correlation was used to test the reliability of the questions
concerning being in nature. The question “How often do you spend time in nature?” was used
for the assessment of correlations and in the regression analysis because of extreme outliers in
the other question (How many hours per week do you spend in nature?).
Pearson’s correlations were used to assess the associations between the factors.
Spearman’s correlations were also assessed because of the violations of assumptions and no
clear differences were found, hence the Pearson’s correlations were reported. A t-test was
used to test whether or not there were any differences between men’s and women’s ratings of
exhaustion. A one-way ANOVA was used to test if there were any differences in exhaustion
level between the different physical activity response-groups. Tests of basic assumptions
(linearity, normality, multicollinearity and homoscedasticity) for a multiple regression
analysis were done, and since the assumptions of linearity and normality were violated for the
MSPSS scale and subscales, the scales were dichotomized into categories of low social
support and high social support. The physical activity scale was also dichotomized into
sedentary- medium physical activity and vigorous physical activity, based on the differences
between the groups found in the ANOVA. A standard multiple regression analysis was used
to investigate to what extent the factors social support, self-esteem, physical activity, gender
and being in nature could predict exhaustion.
Ethical considerations
Four ethical principles in research within humanistic and social sciences are presented
by the Swedish Research Council (Vetenskapsrådet, 2002). The four principles are
information, informed consent, confidentiality and utility and they have the purpose of
protecting the rights and wellbeing of participants. The researcher is obliged to inform the
participants about the purpose of the study and the conditions of participation. Moreover the
participants should be informed that participation is voluntary and that they have the right to
terminate participation at any time. When the participant has received sufficient information
the participant should give his/her informed consent. All material concerning individual
participants ought to be confidential and sensitive data that can be connected to an individual
25
must be kept inaccessible for unauthorized. The collected data can only be used for the
purpose of the research, and not for other utilities.
To adhere to the principles information regarding purpose of the study, anonymity and
confidentiality and the right to terminate participation at any time, was presented before the
questions of the survey (see Appendix). The participants of the study were anonymous so no
data could be connected to any individual. The results were only presented at a group level.
Researchers ought to weigh the expected contribution of the research against the
possible risks that the participants are exposed to (Vetenskapsrådet, 2002). In this study the
risks of participating were considered very small, while the possible gain of the research is a
greater understanding of exhaustion among students, which in the long run can lead to
prevention of exhaustion. An e-mail address to the author was included in the information to
give the opportunity to give feedback or complaints. If necessary the author could have
directed participants in need of help.
It is also of ethical concern that research contributes to society through possible gains
in knowledge. Although burnout and exhaustion are relatively well-studied, research on
academic burnout is more limited (Lin, & Huang, 2014). As mentioned earlier burnout during
higher education may have long-term effects (Rudman & Gustavsson, 2012), which makes it
important to study exhaustion among university students. Research points to high levels of
burnout and exhaustion among students (Cecil et al., 2014; Fares et al., 2016; Mazurkiewicz
et al., 2012), which makes it pertinent to investigate what factors are associated with
exhaustion, to increase the understanding and possibility to prevent stress-related health
problems. Moreover, knowledge concerning exhaustion is of importance for clinical and
organizational psychologists who most probably will work with and treat individuals and
groups suffering from stress-related mental health problems.
Results
The initial descriptive analyses yielded a mean value of 14.83 on the exhaustion scale
(KEDS), with a standard deviation of 7.91 (M=14.83, SD=7.91), indicating that the mean of
the sample scores is below the cutoff of 19. The distribution of the scores is shown in Figure
1.
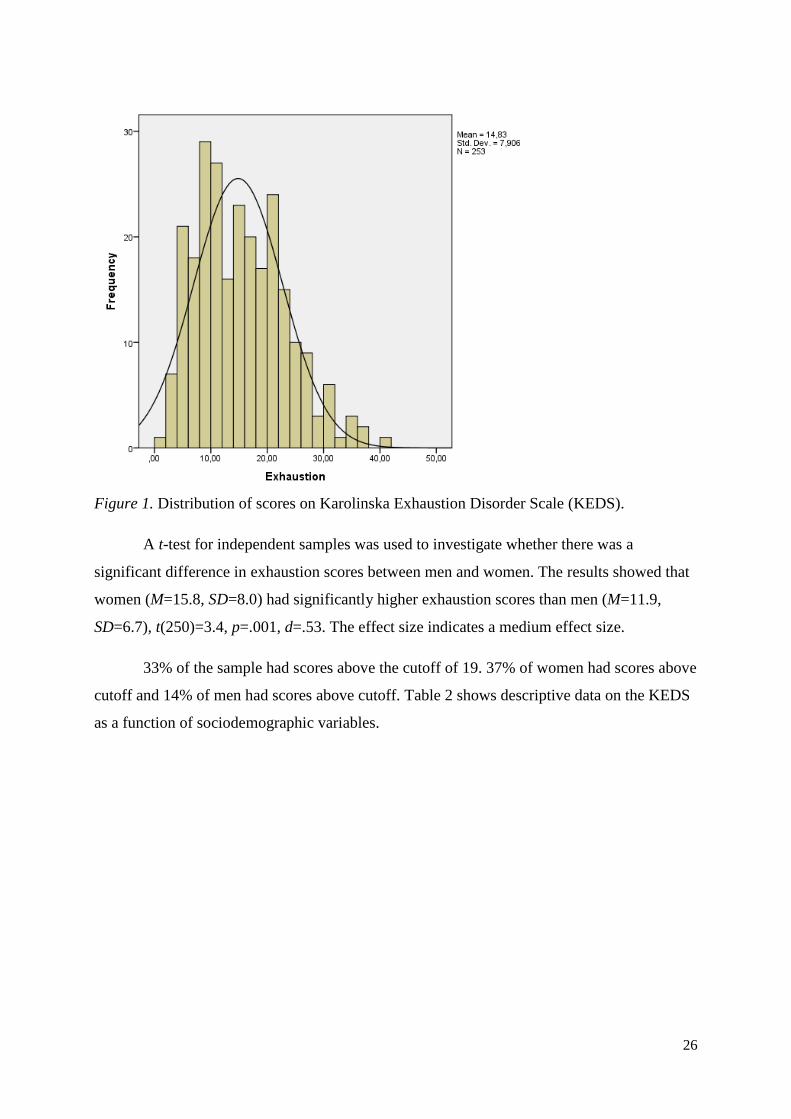
26
Figure 1. Distribution of scores on Karolinska Exhaustion Disorder Scale (KEDS).
A t-test for independent samples was used to investigate whether there was a
significant difference in exhaustion scores between men and women. The results showed that
women (M=15.8, SD=8.0) had significantly higher exhaustion scores than men (M=11.9,
SD=6.7), t(250)=3.4, p=.001, d=.53. The effect size indicates a medium effect size.
33% of the sample had scores above the cutoff of 19. 37% of women had scores above
cutoff and 14% of men had scores above cutoff. Table 2 shows descriptive data on the KEDS
as a function of sociodemographic variables.

27
Table 2
Means (SD) on the Karolinska Exhaustion Disorder Scale (KEDS) as a function of
sociodemographic variables.
Demographic variable n (%) Mean (KEDS)
(KEDS)
SD (KEDS)
Overall Sample 253(100%) 14.83 7.91 Gender
Female 193(76.3%) 15.8 8.0
Male 59(23.3%) 11.9 6.7
Other 1(.4%)
Faculty
Social Science’s Faculty 90(35.6%) 15.02 7.64
Faculty of Medicine 120(47.4%) 15.05 8.03
Faculty of Engineering 23(9.1%) 12.91 7.62
Other 20(7.9%)
Age
Under 20 19(7.5%) 12.53 7.86
21-25 158(62.5%) 14.91 7.79
26-30 51(20.2%) 14.80 8.32
31-35 11(4.3%) 17.27 7.28
36-40 7(2.8%) 17.71 8.12
Over 40 7(2.8%) 12.86 8.91
Living conditions
Alone 67(26.5%) 15.58 8.57
With partner 94(37.2%) 14.74 7.75
With parents 27(10.7%) 14.93 9.03
In a corridor/with friends 65(25.7%) 14.15 7.00
Extra job
Yes 120(47.4%) 15.21 7.38
No 133(52.6%) 14.50 8.36
Purpose of time in nature
Getting somewhere 41(16.2%) 16.15 7.77
Walking or running 157(62.1%) 14.73 8.18
Outdoor recreational activities 32(12.6%) 14.34 7.31
Resting 20(7.9%) 14.25 7.32
Work 3(1.2%) 11.67 7.09
Level of physical activity
Sedentary 11(4.3%) 17.73 6.97
Light physical activity 98(38.7%) 15.67 8.13
Medium physical activity 100(39.5%) 15.19 7.46
Vigorous physical activity 44(17.4%) 11.43 7.88
Reliability
Cronbach’s alpha was used to measure the internal consistency; the extent to which
the items of a scale measure the same construct. The values ranged from α=.84 to α=.94,
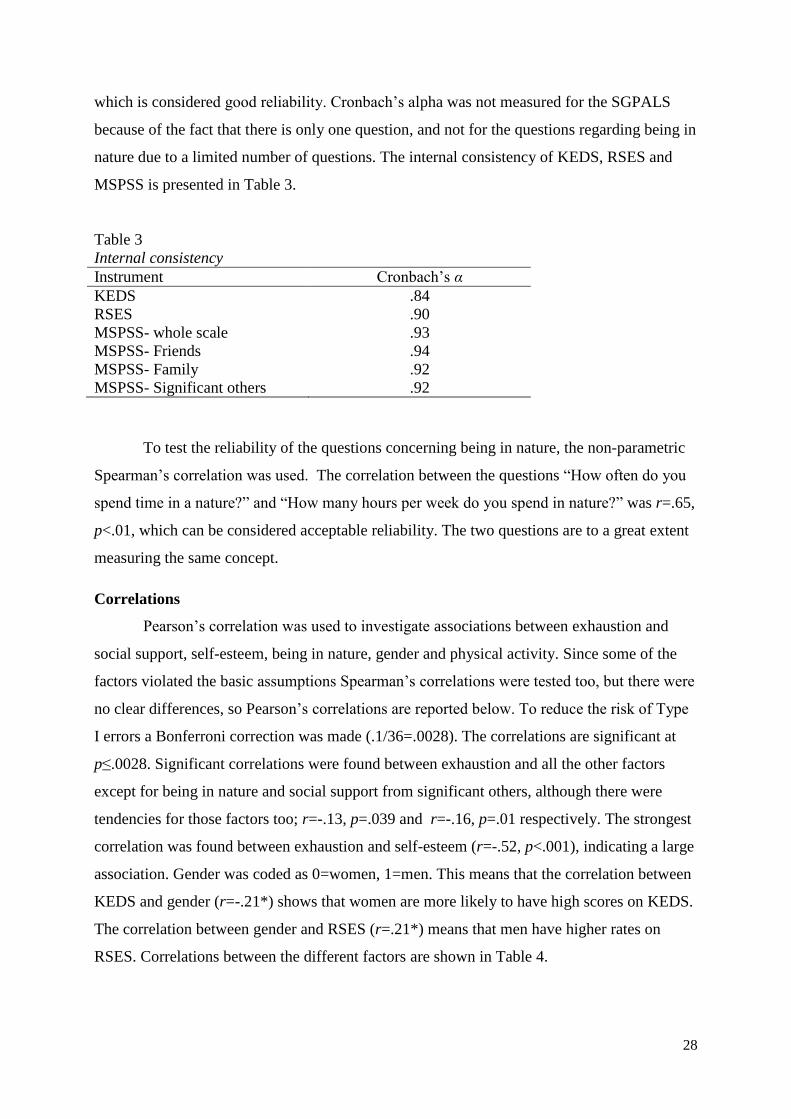
28
which is considered good reliability. Cronbach’s alpha was not measured for the SGPALS
because of the fact that there is only one question, and not for the questions regarding being in
nature due to a limited number of questions. The internal consistency of KEDS, RSES and
MSPSS is presented in Table 3.
Table 3
Internal consistency
Instrument Cronbach’s α
KEDS .84
RSES .90
MSPSS- whole scale .93
MSPSS- Friends .94
MSPSS- Family .92
MSPSS- Significant others .92
To test the reliability of the questions concerning being in nature, the non-parametric
Spearman’s correlation was used. The correlation between the questions “How often do you
spend time in a nature?” and “How many hours per week do you spend in nature?” was r=.65,
p<.01, which can be considered acceptable reliability. The two questions are to a great extent
measuring the same concept.
Correlations
Pearson’s correlation was used to investigate associations between exhaustion and
social support, self-esteem, being in nature, gender and physical activity. Since some of the
factors violated the basic assumptions Spearman’s correlations were tested too, but there were
no clear differences, so Pearson’s correlations are reported below. To reduce the risk of Type
I errors a Bonferroni correction was made (.1/36=.0028). The correlations are significant at
p≤.0028. Significant correlations were found between exhaustion and all the other factors
except for being in nature and social support from significant others, although there were
tendencies for those factors too; r=-.13, p=.039 and r=-.16, p=.01 respectively. The strongest
correlation was found between exhaustion and self-esteem (r=-.52, p<.001), indicating a large
association. Gender was coded as 0=women, 1=men. This means that the correlation between
KEDS and gender (r=-.21*) shows that women are more likely to have high scores on KEDS.
The correlation between gender and RSES (r=.21*) means that men have higher rates on
RSES. Correlations between the different factors are shown in Table 4.
29
Table 4
Correlations between exhaustion, being in nature, physical activity, gender, self-esteem,
social support-whole scale, social support from significant others, social support from family
and social support from friends.
Variables KEDS BiN SGPALS Gender RSES MSPSS SS-
SO
SS-
Fam
SS-
Fri
KEDS - -.13 -.20* -.21* -.52* -.32* -.16 -.26* -.35*
BiN -
.21
-.20*
0
.09
.19*
0
.19
.20*
-
.10
SGPALS -
.04
,
.13
.13
0
.04
.17
0
.10
Gender -
,
.21*
-.12
-
-.19*
-.05
-
-.06
RSES -
.43*
,
.21*
.45*
,
.38*
MSPSS -
,
.80*
.85*
,
.83*
SS-SO -
.52*
,
.52*
SS-Fam -
,
.56*
SS-Fri -
*p≤.0028
KEDS=Karolinska Exhaustion Disorder Scale, BiN=Being in Nature, SGPALS=Saltin
Grimby Physcial Activity Level Scale, RSES=Rosenberg Self-esteem Scale,
MSPSS=Multidimensional Scale of Perceived Social Support, SS-Fri=Social Support from
Friends, SS-Fam=Social Support from Family, SS-SO=Social Support from Significant other.
Physical activity and exhaustion
A one way independent ANOVA was used to test whether there were any differences
in exhaustion rates depending on the level of physical activity. This was done to find the most
suitable way to dichotomize physical activity for the regression analysis. The sedentary group
consisted of only 11 participants, so that group was included in the “light physical activity”
group, now called “sedentary to light physical activity”. The results showed a significant
difference in exhaustion in the three physical activity groups: F(2,25)=5.31, p=.006, partial
η2=.04. Tukey’s post hoc test showed that the vigorous physical activity group (M=11.43,
SD=7.88) rated significantly lower levels of exhaustion compared to the “medium physical
activity” group (M=15.19, SD=7.46) (p<.05) and the “sedentary to light physical activity”
group (M=15.88, SD=8.01) (p<.01). There were no significant differences between the
“medium physical activity” group and the “sedentary to light physical activity” group. Figure
2 shows the scores on KEDS for the different physical activity groups.
30
Figure 2. Scores on KEDS for the different physical activity groups. 1= sedentary to low
physical activity, 2= medium physical activity, 3=vigorous physical activity.
Multiple regression analysis
A multiple regression analysis was done to predict exhaustion from self-esteem, social
support, gender, physical activity and being in nature. Preliminary analyses were performed to
test that the assumptions of multiple regression analysis was fulfilled. To increase the
generalizability of the results a decent sample size is needed (Pallant, 2013). Tabachnick and
Fidell (2013) suggest that the needed sample size can be calculated through the formula N>50
+8m where m is the number of independent variables in the analyses. In this analysis there are
7 independent variables which means that N=106 would be an acceptable sample size. The
number of participants of the study is 253 which clearly exceed an acceptable sample size.
Another criterion for using a multiple regression analysis is lack of multicollinearity; high
correlations (r ≥ .9) between the independent variables (Pallant, 2013). Multicollinearity was
not found. Two outliers (scores above or below 3 standard deviations from mean) were
excluded from the regression analysis.

31
The assumptions of normality and linearity were violated for the MSPSS-scale.
Therefore the MSPSS scales were dichotomized to groups of low and high social support.
Physical activity was also dichotomized to the alternatives “sedentary to medium physical
activity”, and “vigorous physical activity”, based on the significant differences between the
vigorous physical activity group and the other groups, which was found in the ANOVA.
There were linear associations between the other predictor- and dependent variables, as shown
by the correlations as well as scatterplots. The residuals were normally distributed and the
assumption of homoscedasticity was also fulfilled.
The regression analysis showed significant results, F(7,244)=18.28, p<.001. The
variables could explain 33% of the variance in exhaustion (R2=.33).
The strongest predictor was self-esteem, β=-.45, t=-7.59, p<.001. Other significant predictors
were social support from friends, β=-.15, t=-2.46, p=.014, gender, β=-.13, t=-2.27, p=.024,
and physical activity, β=-.12, t=-2.26, p=.025. Social support from significant others was not
significant as a predictor, however there was a tendency, β=-.11, t=-1.86, p=.065. Being in
nature and social support from family were not significant as predictors of exhaustion either.
Table 5 shows the values of the regression analysis.
Table 5
Multiple regression analysis
Variable b SE b β p
Constant 38.05 2.57 .000
Self-esteem -.66 .09 -.45*** .000
Gender -2.37 1.05 -.13* .024
Physical Activity -2.52 1.12 -.12* .025
Social Support-Friends -2.28 .93 -.15* .014
Social Support- Significant other -1.78 .96 -.11 .064
Social Support- Family -1.62 1.01 -.10 .108
Being in Nature -.74 .51 -.08 .153
*p<.05, **p<.01, ***p<.001. Adjusted R2=.33
b=Unstandardized coefficient , SE b= Standard error of measurement, β=
Standardized coefficient
Social support from family was significantly negatively correlated with exhaustion
(r=-.26, p<.001), however, it was not a significant predictor of exhaustion in the regression
analysis. Social support from significant others was not significant in the correlation analysis
(r=-.16, p=.01) or the regression analysis (β=-.11, p=.065), while support from friends was
significant in both the correlation analysis and the regression analysis. All three factors were
significantly correlated with self-esteem, however the correlation between social support from
family and self-esteem (r=.45, p<.001) was the strongest. Because of that pattern a partial

32
correlation between social support from family and exhaustion, with self-esteem as a control
was done. The correlation was not significant (r=-.04).
Discussion
The purpose of the study was to investigate how common exhaustion was among
students at Lund University, as well as to what extent the factors self-esteem, social support,
gender, physical activity and being in nature could predict exhaustion.
The results show that 33% of the participants in the current study have exhaustion
scores above cutoff, which is higher than in some other studies (Atalayin et al., 2015; Gilson
de Cavalcante et al., 2016; Norlund et al., 2010). Fares et al. (2016) and Mazurkiewicz et al.
(2012) however, found that the level of exhaustion among university students was as high as
75% and 71% respectively and Cecil et al. (2014) found that 55% had exhaustion scores
above cutoff. The current study uses KEDS as a measurement of exhaustion, while many
other studies have used different versions of the MBI. That could be an explanation of the
differences; however the results of the other studies differ as well. The studies are done in
different countries and with different populations which could also explain the differences in
results. The type of educations of the student populations may also differ, as well as the time
of the administration of the questionnaires. The survey of the current thesis was administrated
during a period which is not associated with a higher workload than normal (the end of
January 2017 to the end of February 2017), which means that the exhaustion levels could be
even higher during a period of exams or during the end of a semester.
37% of women and 14% of men have exhaustion scores above cutoff, which shows
that signs of exhaustion are more common among women, in accordance with some previous
results (Anitei et al., 2015; Canivet et al., 2010; Dahlin et al., 2007). There is a significant
difference in the ratings of exhaustion between men and women, with a medium effect size,
indicating that there are considerable gender differences. The results are contradictory to the
results found in the meta-analysis by Purvanova and Muros (2010), who found that there are
no clear gender differences when it comes to levels of exhaustion. However, they also found
that the results of studies are inconsistent, with some showing higher levels of exhaustion for
women, while some show higher levels of exhaustion for men.
Self-esteem, social support from friends, gender and physical activity are significant
predictors of exhaustion. Self-esteem is clearly the strongest predictor, while the other three
predictors have lower and similar β-values, which suggest that the other factors are not as
33
strong predictors. Being in nature and social support from family and significant others are
not significant predictors, although there are tendencies, especially for the latter factor. The
explained variance of the predictors of exhaustion is 33%, which is a relatively low figure.
However, it is higher than the explained variance found by Olwage and Mostert (2014) in
their study on self-esteem, self-efficacy, career decision making difficulties and social support
as predictors of burnout and engagement among university students (R2 between .01 and .15
for the different regression models). Bonafé et al. (2014) found an explained variance of
R2=.37 for the predictors social support and demographic variables on burnout, which is
similar to the explained variance found in the current thesis. The results point to the
complexity of the concept exhaustion, and suggest that there are many factors that play an
important role in predicting exhaustion. There are associations between burnout and
personality (Chieh-Heng, & Shu-Rung, 2016), self-efficacy (Wang, Liu, & Wang, 2015),
social activities (Fares et al., 2016) and career-decision making difficulties (Olwage &
Mostert, 2014), suggesting that there are many factors apart from the ones studied in the
current thesis, that are associated with exhaustion.
The effort-reward imbalance model states that there ought to be a balance between
effort and reward; otherwise strain occurs (Siegrist, 1996). The high levels of exhaustion
among university students might be a result of an imbalance between effort and reward. The
rewards that students get for their efforts are grades, possibly encouragement from teachers,
and perhaps better chances of getting a job. The latter is a delayed reward which makes it
possible that it is not even perceived as a reward, but rather as a worry. Not all students get
the other rewards either, and are still putting down a lot of effort on their studies, which would
lead to an effort-reward imbalance. It is possible that students with less academic resources
such as intelligence, study techniques and support put down a lot of effort and getting few
rewards, which would result in an effort-reward imbalance and psychological strain, perhaps
in the form of exhaustion.
It is reasonable to believe that the amount of job control that students experience
differ, both due to the differences in educations and individual factors. Some educations might
increase the feeling of control through well-planned schedules and clear curriculums, while
other educations may decrease the feeling of control through a lack of structure. It is also
possible that individual factors affect the experience of control. Students with high self-
esteem might experience greater control than students with low self-esteem, because of a
greater trust in themselves. Students with a high perceived social support might also feel more
in control than students with low social support.

34
The results of the study can also be understood in light of the conservation of
resources theory. Self-esteem, social support and physical activity can be seen as resources
that protect the individual through enhancing better coping strategies, which decreases the risk
of experiencing burnout. The significant correlation between social support and self-esteem,
which could be explained by the conservation of resources theory, as a loss in one of the
resources could have resulted in a loss of the other, which together could have affected
exhaustion levels.
Self-esteem. Self-esteem is the strongest predictor of exhaustion (β=-.45, p<.001).
Although the strongest predictor the β-value is relatively low, indicating restrictions in the
predictive value. However, the correlation found between self-esteem and exhaustion is r=-
.52, p<.001, which is slightly higher than the correlations found by Rosse et al. (1991). They
found correlations of r=-.45 (hospital workers) r=-.37 (police officers) between self-esteem
and burnout. The difference might be owing to the differences of the samples. It is possible
that self-esteem plays a more important role in exhaustion among university students than in a
sample consisting of police officers and hospital workers. Rosse et al. also used RSES to
measure self-esteem which means that the difference in results cannot be explained by
different measurements of self-esteem. However, Rosse et al. used MBI as a measure of
burnout, while the current study used KEDS to measure exhaustion, which might be an
explanation for the differences.
There are different explanations for the association between self-esteem and
exhaustion. It is possible that a low self-esteem increases the risk of experiencing exhaustion,
and that a high self-esteem acts as a protector. It is also possible that experiencing exhaustion
leads to a reduction in self-esteem. Moreover, the effort-reward imbalance model suggests
that self-esteem can be seen as a reward of efforts. High rewards have been associated with
lower levels of burnout (Lee et al., 2012) which could be an explanation for the association
between self-esteem and exhaustion found in the current thesis.
Another explanation is that a third variable is responsible for the association. For
example, low performance could affect both the self-esteem and risk of experiencing
exhaustion. Low performance has been associated with exhaustion (Maslach & Leiter, 2008)
in previous research. Self-efficacy is another concept related to exhaustion. Research has
shown that self-esteem and self-efficacy are associated with each other (Afari et al., 2012),
and self-efficacy has been found to be a predictor of burnout (Olwage & Mostert, 2014).
Therefore, self-efficacy could have a role in explaining the association between self-esteem
and exhaustion too.

35
Rosse et al. (1991) suggested that people with low self-esteem often experience
problems in relationships, which would make them more vulnerable to burnout. There was a
correlation of r=.43, p<.001 between social support and self-esteem in the current study,
which indicates a moderate association between the two factors. It is possible that people with
low self-esteem have difficulties with social interaction, which affects the perception of social
support and increases the risk for exhaustion. It is also possible, however, that having low
levels of social support results in a low self-esteem, which would increase the risk for
exhaustion. Afari et al. (2012) suggested that self-esteem is developed within a social context,
which could explain the association between social support and self-esteem found in this
study. Evaluating oneself negatively in comparison to other group members might lead to
difficulties in having mutual relationships, which would decrease the perception of social
support.
Gender. Gender is a significant predictor of burnout, with a β-value of -.13, which
means that being a woman significantly predicts higher levels of exhaustion. Significant
differences between men’s and women’s ratings of exhaustion are also found in the t-test,
which contradicts the results of the meta-analysis by Purvanova and Muros (2010). However,
many previous studies have found differences between men and women’s ratings of
exhaustion (Anitei et al., 2015; Canivet et al., 2010; Dahlin et al., 2007; Fares et al., 2016;
Glise, 2014; Norlund et al., 2010). In most studies women have had higher levels of
exhaustion, which is in accordance with the results of the thesis. The results are important as
they point to an inequality between men and women, and the results create a need for further
research to be able to understand the mechanisms of and the reasons for the difference.
The predictive value of gender on exhaustion is limited. The gender differences found
in the t-test have a medium effect size, which indicates clear differences. The low β-value
found in the regression analysis can possibly be explained by the fact that self-esteem and
gender were correlated (r=.21, p<.0028), meaning that men have higher levels of self-esteem
than women. Self-esteem had the highest predictive value in the regression analysis which
means that although gender had a unique predictive value, parts of the gender differences in
exhaustion levels could be explained by the lower self-esteem of women.
According to SBU (2014) levels of exhaustion tend to be similar for men and women
in similar work situations. It is reasonable to believe that the study situations of men and
women at universities are similar, which makes the results of the present study particularly
interesting, since there were clear differences between the exhaustion levels of men and
36
women. Further research focusing on the underlying mechanisms of the gender differences in
exhaustion is needed.
Based on the social expectations of women and men, they are probably interpreted and
treated in different ways, which could lead to different levels of exhaustion. Social
expectations of how men and women should behave might have unconsciously affected the
ratings of exhaustion levels. It is possible that men and women interpret the questions in the
survey in different ways which could have led to differences in exhaustion levels. Research
has shown that social expectations of gender and gender-typical tasks affect performance
(Sharps, & Price, 1994). Expectations and norms concerning gender may not only affect
performance, but also the experience of effort, demands, control and rewards. A greater
imbalance between demand and control as well as effort and reward among women, could
explain a higher psychological strain or exhaustion, as described in the demand-control-
support theory and effort-reward model. To understand the specific mechanisms of how social
expectations influence gender differences in exhaustion, further research is needed.
The results of Canivet et al.’s. (2010) research highlight the differences in strain
experienced by men and women. They found that women spent more time on household
chores, had higher job strain and more often had a low socioeconomic status than men. The
results indicate that women experience higher strain both in work and in other areas of life,
which could explain the higher levels of exhaustion reported by women in the current thesis.
Although a student population differs from the working population used in Canivet et al.’s
study, as many as 37% lived with a partner, and 26% lived with friends or in a corridor, which
makes it reasonable to think that similar gender inequalities in distribution of household
chores may be present in a student population too.
Social support. Social support from friends is a significant predictor of exhaustion
while social support from family and significant others are not significant. This is
contradictory to the results of Olwage and Mostert (2014), who found that support from
family was associated with less risk for burnout. Yildirim (2008), however, found that support
from friends and colleges were significant predictors of burnout, but not social support from
family and significant others, which is in accordance with the results of the current thesis. The
sample consisted of university students, and it is possible that many of the students have
moved away from their families to a new city, which could explain why social support from
friends and significant others plays a more important role than family.
Despite the significant correlation between social support from family and exhaustion,
support from family was not significant as a predictor in the regression analysis. Social
37
support from family was positively associated with self-esteem (r=.45), which is a possible
explanation for why social support from family was not a significant predictor of exhaustion.
The partial correlation between social support from family and exhaustion, controlling for
self-esteem, yielded a non-significant low correlation (r=-.04). A possible explanation for that
is that self-esteem affects both exhaustion levels and perceived support from family. Another
option is that self-esteem mediates the relationship between social support from family and
exhaustion, so that support from family affects exhaustion levels entirely via its effect on self-
esteem. According to Karasek and Theorell (1990), social support enhances a positive self-
identity, which supports the latter explanation of self-esteem as a mediator of social support
from family and exhaustion.
Social support from significant others is neither significant in the correlational
analysis nor in the regression analysis, however there are clear tendencies in both the
analyses. One possible explanation for the insignificant results is that the concept “significant
others” is more ambiguous than “friends” and “family”. Significant other could be interpreted
as a partner, a very close friend or a sibling; however, as there already were questions
regarding social support from friends and family, significant other might have been
interpreted as a partner. Participants who did not have a partner might have had difficulties
with answering that question, which could have affected the results.
Based on the results it is not possible to deduce whether or not there is a main effect or
buffering effect of social support on exhaustion. According to the results of Mitchell et al.
(2014) perceived social support acted as a stress buffer. The experienced availability of
support affected the reappraisal of stress. According to Alarcon et al. (2011) social support
enhances coping, which affects the perception of exhaustion. The perception of having social
support from friends might lead to appraising stressful events differently, or to enhance
coping strategies that reduce feelings of stress. In this study social support is associated with
self-esteem (r=.43, p<.0028). It is possible that a high level of social support increases self-
esteem, which results in lower levels of exhaustion, however due to the limitations of the
cross-sectional design it is not possible to make any causal inferences.
In this study social support from friends has the highest predictive value when it
comes to exhaustion, however, that might differ in another culture. Ekbäck et al. (2013)
discuss the possible cultural differences when it comes to social support. Different aspects of
social support may be valued differently in diverse cultures. Individualist and collectivist
cultures may also differ in the perceived need for social support, because of different social
38
expectations and norms. This is a threat to the external validity as the generalizability of the
results to other cultures is limited.
Physical activity. Physical activity is also a significant predictor of exhaustion. The
one way ANOVA show that the group of participants who engaged in vigorous physical
activity has significantly lower exhaustion rates than the participants who were sedentary or
engaged in light to medium physical activity. There is no significant difference between the
medium physical activity group and the sedentary to light physical activity group. The results
suggest that physical activity could have an effect on exhaustion, only when engaging in
vigorous physical activity (high intensity training several times a week). Another possibility is
that students who are exhausted don’t engage in vigorous physical activity as often as students
with low exhaustion levels. The results differ from Jonsdottir et al’s (2010) who found that
there were differences in stress, burnout, depression and anxiety between those who were
sedentary and the other three groups.
The number of participants who rated “sedentary” in the current sample is very low
(N=11, 4%). The percentage is lower than in Sjøl et al. (2003), who reported that between 25-
30% were sedentary. Because of the low N-number the sedentary group was combined with
the low physical activity group. When looking at the descriptive statistics of the different
physical activity groups, a tendency to a difference between the sedentary and the other
groups is seen, however due to the low N-number it was not possible to find any reliable
results. In a larger sample it might have been possible to detect differences in exhaustion
levels between sedentary participants and the low-medium physical activity-participants.
Being in nature. Being in nature is not a significant predictor of exhaustion. The
correlation with exhaustion is not significant either (r=-.13, p=.039), however there was a
tendency. Previous research (Ewert et al., 2016; Nielsen & Hansen, 2007) has discussed the
difficulty in separating physical activity and being in nature, due to the fact that people often
engage in physical activity when outside. 62% of the participants in the present study reported
that the primary reason for being in nature was to go for a walk or a run. Therefore there is a
possible overlap between being in nature and physical activity. The correlation between being
in nature and physical activity (r=.22, p=.003) was not significant after the Bonferroni
correction, but there was a clear tendency which to some extent could explain why being in
nature was not significant as a predictor.
The measurement of being in nature can also be criticized. There was no available
scale measuring to what extent individuals spend time in nature, so questions were created for
this study. Although they were pilot-tested the sample was small and no statistical analyses
39
were done on the pilot. One of the four questions was hard to use in the statistical analyses
due to very similar responses. The author also got feedback through e-mail from two
participants who found it hard to answer how many hours per week they spent in nature.
Therefore the construct validity of the questions concerning being in nature can be
questioned. Moreover, the questions may not have been specific enough and the questions
may not cover the concept being in nature in a representative way. The question used in the
analyses concerned how much time was spent in nature, but it is possible that other factors
than time in nature are more important to capture the concept. It may be the quality of the
time spent in nature or the way nature affects attention restoration as proposed by Kaplan
(1995). Defining nature is also difficult. The current thesis included both non-man-made and
man-made environments in the definition of nature. However, the effect of spending time in
different types of natural environments may differ. It is possible that a more differentiated
instrument would capture the concept of being in nature in a better way.
The associations found between exhaustion and natural environments in previous
studies (Ewert et al., 2016; Maas et al., 2009; Sahlin et al., 2014; Ulrich et al., 1991) have not
used self-reports, which is an explanation for the different results of the present study. Using a
different measurement than self-reports might yield different results in a study of being in
nature as a predictor of exhaustion, for example, measuring the size and proximity of green
areas is a possibility.
Strengths and limitations
Studies regarding predictors of exhaustion among university students in Sweden are
scarce, which makes the current study important. It contributes through expanding the
knowledge about what factors are associated with exhaustion. Although the study is cross-
sectional and no causal inferences can be made the results contribute to the understanding of
exhaustion, which makes it possible for other researchers to develop the understanding for
exhaustion through longitudinal studies. The study also contributes through partly
corroborating results of previous research.
The fact that as many as 33% of the students have exhaustion scores above cutoff also
suggests that exhaustion among students ought to be taken seriously and that prevention and
good treatment should be prioritized.
Design and procedure. The study used a cross-sectional design, which makes it
possible to find associations between factors, although one cannot make causal inferences. It
is not possible to say in which direction the associations go. It is possible that the predictors
are causes of higher exhaustion rates. However, it is also possible that the high levels of
40
exhaustion can affect people’s self-esteem, the degree of physical activity and the degree of
social support that they are able to perceive. To be able to investigate the direction of the
association longitudinal designs are needed.
When it comes to the design of the survey no opportunity to write comments was
included. The author got feedback through e-mail that an opportunity to write comments
would be appropriate. All the questions of the survey were also made mandatory, which
eliminated non-response analyses. All answers could be used, which is a strength. On the
other hand, it is possible that participants started to fill in the survey, but stopped when
difficult questions emerged, or when they found no suitable response alternatives. Therefore
there is probably an unknown drop-out number, which is a threat to the internal validity.
A strength of using surveys to collect data is that it is an effective way of getting a
large number of participants, which increases the power and statistical validity. A limitation
with using survey for data collection is the risk of social desirability. However, using a web-
survey protects the anonymity of the participants, which might lower the risk for social
desirable answers. Using self-reports to measure a construct always increases the risk of
participants interpreting the answers differently, which could affect the results. Therefore the
internal validity is threatened, as alternative explanations of the results cannot be excluded.
More than interpreting the questions differently, participants might experience difficulties
with knowing what to answer. For example, reporting how many hours per week one spends
in nature or how physically active one is, might be difficult to report reliably. Therefore, the
construct validity is also threatened.
Moreover the sampling method can be criticized. To increase the external as well as
the internal validity a random sampling would have been appropriate. However, because of
the difficulties with using a random sampling a convenience sample was used, which limits
the generalizability of the results. The survey was distributed through social media as well as
e-mails to students of different educations. Some administrators were willing to send out
information to students, while others were not. This resulted in an imbalance of participants
from different faculties. The fact that social media was used to distribute the survey has also
affected what participants were included in the sample as the social network of the author was
limited and biased.
The survey was pilot tested, however the pilot was very small and no statistical
analyses were done. A more elaborate pilot with statistical analyses could have improved the
survey, since some questions concerning being nature were impossible to use because of a
lack of variance in answers. This was not done because of the limited time.
41
Participants. The sample consisted of 253 participants which could be considered an
appropriate sample size. Apart from yielding high power and increasing the statistical validity
a high number of participants also lower the risk of type II errors. Owing to the high number
of participants it was possible to make comparisons between subgroups, such as between the
different physical activity groups. 73% of the participants were women, which is a higher
percentage of women than at Lund University. In 2012-2013 54% of the students at Lund
University were women (Statistiska Centralbyrån, [SCB], 2014). 83% of the participants
studied at the Medicine or Social Science’s Faculties, which could be an explanation for the
high number of women. The biased sample threatens the internal validity as factors other than
those intended to measure could have affected the results. The uneven distribution of men and
women also threatens the external validity, because of the difference between the sample and
the population. Including participants from Lund University only, also limits the
generalizability of the results to other student populations, although it strengthens the internal
validity, as confounding variables are limited. Admission to Lund University requires higher
grades than admission to some other universities (Universitets- och högskolerådet, [UHR],
2017). It is possible that students at Lund University, in general, are high performers, which
might be a distinguishing characteristic of the population. That could have affected the results
of the study, and it limits the generalizability of the results. Despite the differences between
students at Lund University and students at other universities, it is possible to some extent, to
generalize the results to other student populations.
It is likely that some people are more prone to answer surveys than others. Perhaps
individuals who are overcommitted, as described by Siegrist et al. (2014), have problems
saying no and tend to answer surveys more often. It is also possible that those individuals are
at greater risk of experiencing exhaustion, for the same reason. More women than men filled
in the survey, which could be explained by a variety of factors. However, as women also had
higher levels of exhaustion than men, there might be some common factor that make women
more prone to filling out surveys more often, as well as experiencing higher levels of
exhaustion. Therefore, the level of exhaustion found in the study might be higher than in the
population. However, it is also possible that the individuals who suffer from very high levels
of exhaustion were not able to fill in the survey at all, which could have affected the results in
the opposite direction.
Instruments. KEDS, MSPSS and RSES show high reliability and the instruments
have been widely used, which yields good construct validity. However, the responses on
MSPSS were not normally distributed, which impaired the statistical analyses. There was a
negatively skewed distribution with a ceiling effect, similar to the distribution found by
42
Ekbäck et al. (2013). The ceiling effect is a threat to statistical and internal validity, which is a
limitation of the instrument. Social desirability might be an explanation for the uneven
distribution.
SGPALS is an instrument that has been used in many previous studies. It was not
possible to test the reliability of the instrument. It is an old instrument that has been modified
through the years to improve the response alternatives. Although a well-tested instrument,
SGPALS was not an optimal instrument for a regression analysis. The instrument consists of
one question with four alternatives, and the answers were recoded into two alternatives in the
regression analysis. A scale with more questions would have fitted the purpose better.
Because of a lack of other available instruments SGPALS was used. Another limitation of
SGPALS is that it was created for a sample of male athletes, which is a threat to the internal
validity and the construct validity, as the sample consisted of a majority of women. It is
possible that women and men exercise in different ways and that the examples of the physical
activity levels of the scale to a greater extent apply to men. However, the alternatives have
been modified through the years, which probably has led to an adaptation of the instrument to
fit both men and women.
It was not possible to find any instrument measuring the extent to which one spends
time in nature, so four questions were created. One of the questions was difficult to use in the
analyses (Do you like spending time in nature?), and only one question was used in the
regression analysis (“How often do you spend time in nature?”). To test the reliability of that
question Spearman’s correlation was used to investigate the association with the question
“How many hours per week do you spend in a nature?”. The correlation was r=.65 which
indicates acceptable reliability of the questions. Although a decent r-value the construct
validity would have increased by using a well-tested scale or other reliable measures of time
spent in nature.
No convergent or divergent measures were used, because of an attempt to keep the
survey short enough to get a large number of participants. However, it would have increased
the reliability, construct and statistical validity to include several measures of the factors. For
example a measure of stress levels or general mental health could have been used as a
complement to KEDS.
When it comes to the demographic questions not all of them were used. One question
concerning how many semesters the participants had studied was included in the survey.
Because of a problem with the format of the answers, no analyses based on that question were
done. This is a limitation as research by Rudman and Gustavsson (2012) showed that burnout
43
levels increased throughout the education. Possible differences between students in different
periods of their educations might have been missed.
Practical implications and suggestions for further research
Practical implications of the results are that social life of students plays an important
role, not only in enjoying life, but in possibly reducing levels of exhaustion. Students should
therefore be encouraged to engage in social activities. Making physical activity available for
students as well as working with increasing self-esteem is also a suggestion based on the
results. The gender differences found in the study is an eye-opener to the inequality between
men and women, which clarifies the need for a greater understanding of the relationship.
The results indicate that the factors self-esteem, social support from friends, physical
activity and gender are important factors in understanding exhaustion among university
students. The current study corroborates the results of previous research; however the group
university students ought to be studied more in relation to exhaustion, to understand what are
risk factors and protecting factors for exhaustion. Longitudinal studies are needed, to
investigate the directions of the associations. To improve the reliability and validity the use of
instruments could be adjusted to better fit a regression analysis. A scale concerning being in
nature could be developed, and studies that use other types of measures are also welcome. It
would also be more appropriate to use another type of instrument for measuring physical
activity, for example, the International Physical Activity Questionnaire (Craig et al., 2013).
Another suggestion for further research is to study interaction effects to understand
more of how the factors are associated with each other and with exhaustion. That would
contribute to a more complex understanding of the mechanisms of how exhaustion is
developed.
When it comes to the gender differences found in the study, it would be of interest to
study what mechanisms cause the differences in exhaustion. Are the demands on women
higher than on men? Are there other types of expectations from society on women? Do
women in a student population take responsibility for household chores to a greater extent
than men? It is also of importance to keep researching whether or not there are any gender
differences in exhaustion levels. Although this study found significantly higher exhaustion
levels among women the evidence of previous research is contradictory, which makes it
important to continue investigating the topic.
44
Conclusion
The findings of the current study acknowledge that exhaustion is a major problem
among university students, as one third of the participants in the study reported high levels of
exhaustion. The results also show that self-esteem, gender, physical activity and social
support from friends are significant predictors of exhaustion. Self-esteem is clearly the factor
with the highest predictive value. Women have higher exhaustion levels than men, which both
corroborates and contradicts previous findings. In total the factors explain 33% of the
variance in exhaustion, which suggests that the factors investigated in the study play a
significant role in the understanding of how exhaustion is developed or prevented. However,
the results also indicate that exhaustion is complex and that there must be a variety of factors
associated with exhaustion.

45
References
Aires, N., Selmer, R., & Thelle, D. (2003). The validity of self-reported leisure time physical
activity, and its relationship to serum cholesterol, blood pressure and body mass
index. A population based study of 332,182 men and women aged 40-42 years.
European Journal of Epidemiology, 18(6), 479-485.
Afari, E., Ward, G., & Khine, M.S. (2012). Global self-esteem and self-efficacy correlates:
Relation of academic achievement and self-esteem among Emirati students.
International Education Studies, 5(2), 49-57.
Alarcon, G.M., Edwards, J.M., & Menke, L.E. (2011). Student burnout and engagement: A
test of the conservation of resource theory. Journal of Psychology, 145(3), 211-227.
doi:10.1080/00223980.2011.555432
Andersson, E. (1993). The perspective of student nurses and their perceptions of professional
nursing during the nurse training programme. Journal of Advanced Nursing, 18(5),
808-815. doi:10.1046/j.1365-2648.1993.18050808.x
Ang, R.P., Neubronner, M., Oh, S., & Leong, V. (2006). Dimensionality of Rosenberg's self-
esteem scale among normal-technical stream students in Singapore. Current
Psychology: A Journal for Diverse Perspectives on Diverse Psychological Issues,
25(2), 120-131. doi:10.1007/s12144-006-1007-3
Anitei, M., Chraif, M., & Ionită, E. (2015). Gender differences in workload and self-perceived
burnout in a multinational company from Bucharest. Procedia – Social and
Behavioral Sciences, 187, 733-737. doi:10.1016/j.sbspro.2015.03.155
Armon, G. (2014). Type D personality and job burnout: The moderating role of physical
activity. Personality and Individual Differences, 58, 112-115.
doi:10.1016/j.paid.2013.10.020
Atalayin, C., Balkis, M., Tezel, H., Onal, B., & Kayrak, G. (2015). The prevalence and
consequences of burnout on a group of preclinical dental students. European Journal
of Dentistry, 9(3), 356-363. doi:10.4103/1305-7456.163227

46
Bakker, A., Killmer, C., Siegrist, J., & Schaufeli, W. (2000). Effort-reward imbalance and
burnout among nurses. Journal of Advanced Nursing, 31(4), 884-891.
doi:10.1046/j.1365-2648.2000.01361.
Besèr, A., Sorjonen, K., Wahlberg, K., Peterson, U., Nygren, Å., & Åsberg, M. (2014).
Construction and evaluation of a self-rating scale for stress-induced exhaustion
disorder, the Karolinska exhaustion disorder scale. Scandinavian Journal of
Psychology, 55(1), 72-82. doi:10.1111/sjop.12088
Bonafé, F.S.S., Maroco, J., & Campos, J.A.D.B. (2014). Predictors of burnout syndrome in
dentistry students. Psychology, Community & Health, 3(3), 120–130.
doi:10.5964/pch.v3i3.86
Canivet, C., Östergren, P.O., Lindeberg, S.I. (2010). Conflict between the work and family
domains and exhaustion among vocationally active men and women. Social Science
and Medicine, 70, 1237–1245. doi:10.1016/j.socscimed.2009.12.029
Cecil, J., McHale, C., Hart, J., & Laidlaw, A. (2014). Behavior and burnout in medical
students. Medical Education Online, 19, 1-9. doi:10.3402/meo.v19.25209
Cherniss, C., 1980. Professional burnout in human service organizations. New York:
Praeger Press.
Chieh-Heng, K., & Shu-Rung, L. (2016). Exploring the effects of personality traits on hotel
employee job burnout. International Journal of Organizational Innovation, 9(2), 52-
59.
Cobb, S. (1976). Social support as a moderator of life stress. Psychosomatic Medicine, 38,
300-314.
Cohen, S. (2004). Social relationships and health. American Psychologist, 59, 676-684.
Cohen, S., & Wills, T.A. (1985). Stress, social support, and the buffering hypothesis.
Psychological Bulletin, 98(2), 310-357. doi:10.1037/0033-2909.98.2.310
Collison, D., Banbury, S., & Lusher, J. (2016). Relationships between age, sex, self-esteem
and attitudes towards alcohol use amongst university students. Journal of Alcohol &
Drug Education, 60(2), 16-34.

47
Craig, C., Marshall, A., Sjöström, M., Ekelund, U., Yngve, A., Bauman, A., & ... Oja, P.
(2003). International physical activity questionnaire: 12-Country reliability and
validity. Medicine and Science in Sports and Exercise, 35(8), 1381-1395.
doi:10.1249/01.MSS.0000078924.61453.FB
Dahlin, M., Joneborg, N., & Runeson, B. (2007). Performance-based self-esteem and
burnout in a cross-sectional study of medical student. Medical Teacher, 29(1), 43-48.
doi:10.1080/01421590601175309
Dahlin, M., & Runeson, B. (2007). Burnout and psychiatric morbidity among medical
students entering clinical training: a three year prospective questionnaire and
interview-based study. BMC Medical Education, 7(6). doi:10.1186/1472-6920-7-6
Deci, E.L. & Ryan, R.M. (1995). Human autonomy, the basis for true self-esteem. In M. H.
Kernis (Ed.), Efficacy, agency, and self-esteem (pp.31-49). New York: Plenum Press.
Ekbäck, M., Lindberg, M., Benzein, E., & Årestedt, K. (2013). The Swedish version of
the multidimensional scale of perceived social support (MSPSS) - a psychometric
evaluation study in women with hirsutism and nursing students. Health and Quality of
Life Outcomes, 11(1), 168. doi:10.1186/1477-7525-11-168
Ewert, A., Klaunig, J., Zemin, W., & Yun, C. (2016). Reducing Levels of Stress through
Natural Environments: Take a Park; Not a Pill. International Journal of Health,
Wellness & Society, 6(1), 35-43.
Fares, J., Saadeddin, Z., Al Tabosh, H., Aridi, H., El Mouhayyar, C., Koleilat, M.K., & … El
Asmar, K. (2016). Extracurricular activities associated with stress and burnout in
preclinical medical students. Journal of Epidemiology and Global Health, 6(3), 177-
185. doi:10.1016/j.jegh.2015.10.003
Feuerhahn, N., Kühnel, J., & Kudielka, B.M. (2012). Interaction effects of effort–reward
imbalance and overcommitment on emotional exhaustion and job performance.
International Journal of Stress Management, 19(2), 105-131. doi:10.1037/a0028338
Fleming, J.S., & Courtney, B.E. (1984). The dimensionality of self-esteem: II. Hierarchical
facet model for revised measurement scales. Journal of Personality and Social
Psychology, 46(2), 404-421. doi:10.1037/0022-3514.46.2.404
48
Försäkringskassan. (2015). Sjukskrivningar 60 dagar eller längre. En beskrivning av
sjukskrivna åren 1999-2014 efter kön, ålder, arbetsmarknadsstatus, yrke,
sjukskrivningslängd och diagnospanorama. Stockholm: Socialförsäkringsrapport
2015:1. Retrieved 24 February, 2017, from
https://www.forsakringskassan.se/wps/wcm/connect/d7d4b78e-39fa-4c2f-bed9-
ade979b5ff23/socialforsakringsrapport_2015_1.pdf?MOD=AJPERES
Gilson de Cavalcante, A., Hercílio Ribeiro de, S., Paulo César de, A., Beatriz de Cavalcante,
A., & Gilson Holanda, A. (2016). The prevalence of burnout syndrome in medical
students. Archives of Clinical Psychiatry, 43(1), 6-10. doi:10.1590/0101-
60830000000072
Glise, K. (2014). Exhaustion disorder: identification, characterisation and course of illness
(Doctoral thesis). Gothenburg: University of Gothenburg, Department of Internal
Medicine.
Gray-Little, B., Williams, V.L., & Hancock, T.D. (1997). An item response theory analysis of
the Rosenberg self-esteem scale. Personality and Social Psychology Bulletin,
23(5), 443-451. doi:10.1177/0146167297235001
Grimby, G., Börjesson, M., Jonsdottir, I.H., Schnohr, P., Thelle, D.S., & Saltin, B. (2015).
The 'Saltin-Grimby Physical Activity Level Scale' and its application to health
research. Scandinavian Journal of Medicine & Science in Sports, 25(4), 119-125.
doi:10.1111/sms.12611
Hansen, A., & Sundberg, C.J. (2014). Hälsa på recept: träna smartare, må bättre, lev längre.
[Health on a medical prescription: Workout smarter, feel better, live longer.]
Stockholm: Fitnessförlaget.
Henwood, T., Tuckett, A., & Turner, C. (2012). What makes a healthier nurse, workplace or
leisure physical activity? Informed by the Australian and New Zealand e-cohort study.
Journal of Clinical Nursing, 21, 1746-1754. doi:10.1111/j.1365-2702.2011.03994.x
Hobfoll, S. (1989). Conservation of resources: A new attempt at conceptualizing stress.
American Psychologist, 44(3), 513-524. doi:10.1037/0003-066X.44.3.513
Jonsdottir, I.H., & Folkow, B. (2013). Stressfysiologiska mekanismer i evolutionärt och
historiskt perspektiv. In B. Arnetz, & R. Ekman. (Eds.), Stress: gen, individ och

49
samhälle. [Stress, genes, the individual and the society], (3d ed, pp.15-24).
Stockholm: Liber AB.
Jonsdottir, I.H., Rödjer, L., Hadzibajramovic, E., Börjesson, M., & Ahlborg, J.G. (2010). A
prospective study of leisure-time physical activity and mental health in Swedish health
care workers and social insurance officers. Preventive Medicine, 51, 373-377.
doi:10.1016/j.ypmed.2010.07.019
Kalat, J.W. (2013). Biological psychology. (11th
ed.). Belmont: Wadsworth Cengage
Learning.
Kaplan, S. (1995). The restorative benefits of nature: toward an integrative framework.
Journal of Environmental Psychology, 15(3), 169-182. doi:10.1016/0272-
4944(95)90001-2
Karasek, R.A. (1979). Job demands, job decision latitude and mental strain: Implications for
job redesign. Administrative Science Quarterly, (2), 285-308.
Karasek, R., & Theorell, T. (1990). Healthy work: Stress, productivity, and the reconstruction
of working life. New York: Basic Books.
Khezerlou, E. (2017). Professional self-esteem as a predictor of teacher burnout across Iranian
and Turkish EFL teachers. Iranian Journal of Language Teaching Research, 5(1),
113-130.
Kim, Y., Park, Y., Allegrante, J., Marks, R., Ok, H., Cho, K., & Garber, C. (2012).
Relationship between physical activity and general mental health. Preventive
Medicine, 55(5), 458-463. doi:10.1016/j.ypmed.2012.08.021
Law, D.W. (2007). Exhaustion in university students and the effect of coursework
involvement. Journal of American College Health, 55(4), 239-245.
Lee, J., Puig, A., & Lee, S. (2012). The effect of the demand control and effort reward
imbalance models on the academic burnout of Korean adolescents. Asia Pacific
Journal of Education, 32(1), 113-123.
Lin, S., & Huang, Y. (2014). Life stress and academic burnout. Active Learning in Higher
Education, 15(1), 77-90.

50
Lindwall, M., Gerber, M., Jonsdottir, I., Börjesson, M., & Ahlborg Jr, G. (2014). The
relationships of change in physical activity with change in depression, anxiety, and
burnout: A longitudinal study of Swedish healthcare workers. Health Psychology,
33(11), 1309-1318. doi:10.1037/a0034402
Maas, J., Verheij, R., de Vries, S., Spreeuwenberg, P., Schellevis, F., & Groenewegen, P.
(2009). Morbidity is related to a green living environment. Journal of Epidemiology
& Community Health, 63(12), 967-973. doi:10.1136/jech.2008.079038
Magnusson, E., & Marecek, J. (2010). Genus och kultur i psykologi. Teorier och tillämpning.
[Gender and culture in psychology. Theories and applications] Stockholm: Natur och
Kultur.
Maslach, C., & Jackson, S.E. (1981). The measurement of experienced burnout. Journal of
Occupational Behaviour, 2(2), 99-113.
Maslach, C., & Leiter, M.P. (2008). Early predictors of job burnout and engagement. Journal
of Applied Psychology, 93(3), 498-512.
Mazurkiewicz, R., Korenstein, D., Fallar, R., & Ripp, J. (2012). The prevalence and
correlations of medical student burnout in the pre-clinical years: A cross-sectional
study. Psychology, Health & Medicine, 17(2), 188-195.
doi:10.1080/13548506.2011.597770
McEwen, B.S. (1998). Stress, adaptation, and disease: Allostasis and allostatic load. Annals
of the New York Academy of Sciences, 840(1), 33-44.
Meurer, S.T., Luft, C.B., Benedetti, T.R., & Mazo, G.Z. (2012). Construct validity and
reliability in Rosenberg’s self-esteem scale for Brazilian older adults who practice
physical activities. Motricidade, 8(4), 5-15. doi:10.6063/motricidade.8(4).1548
Mitchell, I., Evans, L., Rees, T., & Hardy, L. (2014). Stressors, social support, and tests of
the buffering hypothesis: Effects on psychological responses of injured athletes.
British Journal of Health Psychology, 19(3), 486-508.
Nielsen, T.S., & Hansen, K.B. (2007). Do green areas affect health? Results from a Danish
survey on the use of green areas and health indicators. Health and Place, 13, 839-
850. doi:10.1016/j.healthplace.2007.02.001

51
Norlund, S., Reuterwall, C., Höög, J., Lindahl, B., Janlert, U., & Slunga, L.B. (2010).
Burnout, working conditions and gender: results from the northern Sweden MONICA
study. BMC Public Health. 10(1), 326. doi:10.1186/1471-2458-10-326
Ohuruogu, B. (2016). The contributions of physical activity and fitness to optimal health
and wellness. Journal of Education and Practice, 7(20), 123-128.
Olwage, D., & Mostert, K. (2014). Predictors of student burnout and engagement among
university students. Journal of Psychology in Africa, 24(4), 342-350.
Onuoha, U. C., & Akintola, A. A. (2016). Gender differences in self-reported academic
burnout among undergraduates. Gender & Behaviour, 14(1), 7110-7116.
Pallant, J. (2013). SPSS survival manual: A step by step guide to data analysis using the
SPSS program (5th rev. Ed.). New York: McGraw-Hill Publications.
Physical activity. In World Health Organization. (2017). Retrieved 9 March, 2017, from
http://www.who.int/topics/physical_activity/en/
Pines, A. (1987). Marriage burnout: A new conceptual framework for working with couples.
Psychotherapy in Private Practice, 5, 31– 43.
Pluut, H., Curseu, P., & Ilies, R. (2015). Social and study related stressors and resources
among university entrants: Effects on well-being and academic performance. Learning
and Individual Differences, 37, 262-268.
Purvanova, R.K., & Muros, J.P. (2010). Gender differences in burnout: A meta-analysis.
Journal of Vocational Behavior, 77, 168-185. doi:10.1016/j.jvb.2010.04.006
Rasmussen, V., Turnell, A., Butow, P., Juraskova, I., Kirsten, L., Wiener, L., & Grassi, L.
(2016). Burnout among psychosocial oncologists: An application and extension of the
effort-reward imbalance model. Psycho-Oncology, 25(2), 194-202.
doi:10.1002/pon.3902
Rosenberg, M. (1965). Society and the adolescent self-image. Princeton, NJ: Princeton
University Press.
Rosse, G.J., Boss, W.R., Johnson, E.A., & Crown, F.D. (1991). Conceptualizing the role of
self-esteem in the burnout process. Group Organization Management, 16(4), 428-451.
52
Rudman, A. & Gustavsson, J.P. (2012). Burnout during nursing education predicts lower
occupational preparedness and future clinical performance: A longitudinal study.
International Journal of Nursing Studies, 49(8), 988-1001.
doi:10.1016/j.ijnurstu.2012.03.010
Sahlin, E., Ahlborg Jr, G., Matuszczyk, J.V., & Grahn, P. (2014). Nature-based stress
management course for individuals at risk of adverse health effects from work-
related stress—effects on stress related symptoms, workability and sick leave.
International Journal of Environmental Research and Public Health, 11, 6586-6611.
Saltin, B., & Grimby, G. (1968). Physiological analysis of middle-aged and old former
athletes. Comparison with still active athletes of the same ages. Circulation, 38, 1104-
1115.
Selye, H. (1951). The general-adaptation-syndrome. Annual Review of Medicine, 2(1), 327.
doi:10.1146/annurev.me.02.020151.001551
Seyedfatemi, N., Tafreshi, M., & Hagani, H. (2007). Experienced stressors and coping
strategies among Iranian nursing students. BMC Nursing, 6, doi:10.1186/1472-6955-
6-11
Shadish, W.R., Cook, T.D., & Campbell, D.T. (2002). Experimental and quasi-
experimental designs for generalized causal inference. Boston, MA: Houghton
Mifflin.
Sharps, M.J., & Price, J.L. (1994). Spatial cognition and gender: Instructional and stimulus
influences on mental image rotation performance. Psychology of Women Quarterly,
18(3), 413-25. doi:10.1111/j.1471-6402.1994.tb00464.x
Siegrist, J. (1996). Adverse health effects of high-effort/low-reward conditions. Journal of
Occupational Health Psychology, 1(1), 27-41. doi:10.1037/1076-8998.1.1.27
Siegrist, J., Starke, D., Chandola, T., Godin, I., Marmot, M., Niedhammer, I., & Peter, R.
(2004). The measurement of effort–reward imbalance at work: European comparisons.
Social Science & Medicine, 58, 1483-1499. doi:10.1016/S0277-9536(03)00351-4
53
Sjøl, A., Thomsen, K., Schroll, M., & Andersen, L. (2003). Secular trends in acute myocardial
infarction in relation to physical activity in the general Danish population.
Scandinavian Journal of Medicine & Science in Sports, 13(4), 224-230.
Socialstyrelsen. (2003). Utmattningssyndrom: Stressrelaterad psykisk ohälsa. [Exhaustion
disorder: Stress related mental health] Stockholm: Bjurner & Bruno; 2003. Retrieved
12 December, 2016, from http://www.socialstyrelsen.se/publikationer2003/2003-123-
18
Statens beredning för medicinsk utvärdering. (2014). Arbetsmiljöns betydelse för symtom på
depression och utmattningssyndrom: En systematisk litteraturöversikt. [The work
environment’s importance for symptoms of depression and exhaustion disorder]
(SBU, 2014:223). Stockholm. Retreived 30 March, 2017, from
http://www.sbu.se/contentassets/800ad7aecf9146c795d3a89c7a957048/
arbetsmiljo_depression_2014.pdf
Statistiska centralbyrån. (2014). Universitet och högskolor: Studenter och examinerade på
grundnivå och avancerad nivå 2012/13. [Higher Education. Students and graduates at
first and second cycle studies 2012/13] (SCB, UF 20, SM 1401). Retreived 30 March,
2017, from
http://www.scb.se/Statistik/UF/UF0205/2012L13D/UF0205_2012L13D_SM_UF20S
M1401.pdf
Sveriges förenade studentkårer. (2014). #heltsjukt: en undersökning om studenthälsornas syn
på sjukförsäkringssystemet för studenter. [#totallysick: a study of Sweden’s
associations of student unions’ view on the sick leave system for students] (SFS,
2014). Retrieved 28 March, 2017, from:
http://www.sfs.se/sites/default/files/pt1_3_1314_helt_sjukt_en_undersokning_om_stu
denthalsornas_syn_pa_sjukforsakringssystemet_for_studenter_2014_0.pdf
Tabachnick, B.G. & Fidell, L.S. (2013). Using multivariate statistics (6th
ed). Boston:
Pearson Education.
Toker, S., & Biron, M. (2012). Job burnout and depression: Unraveling their temporal
relationship and considering the role of physical activity. Journal of Applied
Psychology, 97(3), 699-710. doi:10.1037/a0026914
Ulrich, R.S., Simons, R.F., Losito, B.D., Fiorito, E., Miles, M.A., & Zelson, M. (1991).
Stress recovery during exposure to natural and urban environments. Journal of
Environmental Psychology, 11(3), 201-230. doi:10.1016/S0272-4944(05)80184-7

54
Universitets- och högskolerådet. (2017). Antagningsstatistik [Statistics of admission] (UHR,
2017). Retrieved 5 April, 2017, from https://statistik.uhr.se/.
Vetenskapsrådet. (2002). Forskningsetiska principer inom humanistisk-samhällsvetenskaplig
forskning. [Ethical principles in humanistic and social scientific research] Retrieved
2016-12-12 from:
http://www.gu.se/digitalAssets/1268/1268494_forskningsetiska_principer_2002.pdf
Wang, S., Liu, Y., & Wang, L. (2015). Nurse burnout: Personal and environmental factors as
predictors. International Journal of Nursing Practice, 21(1), 78-86.
doi:10.1111/ijn.12216
World Health Organization. (2001). The world health report 2001: Mental health: new
understanding, new hope. Geneva: WHO; 2001. Retreieved 15 January, 2017, from
http://www.who.int/whr/2001/en/whr01_en.pdf
Yang, H., & Farn, C.K. (2005). An investigation of the factors affecting MIS student burnout
in technical-vocational college. Computers in Human Behavior, 21, 917-932.
doi:10.1016/j.chb.2004.03.001
Yildirim, İ. (2008). Relationships between burnout, sources of social support and
sociodemographic variables. Social Behavior & Personality: An International
Journal, 36(5), 603-616. doi:10.2224/sbp.2008.36.5.603
Zimet, G.D., Dahlem, N.W., Zimet, S.G., & Farley, G.K. (1988). The multidimensional scale
of perceived social support. Journal of Personality Assessment, 52(1), 30-41.
doi:10.1207/s15327752jpa5201_2
Zimet, G. D., Powell, S. S., Farley, G. K., Werkman, S., & Berkoff, K. A. (1990).
Psychometric characteristics of the multidimensional scale of perceived social
support. Journal of Personality Assessment, 55(3-4), 610-617.
doi:10.1080/00223891.1990.9674095
Åsberg, M., Grape, T., Krakau, I., Nygren, Å., Rodhe, M., Wahlberg, A. & Währborg, P.
(2010). Stress som orsak till psykisk ohälsa. [Stress as a cause of poor mental health]
Läkartidningen, 107(19-20), 1307-1310. Retrieved 2017-04-04 from
http://ww2.lakartidningen.se/store/articlepdf/1/14349/lkt1019s1307_1310.pdf

55
Appendix
56

57

58

59
60

61

62