exemplar for internal achievement standard physics level 1 · pdf fileexemplar for internal...
TRANSCRIPT

Exemplar for internal assessment resource Physics for Achievement Standard 90935
© NZQA 2015
Exemplar for Internal Achievement Standard
Physics Level 1
This exemplar supports assessment against:
Achievement Standard 90935
Carry out a practical physics investigation that leads to a linear
mathematical relationship, with direction
An annotated exemplar is an extract of student evidence, with a commentary, to explain
key aspects of the standard. It assists teachers to make assessment judgements at the
grade boundaries.
New Zealand Qualifications Authority
To support internal assessment

Exemplar for internal assessment resource Physics for Achievement Standard 90935
© NZQA 2015
Grade Boundary: Low Excellence
1. For Excellence, the student needs to carry out a comprehensive practical physics investigation, with direction, that leads to a linear mathematical relationship. This involves writing a discussion that validates the conclusion. Each discussion point could relate to one of the bullet points listed in Explanatory Note (EN) 7. The student has shown a link between the investigation findings and physics ideas (1) and has attempted to describe the link between the gradient of the graph and the spring constant of the spring (2). The student has attempted to justify the control of the spring (3), and has attempted to account for an unexpected outcome of the processing of the results (4). For a more secure Excellence, the student could have:
recognised that the spring constant can be calculated from the gradient only if the gradient is expressed in SI units
considered what happened during the experiment to cause the unexpected outcome
described the effect of the unexpected outcome on the validity of the conclusion.

Student 1: Low Excellence
Aim: To find the mathematical relationship between the length of the stretched spring and the mass that is causing it to stretch.
Which variable will be changed? (This is the independent variable): The mass (m) How will the independent variable be changed?
Adding 20g masses to the mass holder on the spring each time Give a suitable range of values for this variable.
20g, 40g, 60g, 80g and 100g. Which variable will be measured? (This is the dependent variable)
The length of the stretched spring. How will the dependent variable be measured or observed?
Using a ruler to measure the length in cms.
Other variables that need to be controlled to make your results more accurate
Variable How this variable will be controlled
Same spring The same spring will be used throughout the experiment as different springs can stretch differently.
Same ruler Use the same ruler and measure in the same place from the top of the spring to the bottom of the spring each time.
Same masses Use the same masses as there may be some variation in the actual weight of the slotted masses.
How will you ensure that your results are reliable?
By repeating the experiment at least 3 times and averaging the results. Looking at the ruler at eye level to reduce parallax error.
Results Mass (g) Length in cms average 0 20 20 20 20 20 23 24 22 23 40 32 35 33 33.3 60 40 41 39 40 80 51 50 50 50.3 100 60 58 59 59
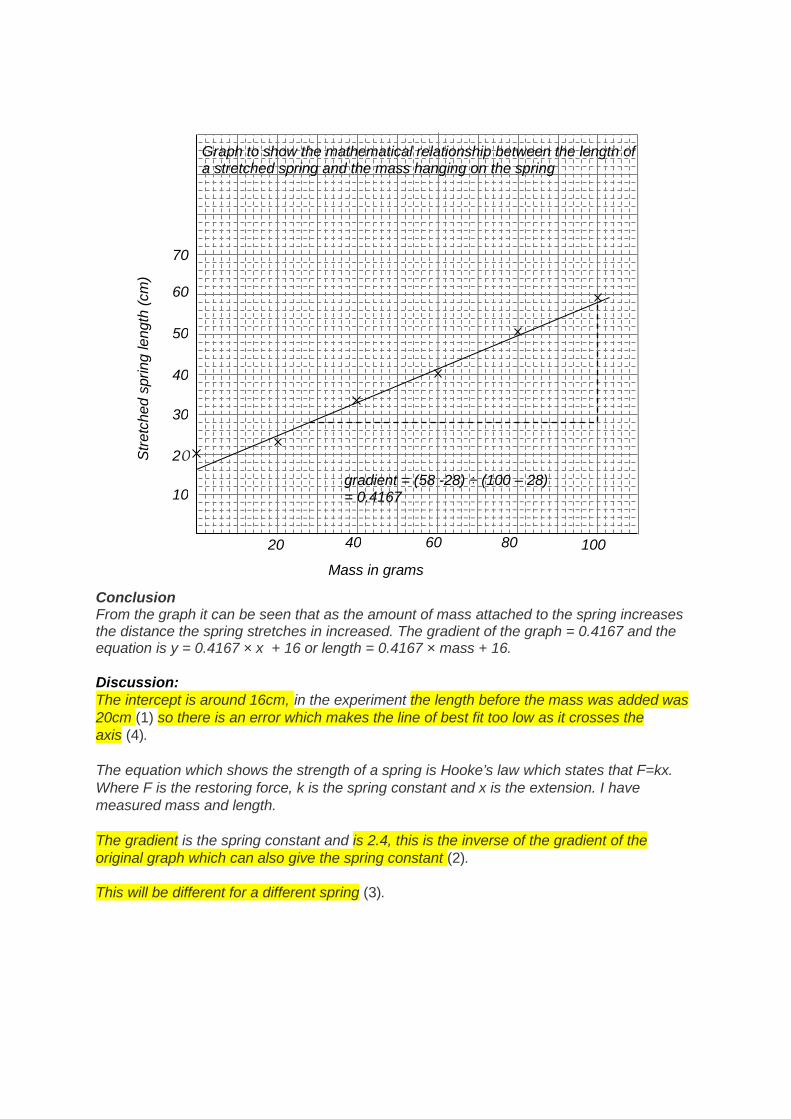
Conclusion From the graph it can be seen that as the amount of mass attached to the spring increases the distance the spring stretches in increased. The gradient of the graph = 0.4167 and the equation is y = 0.4167 × x + 16 or length = 0.4167 × mass + 16. Discussion: The intercept is around 16cm, in the experiment the length before the mass was added was 20cm (1) so there is an error which makes the line of best fit too low as it crosses the axis (4). The equation which shows the strength of a spring is Hooke’s law which states that F=kx. Where F is the restoring force, k is the spring constant and x is the extension. I have measured mass and length. The gradient is the spring constant and is 2.4, this is the inverse of the gradient of the original graph which can also give the spring constant (2). This will be different for a different spring (3).
10
30
40
50
Stre
tche
d sp
ring
leng
th (c
m)
20 40 60 80 100
Mass in grams
Graph to show the mathematical relationship between the length of a stretched spring and the mass hanging on the spring
20
60
70
gradient = (58 -28) ÷ (100 – 28) = 0.4167

Exemplar for internal assessment resource Physics for Achievement Standard 90935
© NZQA 2015
Grade Boundary: High Merit
2. For Merit the student needs to carry out an in-depth practical physics investigation, with direction, that leads to a linear mathematical relationship. This involves controlling significant variables, using appropriate accuracy improving techniques, drawing a valid linear graph and stating the equation of the relationship. Refer to Explanatory Note (EN) 6. The student has controlled the significant variable by using the same spring (1), improved accuracy by repeating and averaging the measurements (2), drawn an appropriate linear graph (3) and stated the equation of the relationship in terms of the variables being investigated (4). The student has also explained the need to control a significant variable (7). To reach Excellence, the student would need to write a discussion that validates the conclusion. Each discussion point could relate to one of the bullet points listed in EN7. The student could have:
described how a method to improve accuracy had been particular to this measurement rather than just making a general statement (5)
explained why the choice of limits to the range of independent variables was chosen in terms of gathering accurate data (6)
linked the increased gravitational force on the mass to an increased force on the spring causing an increase in spring length (8)
related the difficulty that has been described to an issue that could not be remedied by using appropriate experimental technique (9).

Student 2: High Merit
Aim: Find the mathematical relationship between the stretched length of a spring and the mass that is causing it to stretch.
Which variable will be changed? (This is the independent variable): The mass How will the independent variable be changed?
By adding another 20 g mass to the end of the spring. Give a suitable range of values for this variable.
20 g, 40 g, 60 g, 80 g, 100 g Which variable will be measured? (This is the dependent variable)
The stretched length the spring. How will the dependent variable be measured or observed?
Using a 30 cm ruler, turned sideways, at eye level, as close as possible to the spring.
Other variables that need to be controlled to make your results more accurate
Variable How this variable will be controlled
Spring Use the same spring every time (1) because different springs stretch at different rates.
How will you ensure that your results are reliable?
Repeat the experiment until you have done it 3 times
Notes from your trials.
The spring wouldn’t stay still.
Results Mass (g) Length in cms average (2) 0 14 14 14 14 20 24 23 23 23 40 33 32 33 33 60 42 43 41 42 80 51 51 51 51 100 59 59 58 59
In my experiment I used a few accuracy improving techniques to make my experiment more effective. These include getting down to eye level and increasing the proximity between myself and the spring. I did this to give a clearer reading and increase focus on my measurements. I also brought the ruler as close as possible to the spring in order to reduce room for error. (5) The range of values I used went from 20 g to 100 g increasing in 20 g amounts. This makes for even results and makes it easier to find a pattern. The lower limit was 20 g because that was the weight of the mass holder and the upper limit was 100 g because that gave me 5 results and stretched the spring a reasonable amount. (6) I used the same spring each time because different springs stretch at different rates. (7)
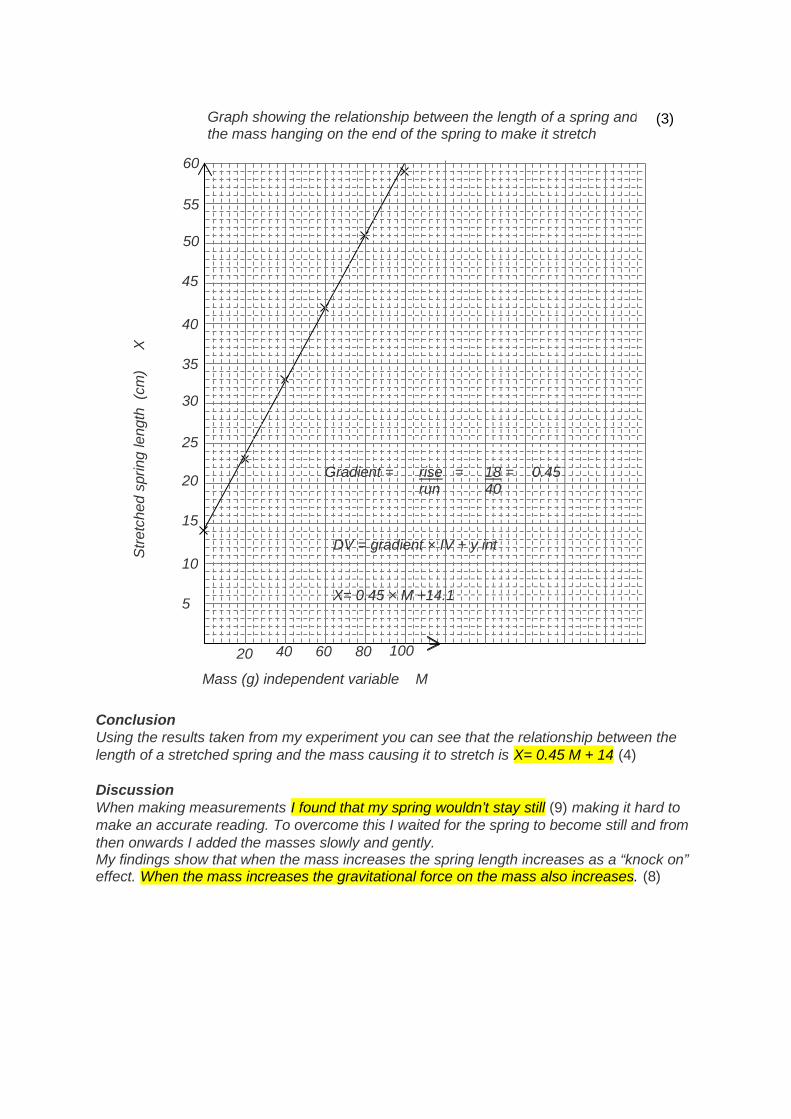
Conclusion Using the results taken from my experiment you can see that the relationship between the length of a stretched spring and the mass causing it to stretch is X= 0.45 M + 14 (4) Discussion When making measurements I found that my spring wouldn’t stay still (9) making it hard to make an accurate reading. To overcome this I waited for the spring to become still and from then onwards I added the masses slowly and gently. My findings show that when the mass increases the spring length increases as a “knock on” effect. When the mass increases the gravitational force on the mass also increases. (8)
Mass (g) independent variable M
5
15
20
25
20 40 60 80 100
Graph showing the relationship between the length of a spring and the mass hanging on the end of the spring to make it stretch
10
30
35
40
45
50
55
60
Gradient = rise = 18 = 0.45 run 40
DV = gradient × IV + y int X= 0.45 × M +14.1
Stre
tche
d sp
ring
leng
th (
cm)
X
(3)
Exemplar for internal assessment resource Physics for Achievement Standard 90935
© NZQA 2015
Grade Boundary: Low Merit
3. For Merit the student needs to carry out an in-depth practical physics investigation, with direction, that leads to a linear mathematical relationship. This involves controlling significant variables, using appropriate accuracy improving techniques, drawing a valid linear graph and stating the equation of the relationship. Refer to Explanatory Note (EN) 6. The student has attempted to identify significant variables as needing to be controlled (1). The accuracy of measurements has been increased by repeating and averaging (2), and a valid linear graph has been drawn (3). Although the equation of the relationship has been written in terms of x and y rather than the variable names (4), since x and y have both been clearly defined the equation is sufficient (5). For a more secure Merit, the student could have indicated that the variables other than the spring that have been listed as needing control are not significant variables. The student could have also drawn a graph line that had a better fit to the plotted points.

Student 3: Low Merit
Aim: is to find the mathematical relationship between the stretched length of a spring and the mass that is hung on the end to make it stretch.
Which variable will be changed? (This is the independent variable)
The mass of the string. How will the independent variable be changed?
By putting on or taking off the small weights. Give a suitable range of values for this variable.
Just the spring, 100g, 200g, 300g, 400g & 500g Which variable will be measured? (This is the dependent variable)
How long the spring is. How will the dependent variable be measured or observed?
I will measure the stretch with a metre ruler.
Other variables that need to be controlled to make your results more accurate
Variable How this variable will be controlled
The spring (1) I will use the same spring
The weights (1) I will use the same weights.
The metre ruler (1) I will use the same ruler each time.
The surface (1) I will use the same surface each time.
How will you ensure that your results are reliable?
I will do each test 3 times
Notes from your trials. Spring 25.5 cm long.
Results Test 1 Test2 Test3 average (2)
0 g 25.5 cm 25.5 cm 25.5 cm 25.5 cm 100 g 30 cm 30 cm 30 cm 30 cm 200 g 34.5 34.5 cm 34.5 cm 34. 5 cm300 g 38 cm 38 cm 38 cm 38 cm 400 g 43 cm 43 cm 43 cm 43 cm 500 g 48.5 cm 48.5 cm 48.5 cm 48.5 cm

Conclusion The length of the spring gets longer as more weight is applied. The equation of the line is y = 0.046 x + 25.5 (4) because that is how the data in this particular one works but if using a different one it would be different (y = spring length, x = weight on spring) (5).
10
30
40
50
leng
th (c
m)
100 200 300 400 500
weight (gm)
The length of a spring with a weight on
23
500
gradient of line: rise over run 23 ÷ 500 = 0.046
equation of line: Y = 0.046x + 25.5
20
x
y
(3)
Exemplar for internal assessment resource Physics for Achievement Standard 90935
© NZQA 2015
Grade Boundary: High Achieved
4. For Achieved the student needs to carry out a practical physics investigation, with direction, that leads to a linear mathematical relationship. This involves developing a method, collecting data with units, drawing an appropriate graph and identifying the trend. Refer to Explanatory Note (EN) 5. The student has listed the correct experimental procedures (1) and has collected reasonable measurements for the extended lengths of the spring (2). A linear graph based on the data, with correctly constructed axes, has been drawn (3). The trend has been correctly identified by the student (4). The student has increased the accuracy of measurements by repeating and averaging the measured lengths (6). The equation of the relationship has been written in terms of the variable names and an attempt has been made to include the gradient of the graph in the relationship (7). To reach Merit the student would need to carry out an in-depth practical physics investigation, with direction, that leads to a linear mathematical relationship. Refer to EN6. The student would also need to:
identify the variables that could have had a significant effect on the results and describe how to control these (5)
correctly calculate the value of the gradient used in the relationship equation (7).
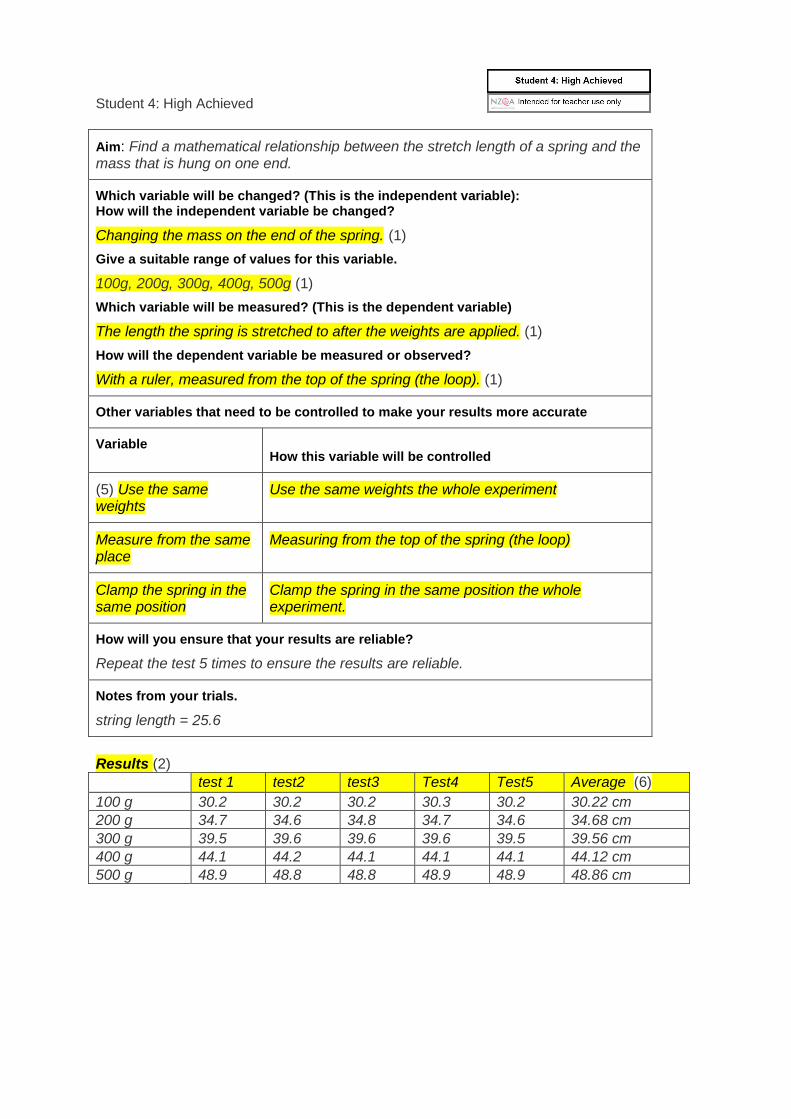
Student 4: High Achieved
Aim: Find a mathematical relationship between the stretch length of a spring and the mass that is hung on one end.
Which variable will be changed? (This is the independent variable): How will the independent variable be changed?
Changing the mass on the end of the spring. (1) Give a suitable range of values for this variable.
100g, 200g, 300g, 400g, 500g (1) Which variable will be measured? (This is the dependent variable)
The length the spring is stretched to after the weights are applied. (1) How will the dependent variable be measured or observed?
With a ruler, measured from the top of the spring (the loop). (1)
Other variables that need to be controlled to make your results more accurate
Variable How this variable will be controlled
(5) Use the same weights
Use the same weights the whole experiment
Measure from the same place
Measuring from the top of the spring (the loop)
Clamp the spring in the same position
Clamp the spring in the same position the whole experiment.
How will you ensure that your results are reliable?
Repeat the test 5 times to ensure the results are reliable.
Notes from your trials.
string length = 25.6
Results (2) test 1 test2 test3 Test4 Test5 Average (6)
100 g 30.2 30.2 30.2 30.3 30.2 30.22 cm 200 g 34.7 34.6 34.8 34.7 34.6 34.68 cm 300 g 39.5 39.6 39.6 39.6 39.5 39.56 cm 400 g 44.1 44.2 44.1 44.1 44.1 44.12 cm 500 g 48.9 48.8 48.8 48.9 48.9 48.86 cm

Conclusion The more mass that is put on the end of the spring the longer the spring will go (4). The mathematical equation for this is y = 0.123x + 25, y = spring length, x = weight on spring (7).
5cm
15 cm
20 cm
25 cm
Spr
ing
leng
th
100g 200g 300g 400g 500g
weight on spring
Spring experiment
10cm
x
y
30 cm
35 cm
40 cm
45 cm
50 cm (3)

Exemplar for internal assessment resource Physics for Achievement Standard 90935
© NZQA 2015
Grade Boundary: Low Achieved
5. For Achieved the student needs to carry out a practical physics investigation, with direction, that leads to a linear mathematical relationship. This involves developing a method, collecting data with units, drawing an appropriate graph and identifying the trend. Refer to Explanatory Note (EN) 5. The student has listed appropriate experimental procedures (1) and has collected reasonable measurements for the extended lengths of the spring (2). An appropriate graph has been drawn, and an attempt has been made to plot points accurately (3). The student has made several attempts to show they have recognised that the required trend is that increased mass causes an increased spring length (4). For a more secure Achieved, the student could have plotted all points on the graph correctly. The student could also have written a conclusion that clearly links the processed data to the identified trend on the graph.
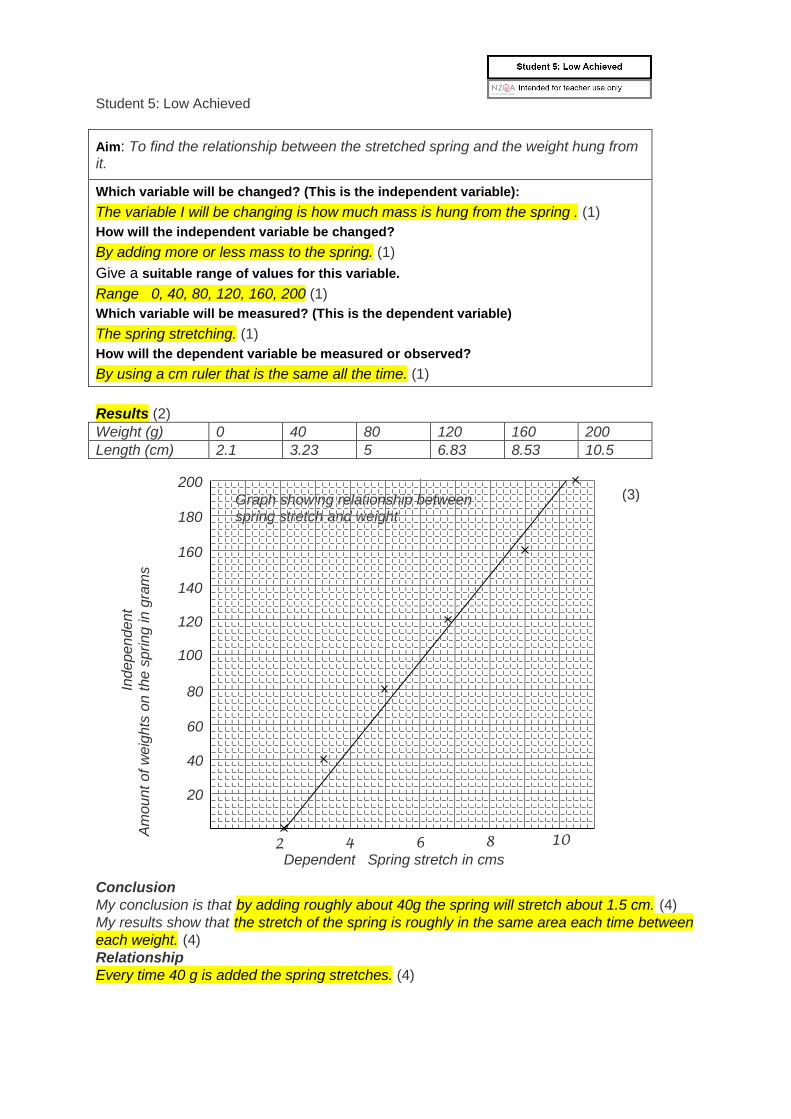
Student 5: Low Achieved
Aim: To find the relationship between the stretched spring and the weight hung from it.
Which variable will be changed? (This is the independent variable): The variable I will be changing is how much mass is hung from the spring . (1) How will the independent variable be changed? By adding more or less mass to the spring. (1) Give a suitable range of values for this variable. Range 0, 40, 80, 120, 160, 200 (1) Which variable will be measured? (This is the dependent variable) The spring stretching. (1) How will the dependent variable be measured or observed? By using a cm ruler that is the same all the time. (1)
Results (2) Weight (g) 0 40 80 120 160 200 Length (cm) 2.1 3.23 5 6.83 8.53 10.5
Conclusion My conclusion is that by adding roughly about 40g the spring will stretch about 1.5 cm. (4) My results show that the stretch of the spring is roughly in the same area each time between each weight. (4) Relationship Every time 40 g is added the spring stretches. (4)
20
60
80
100
Inde
pend
ent
Am
ount
of w
eigh
ts o
n th
e sp
ring
in g
ram
s
2 4 6 8 10 Dependent Spring stretch in cms
Graph showing relationship between spring stretch and weight
40
120
140
160
180
200 (3)
Exemplar for internal assessment resource Physics for Achievement Standard 90935
© NZQA 2015
Grade Boundary: High Not Achieved
6. For Achieved, the student needs to carry out a practical physics investigation, with direction, that leads to a linear mathematical relationship. This involves developing a method, collecting data with units, drawing an appropriate graph and identifying the trend. Refer to Explanatory Note (EN) 5. There is sufficient evidence that a suitable method has been developed (1). An attempt has been made to measure spring lengths for different masses (2). A linear graph with correctly plotted points has been drawn, and an attempt has been made to draw a line to show the trend (3). An attempt has been made to identify the trend (4). To reach Achieved, the student would need to measure values of the stretched spring length accurately. The line of best fit in the graph would need to be drawn to represent data appropriately, rather than just joining the first and last plotted points. The trend statement would need to state that the length of the spring increased as the mass increased.
Student 6: High Not Achieved
Aim: The mathematical relationship between the stretched length of a spring and the mass that is hung on each end.
Which variable will be changed? (This is the independent variable): The mass. (1) How will the independent variable be changed?
The weight on the spring. (1) Give a suitable range of values for this variable.
grams 20 to 200 (1) Which variable will be measured? (This is the dependent variable)
The length the spring (1) How will the dependent variable be measured or observed?
With a ruler (1)
Conclusion The spring stretched. (4)
5
15
20
25
leng
th (
depe
nden
t)
20 40 80 120
Mass (dependent)
length of the spring
10
30
35
60 100 140 160 180 200
(2) 0g = 2.2 cm 20g = 6 cm 40g = 19.5 cm 60g = 22.5 cm 80g = 24 cm 100g = 24 cm 120g = 24.5 cm 140g = 28 cm 160g = 32 cm 180g = 33 cm 200g = 35 cm
(3)