executive summary - wisconsin center for nursing · executive summary . ... has analyzed this data...
TRANSCRIPT


i
Executive Summary
In January, 2010, 77,553 registered nurses completed a mandatory survey in order to renew their RN licenses in Wisconsin. The Wisconsin Center for Nursing (WCN) under a mandate from the Wisconsin State Legislature, has analyzed this data in detail, resulting in this report, 2010 Wisconsin Registered Nurse Survey. Section I: Introduction The report begins with an explanation of the data management procedures. (Table 1.1). The total survey respondents number 77,553. We eliminated 6,097 RNs who live out of state and do not work in Wisconsin which leaves the number of RNs who live or work in Wisconsin at 71,456. Out of this number, 65,931 are valid responses after cleaning procedures outlined in the Introduction. Section II: State Data Key Findings
• The 57,673 RNs who work in Wisconsin are mostly white (95.5%), female (93.4%), and only speak English (95.2%).
• Most nurses who want to work are working (96%). • 95% of RNs educated in Wisconsin stay in Wisconsin • Half of all the nurses are employed in hospitals as their primary employer.
Recommendations:
1. Strengthen the focus on increasing diversity in nursing education programs. 2. An investment in nursing education by state policy makers would help alleviate
the impending shortage in Wisconsin. 3. Explore the factors that motivate nurses to remain in the workforce.
Section III: DHS Regional Data Key Findings
• A lack of diversity and lack of proficiency in language other than English exists across the state and across all regions.
• Registered Nurses across all regions have, on average, 15 years of experience as nurses and have spent a little over 70%of their careers providing direct patient care.
• The mean income for RNs is $56,787 across the state and ranges from $54,767 in the Northern Region to $60,795 in the Southern Region. If divided by specialty, the highest paid RNs are nurse anesthetists ($142,859) and the lowest paid are Community Health and Public Health Nurses which average $47,443.
• Educational preparation for nursing practice shows some regional variation. The number of Associate degree prepared nurses is highest in the Northern region (39.9%) and lowest in the Southeastern Region (27.8%). Exactly the opposite is true with regard to the number of baccalaureate prepared nurses which is highest in the Southeastern Region (41.7%) and lowest in the Northern Region (29.4%).
• The distribution of nurses with advanced degrees is higher in the Southern and Southeastern regions with the lower numbers in the Western and Northern regions.

ii
• Nurses were asked about future plans and their answers indicate that between 2010 and 2012, over 2,000 RNs will leave positions where they provide direct patient care. Almost 5,000 indicate they plan to decrease their hours spent providing direct patient care.
• Within nine years, over 15,000 nurses, or 33% of the RN workforce holding direct patient care positions will leave the workforce with retirement as the major reason for leaving. The second reason is job stress and third is physical demands of the job.
Recommendations: 1. Employers should utilize the experienced nursing workforce to provide mentoring
required by new graduates. 2. Investing in nursing education programs at the state level will be critical to
recruitment of nursing students to offset the number of nurses planning retirement in the near future.
3. Flexibility in course offerings in educational programs and flexibility in scheduling from employers is needed to support RNs achieving continuing education.
4. Current nursing education programs need to increase enrollments in their programs if feasible
5. Regions need to review the RN workforce in their areas and develop plans to address the impending shortages for their particular area
Section IV: Intergenerational Workforce Key Findings
• Across all groups, nurses gave “being personally rewarding” as the highest rating for why they chose nursing as a profession; employment was rated second and pay was third. Collegial relationships were identified by the fewest number of nurses in all groups.
• When analyzing why nurses work outside Wisconsin, Generation X, Baby boomers and the Silent Generation indicate family/personal reasons. For nurses in the Millennial group, the top factor was employment opportunities
• For RNs who work more than one job, pay was the top reason for the Millennial, Generation X, and Baby Boomer generations; the Silent Generation indicated that the reason was that the second job was personally rewarding
• The majority of nurses reporting intent to leave nursing came from the Baby Boomer and Silent Generation and indicated retirement as the reason. The Millennial group rated returning to school, relocation of self or spouse/partner and job stress. RNs from the Generation X group rated job stress and pay as the top reasons followed by relocation of self or spouse/partner.
Recommendations: 1. Strategies to retain nurses in direct patient care roles need to address motivational
factors for generational groups.
Section V: Advance Practice Nurses Key Findings
• Data that differ from the total RN population include a higher proficiency in a second language (7.9% vs. 4.5%), and a slightly lower rate of employment (91.6% vs. 96%).
• 64% report that they are working as an RN providing direct patient care.

iii
• 28.9% of APNs report they are currently not working in a role that requires them to be an APN.
• A total of 450 (out of 3,979) report that they are employed as nurse educators. An additional 1,624 report they would consider employment as a nurse educator within the next two years.
Recommendations: 1. Future surveys must be designed to capture complete data on all Wisconsin APNs. 2. Preliminary data on the supply of APNs in Wisconsin should be used to begin to
investigate whether there are sufficient APNs particularly in primary care areas to meet the demand for health care throughout the state.
Section VI: Workplace Injuries Key Findings
• 5.6% (3,681) reported that in the last five years, they had an injury that prevented them from working. Almost half of that number reported that the injury required accommodation under the American Disabilities Act.
• The median number of weeks that patient care duties were reduced was 2.0 and the median number of hours was 20 hours/week.
Recommendations: 1. Further work is needed to explore the impact of the rate of injury on the RN
workforce. Section VII: Emergency Preparedness Key Findings
• Less than 50% of the nurses completing the survey reported having completed any formal education or training in this area.
• Of those who received formal training, 90% reported that the training came through their employer.
• Less than 25% of the nurses completing the survey have participated in an emergency preparedness exercise in the past two years.
Recommendations: 1. Continued assessment is necessary to determine the readiness of the RN workforce to
support emergency preparedness in the state. 2. A comprehensive plan needs to be developed for expanding education and training of
the RN workforce related to emergency preparedness. Following the release of this report, WCN will use this and other data to make overall recommendations to the state legislature regarding the future need for nurses in Wisconsin.

iv
Table of Contents
Content Page Executive Summary i
I. Introduction 1 A. Data Management 1 B. Organization of Report 2
II. Overview of the State of Wisconsin Registered Nurse Workforce 4
A. Demographics of RN Workforce 4 B. Employment Patterns of RNs in Wisconsin 5 C. Educational Patterns of RNs in Wisconsin 8 D. Diversity of RNs in Wisconsin 9 E. Recommendations 11
III. Registered Nurse Workforce Analyzed by Wisconsin Department
12
A. Demographics of RN Workforce 14 B. Employment Status of RNs in Wisconsin 14 C. Patterns of Employment in Nursing 15 D. Patterns of Employment Outside of Nursing 17 E. Work Effort Patterns 17 F. Educational Preparation for Nursing Practice 23 G. Future Employment Plans 24 H. Future Educational Plans 26 I. Recommendations 27
IV. Intergenerational Workforce 28
A. Factors Influencing Entry into Nursing 28 B. Factors Influencing Employment Decisions 28 C. Recommendations 31
V. Advance Practice Nurses 32
A. Demographics of APNs 32 B. Description of APN Workforce 33 C. Employment Patterns 36 D. Educational Plans 39 E. Recommendations 39
VI. Work related injuries affecting employment 40
A. Recommendations 41
VII. Emergency Preparedness 42 A. Recommendations 42

1
I. Introduction
This report presents the findings from the 2010 Survey of Registered Nurses (RNs) in the state of Wisconsin. All RNs renewing their licenses to practice in Wisconsin were required by state statute (s. 106.30) to complete the survey. 77,553 RNs completed the survey either online (74,453) or on paper (3,100).
This analysis is sponsored by the Wisconsin Center for Nursing in partnership with the State of Wisconsin Department of Workforce Development (DWD). Three nurse researchers representing the PhD preparing nursing education programs in the state (Marquette University College of Nursing, University of Wisconsin – Madison School of Nursing, and University of Wisconsin – Milwaukee College of Nursing) and a statistician (University of Wisconsin – Madison College of Nursing) comprised the analysis team.
Because this is a study of the Wisconsin RN Workforce, the analyses in this report includes those Registered Nurses living and working in Wisconsin as well as nurses who maintain licensure in Wisconsin, though they are living outside of the state.
The study was reviewed by the Institutional Review Boards of the University of Wisconsin-Madison, University of Wisconsin-Milwaukee, and Marquette University. Each researcher and the statistician signed a confidentiality agreement with DWD that protected confidentiality and anonymity of respondents. The research team was given electronic access to the complete data set from DWD.
A. Data Management:
Data were electronically reviewed according to the following rules:
1. Data were eliminated from the survey analysis if the RN reported:
• Working greater than 84 hours per week at either primary or secondary position • Working greater than 100 hours per week in 2 positions • Missing 168 hours per week in injury • Greater than 90 years of age • Belonging to greater than five ethnic categories • Earning the first degree before the age of 16 or after 60 years of age • Providing direct care for 6 years before the first degree • Began working before age 16 or after 56 years (this parameter will be explored –
could be possible)
2. Or if the RN reported:
• Earning less than $7.50/hour at primary or secondary job • Earning greater than $300/hour at primary job • Earning greater than $200/hour second job
3. If salary was the outlier, the variable of salary was set to missing data, but the remaining data for that RN were retained in the analysis. If any of the other criteria listed

2
above were reported, the complete RN survey was deleted from the analysis. These rules resulted in conservative reporting parameters.
Table 1.1 summarizes the data set that was used for the analysis in this report.
Table 1.1 Data Remaining After Cleaning Procedures. Total Survey Respondents 77,553
Lives out of state and does not work in Wisconsin 6,097 Lives or works in Wisconsin 71,456 Works > 84 hours per week at primary job 113 Works > 84 hours per week at secondary job 47 Messed > 168 hours a week because of injury 185 Worked for 6 or more years prior to first nursing degree 4,163 Earned first-degree prior to 16 years of age or after age 60 785 Began working prior to age 16 or after age 56 395 Worked more than 100 hours a week (in and out of WI) 185 Untainted responses 65,931 Data are reported as the number of valid respondents, the percentage of valid responses and the mean (average) or median (a score that falls in the middle of a distribution with half the scores above and half the scores below) as appropriate. When the number of valid responses is so small as to risk revealing the identity of the respondent, results are not reported. Please note that often regional numbers do not add up to the state number because we have restricted the state dataset to RNs who live or work in Wisconsin and not every RN who works in Wisconsin provided information that allowed identification of the county where the RN is working. For cells that resulted in four or less responses, data is not reported in order to assure the confidentiality of all respondents.
B. Organization of Report (Recommendations follow at the end of each Section.) Section II – Overview of the State of Wisconsin Workforce In this section of the report we provide a “snapshot” of the State of Wisconsin Registered Nurse workforce. These tables also provide a basis for comparisons of Regional data and State level data. Section III – Registered Nurse Workforce Analyzed by Wisconsin Department of Health Services Regions (DHS) In this section we provide a breakdown of the data into the five Department of Health Services (DHS) Regions. When the reporting cells were too small to assure confidentiality and

3
anonymity, the data were not reported. Section III also provides information on the present employment patterns of nurses in both primary and secondary positions with special consideration given to providing data about direct care providers currently in practice and probable future employment plans. In addition, Section III includes data about the present educational preparation of the RN workforce as well as the future educational plans of respondents. (Please note that data for the eleven Department of Workforce Development Regions are in Appendix A.) Section IV – Intergenerational Workforce This section provides information about the RN workforce across all generations as well as an analysis by generational groups. Section V – Advance Practice Nurses This section provides a profile of the demographics and Advanced Practice Nurse (APN) workforce in Wisconsin as well as a description of employment patterns and educational plans. The design of the 2010 survey resulted in some Wisconsin APNs not being asked questions related to advanced practice and so the data reported in this section is an under-representation of APNs in Wisconsin. Section VI – Work Related Injuries Affecting Employment In this section data regarding work related injuries is reported by DHS regions and by place of employment. Information includes injuries within the last five years that affected the ability to perform direct patient care and the subset of injuries that required an Americans with Disabilities accommodation. Data also includes the reported number of weeks that direct care duties were reduced as well as the average hours per week that direct care duties were reduced. Section VII – Emergency Preparedness This section reports data related to the RN workforce formal education or training in emergency preparedness by DHS region. Data is provided about the source of education and the number of RNs who have participated in an emergency preparedness exercise in the past two years. The profile of the number of RNs that are members of the Wisconsin Emergency Volunteer (WEAVR) and the Medical Reserve Corp (MRC) is also included. Appendices
A. Department of Workforce Development Regional Profiles
B. County Profiles

4
II. Overview of the State of Wisconsin Registered Nurse Workforce
A. Demographics of the RN Workforce
Table 2.1 presents data that describe demographic information about the Wisconsin Registered Nurse workforce. The analysis is based on the responses of RNs who completed the 2010 survey at the time of license renewal and reflects the data management procedures described in the Introduction to this report. Note that the number of valid responses varies from question to question due to the numbers of valid responses collected for that item. Table 2.1. Demographic Information for State of Wisconsin RN Workforce Residence & work status Resides in WI 64,267 Works in WI 57,302 Lives in WI and works in WI 55,624 Lives in WI not working 1,757 Resides out of state and works in WI 1,678 Works as RN in WI 57,673 Descriptive data Average Age 46.31 Gender Number % Female 61,654 93.4 Male 4,359 6.6 Race White 62,962 95.5 Black 1,165 1.8 Asian 172 0.3 Southeast Asian/Pacific Islander 392 0.6 American Indian/ Alaska Native 172 0.3 Multiracial 460 0.7 Other 600 0.9 Not specified 22 0.0 Hispanic origin 768 1.2 Proficient in another language No 62,772 95.2 Yes – one other language 2,856 4.3 Yes – two or more other languages 290 0.4 These data verify common knowledge about nursing: it is a female dominated profession and largely composed of self-reported “white” members. Although between year comparisons are difficult, the prior 2001 RN survey reported the “white” race of RNs to be at 97.3 % of that year’s respondents. The 2010 report indicates very limited progress in increasing the diversity of the state workforce. More disturbing is the lack of additional language proficiency of the nursing workforce. This seriously impairs the ability of the RN workforce to care for an increasingly diverse population.

5
B. Employment Patterns of RNs in Wisconsin Table 2.2 implies that most nurses who want to be working, are working. A potential pool (1,004) of nurses exists who indicate that they are unemployed and seeking work in nursing. The potential also exits to attract those nurses “working in health care, not nursing” as well as those “working in another field”. Table 2.2 Employment Status of RNs in Wisconsin Works as an RN 57,673 Status of Unemployed 8,361 n % Works in health care, not nursing 1,092 13.1 Works in another field 1,132 13.5 Retired 3,041 36.4 Unemployed seeking work in nursing 1,004 12.0 Unemployed, seeking work in another field 136 1.6 Unemployed, not seeking employment 1,956 23.4 Approximately half of all nurses are employed in hospitals as their primary employer, followed by ambulatory care, and nursing homes (Table 2.3). Almost all nurses are permanent employees (98%). Almost 2/3 are staff nurses and four out of five nurses provide direct patient care. Almost 77% are paid hourly which means they are able to receive overtime compensation to augment their salaries of approximately $55,000/year.

6
Table 2.3 Current Practice in Primary Position (n=58,672) n % Primary place of work
Ambulatory care 8,347 14.2 Nursing Home 6,528 11.1 Academia 1,183 2.0 Public health/Community health 2,712 4.6 Home Health 2,535 4.3 Hospital 29,560 50.4 Other 7,807 13.3
Job title that most closely corresponds to primary position Administrator 1,136 1.9 Advanced Practice Nurse 2,698 4.6 Consultant/Contract 898 1.5 Nurse Executive 629 1.1 Nurse Faculty 1,066 1.8 Nurse Manager 5,280 9.0 Nurse Researcher 316 0.5 Staff Nurse 39,476 67.4 Other 7,099 12.1
Is your primary position an external pool/staffing placement? No 56,709 98.1 Yes 1,088 1.9
Compensation in primary position Paid hourly 44,424 76.9 Paid salary 13,373 23.1
Estimated total pre-tax salary earned from primary position Mean $56,012 Median $54,000
Direct patient care provider in primary position Provides direct patient care 49,710 75.4 Plans to return to providing direct patient care in WI in the next two years
Yes 120 10.6 No 510 45.1 Undecided 500 44.2
Table 2.4 shows a fairly uniform distribution of nurses across specialty areas. The areas with the most RNs include medical/surgical nursing, acute/critical care, gerontology, and OB/GYN nursing. The fewest number of registered nurses work in AODA (Alcohol and Other Drug Abuse) where the number is 85. This finding may more accurately reflect the reimbursement for treatment of these conditions, rather than a need for this health care. Equally concerning is the limited number of Public Health nurses (926) available to meet the health needs of the citizens of Wisconsin.

7
Table 2.4 Employment Specialty of Primary Position (n=58,669) n % Acute/Critical Care 6,459 11 Administration/Faculty 1,284 2.2 Adult Health 1,429 2.4 Anesthesia 644 1.1 AODA 85 0.1 Community Health 791 1.3 Correctional Health 370 0.6 Dialysis 703 1.2 Emergency Care 2,976 5.1 Family Health 1,478 2.5 General Practice 1,230 2.1 Geriatric/Gerontology 4,546 7.7 Home Health 2,353 4.0 Hospice care 1,014 1.7 Medical-Surgical 7,557 12.9 OB/GYN 3,102 5.3 Occupational Health 597 1.0 Oncology 1,552 2.6 Palliative care 154 0.3 Parish care 166 0.3 Pediatrics/Neonatal 2,669 4.5 Peri-Operative 3,080 5.2 Psychiatric/Mental health 1,932 3.3 Public Health 926 1.6 Quality Assurance/Utilization Review Infection control 1,087 1.9 Rehabilitation 1,339 2.3 School/College health 725 1.2 Trauma 276 0.5 Women’s Health 609 1.0 Other 7,536 12.8 Table 2.5 reflects a potential workforce of 1,354 RNs who might consider returning to employment as nurses. Table 2.5 Employment of RNs Not Employed in Nursing (n=1,354) Position if not nursing
n %
Childcare 39 2.9 Durable medical equipment sales 14 1.0 Education 198 14.6 Government 63 4.7 Health Administration 33 2.4 Health Informatics 28 2.1 Health Care Lobby * * Health Care Research 25 1.8 Pharmaceutical sales 21 1.6 Professional Association 20 1.5 Others 910 67.2 *reflect cells too small to report

8
C. Educational Patterns of RNs in Wisconsin Analysis of the educational status of RNs indicates that almost 95% of nurses educated in Wisconsin are working in Wisconsin. The number of nurses with baccalaureate degrees in nursing constitutes 40% of the total workforce which is higher than the national average. When asked about further education, 16% are either enrolled in nursing or considering further education and 20% are undecided. Nearly 70% stated that the greatest barrier to further education is the cost. Table 2.6 describes the educational preparation of the RN workforce. Table 2.6 Educational Preparation for Nursing Practice (N=65,945) Location of Educational Preparation Location of highest degree earned n %
Wisconsin 51,906 78.7 Not Wisconsin 14,039 21.3
Earned degree in WI and working in WI Education n=65,793 Highest Degree earned
Diploma in nursing 6,753 10.3 Associate Degree in Nursing 22,222 33.8 Associate Degree in other field 57 0.1 Baccalaureate Degree in Nursing 26,734 40.6 Baccalaureate degree in other field 2,913 4.4 Masters’ degree in Nursing 4,455 6.8 Masters’ degree in other field 2,143 3.3 PhD in Nursing 191 0.3 PhD in other field 325 0.5
Do you plan to obtain more educational degrees in the next 2 years?
n=65,884
No 40,119 60.9 Currently enrolled in Nursing 2,760 4.2 Yes – in nursing 8,194 12.4 Currently enrolled in another field 415 0 .6 Yes, in another field 1,150 1.7 Undecided 13,246 20.1
Barriers to pursuing additional education (Note: respondents could check multiple barriers)
n=21,683
Commuting distance to education program
3,192 14.7
Loss of work time and benefits 9,045 41.7 Cost of tuition and fees 15,135 69.8 Family/personal reasons 9,576 44.2 Lack of flexibility in work schedule 4,796 22.1 Schedule of educational programs offered
2,938 13.5
Other 915 4.2 Table 2.7 is interpreted as follows:
RNs who received a diploma as their first nursing degree • Have a mean age of 23 years at the time of the completion of the diploma
program.

9
• If these RNs continue their education to receive an associate degree in nursing, they were a mean age of 34 years at the time of completing the associate degree.
• If these RNs continued to a baccalaureate degree, they were a mean age of 36 years at the completion of the baccalaureate degree.
• If these RNs continued to a Masters degree, they were a mean age of 41 years at the completion of the Masters degree.
• Finally, if an RN with a diploma earned a PhD in any field, the RN had an average age of 48 years at the time of their degree.
Note that it is possible for RNs to complete a Master’s degree in nursing as a first nursing degree, typically because they already hold baccalaureate degrees in another field. From this table, it can be inferred that the most expeditious educational route to a PhD begins with a baccalaureate degree. However, this still has the RN with a doctoral degree completing the terminal degree at age 41 years. This is in sharp contrast to other disciplines where doctoral preparation is complete in the late 20s to early 30s.
Table 2.7 Mean Age of Registered Nurse at First Degree and Mean Age at Subsequent Degree. First nursing degree
Mean age at Diploma
Mean age at AD in Nursing
Mean age at BS in Nursing
Mean age at Master’s in Nursing
Mean age at PhD in any field
Diploma 23 34 36 41 48 Associate Degree Nursing
31 37 41 44
Baccalaureate in Nursing
26 35 41
Master in Nursing (baccalaureate in another field)
33 44
D. Diversity of RNs in Wisconsin
Table 2.8 presents a comparison of the diverse and non-diverse RN workforce as RNs self-identified including a comparison of the dominant racial category (white) with the ethnically diverse group according to self-reporting. The first part of the table indicates that over 95% of the RN workforce is white leaving 4.5% who state they are racially or ethnically diverse. Out of the 3,414 individuals who indicated ethnic or racial diversity, the Black group holds the highest percentage (34%) and the Hispanic group holds the second highest at 22%. It is notable that 17% (or 600) chose the “other” category. The diverse workforce group has a median age 8 years younger than the non-diverse group, perhaps suggesting more recent entry to nursing. Seven percent of the nursing population is male. With regard to income and primary position, the percentages are very similar with a slightly higher percentage of white nurses comprising the advanced practice group and a slightly higher ethnically or racially diverse group in staff nurse positions. With regard to highest nursing degree earned, more white nurses hold diplomas as their highest educational level (10%) than the diverse group (4%) who are also more represented in the Associate Degree (38%) than the white group (33%). All other categories are fairly comparable.

10
It is notable that only 0.3 of each group report a doctorate in nursing.
Table 2.8 Diversity in the Wisconsin Workforce Racially or Ethnically
Diverse Self Report Non Racially or
Ethnically Diverse Self Report or not reported
Race n % n % White 62,962 95.5 Black 1,165 34.0 Asian 172 5.0 Southeast Asian/Pacific Islander 392 11.5 American Indian/ Alaska Native 172 5.0 Multiracial 460 13.4 Other 600 17.5 Not specified 7 0.2 Hispanic origin 768 22.5
Age Valid Response 3,414 62,450 Median 40 48 Mean 41.96 46.36
Gender Female 3,104 90.7 58,460 93.5 Male 317 9.3 4,042 6.5
Proficient in another language No 2,279 66.6 60,943 96.8 Yes – one 986 28.8 1,870 3.0 Yes – proficient in 2 or more 158 4.6 132 0.2
Total income from primary position Valid Responses 2,958 52,668
Median $54,396 $54,000. Mean $56,576 $55,980
Job title that most closely corresponds to your primary position Valid Responses
3,200 55,398
n % n % Administrator 62 1.9 1,074 1.9 Advanced Practice Nurse 117 3.7 2,581 4.7 Consultant/Contract 40 1.3 858 1.5 Nurse Executive 21 0.7 608 1.1 Nurse Faculty 64 2.0 1,002 1.8 Nurse manager 268 8.4 5,012 9.0 Nurse Researcher 9 0.3 307 0.6 Staff Nurse 2,292 71.6 37,184 67.1 Other 327 10.2 6,772 12.2
Total hours work each week in/ out of WI Valid Responses
2,235 39,262
Median 40.0 36.0 Mean 38.3 36.6
Highest nursing degree earned Valid Responses
3,129 57,226

11
Racially or Ethnically Diverse Self Report
Non Racially or Ethnically Diverse Self Report or not reported
n % n % Diploma 157 4.6 6,596 10.6 Associate Degree 1,311 38.3 20,911 33.5 BSN 1,447 42.3 25,287 40.5 MSN 205 6.0 4,250 6.8 PhD 9 0.3 182 0.3
Primary Position Valid Responses 3,206 55,466
Ambulatory Care 371 11.6 7,976 14.4 Nursing Home/Extended Care 422 13.2 6,106 11.0 Academic Education 79 2.5 1,104 2.0 Public/Community Health 151 4.7 2,561 4.6 Home Health 187 5.8 2,348 4.2 Hospital 1,657 51.7 27,903 50.3 Other 339 10.6 7,468 13.5
E. Recommendations:
• The limited progress in increasing diversity and the lack of additional language proficiency of the nursing workforce seriously impair the ability of RNs to care for an increasingly diverse population necessitating a focus on these areas in the future.
• The number of unemployed RNs and RNs working in fields other than nursing indicate a possible recruitment pool for employers. In order to attract these nurses, it is necessary to explore the factors that motivate nurses to remain in the workforce.
• Given the high rate of employment in hospitals, ambulatory care and nursing homes, nursing educational programs may consider curriculum innovation and student clinical placements in these settings.
• Since almost 95% of RNs educated in Wisconsin are working in Wisconsin, an argument can be made for policy makers at the state level to invest in nursing education. The highest percentage of nurses is prepared at the baccalaureate level. This is far below the recommendation of The Future of Nursing (2011) calling for recommending baccalaureate preparation for 80% of nurses by the year 2020. Notable is the fact that over 2,700 RNs are currently enrolled in programs and another 8,100 have indicated an interest in achieving an additional degree in nursing. The cost of additional education as a major barrier is a directive to schools and policy makers to make financial support available.

12
III. Registered Nurse Workforce Analyzed by Wisconsin Department of Health Services (DHS) Regions
In this section the authors will present aggregate data that describes the nursing workforce in each of the five DHS regions of the state. A map of the state regions and the counties included in each region follows. In each table, the data from the statewide aggregate are included in order to make comparisons among regions and between the region and the state. Key findings from the data and implications for employers, educators, and policy makers will be presented in the accompanying narrative. Regional data numbers will often not add up to the state number. This reflects some incomplete elements of surveys where the data to place respondents into regions were missing. It also reflects the “drivers” in the construction of the survey; that is, not all respondents were asked all of the questions. Depending on a response to a question, a nurse would be routed to a particular series of follow-up questions. Because this is a study of the RN workforce in the state, the data were further restricted to nurses living and working in Wisconsin.

13
Wisconsin Department of Health Services Regions (DHS)
Southern Adams Columbia Crawford Dane Dodge Grant Green Iowa Juneau Lafayette Richland Rock Sauk Vernon
Southeastern Jefferson Kenosha Milwaukee Ozaukee Racine Walworth Washington Waukesha
Northeastern Brown Calumet Door Fond du Lac Green Lake Kewaunee Manitowoc Marinette Marquette Menominee Oconto Outagamie Shawano Sheboygan Waupaca Waushara Winnebago
Western Barron Buffalo Burnett Chippewa Clark Douglas Dunn Eau Claire Jackson La Crosse Monroe Pepin Pierce Polk Rusk St. Croix Trempealeau Washburn
Northern Ashland Bayfield Florence Forest Iron Langlade Lincoln Marathon Oneida Portage Price Sawyer Taylor Vilas Wood
http://www.dhs.wisconsin.gov/aboutdhs/regions.htm retrieved 2/23/12

14
A. Demographics of RN Workforce
Table 3.1 indicates that a lack of diversity in the nursing workforce exists across the state and across all regions. For most nurses, proficiency in a language other than English which is essential to meeting the needs of an increasingly diverse population, is also absent.
Table 3.1 Demographic Information for Department of Health Services Regions Compared to State of Wisconsin
State Southern Southeastern Northeastern Western Northern Resides in WI 64,267 12,143 24,566 13,061 7,773 6,197 Working as RN 57,673 87.5 10,643 87.6 21,398 87.1 11,356 86.9 6,931 89.2 5,331 86.0 Working RNs/1,000 population
10.0
9.7
10.1
9.3
8.9
10.9
Descriptive Data Average Age 46.31 46.17 45.82 45.82 46.47 46.95 Gender n % n % n % n % n % n % Female 61,654 93.4 11,325 93.3 23,073 94 12,254 93.8 7,232 93 5,688 91.8 Male 4,359 6.68 818 6.7 1,480 6.0 806 6.2 540 6.9 510 8.2 Race White 62,962 95.5 11,719 96.5 22,654 92.2 12,774 97.8 7,651 98.4 6,080 98.1 Black 1,165 1.8 101 0.8 988 4.0 25 0.2 9 0.1 8 0.1 Asian 172 0.3 40 0.3 93 0.4 14 0.1 9 0.1 5 0.1 South East Asian/ Pacific Islander
392 0.6 75 0.6 223 0.9 31 0.2 18 0.2 24 0.4
American Indian/ Alaska Native
172 0.3 21 0.2 51 0.2 51 0.4 23 0.3 22 0.4
Multiracial 460 0.7 83 0.7 221 0.9 72 0.6 34 0.4 31 0.5 Other 600 0.9 103 0.8 328 1.3 91 0.7 29 0.4 27 0.4 Not specified 22 0.0 * * 8 0 * * * * * * Hispanic origin 768 1.2 104 0.9 479 2.0 76 0.6 41 0.5 39 0.6 Proficient in another language
No 62,772 95.2 11,478 94.5 23,016 93.7 12,643 96.8 7,544 97 6,021 97.1 Yes – one other language
2,856 4.3 598 4.9 1.395 5.7 381 2.9 216 2.8 162 2.6
Yes – two or more other languages
290 0.4 68 0.6 147 0.6 36 0.3 14 0.2 15 0.2
*reflect cells too small to report
B. Employment status of RNs in Wisconsin Table 3.2 indicates that the capacity for recruitment exists in every region- noted by those nurses who reported being unemployed and looking for a nursing position in the state. It is also interesting to note that over 3,000 retired nurses continue to renew their licenses.

15
Table 3.2 Employment Status of RNs in Wisconsin State Southern Southeastern Northeastern Western Northern n % n % n % n % n % n % Working as an RN 57,673 87.5 10,643 87.6 21,398 86.9 11,356 86.9 6,931 89.2 5,331 86.0 Working in health care, not nursing
1,092
13.1
189 1.6 429 1.7 234 1.8 105 1.4 103 1.7
Working in another field
1,132 13.5 226 1.9 456 1.9 195 1.5 108 1.4 133 2.1
Retired 3,041 36.4 571 4.7 1,062 4.3 612 4.7 352 4.5 342 5.5
Unemployed 8,361
Unemployed seeking work in another field
136 1.6 20 0.2 60 0.2 31 0.2 9 0.1 14 0.2
Unemployed, seeking work in nursing
1,004 12 189 1.6 390 1.6 217 1.7 100 1.3 91 1.5
Unemployed, not looking
1,956 23.4 323 2.7 813 3.3 428 3.3 174 2.2 188 3.0
C. Patterns of Employment in Nursing Table 3.3 indicates the RN workforce across all regions has, on average, 15 years’ experience and nurses have spent over 70% of their career providing direct patient care. In addition, a very low level of agency employment exists in Wisconsin as primary employer. The mean income for a registered nurse is $56,787 with mean weekly hours around 35 per week. Table 3.3 Patterns of Employment in Nursing State Southern Southeastern Northeastern Western Northern
n % n % n % n % n % n % Currently work as RN providing direct patient care
49,710 75.4 9,392 77.4 18,196 74.1 9,844 75.4 6,013 77.4 4,539 73.3
Mean Mean Mean Mean Mean Mean Number of years providing DPC as an RN
15.87 16.03 15.57 15.92 16.11 15.8
Percentage of time as an RN spent in DPC
72.39 73.82 72.14 71.53 71.99 72.85
n % n % n % n % n % n % Primary Place of employment
Ambulatory care 8,347 14.2 1,858 16.3 2,890 13.2 1,651 14.9 958 13.5 806 15.0 Nursing Home /Extend Care
6,528 11.1 1,183 10.4 1,892 8.6 1,594 14.4 997 14.1 705 13.1
Academic Education
1,183 2.0 223 2.0 481 2.2 196 1.8 151 2.1 92 1.7
Public Health /Community health
2,712 4.6 226 4.9 867 4.0 639 5.8 326 4.6 248 4.6

16
State Southern Southeastern Northeastern Western Northern
Home Health 2,535 4.3 477 4.2 923 4.2 514 4.6 267 3.8 181 3.4 Hospital 29,560 50.4 5,744 50.5 11,989 54.7 5,014 45.2 3,519 49.7 2,536 47.2 Other 7,807 13.3 1,325 11.7 2,870 13.1 1,493 13.4 865 12.2 800 14.9
Job title that most closely corresponds to your primary position (n=63,147)
Administrator 1,136 1.9 204 1.9 430 2.0 219 1.9 131 1.9 114 2.1 Advanced Practice Nurse
2,698 4.6 521 4.8 889 4.1 556 4.8 342 4.9 263 4.8
Consultant /Contract
898 1.5 152 1.4 345 1.6 179 1.5 105 1.5 69 1.3
Nurse Executive 629 1.1 106 1.0 218 1.0 124 1.1 89 1.3 63 1.2 Nurse Faculty 1,066 1.8 173 1.6 409 1.9 188 1.6 144 2.0 105 1.9 Nurse Manager 5,280 9.0 927 8.6 1,766 8.1 1,113 9.6 756 10.8 520 9.6 Nurse Researcher 316 0.5 88 0.8 143 0.7 35 0.3 25 0.4 18 0.3 Staff Nurse 39,476 67.4 7,546 69.8 14,672 67.4 7,759 67.1 4,629 65.9 3,591 66.2 Other 7,099 12.1 1,092 10.1 2,887 13.3 1,397 12.1 804 11.4 683 12.6
Is your primary position
Paid hourly 44,424 76.9 8,393 78.7 16,252 75.5 9,016 79 5,372 77.8 4,105 76.8 Paid salary 13,373 23.1 2,311 21.7 5,327 24.8 2,423 21.2 1,553 22.5 1,259 23.6
Total Mean Income $56,626 $60,795 $57,558 $53,795 $56,853 $54,767 Total mean hours worked per week in/out WI
34.72 35.34 36.51 35.17 35.37 35.58
Is your primary employment an external agency placement
n % n % n % n % n % n %
No 56,709 98.1 10,512 98.6 21,050 97.9 11,187 98.1 6,775 98.2 5,239 98.2 Yes 1,088 1.9 147 1.4 453 2.1 213 1.9 127 1.8 98 1.8

17
D. Patterns of Employment Outside of Nursing Table 3.4 indicates that within the next 2 years, it appears unlikely that there will be a significant number of currently unemployed RNs returning to direct patient care. Among those nurses who reported that they were not employed in nursing, it is clear that their nursing education is relevant to their non-nurse position.
Table 3.4 Patterns of Employment Outside of Nursing State Southern Southeastern Northeastern Western Northern Plans to return to providing direct patient care in WI in the next two years
n % n % n % n % n % n % Yes 120 10.6 15 6.6 58 12.7 19 9.5 11 10.3 17 12.9 No 510 45.1 109 48 207 45.2 84 42.2 43 40.2 63 47.7 Undecided 500 44.2 103 45.4 193 42.1 96 48.2 53 49.5 52 39.4
Position if not nursing (valid responses)
1,354
These cells are too small to report at regional level Childcare 39 2.9
Durable medical equipment sales
14 1.0
Education 198 14.6 Government 63 4.7 Health Administration
33 2.4
Health informatics
28 2.1
Health care lobby * * Health care research
25 1.8
Pharmaceutical sales
21 1.6
Professional Association
20 1.5
Other 910 67.2 *reflect cells too small to report
E. Work Effort Patterns
Primary Position
Table 3.5 reveals the lowest number of nurses engaged in AODA (Alcohol and Other Drug Abuse) clinical practice. This may be due to the limited insurance reimbursement for this treatment despite the widespread prevalence of the disease. A limitation of these data is that the options for respondents may have been unclear. For example, what is the difference between “Trauma” and “Emergency Care” or similarly the difference between “General Practice” and “Medical-Surgical?” While this Table presents the supply side of the workforce, little is known about the demand side.

18
Table 3.5 Employment Specialty of Primary Position State Southern Southeastern Northeastern Western Northern
Specialty n % n % n % n % n % n % Acute/Critical Care 6,459 11 1,227 11.8 2,831 13 947 8.2 586 8.3 580 10.7 Administration/ Faculty
1,284 2.2 199 1.8 445 2 280 2.4 172 2.4 149 2.7
Adult Health 1,429 2.4 301 2.8 509 2.3 261 2.3 182 2.6 122 2.2 Anesthesia 644 1.1 134 1.2 80 0.4 150 1.3 124 1.8 108 2.0 AODA 85 0.1 17 0.2 23 0.1 10 0.1 17 0.2 18 0.3 Community Health 791 1.3 115 1.1 287 1.3 160 1.4 139 2.0 70 1.3 Correctional Health 370 0.6 60 0.6 115 0.5 129 1.1 39 0.6 19 0.3 Dialysis 703 1.2 118 1.1 268 1.2 136 1.2 77 1.1 65 1.2 Emergency Care 2,976 5.1 544 5.0 1,031 4.7 589 5.1 391 5.6 291 5.4 Family Health 1,478 2.5 290 2.7 372 1.7 377 3.3 234 3.3 161 3.0 General Practice 1,230 2.1 273 2.5 368 1.7 249 2.2 174 2.5 127 2.3 Geriatric/ Gerontology
4,546 7.7 751 6.9 1,325 6.1 1,086 9.4 725 10.3 521 9.6
Home Health 2,353 4.0 413 3.8 809 3.7 496 4.3 300 4.3 174 3.2 Hospice care 1,014 1.7 207 1.9 339 1.6 223 1.9 87 1.2 94 1.7 Medical-Surgical 7,557 12.9 1,570 14.5 2,737 12.6 1,410 12.2 952 13.5 653 12.0 OB/GYN 3,102 5.3 547 5.1 1,155 5.3 695 6.0 356 5.1 251 4.6 Occupational Health
597 1.0 73 0.7 193 0.9 184 1.6 57 0.8 64 1.2
Oncology 1,552 2.6 270 2.5 697 3.2 274 2.4 121 1.7 147 2.7 Palliative care 154 0.3 20 0.2 62 0.3 22 0.2 21 0.3 26 0.5 Parish care 166 0.3 44 0.4 48 0.2 32 0.3 18 0.3 19 0.3 Pediatrics/Neonatal 2,669 4.5 480 4.4 1,416 6.5 379 3.3 164 2.3 164 3.0 Peri -Operative 3,080 5.2 560 5.2 1,031 4.7 699 6.0 397 5.6 328 6.0 Psychiatric/Mental health
1,932 3.3 387 3.6 700 3.2 416 3.6 230 3.3 136 2.5
Public Health 926 1.6 173 1.6 287 1.3 205 1.8 126 1.8 113 2.1 Quality Assurance/Utilization review/infection control
1,087 1.9 169 1.6 453 2.1 170 1.5 144 2.0 115 2.1
Rehabilitation 1,339 2.3 196 1.8 569 2.6 271 2.3 156 2.2 116 2.1 School/College health
725 1.2 156 1.4 261 1.2 134 1.2 88 1.3 60 1.1
Trauma 276 0.5 57 0.5 84 0.4 44 0.4 48 0.7 33 0.6 Women’s Health 609 1.0 79 0.7 259 1.2 139 1.2 88 1.3 30 0.6 Other 7,536 12.8 1,345 12.4 3,024 13.9 1,409 12.2 820 11.7 677 12.5 Tables 3.6 – 3.8 present a detailed view of compensation for RNs across the State. Table 3.6 presents the range of compensation from the highest (nurse anesthetist at $142,859) to the lowest for parish nurses ($30,067). The low end of the scale is probably not accurate since most parish nurses are employed part time. The low end of the scale is more accurately portrayed by Community Health Nurses ($47,266) and Public Health Nurses ($47,621). Table 3.7 presents compensation related to the employment role. Nurses in leadership positions and advanced practice (Administrator, Executive, and Advanced Practice) report the highest levels of compensation. Nurse faculty report lower levels of compensation than the mean salary

19
reported by nurse managers. This faculty and nursing service pay disparity is also reported in the nursing literature and cited as a factor contributing to a nursing faculty shortage. Table 3.8 presents the compensation of various employment settings. Here we see the lower compensation among nursing homes/extended care facilities and Public and Community Health. Nurses employed in hospitals received the highest compensation. The salary reported for Academic Education may reflect a nine-month academic year appointment, but the question was not asked in the survey. Table 3.6 Mean Income by Employment Specialty Specialty State Southern Southeastern Northeastern Western Northern Acute/Critical Care $59,279 $63,577 $58,495 $57,318 $59,581 $54,562 Administration/ Faculty
$81,175 $88,594 $81,644 $73,035 $80,539 $82,539
Adult Health $54,585 $55,759 $58,206 $47,908 $54,021 $50,382 Anesthesia $142,859 $150,849 $122,833 $140,710 $144,786 $151,455 AODA $53,668 $48,881 $60,170 $42,578 $44,393 $58,547 Community Health $47,266 $43,183 $49,959 $40,368 $52,993 $40,358 Correctional Health $60,649 $61,447 $65,280 $57,535 $62,788 $45,684 Dialysis $58,985 $64,003 $57,462 $54,323 $62,733 $53,084 Emergency Care $58,170 $61,359 $56,900 $53,423 $61,795 $56,845 Family Health $51,579 $50,895 $48,674 $53,572 $50,755 $54,242 General Practice $50,551 $53,413 $49,746 $48,372 $54,221 $44,745 Geriatric/Gerontology $49,702 $52,112 $54,094 $47,913 $43,192 $46,680 Home Health $50,402 $50,627 $51,275 $49,090 $48,347 $45,454 Hospice care $53,137 $56,417 $52,937 $50,428 $57,615 $46,250 Medical-Surgical $52,399 $59,038 $51,417 $47,138 $52,878 $49,614 OB/GYN $50,504 $54,072 $50,333 $47,107 $53,507 $49,994 Occupational Health $58,232 $64,563 $59,555 $56,606 $53,249 $54,800 Oncology $55,808 $60,275 $57,505 $50,071 $51,939 $52,125 Palliative care $55,396 $51,567 $61,274 $50,096 $59,406 $44,608 Parish care $30,067 $36,723 $33,330 $22,754 Number too small to report Pediatrics/Neonatal $53,398. $59,039 $53,588 $49,683 $52,066 $44,218 Peri-Operative $57,416 $63,254 $57,412 $52,903 $57,361 $54,342 Psychiatric/Mental health
$57,617 $63,010 $55,277 $57,250 $56,322 $56,351
Public Health $47,621 $50,706 $47,349 $46,707 $42,674 $46,632 Quality Assurance/Utilization review/infection control
$62,244 $65,503 $63,163 $58,567 $60,118 $60,517
Rehabilitation $50,462 $55,316 $54,532 $42,236 $45,292 $45,785 School/College health $38,931 $38,953 $39,906 $37,238 $37,206 $39,335 Trauma $57,621 $65,342 $51,366 $60,598 $55,906 $57,749 Women’s Health $53,064 $53,870 $55,165 $49,048 $54,782 $53,054

20
Table 3.7 Mean Income by Role in Primary Position Role State Southern Southeastern Northeastern Western Northern Administrator $89,472 $91,580 $94,222 $84,504 $84,437 $82,659 Advanced Practice Nurse
$88,701 $90,514 $76,978 $90,918 $98,812 $103,882
Consultant/contract $58,597 $60,446 $65,218 $52,205 $48,060 $48,051 Nurse Executive $89,854 $92,664 $97,134 $81,240 $78,111 $89,851 Nurse Faculty $54,852 $57,349 $55,177 $53,573 $63,796 $51,434 Nurse Manager $65,995 $70,290 $67,593 $63,024 $56,253 $63,182 Nurse Researcher $57,208 $51,342 $60,214 $57,937 $50,300 $61,554 Staff Nurse $50,534 $55,158 $51,153 $46,859 $57,533 $46,764 Table 3. 8 Mean Income from Primary Position in Practice Setting Setting State Southern Southeastern Northeastern Western Northern Ambulatory Care $53,950 $55,953 $53,177 $51,838 $54,389 $58,843 Nursing Home Extended Care
$49,719 $51,799 $54,042 $47,689 $44,364 $46,047
Academic Education $57,886 $59,742 $59,142 $55,404 $55,932 $56,706 Public/Community health
$49,627 $51,031 $50,376 $49,588 $47,733 $45,358
Home Health $50,131 $49,973 $51,923 $48,887 $48,869 $38,788 Hospital $58,777 $65,195 $56,880 $54,737 $60,638 $56,567 Other $56,521 $56,182 $57,069 $51,778 $53,241 $57,105

21
Secondary Position Table 3.9 indicates that while over 7,000 RNs report a second position, note that across the regions a range of 5% to 10% of the secondary employment is unpaid. When RNs are employed in a paid second position, almost 2/3 are employed as staff nurses and paid hourly.
Table 3.9 Patterns of Secondary Employment State Southern Southeastern Northeastern Western Northern Secondary Employment 7,310 1,294 2,777 1,383 756 618
n % n % n % n % n % n % Secondary position is paid
6,789 92.9 1,184
91.5 2,600 93.6 1,314 95.0 679 89.8 576 93.2
Setting of position (5 % and greater)
Ambulatory care 543 7.4 98 7.9 202 7.4 115 7.7 48 6.3 56 9.0 Education Universities/Colleges
145 5.3
Home Health 710 9.7 138 11.1 318 11.6 112 7.5 51 6.7 49 7.8 Hospital Acute Care 1,839 25.2 262 21 700 25.6 383 25.6 171 22.6 175 28 Hospital Medical-Surgical
411 5.6 64 5.1 134 4.9 103 6.9 43 5.7 39 6.2
Nursing Home 740 10.1 134 10.7 232 8.5 165 11 99 13.1 77 12.3 Employment Specialty (5% and greater)
Acute/critical Care 683 9.1 87 7.0 304 11.1 119 7.9 46 6.1 49 7.9 Emergency Care 611 8.4 126 10.1 187 6.8 121 8.1 66 8.7 59 9.5 Geriatric/Gerontology 738 10.1 144 11.6 223 8.1 170 11.3 101 13.3 74 11.9 Home Health 636 8.7 118 9.5 294 10.7 104 6.9 46 6.1 37 5.9 Medical/Surgical 585 8.0 95 7.6 226 8.2 109 7.3 68 9 57 9.1
Job title (5% and greater)
Advanced Practice Nurse
395 5.4 * * * * 81 5.4 58 7.7 31 5.0
Consultant/contract 43 5.7 * * Nurse faculty 399 5.5 63 5.1 162 5.9 90 6.0 39 5.2 Staff nurse 4,811 66.0 827 66.7 1,779 65 1,030 68.7 464 61.6 424 67.9
Position is external pool/agency
808
11.9
106
9.4
413
16.2
141
9.9
58
8.5
47
8.1
Mean number of hours per week worked
13.55
12.94
13.8
12.66
13.69
13.52
Pretax income $12,543 $12,198 $13,413 $11,550 $12,226 $10,842 *reflect cells too small to report

22
Table 3.10 indicates that among the nurses who hold a second position, income is identified as the primary reason followed by rewards of the job.
Table 3.10 Reasons for Holding More Than One Nursing Position Reason (check all that apply)
State Southern Southeastern Northeastern Western Northern
n % n % n % n % n % n % Benefits 924 12.7 152 12.2 401 14.6 156 10.4 94 12.4 58 9.3 Collegial relationships
861 11.8 148 11.9 336 12.2 161 10.8 123 16.2 46 7.4
Educational options 756 10.4 122 9.8 286 10.4 160 10.7 88 11.6 63 10.1 Employment opportunity
2,542 34.8 385 30.8 954 34.8 584 39.1 249 32.9 228 36.5
Family/personal reasons
2,149 29.4 356 28.5 855 31.2 399 26.7 212 28 182 29.1
Hours 2,406 33.0 357 28.6 957 34.9 552 36.9 210 27.7 182 29.1 Keep up skills 2,548 34.9 424 34 940 34.3 524 35.1 279 36.9 231 37 Meet certification requirements
369 5.1 57 4.6 146 5.3 62 4.1 49 6.5 26 4.2
Opportunity for career advancement
1,058 14.5 155 12.4 415 15.1 215 14.4 125 16.5 101 16.2
Pay 4,097 56.1 713 57.1 1,605 58.5 789 52.8 415 54.8 341 54.6 Personally rewarding 3,285 45.0 585 46.9 1,170 42.7 693 46.4 374 49.4 269 43 Physical demands of the job
311 4.3 42 3.4 163 5.9 49 3.3 18 2.4 26 4.2
Shift 776 10.6 132 10.6 335 12.2 154 10.3 50 6.6 54 8.6 Volunteering 654 9.0 133 10.7 226 8.2 115 7.7 92 12.2 46 7.4 Work environment 1,296 17.8 214 17.1 537 19.6 246 16.5 121 16.0 92 14.7 Worksite location 1,000 13.7 175 14 364 13.3 186 12.4 120 15.9 77 12.3 Other 624 8.6 100 8 247 9 114 7.6 70 9.2 54 8.6
Patterns of Unemployment
Table 3.11 indicates there may be some potential to attract a small number of nurses back to direct patient care. The survey asked nurses to indicate their employment status – and then asked further details from those who indicated they were unemployed and not seeking work. A very small number across the state indicated difficulty in securing a nursing position. A majority of the “unemployed and not seeking work” nurses indicated family/personal reasons for not seeking work as an RN.
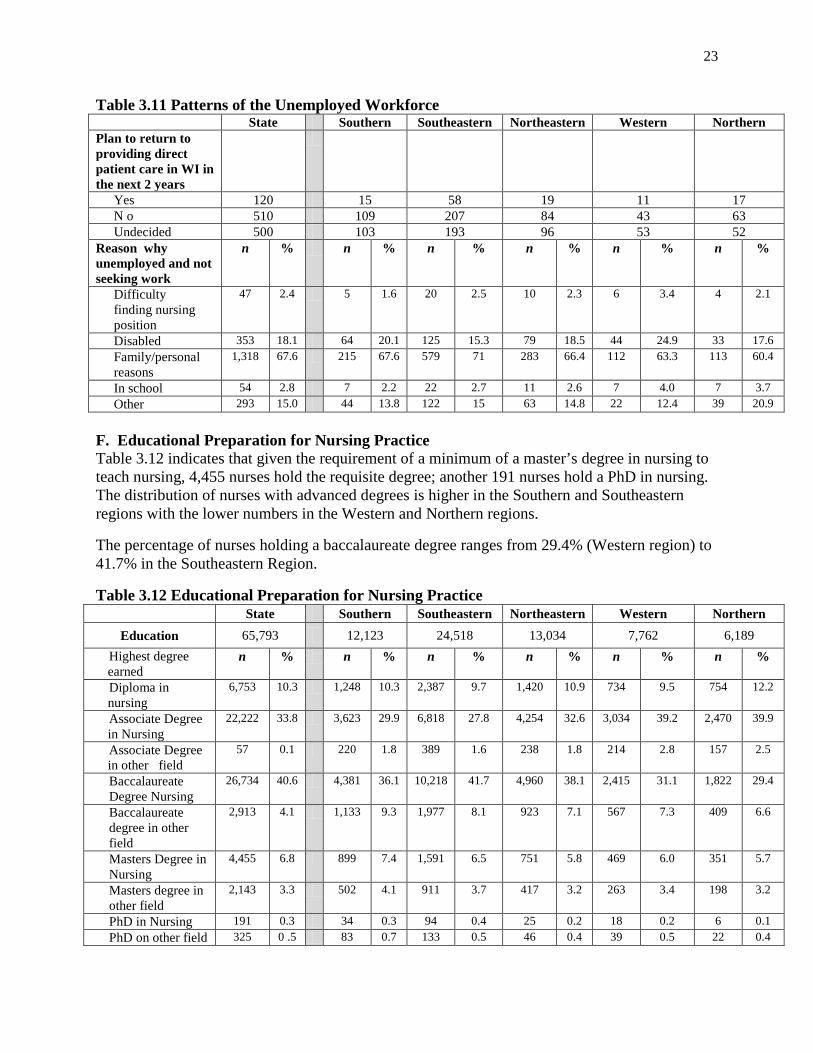
23
Table 3.11 Patterns of the Unemployed Workforce State Southern Southeastern Northeastern Western Northern Plan to return to providing direct patient care in WI in the next 2 years
Yes 120 15 58 19 11 17 N o 510 109 207 84 43 63 Undecided 500 103 193 96 53 52
Reason why unemployed and not seeking work
n % n % n % n % n % n %
Difficulty finding nursing position
47 2.4 5 1.6 20 2.5 10 2.3 6 3.4 4 2.1
Disabled 353 18.1 64 20.1 125 15.3 79 18.5 44 24.9 33 17.6 Family/personal reasons
1,318 67.6 215 67.6 579 71 283 66.4 112 63.3 113 60.4
In school 54 2.8 7 2.2 22 2.7 11 2.6 7 4.0 7 3.7 Other 293 15.0 44 13.8 122 15 63 14.8 22 12.4 39 20.9
F. Educational Preparation for Nursing Practice Table 3.12 indicates that given the requirement of a minimum of a master’s degree in nursing to teach nursing, 4,455 nurses hold the requisite degree; another 191 nurses hold a PhD in nursing. The distribution of nurses with advanced degrees is higher in the Southern and Southeastern regions with the lower numbers in the Western and Northern regions.
The percentage of nurses holding a baccalaureate degree ranges from 29.4% (Western region) to 41.7% in the Southeastern Region.
Table 3.12 Educational Preparation for Nursing Practice State Southern Southeastern Northeastern Western Northern
Education 65,793 12,123 24,518 13,034 7,762 6,189 Highest degree earned
n % n % n % n % n % n %
Diploma in nursing
6,753 10.3 1,248 10.3 2,387 9.7 1,420 10.9 734 9.5 754 12.2
Associate Degree in Nursing
22,222 33.8 3,623 29.9 6,818 27.8 4,254 32.6 3,034 39.2 2,470 39.9
Associate Degree in other field
57 0.1 220 1.8 389 1.6 238 1.8 214 2.8 157 2.5
Baccalaureate Degree Nursing
26,734 40.6 4,381 36.1 10,218 41.7 4,960 38.1 2,415 31.1 1,822 29.4
Baccalaureate degree in other field
2,913 4.1 1,133 9.3 1,977 8.1 923 7.1 567 7.3 409 6.6
Masters Degree in Nursing
4,455 6.8 899 7.4 1,591 6.5 751 5.8 469 6.0 351 5.7
Masters degree in other field
2,143 3.3 502 4.1 911 3.7 417 3.2 263 3.4 198 3.2
PhD in Nursing 191 0.3 34 0.3 94 0.4 25 0.2 18 0.2 6 0.1 PhD on other field 325 0 .5 83 0.7 133 0.5 46 0.4 39 0.5 22 0.4

24
G. Future Employment Plans
Table 3.13 indicates that between 2010 – 2012 it can be anticipated that over 2000 RNs will leave positions where they provide direct patient care. Almost 5,000 RNs indicate they will decrease their hours spent in providing direct patient care. More concerning is that within 9 years, over 15,000 nurses, or 33% of the RN workforce holding a DPC position will leave direct patient care.
Table 3.13 Future Work Plans of Direct Care Providers State Southern Southeastern Northeastern Western Northern In the next 2 years, do you plan to resign working as RN providing direct patient care?
n % n % n % n % n % n %
Yes 2,281 4.7 441 4.8 837 4.7 440 4.6 256 4.4 229 5.1 No 40,592 83.1 7,730 83.6 14,760 82.1 8,124 84.1 4,853 84.2 3,708 83.1 Undecided 5,963 12.2 1,070 8.8 2,376 13.2 1,099 11.4 655 11.4 527 11.8
In the next 2 years do you plan to change your number of hours providing direct patient care
No 28,153 60.4 5,388 61.2 9,839 57.4 5,516 60.9 3,541 64.3 2,717 64.1 Yes, increase hours
4,035 8.7 668 7.6 1,532 8.9 886 9.6 458 8.3 340 8.0
Yes, decrease hours
4,957 10.6 1,057 12 1,914 11.2 930 10.1 512 9.3 404 9.5
Undecided 9,430 20.2 1,692 19.2 3,859 22.5 1,791 19.4 1,000 18.1 778 18.4 Reasons for plan to change work hours
Benefits 1,271 14.0 198 11.4 463 13.4 269 14.8 149 15.3 133 17.0 Collegial relationships
166 1.8 35 2.0 53 1.5 42 2.3 23 2.4 58 1.1
Disability 98 1.1 23 1.3 33 1.0 17 0.9 13 1.3 9 1.2 Educational Options
823 9.1 150 8.6 338 9.8 166 9.1 88 9.0 56 7.4
Employment opportunity
1,334 14.7 207 11.9 486 14.0 309 17.0 160 16.4 126 16.7
Family/personal reasons
5,081 56.1 1,014 58.3 1,988 57.4 1,016 55.8 515 52.9 386 51.3
Job stress 2,110 23.3 432 24.8 816 23.6 425 23.3 222 22.8 166 22.0 Lack of career advancement
413 4.6 80 4.6 133 3.8 93 5.1 52 5.3 47 6.2
Opportunity for advancement
1,002 11.1 162 9.3 369 10.7 227 12.5 123 12.6 92 12.2
Pay 3,073 33.9 534 30.7 1,206 34.8 600 32.9 353 36.2 263 34.9 Personally rewarding
1,250 13.8 228 13.1 440 12.7 282 15.5 136 14.0 123 16.3
Physical demands of job
1,342 14.8 274 15.7 537 15.5 262 14.4 124 12.7 102 13.5

25
State Southern Southeastern Northeastern Western Northern Return to school 917 10.1 194 11.1 397 11.5 162 8.9 81 8.3 64 8.5 Shift 633 7.0 144 8.3 237 6.8 120 6.6 63 6.5 50 6.6 Work environment
903 10.0 165 9.5 342 9.9 184 10.1 100 10.3 83 11.0
Worksite location 393 4.3 60 3.4 136 3.9 76 4.2 49 5.0 47 6.2 Future length of time continuing to provide DPC in WI
2-4 years 6,404 13.8 1,234 14 2,476 14.4 1,119 12.1 716 13 525 12.4 5-9 years 9,044 19.4 1,674 19 3,469 20.2 1,656 18 1,096 19.9 800 18.9 10-14 years 9,012 19.4 1,719 19.5 3,385 19.8 1,718 18.6 1,011 18.4 824 19.4 15-19 years 5,635 12.1 1,055 12.0 2,032 11.9 1,147 12.4 688 12.5 519 12.2 20-24 years 6,211 13.3 1,169 13.3 2,270 13.2 1,316 14.3 693 12.6 583 13.7 25-29 years 3,941 8.5 806 9.2 1,302 7.6 865 9.4 506 9.2 368 8.7 30 + years 6,309 13.6 1,140 13.0 2,202 12.9 1,404 15.2 798 14.5 623 14.7
Table 3.14 indicates that across the state, the major reason (45%) registered nurses providing DCP are planning to leave nursing is retirement. The second highest reason is job stress and the third is physical demands of the job, suggesting perhaps that attention to improving the work environment is still required.
Table 3.14 Direct Care Providers Reasons for Leaving Nursing State Southern Southeastern Northeastern Western Northern Reasons for planning to leave nursing
n % n % n % n % n % n %
Disability 75 3.1 19 4.0 27 3.1 11 2.4 8 3.0 7 2.9 Family/personal reasons
301 12.3 49 10.3 128 14.5 53 11.4 28 10.3 29 11.9
Hours 267 10.9 46 9.7 100 11.3 51 10.9 31 11.4 28 11.5 Job stress 640 26.2 114 24 246 27.8 129 27.7 68 25.1 64 26.3 Lack of career advancement
195 8.0 36 7.6 81 9.2 28 6.0 21 7.7 21 8.6
Pay 354 14.5 50 10.5 169 19.1 59 12.7 31 11.4 35 14.4 Physical demands of job
400 16.4 68 14.3 170 19.2 59 12.7 46 17 39 16.0
Relocation of self/spouse/partner
314 12.8 62 13.1 133 15.0 49 10.5 25 9.2 30 12.3
Retirement 1,101 45.0 234 49.3 326 36.9 226 48.5 138 50.9 126 51.9 Return to school 244 10.0 44 9.3 98 11.1 42 9.0 33 12.2 21 8.6 Shift 111 4.5 19 4.0 39 4.4 21 4.5 11 4.1 18 7.4 Work environment
317 13.0 58 12.2 124 14.0 53 11.4 34 12.5 37 15.2
Worksite location 83 3.4 15 3.2 36 4.1 16 3.4 5 1.8 7 2.9 Other 396 16.2 87 18.3 137 15.5 82 17.6 41 15.1 34 14.0

26
Interest in Nursing Education
Table 3.15 indicates that there is potential for recruitment into new nurse educator positions from 408 nurses who indicated interest in full time positions and 1,222 interested in part time work. There may be additional interest among the respondents who are unsure.
Table 3.15 Interest in Nurse Educator Position State Southern Southeastern Northeastern Western Northern n % n % n % n % n % n % Interested in employment as nurse educator in the next 2 years
No 1,784 36.1 411 38.7 585 31.1 333 39.6 230 42.6 144 36 I am currently nurse educator
891 18.0 158 14.9 369 19.6 151 18.0 120 22.2 63 15.8
Yes – full time 408 8.3 87 8.2 163 8.7 61 7.3 33 6.1 36 9.0 Yes – part time 1,222 24.7 275 25.9 493 26.2 207 24.6 102 18.9 96 24 Yes – unsure of full/part time
638 12.9 132 12.4 274 14.5 88 10.5 55 10.2 61 15.3
H. Future Educational Plans
Table 3.16 shows that the majority of RNs do not plan to continue their education in nursing. This is important in anticipating the need for primary care providers and future faculty.
Table 3.16 Plans for Additional Degrees State Southern Southeastern Northeastern Western Northern n % n % n % n % n % n % Plan to pursue more educational degrees in the next 2 years valid responses
No 40,119 60.9 7, 582 62.4 14,284 58.2 8,102 62.0 4,847 62.4 3,931 63.5 Currently enrolled in nursing
2,760 4.2 439 3.6 1,136 4.6 543 4.2 326 4.2 245 4.0
Yes – in nursing 8,194 12.4 1,451 12.0 3,405 13.9 1,431 11 941 12.1 693 11.2 Currently enrolled in another filed
415 0.6 82 0.7 169 0.7 82 0.6 39 0.5 34 0.5
Yes in another filed
1,150 1.7 209 1.7 472 1.9 210 1.6 106 1.4 113 1.8
Undecided 13,246 20.1 2,373 19.5 5,083 20.7 2,685 20.6 1,511 19.4 1,178 19.0

27
Table 3.17 shows that the cost of tuition and fees is the most frequently cited barrier to pursuing additional education.
Table 3.17 Barriers to Pursuing Additional Nursing Education Barriers to pursuing nursing education (respondents checked all that applied
State Southern Southeastern Northeastern Western Northern n % n % n % n % n % n %
None 1,518 7.0 302 7.8 630 7.4 252 6.1 150 6.1 129 6.8 Commuting distance to program
3,192 14.7 569 14.7 755 8.8 710 17.1 498 20.1 539 28.5
Cost of lost time & work benefits
9,045 41.7 1,627 42.1 3421 39.9 1,719 41.4 1,155 46.7 817 43.2
Cost of tuition & fees
15,135 69.8 2,537 65.7 5,998 70.0 2,935 70.6 1,786 72.2 1,354 71.5
Family/personal reasons
9,576 44.2 1,692 43.8 3,769 44.0 1,967 47.3 1,050 42.5 799 42.2
Lack of flexibility in work schedule
4,796 22.1 909 23.5 1,840 21.5 926 22.3 570 23.1 416 22.0
Schedule of educational programs
2,938 13.5 579 15.0 1,096 12.8 561 13.5 358 14.5 244 12.9
Other 915 4.2 181 4.7 383 4.5 145 3.5 94 3.8 82 4.3
I. Recommendations:
• Since over 3,000 retired nurses continue to renew their licenses, it is possible that some would be interested in returning to practice and may be one answer to the impending nursing shortage. While the potential addition to the workforce is attractive, there is concern about the maintenance of knowledge and skills necessary to function in a rapidly change health care system. A substantive re-entry program for retired nurses may be important.
• Because the RN workforce across all regions has, on average, 15 years experience and
has spent 70% of his/her career providing direct patient care, this suggests an experienced workforce is well able to provide the mentoring required by new graduates at entry to practice
• Since the range of nurses holding baccalaureate degrees in nursing range from 29% to 41% depending on the region, a major effort will be needed to achieve the The Future of Nursing (2011) recommendation that 80% of nurses be prepared at the baccalaureate level by 2020.This requires that additional funding sources be found to support continued education. It is also necessary to assure flexibility in educational program and in scheduling from employers to support RNs achieving additional education. A final question not answered in this analysis is: do educational institutions have the capacity to enroll these students?

28
IV. INTERGENERATIONAL WORKFORCE A. Factors Influencing Entry into Nursing
Discussion of approaches to future workforce needs to frequently identify the need to understand and address the generational differences in the nursing workforce. The survey included several questions that provide information on the motivational factors influencing decisions related to work plans. This section provides information about the RN workforce across all generations as well as an analysis by generational groups.
Table 4.1 reports on the factors that nurses reported as being very important to their decision to become a registered nurse. Respondents selected all factors that were very important to them so the results are reported as a percentage of the sample that indicates that factor as very important. Across all groups the factor rated by the most nurses was related to be nursing being personally rewarding. Employment opportunities was rated as the second factor that was very important across all groups. Pay was the third most important factor when all groups are combined and for nurses from the Millennial and Generation X groups but was identified by a smaller percentage of RNs from the Baby Boomer and Silent Generation. Hours, educational options, opportunity for career advancement, and shift were more important for RNs from the Millennial and Generation X groups than for the Baby Boomers and Silent Generation. Of interest is that collegial relationships were identified by the fewest number of nurses across all groups.
Table 4.1 Motivation To Become a RN (n=61,234) Overall Millennial Gen X’ers Baby
Boomers Silent
Generation Personally Rewarding 82.5% 84.8% 81.6% 82.5% 85.1% Employment Opportunities
78.7% 83.0% 80.2% 77.7% 68.0%
Pay 65.8% 76.9% 72.2% 60.8% 40.3% Benefits 62.5% 71.4% 65.0% 61.0% 40.0% Family Personal Reasons
52.3% 50.1% 55.0% 50.7% 50.2%
Hours 46.6% 52.6% 52.1% 42.1% 34.3% Work Environment 45.0% 51.7% 46.2% 43.1% 40.2% Educational Options 41.8% 58.7% 44.9% 36.5% 34.2% Opportunity for Career Advancement
41.5% 60.3% 47.1% 34.6% 26.6%
Worksite Location 40.1% 43.9% 40.4% 39.4% 36.8% Shift 39.5% 45.4% 42.7% 36.6% 29.4% Collegial Relationships 27.1% 32.8% 26.8% 26.6% 23.6% B. Factors influencing employment decisions
When analyzing the motivational factors of RNs who are licensed in Wisconsin and report they work outside of Wisconsin differences across the groups occur. Table 4.2 shows that for Generation X, Baby Boomers, and the Silent Generation the top reason indicated was family/personal reasons. This is a factor that employers have limited ability to influence to attract nurses back to positions in Wisconsin. For nurses from the Millennial group the top

29
factor was employment opportunities. Although the number of nurses in the Millennial group for this question was small, it appears this is a group that could return to the Wisconsin RN workforce. Pay was identified as the second most cited factor for all the groups except the Silent Generation. Very few nurses in the Millennial and Generation X groups indicated that they would not return to Wisconsin to work. The numbers increased for Baby Boomers and was the highest for RNs from the Silent Generation which is consistent with the likelihood that many nurses in this group are retired but maintaining their RN license.
Table 4.2 Factors That Would Influence a Return to Work in Wisconsin (N=9,318) Overall
Millennial
(n=227) Gen X’ers (n=1,888)
Baby Boomers (n=4,974)
Silent Generation (n=2,229)
Family/personal Reasons 43.5% 40.1% 52.8% 42.3% 38.8% Pay 39.5% 54.2% 51.4% 41.6% 23.3% Hours 37.1% 33.9% 46.2% 39.8% 24.0% Employment Opportunities
36.8% 64.8% 45.3% 39.9% 20.0%
Work Environment 32.7% 34.4% 35.9% 37.0% 20.2% Worksite Location s 28.2% 29.1% 29.7% 31.1% 20.4% Benefits 24.7% 33.9% 29.1% 29.3% 10% Shift 21.8% 27.8% 29.5% 23.5% 10.7% Opportunity for Career Advancement
11.7% 32.2% 22.0% 11.5% 1.4%
Educational Options 11.6% 25.6% 16.9% 12.0% 4.7% Collegial Relationships 8.0% 7.9% 8.1% 8.6% 6.4% Relocation of Spouse/Partner
6.9% 18.5% 10.9% 6.6% 2.8%
Would not return 16.5% 1.8% 4.9% 14.2% 32.8%
For RNs who indicated that they worked more than one nursing job, the survey asked about reasons for having more than one job (Table 4.3). Pay was identified as the top reason for RNs from the Millennial, Generation X, and Baby Boomer generations. For nurses from the Silent Generation the top reason was the second job was personally rewarding. RNs from the Baby Boomer generation also rated personally rewarding high.

30
Table 4.3 Reasons for More than One Job (N=7,288) Overall Millennial
(n=492) Gen X’ers (n=3,284)
Baby Boomers (n=3,276)
Silent Generation
(n=236) Pay 56.1% 67.1% 60.7% 51.3% 34.7% Personally Rewarding 45.0% 40.0% 39.7% 49.3% 69.5% Keep up skills 34.9% 36.2% 35.8% 33.6% 39.4% Employment Opportunities
34.8% 41.5% 33.5% 35.3% 33.5%
Hours 33.0% 43.5% 36.4% 28.7% 23.3% Family/personal Reasons
29.4% 23.2% 30.8% 29.5% 23.3%
Work Environment 17.8% 19.3% 16.5% 18.5% 21.6% Opportunity for Career Advancement
14.5% 23.8% 16.7% 11.8% 2.1%
Worksite Location 13.7% 15.2% 12.5% 14.1% 21.2% Benefits 12.6% 13.4% 13.5% 12.0% 7.6% Collegial Relationships
11.8% 14.0% 10.3% 12.5% 17.4%
Shift 10.6% 11.8% 12.2% 9.0% 8.1% Educational Options 10.4% 13.8% 11.4% 9.0% 7.2% Volunteering 9.0% 2.6% 5.0% 11.8% 38.6% Meet certification requirements
5.1% 2.6% 4.1% 6.2% 6.8%
Physical Demands of the Job
4.3% 2.0% 3.6% 5.2% 4.7%
Disability 0.5% 0.0% 0.4% 0.8% 0.8%
The survey asked RNs about their future work plans. Less than 5% of RNs indicated that they are planning to quit working as a RN providing direct patient care in Wisconsin in the next two years. Table 4.4 shows that different profiles emerged for this question across the different generational groups. The majority of nurses reporting intent to leave nursing came from the Baby Boomer and Silent Generation and indicated retirement as the reason. The highest rated reasons for RNs from the Millennial group were returning to school, relocation of self or spouse/partner and job stress. For RNs from the Generation X group the highest rated reasons were job stress and pay followed by relocation of self or spouse/partner.

31
Table 4.4 Why Planning to Leave Nursing (N=2,430) Overall Millennial
(n=263) Gen X’ers
(n=592) Baby Boomers
(n=1,106) Silent
Generation (n=469)
Retirement 45.0% 0.8% 1.9% 57.1% 95.9% Job Stress 26.3% 18.3% 29.9% 33.1% 10.2% Physical Demands of the Job
16.4% 8.4% 14.7% 22.0% 9.8%
Pay 14.5% 11.4% 25.5% 14.0% 3.4% Work Environment 13.0% 8.4% 17.6% 15.9% 3.0% Relocation of Self or Spouse/Partner
12.8% 31.9% 20.3% 9.0% 1.7%
Family/personal Reasons
12.3% 14.1% 13.5% 13.4% 7.0%
Hours 11.0% 11.0% 16.2% 11.9% 2.1% Returning to School 10.0% 35.0% 17.9% 4.1% 0.2% Lack of Career Advancement
8.0% 5.3% 15.2% 7.7% 1.1%
Shift 4.5% 3.8% 8.1% 4.4% 0.6% Worksite Location 3.4% 7.2% 3.9% 3.3% 0.9% Disability 3.0% 0.0% 0.7% 5.1% 2.8%
The number of nurses reporting plans to leave positions providing direct patient care is relatively small. Analysis of factors motivating RN decision making about entering the nursing profession and plans for future work providing direct patient care can be important to designing strategies to retain RNs in direct patient care positions.
C. Recommendation:
• Strategies to retain nurses in direct patient care roles need to address motivational factors for generational groups.

32
V. ADVANCED PRACTICE NURSES
This section provides information on the advanced practice nurse (APN) workforce in Wisconsin. All data reported in this section must be interpreted with great caution. Because of the design of the 2010 Survey of Registered Nurses not all APNs were provided the opportunity to respond to the questions related to the APN workforce. As a result of the structure of the survey all data reported in this section will be an underrepresentation of the APN workforce in Wisconsin. A. Demographics of APNs The APN profile is very similar to the overall RN workforce in the racial distribution and average age. The majority of APN nurses are female and white. There is a slightly higher percent of male APNs (10.9%) when compared to the overall workforce profile of 6.6% male nurses. A greater percent of APNs report being proficient in a second language, 7.8% compared to the statewide rate of 4.7% however this rate is not sufficient to care for the diverse population. Table 5.1 provides data on other demographic characteristics of the APN workforce. Table 5.1 APN Demographic Profile (N=3,979) n % Gender Female 3,544 89.1%
Male 434 10.9% Race White 3,802 95.6%
Black 66 1.7% Asian 22 0.6% SE Asian/Pacific Islander 12 0.3% American Indian/Alaska native
10 0.3%
Multiracial 29 0.7% Of Hispanic Origin 42 1.1%
Highest Nursing Degree Earned
Diploma 42 1.1% ADN 48 1.2% BSN 250 6.4% MSN 3,461 88% PhD in Nursing 133 3.4%
Highest Degree Earned Diploma 19 0.5% ADN 15 0.4% BSN 17 0.4% MSN 3,237 81.5% Masters in other field 462 11.6% PhD in Nursing 128 3.2% PhD in other field 86 2.2%
Residence In Wisconsin 3,396 85.3% Out of state 583 14.8%
Proficient in another language
One other language 274 6.9% Two or more languages 34 0.9%
Age Mean 47.08 Income Mean $86,848 Total Hours Worked/Week Mean 39.5

33
Table 5.2 demonstrates the spectrum of areas that APNs report as their specialty area of practice. The largest number of APNs report that their specialty practice area as anesthesia. Table 5.2 APN Specialty Area
Specialty Area Primary position (n=3708) Secondary position (n=797) n % n %
Anesthesia 445 12.0 98 12.3 Family Health 387 10.4 71 8.9 Pediatrics/Neonatal 265 7.1 33 4.1 Acute/Critical Care 259 7.0 70 8.8 Adult Health 229 6.2 35 4.4 Medical-Surgical 178 4.8 41 5.1 OB/GYN 169 4.6 33 4.1 Geriatric/Gerontology 167 4.5 21 2.6 Psychiatric/Mental Health 161 4.3 58 7.3 Administration/Faculty 161 4.3 53 6.6 General Practice 109 2.9 29 3.6 Women’s health 107 2.9 12 1.5 Oncology 100 2.7 7 0.9 Emergency Care 90 2.4 54 6.8 School/College Health 81 2.2 18 2.3 Community Health 55 1.5 14 1.8 Occupational Health 47 1.3 10 1.3 Public Health 36 1.0 5 0.6 Quality Assurance/Utilization Review/Infection Control
35 0.9 6 0.8
Peri-operative 29 0.8 8 1.0 Rehabilitation 29 0.8 5 0.6 Palliative Care 26 0.7 * * Correctional health 24 0.6 9 1.1 Home Health 24 0.6 14 2.1 Hospice 19 0.5 * * Trauma 13 0.4 5 0.6 Dialysis 12 0.3 * * Parish Care 9 0.2 8 1.0 AODA * * 0 0.0 Other 441 11.0 73 9.2 *reflect cells too small to report
B. Description of APN Workforce The majority of APNs report working as an RN (91.6%) and 64% report that they are working as a RN providing direct patient care. Only 2.5% reported working outside of nursing and 1.3% reported that they were unemployed and looking for a position. The remaining reported being retired (2.8%) or unemployed but not looking (1.8%). A total of 3,519 nurses reported being educationally prepared as an APN and 2,504 nurses reported working in a role that requires APN. Of interest is that 28.9% (1,149) of APN’s report they are not currently working in a role that requires them to be an APN suggesting that there are a large number of APNs being underutilized in the health care delivery system. Less than half of the nurses who report being

34
educationally prepared as an APN report having APN prescriber status and only 64% of those reporting that they work in a role that requires APN preparation and have APN prescriber status. Table 5.3 reports the certification status of APN nurses by DHS region and Table 5.4 reports the data by DWD region. Of particular note is the low numbers of certified advanced public health nurses across the state. There are also very small numbers of certified nurse midwives and certified psychiatric-mental health nurses in a number of the DWD regions. Table 5.3 Advanced Practice Nurse Certification by DHS Region Statewide Region 1
Southern Region 2
Southeastern Region 3
Northeastern Region 4 Western
Region 5 Northern
Educationally Prepared as APN
3,519 742 1,284 641 392 311
Work in a role that requires APN
2,504 506 901 521 288 241
Advanced Practice Nurse Prescriber
1,603 300 571 368 170 159
Certified Advanced Public Health Nurse
11 * 8 * * 0
Certified Nurse-Midwife
93 21 38 11 19 *
Certified Registered Nurse Anesthetist
348 76 34 85 65 63
Certified Clinical Nurse Specialist
193 37 104 21 15 10
Certified Nurse Practitioner
1,422 274 531 303 147 135
Certified Psychiatric-Mental Health Nurse
66 12 23 16 5 6
Other Certified 101 17 43 23 15 10 *reflect cells too small to report

35
Table 5.4 Advanced Practice Nurses Certification by DWD Region (N=2393) DWD
North West
DWD West
Central
DWD North
Central
DWD Bay Area
DWD Western
DWD Fox
Valley
DWD South
Central
DWD WOW
DWD South west
DWD South east
DWD Milwaukee
Educationally Prepared as APN
58 186 248 290 182 297 627 229 69 120 842
Work in a role that requires APN
49 152 205 251 144 246 454 169 57 94 626
Advanced Practice Nurse Prescriber
29 89 125 166 89 191 274 104 36 69 386
Certified Advanced Public Health Nurse
0 0 * 0 * 0 * * 0 0 *
Certified Nurse-Midwife
* 11 * * 12 7 14 * * * 31
Certified Registered Nurse Anesthetist
11 41 58 45 27 26 63 12 8 6 15
Certified Clinical Nurse Specialist
* * 12 10 11 8 35 17 * 6 80
Certified Nurse Practitioner
27 68 104 141 72 150 242 91 33 68 360
Certified Psychiatric-Mental Health Nurse
* 0 6 6 5 9 9 5 * * 12
Other Certified * 8 7 13 * 8 17 9 * * 24 *reflect cells too small to report

36
C. Employment Patterns Table 5.5 reports the job titles for APNs in their primary and secondary positions. As expected, the majority of APNs report that their primary position has an APN job title. It is also noted that 8% of APNs report that their primary position is a nurse faculty role and 14.7% of APNs who report a secondary position indicate that position is in a nurse faculty role. This data also supports the analysis that a number of APNs are under -utilized with 8.1% reporting that their primary position is a staff nurse. Table 5.5 APN Job Title for Primary and Secondary Positions (N=3706)
Job Title Primary Position (n=3706) Secondary Position (n=796) n % n %
APN 2,487 67.1 371 46.6 Staff Nurse 301 8.1 157 19.7 Nurse Faculty 298 8.0 117 14.7 Administrator 119 3.2 5 0.6 Nurse Manager 114 3.1 10 1.3 Consultant/Contract 47 1.3 36 4.5 Nurse Executive 39 1.1 * * Nurse Researcher 36 1.0 7 0.9 Other 265 7.2 90 11.3 *reflect cells too small to report
APNs reported that 74.6% of primary positions and 29.6% of secondary positions are salaried and 26.4% of primary positions and 70.8% of secondary positions are paid hourly. Only 1.7% report that a primary position is an external pool/staffing agency placement however 8.2% of secondary positions are reported as external pool/staffing agency placement. Table 5.6 reports the primary and secondary places of employments for nurses across the state. Table 5.7 reports the primary place of employment by DHS region and Table 5.8 reports the data by DWD region. Hospitals are the primary place of employment across all areas except for the DHS Northeast region and the DWD Northwest, Bat Area, Fox Valley, Southwest and Southeast regions. In all of these areas ambulatory care was the predominant primary place of employment. Hospitals and ambulatory care combined describe the primary place of employment for more than 60% of APNs in all regions except for the DWD West Central, Fox Valley, WOW, and Southwest regions. Table 5.6 APN Place of Employment
Place of Employment Primary (N=3295) Secondary (N=702) n % n %
Hospital 1,190 36.1% 239 34.0% Ambulatory Care 904 27.4% 115 16.4% Academic Education 348 10.6% 150 21.4% Public/Community Health 154 4.7% 32 4.6% Nursing Home/Extended Care 103 3.1% 21 3.0% Home Health 39 1.2% 21 3.0% Other 557 16.9% 124 17.7%

37
Table 5.7 APN Primary Place of Employment by DHS Region (N=3146) Primary Place of Employment
Statewide Region 1 Southern
Region 2 Southeast
Region 3 Northeast
Region 4 Western
Region 5 Northern
n % n % n % n % n % n % Hospital 1,132 36.0 287 41.0 479 39.7 145 24.7 128 34.8 93 32.9 Ambulatory Care 876 27.8 179 25.6 303 25.12 205 34.9 100 27.2 89 31.4 Academic Education
338
10.7 60 8.6 163 13.5 50 8.5 37 10.1 28 9.9
Public/ Community Health
143
4.5 37 5.3 41 3.4 32 5.5 22 6.0 11 3.9
Nursing Home/Extended Care
91
2.9 17 2.4 36 3.0 19 3.2 12 3.3 7 2.5
Home Health 37
1.2 17 2.4 9 0.7 6 1.0 * * * *
Other 529 16.8 103 14.7 177 14.7 130 22.1 65 17.7 54 19.1 *reflect cells too small to report

38
Table 5.8 APN Primary Place of Employment by DWD Region Primary Place of
Employment
DWD North West N=58
DWD West
Central N=189
DWD North
Central N=256
DWD Bay Area
N=298
DWD Western N=183
DWD Fox Valley
N=301
DWD South
Central N=637
DWD WOW N=236
DWD South west
N=70
DWD South east
N=122
DWD Milwaukee
N=858
n % n % n % n % n % n % n % n % n % n % n % Hospital 11 19 63 33.3 89 34.8 87 29.2 65 35.5 60 19.9 272 42.7 83 35.2 16 22.9 38 31.1 364 42.4
Ambulatory Care
26 44.8 43 22.8 75 29.3 106 35.6 61 33.3 102 33.9 151 23.7 54 22.9 24 34.3 46 37.7 204 23.8
Academic Education
* * 21 11.1 28 10.9 24 8.1 15 8.2 27 9.0 57 8.9 29 12.3 7 10.0 12 9.8 123 14.3
Public/ Community Health
* * 12 6.3 11 4.3 10 3.4 11 6.0 24 8.0 37 5.8 14 5.9 * * 6 4.9 21 2.4
Nursing Home/ Extended Care
* * 6 3.2 * * 6 2.0 6 3.3 13 4.3 17 2.7 11 4.7 * * * * 23 2.7
Home Health 0 0 4 2.1 * * * * * * * * 16 2.5 0 0 * * 0 0 8 0.9
Other 15 25.9 40 21.2 48 18.8 62 20.8 24 13.1 72 23.9 87 13.7 45 19.1 16 22.9 16 13.1 115 13.4
*reflect cells too small to report
39
D. Educational Plans A total of 450 APN’s reported that they currently are employed as a nurse educator. An additional 1,624 APN’s reported that they would consider employment as a nurse educator within the next two years, of those, 266 reported they would consider full-time employment as a nurse educator, 901 part-time employment, and 457 where unsure whether they would consider full-time or part-time employment as a nurse educator. In response to questions related to future educational plans, 112 APN’s reported current enrollment in a nursing program and an additional 31 reported enrollment in another field. An additional 339 APN’s reported they plan to pursue an educational degree in nursing in the next two years and 53 reported plans to pursue an educational degree in another field. The majority of APN’s indicated that they plan to continue working in direct care for at least the next two years. Only 124 APN’s reported plans to quit working as an RN providing direct care in the next two years. 271 APN’s reported plans to decrease hours providing direct care in the next two years. E. Recommendations:
• Future surveys must be designed to capture complete data on all Wisconsin APNs. • This preliminary data on the supply of APNs in Wisconsin should be used to begin to
investigate whether there are sufficient APNs particularly in primary care areas to meet the demand for health care throughout the state. This analysis should also include an assessment of the adequacy of the distribution of APNs across the state.

40
VI. WORK RELATED INJURIES AFFECTING EMPLOYMENT The survey asked RNs about work related injuries that affected the ability to perform direct patient care. Responses to the question about work-related injuries indicate that 3,681 nurses (5.6%) reported that in the last five years they had a work-related injury that affected their ability to perform direct patient care. Almost half of those reporting (1,725) an injury that affected their ability to perform direct patient care indicated that the injury resulted in a disability that requires an accommodation under the Americans with Disabilities Act (ADA). Of those nurses reporting a work-related injury, 3,746 nurses reported information on reduced patient care. There was great variability in the information reported about reduced patient care. As in other sections of the analysis, the decision was made to remove some of the responses (216) due to concerns about the validity when it was reported that patient care had been reduced by more than 80 hours per week. Because of the range of responses in number of weeks direct care was reduced and average hours of patient care per week that were reduced, medians are reported to provide the most meaningful picture of the impact of work related injuries on direct patient care. The median number of weeks that patient care duties were reduced was 2.0. On the question of how many hours direct patient care was reduced during those weeks the median was 20 hours/week. Table 6.1 shows that across the state the rate of injury varies from 4.4% in DHS Region 5 (Northern) to 6.6% in DHS Region 1 (Southern). Injuries that require an ADA accommodation ranged from 1.7% in DHS Region 5 (Northern) to 2.2% in DHS Region 1 (Southern). There was very little difference in the weeks direct care duties were reduced across the state with four of the five regions showing a median rate of two weeks. Only DHS Region 4 (Western) showed a different pattern with a median of three weeks. There was a slightly different pattern in the average hours per week that direct patient care was reduced. DHS Region 1 (Southern) had a median reduction of 24 hours per week of direct patient care and DHS Region 5 (Southern) has a median reduction of 16 hours per week of direct patient care. The remaining regions all found a median reduction of 20 hours per week of direct patient care. DHS Region 1 (Southern) had the largest percentage of nurses reporting an injury that affected direct patient care as well as requiring an ADA accommodation which may have contributed to the greater median average hours of direct patient care reduced. Conversely DHS Region 5 (Southern) had the smallest percentage of nurses reporting an injury that affected direct patient care as well as requiring an ADA accommodation which may have contributed to the lower median average hours of direct patient care that were reduced.

41
Table 6.1 Work Related Injury by DHS region
Statewide Region 1
Southern N=11,345
Region 2 Southeastern N=21,858
Region 3 Northeastern N=11,044
Region 4 Western N=7,055
Region 5 Northern N=5355
n % n % n % n % n % Work Related Injury in Past 5 years that affected ability to perform direct patient care
3,681 746 6.6% 1,315 6.0% 614 5.6% 429 6.1% 237 4.4%
Required accommodation
1,725 249 2.2% 468 2.1% 201 1.8% 138 2.0% 91 1.7%
Weeks direct care duties reduces (median)
2.0 2.0 2.0 3.0 2.0
Average hours reduced (median)
24 20 20 20 16
Table 6.2 indicates that the majority of work related injuries that affected the ability to perform direct patient care occurred in nurses who reported that their primary place of employment was in a hospital. The median number of weeks that direct care duties were reduced ranged from two weeks in hospital, ambulatory care, and academic education settings to three weeks in home health and public/community health settings. The median average hours of reduced direct patient care duties per week ranged from 7 hours in academic education settings to 20 hours in hospital, nursing home/extended care, and public/community health settings.
Table 6.2 Work Related Injuries By Place of Employment
State Hospital
Nursing Home/
Extended Care
Ambulatory Care
Home Health
Public/ Comm Health
Academic Educ Other
Work Related Injury in Past 5 years that affected ability to perform direct patient care
3,681 1,980 360 344 150 117 46 313
Required accommodation
1,725 153 31 34 23 15 8 48
Weeks direct care duties reduces (median)
2.0
2.0
2.5
2.0
3.0
3.0
2.0
4.0
Hours reduced per week (median)
20 20 20 16 16 20 7.0 24
A. Recommendation:
• Data from the survey does not allow investigation of the causes of the reported work related injuries. Further work is needed to explore the impact of this rate of injury on the RN workforce.

42
VIII. EMERGENCY PREPAREDNESS
The 2010 Nursing Workforce Survey collected information related to formal education or training in emergency preparedness. Table 7.1 shows that less than 50% of the nurses completing the survey reported having completed any formal education or training in this area. Of those RN’s who did report having participated in emergency preparedness education or training nearly 90% report that they received that education or training through their employer.
Table 7.1 Nurse Participation or Involvement in Emergency Preparedness by DHS Region Statewide Region 1
Southern Region 2
Southeastern Region 3
Northeastern Region 4 Western
Region 5 Northern
Wisconsin Emergency Assistance Volunteer Registry (WEAVR)
1,246 260 325 275 231 133
Medical Reserve Corp (MRC)
140
20 53 9 24 15
Participation in and Emergency Preparedness Exercise in past 2 years
15,508
2,743 5,617 2,947 2,124 1,530
Table 7.2 shows that less than 25% of the nurses completing the 2010 Nursing Workforce Survey have participated in an emergency preparedness exercise in the past two years and less than 2% of nurses are a member of the Wisconsin Emergency Assistance Volunteer Registry (WEAVR). Only 140 nurses reported participating in the Medical reserve Corp (MRC).
Table 7.2 Formal Education or Training in Emergency Preparedness by DHS Region Statewide Region 1
Southern Region 2
Southeastern Region 3
Northeastern Region 4 Western
Region 5 Northern
Total 30,063 5,614 11,452 5,954 4,071 2,972 Provided by Employer
27,017 4,972 10,416 5,339 3,668 2,622
Provided by Voluntary Organization
2,633 598 830 522 380 303
A. Recommendation:
• There is a need to critically assess the readiness of the RN workforce to support emergency preparedness in the state and to develop comprehensive plans for expanding the education and training of the RN workforce related to emergency preparedness.

43
Reference:
IOM(Institute of Medicine). 2011. The Future of Nursing: Leading Change, Advancing Health. Washington, D.C. Washington, DC: The National Academies Press.