executive summary - rnib - supporting people with … to work cba... · web viewnon-employment...
TRANSCRIPT

Access to WorkCost Benefit Analysis
Duncan MelvilleConnor StevensLovedeep Vaid
December 2015

Contents1 Executive Summary.................................................................32 Introduction............................................................................73 Literature Review....................................................................8
Introduction.............................................................................................8Labour Market Position of Blind and Partially Sighted People..................8Employment patterns of blind and partially sighted people..................13Access to Work......................................................................................16
4 Cost Benefit Analysis..............................................................20Unit Costs...............................................................................................20
Introduction.............................................................................................................20Unit Cost Estimates for Blind / Partially Sighted Individuals.....................................21Unit Cost Estimates for All Conditions.....................................................................24Unit Cost Estimates by Support Type Compared.....................................................26Unit Costs Compared Across Different Medical Conditions......................................26
Cost Benefit Analysis: ATW overall........................................................29Costs.......................................................................................................................30Benefits...................................................................................................................31
Cost Benefit Analysis: ATW for blind and partially sighted individuals. .49Costs.......................................................................................................................49Employment benefits..............................................................................................50Non-Employment Benefits.......................................................................................51
Fiscal Impacts........................................................................................555 Conclusions...........................................................................586 Appendix 1: Unit Costs Geographical Breakdown.....................60
Access to Work Cost Benefit Analysis
1 Executive Summary1.1 Studies estimate that there are between 80,000 to 190,000 blind
and partially sighted individuals within the United Kingdom1. Individuals with sight loss face numerous and complex barriers to employment. A review of the available evidence has found that individuals with sight loss are more likely to be unemployed than the general working age population2 3 4.
1.2 The fact the people with sight loss are far less likely to be employed than those without sight loss is not surprising in the context of the wide ranging barriers to employment that people with sight loss face, which include5 6 7:
Anxiety and a lack of confidence Mobility and transport issues Lack of training and qualifications The attitude of employers The availability of suitable jobs The need for specialist personal support, aids and work
hours
1.3 There are some differences between the work patterns of blind and partially sighted individuals and those with no impairments. Individuals with full or partial sight loss8 9 10:
Have similar employment patterns to the general working population in terms of public and private sector breakdown and occupations worked in.
1 Hewett, R and Keil, S. (2015) Investigation of data relating to blind and partially sighted people in the Quarterly Labour Force Survey: October 2010 – September 2014. VICTAR, University of Birmingham and RNIB2 Ibid3 Douglas, G, et al. (2009) Visually impaired people’s access to employment. Visual Impairment Centre for Teaching and Research (VICTAR).4 McManus, S and Lord, C. (2012) Circumstances of people with sight loss, Natcen and RNIB5 Flynn, K and Lord, C. (2015) Living with Sight Loss: Updating the National Picture. RNIB and NatCen Social Research.6 Douglas, G, et al. (2009), op cit7 Hewett, R and Keil, S. (2015) op cit8 Hewett, R and Keil, S. (2015) op cit9 Saunders, A. (2015). The jobs blind and partially sighted people do. RNIB10 Flynn, K and Lord, C. (2015) op cit
3
Access to Work Cost Benefit Analysis
Are more likely than the general working population to work in large organisations (+250 members of staff), and less likely to work in micro organisations (>10 members of staff).
Are more likely to be working part-time and be on temporary employment contracts, when compared to those without sight loss.
Earn less than the general working age population.
1.4 In the year 2013-14, Access to Work supported 35,450 people with disabilities. The programme was mainly utilised by people with sensory (sight issues – 14% and hearing issues – 16%) or physical difficulties (24%) with the remaining 46% of users having a variety of other medical conditions11.
1.5 The most common types of support provided by Access to Work were12:
Support workers (14,850) Travel to work (13,120) Aids and equipment (5,470) Adaptations to vehicles (200) and work premises (40).
1.6 Potential benefits for participants from Access to Work include reduced sickness, improved attendance, retained employment, development of working skills, increased income and better health and well being13. Gains for employers from Access to Work consist of improved productivity, lower employee turnover, a better understanding of the needs of disabled staff members and the increased well being of staff.
1.7 A review of the range of research which analysed the success of the different strands of Access to Work found14 15 16:
Travel to work provides invaluable support to users, with both employers and employees stating that the travel to work strand is very necessary for the user to continue
11 Gifford, G. (July, 2014) Access to Work Official Statistics. DWP12 Ibid13 Dewson, et al (2009) DWP Evaluation of Access to Work: Core Evaluation. Research Report No. 61914 Thornton, P. and Corden, A. (2002) Evaluating the Impact of Access to Work: A Case Study Approach, Research & Development Report, WAE138, Claimant Unemployment and Disadvantage Analysis Division, Department for Work and Pensions, Sheffield.15 Douglas, G, et al. (2009) op cit16 Dewson, et al (2009) op cit
4

Access to Work Cost Benefit Analysis
working. Research has found that travel to work would be the type of support, least likely to continue without public funding.
Support workers were equally as valued by users and employers alike, with both believing they provided enormous value within the workplace.
Aids and equipment were also viewed as important methods of support which contribute to improved performance at work, although less vital for continued employment than support workers and travel to work.
Alterations were helpful in making the workplace more accessible for those with disabilities. However, they were often viewed as more of a luxury than a necessity, with both users and employers indicating that their loss would not lead users to not be in work.
1.8 For our cost benefit analysis, we first calculate the unit costs of ATW per person helped, per person benefiting, and per award. These unit costs vary by the type of support received. For blind and partially sighted individuals support workers and travel to work support are the categories of support with the highest unit costs. For all medical conditions overall, adaptations to premises and support workers are the categories of support with the highest unit costs.
1.9 ATW unit costs also vary by medical condition with unit costs being highest for deaf and hard of hearing individuals. Unit costs for blind and partially sighted individuals and those with cerebral palsy are also relatively high. People with dyslexia and mental health conditions are the two groups with low unit costs.
1.10 Our full cost benefit analysis compares the cost of the ATW programme, and that part which assists blind and partially sighted individuals, against the employment and non-employment benefits that we estimate that the programme generates. Some of these benefits would have occurred in the absence of the ATW support. This is known as deadweight and comes in two forms: employment deadweight, where the individual assisted would have been in work without the ATW support, and financial deadweight where the support would have been funded by employers or users themselves. Allowing for
5

Access to Work Cost Benefit Analysis
these two types of deadweight leads to our estimates of the net employment impacts of ATW.
1.11 The monetary value of these employment benefits is estimated using assumptions for hourly pay and working hours taken from studies in our literature review, data from the Annual Survey of Hours and Earnings (ASHE) and research into the pay gaps between disabled and non-disabled workers. Non-employment wellbeing benefits are estimated using the Manchester New Economy model. This model forms part of the more detailed guidance on cost benefit analysis sitting alongside the Treasury’s Green Book, its overall guidance on how to undertake cost benefit analysis. More generally, the monetary valuation of wellbeing impacts was incorporated into the Treasury Green Book in 2011. We estimate on the basis of the available evidence that that the overall benefits of ATW to society outweigh its costs by a considerable margin with ratios of these benefits to the costs of 3.86 for ATW as a whole and 2.48 for that part of the programme that assists blind and partially sighted individuals. This demonstrates that ATW is a beneficial form of public spending.
1.12 It should be noted that these results are not an update on the much quoted 1.48 figure produced by RNIB in 2004. That 2004 figure is an estimate of the ratio of fiscal flow backs to the Exchequer to the costs of ATW. We have attempted to update that figure and our results for this are set out below.
1.13 We also undertake two sensitivity analyses: allowing for substitution effects whereby supported workers may take jobs that would otherwise go to other workers and a stress test of only counting the employment benefits we estimate that ATW generates. In both of these cases, the ratio of benefits to costs stays above one, both for ATW as a whole and for that part of the programme that assists blind and partially sighted individuals.
1.14 We have also calculated the fiscal impact of ATW comparing the costs of the programme against the estimated fiscal flow backs to the public purse in terms of additional tax revenues and reduced benefit expenditure. For ATW as a whole over 2011-12 to 2013-14, the programme is estimated to generate on average £1.14 in fiscal flow backs per £1 spent on the programme. The
6

Access to Work Cost Benefit Analysis
equivalent figure for that part of the programme assisting blind and partially sighted individuals is £0.72. These two figures are an update on the £1.48 flow back for every £1.00 spent as estimated by RNIB in 2004. It should be stressed that these narrow fiscal impact calculations are not the right basis on which to determine whether a public programme represents good value for money. The basis for that decision is our wider cost benefit analysis figures which take account of all potential benefits to society against the programme’s costs. There are after all many public services rightly provided by the state where the costs of doing so outweigh any fiscal flow backs. These are provided because it is judged that their benefits to society outweigh the costs of providing them.
7

Access to Work Cost Benefit Analysis
2 Introduction2.1 Access to Work (ATW) funds support for disabled workers in
order to enable them to continue in or start work. A range of different types of support is eligible for funding including adaptations to work premises, specialist equipment, work related travel costs, and the provision of support workers. It is administered by the Department for Work and Pensions (DWP)
2.2 A long standing figure calculated in 2004 was that ATW achieved a return to the tax payer of £1.48 for every £1 spent on it. This figure has been much quoted. However it is now over 10 years old and its basis remains unclear.
2.3 In addition, the House of Commons Work and Pensions Committee investigated ATW and one of its recommendations was that DWP undertake “a cost benefit analysis of Access to Work expenditure, including its likely long-term impacts on social security expenditure and income tax returns”17. The Royal National Institute of Blind People (RNIB) decided to respond to this recommendation by commissioning the Centre for Economic and Social Inclusion (Inclusion) to undertake this cost benefit analysis of ATW.
2.4 This report is structured as follows. Section 3 provides a literature review of the labour market position, barriers to employment, and employment patterns of blind and partially sighted workers and on ATW in part to help inform our cost benefit analysis as set out in Section 4. Section 5 sets out our conclusions. Appendix 1 sets out our detailed unit cost calculations for blind and partially sighted individuals assisted by ATW for Great Britain and broken down for England, Scotland, and Wales.
17 House of Commons Work and Pensions Committee, “Improving Access to Work for disabled people”, Second Report of Session 2014-15, HC 481, 2014.
8

Access to Work Cost Benefit Analysis
3 Literature ReviewIntroduction
3.1 Unemployment amongst blind and partially sighted people in the United Kingdom remains high. Individuals with sight loss face numerous and complex barriers to employment, and as a result, their role within the labour market differs from the general working population. This poses significant challenges and costs for both the individuals affected and the wider economy. This section provides an overview of the restrictions faced by blind and partially sighted people within the UK labour market and the resulting working patterns, whilst providing the wider context about the role Access to Work plays in widening participation and limiting personal and economic losses. It is intended to provide some context for the cost benefit analysis calculations that follow in section 4. It is not, however, a fully comprehensive or critical review of past literature. Such a review is beyond the scope and budget of this research project.
Labour Market Position of Blind and Partially Sighted People
3.2 In a recent study of data relating to blind and partially sighted people in the United Kingdom, Hewett and Keil (2015) found that the proportion of the working age population who are long term disabled with a seeing difficulty is 0.29% (119,000)18 19. Broken down into age groups, this is 0.18% of 16-25, 0.21% of 26-44, 0.35% of 45-54 and 0.56% of 55-64. Thus the incidence of sight problems rises with age.
3.3 Evidence submitted by the RNIB Group to the Work and Pensions Committee inquiry into ATW in June 2014, provided two estimates of the amount of people living in the UK who are blind
18 Hewett, R and Keil, S. (2015). Investigation of data relating to blind and partially sighted people in the Quarterly Labour Force Survey: October 2010 – September 2014. VICTAR, University of Birmingham and RNIB19 0.29% of the mid-year population estimate for the UK in 2014 (41,036,500) is 119,000.
9

Access to Work Cost Benefit Analysis
or partially sighted20. The lower of the two estimates states there are 80,000 people of working age who are officially registered as blind or partially sighted, whilst the results of a Labour Force Survey study estimates there are 190,000 with a self-reported ‘seeing difficulty’.
3.4 The difference between the two totals should not be interpreted as contradictory. They are the result of different data collection methods. The 80,000 estimate is based on a representative sample of people who are officially registered as blind or partially sighted; this method restricts the estimate to the number of people with ‘severe’ visual impairments and hence excludes those with ‘less severe’ sight difficulties21. Alternatively, the Labour Force Survey relies on self-reported measures by which to identify an individual as being visually impaired and places no basis on the severity of the condition; this method includes a larger group of people including those with lesser sight difficulties.
3.5 Following a review of a range of research, it is evident that individuals with sight loss face a much more restricted labour market and are far less likely than the rest of the working age population to be in employment.
3.6 Hewett and Keil (2015) provide the most recent comparison of labour market outcomes. The report is based upon the Quarterly UK Labour Force Survey from October 2010 – September 2014 which investigated the employment status and economic circumstances of people identifying as being disabled due to a seeing difficulty22. 44.9% of those who are long term disabled with a seeing difficulty were employed, compared to 49.4% of those with other long term disabilities and 78.3% of those with no disabilities. The unemployment rate for those who are long term disabled with a seeing difficulty was 9%, compared to 7.2% of those with other long term disabilities and 5.9% of those with no disabilities.
20 Written evidence submitted by RNIB Group (response to Work and Pensions Committee inquiry into DWP ATW Programme). 19th June 2014.21 Individuals who are registered as blind or partially sighted tend to be those with severe sight loss. 22 Hewett, R and Keil, S. (2015), op cit
10

Access to Work Cost Benefit Analysis
3.7 However, other evidence on the number of blind and partially sighted people both in employment and who are unemployed is not so up to date. In the 2009 report ‘Visually impaired people’s access to employment’ Douglas et al. found that the employment rate amongst the population of working age people registered as blind or partially sighted in Great Britain was 33%23.
3.8 As with the two separate estimates of the population of blind and partially sighted people in the UK, the difference between the 33% employment estimate and 44.9% employment estimate is largely down to the method of data collection and should not be seen as contradictory. Hewett and Keil (2015) provide an employment estimate for the blind and partially sighted population of the United Kingdom, using data collected between October 2011 and September 2014, whilst Douglas et al. (2009) provides an employment estimate using data collected between November 2006 and January 2007.
3.9 The Douglas et al study just covers those who are officially registered as blind or partially sighted. Hence it does not include those who have less severe sight issues and thus have better employment prospects. As a result, its findings show a lower employment rates than Hewitt and Keil (2015) which covers a wider range of people with sight issues.
3.10 Both of these estimates provide a negative picture of the labour market for individuals who are blind or partially sighted, illustrating the fact that those with sight loss are far less likely than the rest of the working age population to be in employment.
3.11 Findings from a 2012 Natcen and RNIB report further demonstrate this, with a third of working age people (31%) with sight loss classified as workless due to sickness or disability and two-thirds of people with sight loss who are employed (64%) reporting restrictions within the labour market24. Compared to those with no impairment, after controlling for age and sex, working age people with sight loss are twice as likely to be
23 Douglas, G, et al. (2009). Visually impaired people’s access to employment. Visual Impairment Centre for Teaching and Research (VICTAR).24 McManus, S and Lord, C. (2012) Circumstances of people with sight loss, Natcen and RNIB
11
Access to Work Cost Benefit Analysis
unemployed and experience inequality in participation with employment.
3.12 These relatively high unemployment figures are less surprising in the context of the wide ranging barriers to employment that people with sight loss face. Flynn and Lord (2015) found a multitude of barriers to employment, which restricted those with sight loss from working25. The main restriction of those surveyed was their health condition/impairment (74% of those surveyed) and disability related reasons (56%). Further to this, 33% of those asked said anxiety and a lack of confidence prevented them from being in work, whilst 25% also said difficulty with transport was a limiting factor (Just 6% of those questioned without impairments said either a lack of confidence or problems with transport had limited their ability to find employment).
3.13 Douglas, et al. (2009) closely examined the factors associated with employment and perceived barriers to employment amongst visually impaired, unemployed individuals26. Of those questioned, 72% said they would still like to work, whilst less than a quarter would not. ‘Within-person’ barriers were a common theme, with over 50% of those questioned listing their visual impairment as a key barrier to work, alongside general health issues (36%) and mobility (21%). Barriers not to do with personal characteristics were also identified, such as the availability of jobs (15%), a lack of training and qualifications (16%), transport-related factors (13%) and the attitudes of employers (12%). Further to this, the authors suggest that the severity of the visual impairment has a significant impact on the prospects of employment, with those who are registered blind, much more likely to be unemployed than individuals who are partially sighted.
3.14 Analysis of the Labour Force Survey by Hewett et al. (2015) found further work limiting factors faced by visually impaired individuals27. These included limited ability for travel, the need for reduced hours, specialist equipment, personal assistance or specific working arrangements in order to fully participate in the labour market. 25 Flynn, K and Lord, C. (2015) Living with Sight Loss: Updating the National Picture. RNIB and NatCen Social Research.26 Douglas, G, et al. (2009), op cit27Hewett, R and Keil, S. (2015). Secondary analysis of the Labour Force Survey (LFS) EU disability module, (Analysis of 2011)
12

Access to Work Cost Benefit Analysis
3.15 Of those with sight as their main difficulty in addition to other health problems 44.9% said sight and their other conditions meant they needed a limited number of hours, 15.4% said their visual impairment was the reason and 4.3% gave the other health condition as the only reason. Meanwhile, 35.1% of those with sight problems as their only condition and 26.7% of the general population required limited hours.
3.16 42.6% of those with sight as their main difficulty as well as other health conditions noted limited travel capability as a barrier to work due to their visual impairment and other condition, whilst 13.4% replied this was due to their sight difficulties alone. This compared to 30.7% of those who were visually impaired and 18% of the general population listing travel as a barrier to work.
3.17 The need for specialist equipment was largest amongst the group with sight as their main difficulty but also with other disabilities (37.1%), compared to 25.7% of those with sight as their only difficulty and 8.6% of the working age population. Similarly, with 31.7% of people with sight as their main difficulty, 19.5% of people with sight as their only difficulty and 7% of the working age population naming the need for personal assistance as a requirement to participate fully in the labour market. Finally, 37.2% of those with sight as their main difficulty, 19.4% of individuals with a visual impairment alone and 11.7% of the working age population, required special working arrangements.
3.18 In their analysis of the in-work support required by those with sight loss, Douglas, et al. (2009) found varying levels and forms of the support required by employees28. Of those questioned, 89% had received some form of support. 61% of had needed time off for medical attention, whilst 33% had been allowed to change their working hours as a result of their condition. Employees were also offered a range of support to aid them, including support from other staff (65%), special aids or equipment (59%), adaptations to their work environment (45%) or specialist services such as reading or clerical support (18%).
3.19 This mix of barriers, which prevent blind and partially sighted individuals fully participating within the labour market, (that consequently reduce employment and participation rates), pose a direct cost to the economy in terms of lost potential output. 28 Douglas, G, et al. (2009), op cit
13

Access to Work Cost Benefit Analysis
Access Economics (2009) calculated the total loss of output to the UK economy, as a consequence of blindness, to be £1.63billion in 2008 prices.29
Employment patterns of blind and partially sighted people
3.20 As a result of the aforementioned barriers to work for blind and partially sighted individuals, there are some contrasts between the work patterns of blind and partially sighted individuals and those with no impairments, which are outlined below.
3.21 In their analysis of the Labour Force Survey (2010-2014) concerning those identifying as disabled due to a visual impairment, Hewett and Keil (2015) found that the majority of people (76.5%) who identified as blind or partially sighted and were in employment, were employed within the private sector30. There was little difference between the proportion of blind and visually impaired individuals employed by the private/public sector, and the proportion of the rest of the population (76.7%). 23.5% of those with sight issues were employed within the public sector, compared to 23.3% of the remaining population.
3.22 Saunders’ (2015) analysis of the job outcomes of recipients of RNIB employment services within Scotland, Northern Ireland and Wales (2011-13) also found that the private sector accounted for a majority of employment for blind and partially sighted individuals31. A more detailed breakdown of the employment sub-sectors found that 41% of new job outcomes were in the private sectors, 46% in the non-profit sector, 11% in the public sector and 2% were in self-employment.
3.23 Both of these studies indicate that the private sector accounts for a majority of the employment for individuals with sight loss. The breakdown of sub-sectors provided by Saunders also suggests that the non-profit sector is a common employment destination for people with sight loss.
29 Access Economics (2009). Future Sight Loss UK 1: Economic Impact of Partial Sight and Blindness in the UK adult population.30 Hewett, R and Keil, S. (2015), op cit31 Saunders, A. (2015). The jobs blind and partially sighted people do. RNIB
14

Access to Work Cost Benefit Analysis
3.24 Hewett and Keil also found that blind and partially sighted people also work in a range of occupations and this pattern of employment shows only marginal differences to the whole working population32. The largest occupational category of individuals with sight loss was ‘associate professional and technical occupations, which accounted for 16% of positions, compared to 14.3% of the general working population. This was followed by professional occupations (15.2% compared to 20.1%), elementary occupations (12.7% compared to 11%), administrative and secretarial occupations (12.4% compared to 10.2%), sales and customer service (10.9% compared to 7.8%), skilled trade occupations (9.4% compared to 11%), management/senior official (8.7% compared to 9.9%), process and machine operatives (7.4% compared to 6.4%) and finally caring and leisure occupations (7.3% compared to 9.3% for the general working population.
3.25 Similarly, Saunders (2015) study of employment for recipients of RNIB employment services within Scotland, Northern Ireland and Wales found similar patterns amongst those with sight issues33. The study found that professional and associate professional occupations made up over 30% of job outcomes. Additionally, administrative and secretarial positions accounted for a large proportion of job outcomes, whilst the percentage of process and machine operatives was also low.
3.26 Evidence on the size of employers of people with sight issues was limited, however Saunders (2015), covering the employment outcomes of those with sight loss after accessing RNIB employment services, found that the majority (56%) of blind and partially sighted people tend to be employed by large organisations (over 250 employees). Over a quarter (26%) were employed by small organisations (between 10 and 50 employees), 10% within medium organisations (between 50 and 250) and 8% were employed by micro organisations (less than 10). Whilst large organisations accounted for the majority of employment outcomes, the role of medium, small and micro organisations has steadily increased. In 2001-2008, less than 15% of those accessing RNIB services were employed by micro, small and medium employers, and this increased to 40% by 2011-2013. This compares to the UK average of 26% of 32 Hewett, R and Keil, S. (2015), op cit33 Saunders, A. (2015), op cit
15
Access to Work Cost Benefit Analysis
employees in micro organisations, 13% being employed by small organisations, 12% within medium organisations and 49% working within large organisations34.
3.27 Hewett and Keil provide an estimate of the amount of people with sight loss on part time contracts. In their investigation of data relating to blind and partially sight people in the Quarterly Labour Force Survey (October 2010-September 2014), it is estimated that 33.5% of the working population of those with sight loss work part time hours. This compared to 32% of those with other disabilities and 23.9% for the working population with no disabilities35.
3.28 In their secondary analysis of the 2011 LFS EU disability module36, which analysed the employment experience of people in the UK who self-identified as having functional limitations to due to their sight loss, Hewett and Keil (2015) found that individuals with sight loss were more likely to be in temporary employment than the working population as a whole37. They estimate that, 10.6% of those with sight loss as their main difficulty alongside other health conditions were in temporary contracts. This compared to 14.6% of those with sight loss as their only disability, and 5.4% of the whole working population.
3.29 Furthermore, Hewett and Keil (2015) found that those with sight loss were also more likely to be self-employed than the working population as a whole. They estimate that 27.6% of people with sight as their main difficulty amongst other disabilities are self-employed, compared to 25.9% of those with sight loss as their only disability and 13.4% of the whole working population.
3.30 Flynn and Lord (2015) found that those with sight loss are more likely to be on low earnings compared to those with no impairments38. It was found that 9% of respondents with sight loss earn more than £500 a week, compared to 25% of respondents with no disabilities. Respondents with sight loss were far more likely to be earning less than £200 a week, nearly 34 Department for Business, Innovation and Skills (2014) Business Population Estimates For The UK and Regions 2014.35 Hewett, R and Keil, S. (2015), op cit36 The EU disability module of the UK LFS is an additional module of questions, standardised for use across the EU, which was attached to the UK LFS survey to focus on those with disabilities based within the labour force. 37 Hewett, R and Keil, S. (2015). op cit38 Flynn, K and Lord, C. (2015), op cit
16

Access to Work Cost Benefit Analysis
half of those surveyed, compared to 33% of those with no impairments. These figures present a less positive picture for the earnings people with sight loss when compared to the Circumstances of People with Sight Loss report by McManus and Lord (2012) which found that previously 13% of those with sight loss earned £500 or more a week. However, the proportion of those earning £200 a week or lower had decreased, from 54% of those previously questioned to 48%39.
3.31 This contradicts findings by Hewett and Keil which state that the gross monthly pay of people with sight loss is at a similar level to that of those without impairments40. In their investigation of the quarterly LFS, it is estimated that 60.7% of those with sight loss earn £1,999.99 or less, compared to 55.4% of those with no impairments. It is worth noting that the reliability of these findings is questioned by the authors due to the low response rate of those questioned. This suggests that the earnings gap found in Flynn and Lord (2015) may be more robust.
Access to Work
3.32 In 1994, in response to the wide range of barriers to work faced by those with disabilities, the Government introduced Access to Work. As explained by Liz Sayce in her 2011 report for the Department for Work and Pensions “Access to Work provides practical advice and support to disabled people and their employers to help them overcome work-related obstacles resulting from disability”41.
3.33 A 2009 DWP core evaluation of Access to Work found a variety of potential benefits for both participants and employers42. Potential benefits for participants from Access to Work include reduced sickness, improved attendance, retained employment, development of working skills, increased income and better health and well being. Gains for employers from Access to Work consist of improved productivity, lower employee turnover, a
39 McManus, S and Lord, C. (2012) op cit40 Hewett, R and Keil, S. (2015)41 Sayce, L. (2011). Disability employment support fit for the future. Department for Work and Pensions.42 Dewson, et al (2009) DWP Evaluation of Access to Work: Core Evaluation. Research Report No. 619
17

Access to Work Cost Benefit Analysis
better understanding of the needs of disabled staff members and the increased well being of staff.
3.34 In the year 2013-14, Access to Work supported 35,450 people with disabilities43. The programme was mainly utilised by people with sensory or physical difficulties. Individuals with hearing loss made up the largest single issue group of Access to Work users, accounting for 16% of the caseload (5,620), whilst 14% of users were blind or partially sighted (5,120). 24% of Access to Work users had physical problems involving their arms, hands, legs, feet, back or neck (8,260). 12% had dyslexia (4,270), whilst 6% had progressive illnesses and a further 5% had learning difficulties (1,760). 4% of users had mental health conditions (1,410) and 3% had epilepsy (1,180). The remaining 16% of users had a variety of other medical conditions which each accounted for 1% or less of total users44.
3.35 The most common types of support provided by Access to Work was support workers (14,850), closely followed by travel to work (13,120) and aids and equipment (5,470)45. Access to Work funds were also available for adaptations to vehicles (200) and work premises (40).
3.36 ‘Evaluating the Impact of Access to Work’ by Thornton and Corden (2002) analysed the different strands of Access to Work and sought to estimate the success of the most common support methods; support workers, travel to work assistance, alterations to premises and specialist aids and equipment46.
3.37 According to those questioned, support workers provided invaluable support to Access to Work users, increasing their capability to work, reducing prejudice within the workplace and contributing to improved health and wellbeing. Without the use of a support worker, many users thought it would make gaining 43 Gifford, G. (July, 2014). Access to Work: Official Statistics. DWP44 Other medical conditions include: unknown, stomach, liver, kidney or digestion problems, heart, blood, blood pressure or circulation problems, chest or breathing, skin conditions or skin disfigurement, difficulty in speaking, diabetes and other. 45 Gifford, G. (July, 2014)46 Thornton, P. and Corden, A. (2002) Evaluating the Impact of Access to Work: A Case Study Approach, Research & Development Report, WAE138, Claimant Unemployment and Disadvantage Analysis Division, Department for Work and Pensions, Sheffield.
18

Access to Work Cost Benefit Analysis
employment impossible, whilst 25% said they would have given up looking for work completely and a further 50% were fairly certain that they would have lost their job as a result of having no support worker. Employers were also very certain that support workers provided enormous value to improving the capabilities of users.
3.38 Likewise, Access to Work users and employers noted similar benefits of the travel to work strand, with benefits including improved health, reduced stress and risk and hence increased concentration and quality of work. Both agreed that travel to work was necessary for the user to continue working, predicting that 25% of users would lose their job as a direct result of losing funding for travel to work due to a lack of feasible alternatives.
3.39 Aids and equipment provided by Access to Work were also viewed as important methods of support which contributed to improved performance at work. Without the support, 33% of users thought it was unlikely they would be able to carry on, whilst employers were more optimistic. Some employers and employees were willing to make contributions towards the cost of equipment, but were concerned that without the expertise and advice of Access to Work in addition to the need to keep costs low, this support would be of a lower quality.
3.40 The use of alterations helped make the workplace more accessible for those with disabilities, particularly those who developed health issues at work rather than disabled people entering work. However, they were not seen as vital by either employers or employees, with some users considering them as a ‘luxury’ which they could carry on without, without any serious implications for their work, health or well-being.
3.41 Thornton and Corden (2002) did not calculate direct quantitative estimates of deadweight for each method of support. However they were able to summarise their estimates, finding deadweight in travel to work was very low, low for support workers and alterations to premises and rather high for aids and equipment.
3.42 Overall, employers were much more optimistic about the capabilities of users remaining in their current positions without the support of Access to Work. Over 50% of employers questioned were sure that their employee would be able to
19

Access to Work Cost Benefit Analysis
continue work without the support, whilst 5% believed their employee would definitely not. This compares to 23% of Access to Work users who believed they would ‘absolutely not’ be in their job without the support, whilst a further 46% believed it was more than ‘halfway likely’ they would not be able to continue without Access to Work.
3.43 Employers stated many reasons they would continue to hire employees with disabilities in the absence of Access to Work. These included their commitment to equal opportunities, in order to retain valued employees, making use of alternative aids or finding other methods to fund substitute support. However they were concerned about the lack of expert support for both employers and employees without Access to Work.
3.44 A DWP evaluation of Access to Work (2009) listed four possible cases of deadweight from the programme47. Their first case was ‘deadweight plus’, whereby in the absence of Access to Work support employers would exceed the support provided. Second, ‘full deadweight’, where employers would have provided the exact same support. Further to this, ‘Partial Deadweight’ where employers would have put some sort of support in place, although this would have been at a lower level. Finally, ‘Full Additionality’ where without Access to Work provision, no support would have been provided in any way.
3.45 The research found no evidence of deadweight plus or full deadweight, but found that partial deadweight was a common theme within Access to Work provision, whilst travel to work support was the closest example to full additionality. Overall, employers would have made support available in most circumstances; although they believed that the quality and availability of this support would be less than currently provided.
3.46 Douglas et al. (2009) investigated the potential of Access to Work amongst individuals with sight loss, finding that 30% of those questioned who were no longer in work believed they may have been able to continue in their role if they had been able to access more support48. Thornton and Corden (2002) state that 45% of users would be unable to continue working without the support of Access to Work49.47 Dewson, et al (2009) op cit48 Douglas, G, et al. (2009) op cit49 Thornton, P. and Corden, A. (2002) op cit
20
Access to Work Cost Benefit Analysis
3.47 Furthermore, the 2011 Sayce Review described the Access to Work scheme as a ‘highly effective and well-liked programme’ which stands out amongst other DWP specialist disability employment programmes50.
50 Sayce, L. (2011) op cit
21
Access to Work Cost Benefit Analysis
4 Cost Benefit AnalysisUnit Costs Introduction
4.1 The official statistics for Access to Work (ATW) provide information on three volume measures of the support offered by the programme for Great Britain: Number of individuals helped via the receipt of an award in
the relevant reporting period Number of individuals benefitting from support in a particular
reporting period. This includes the numbers helped as above plus the number who continue to benefit from an award, or awards, received for special aids or equipment within the two years prior to this reporting period. They are assumed to still be benefiting from this support within this two year period.
The number of awards made in the relevant reporting periods. As an individual can receive more than one award in a reporting period the number of awards is greater than the number of individuals helped (but not necessarily higher than the total number of individuals benefitting in the same reporting period.)
4.2 The official ATW statistics provide only a limited breakdown of these three volume measures:
Number of individuals helped by medical condition
Number of awards by type of support received
4.3 In addition, a freedom of information (FoI) request to DWP in February 2015 from RNIB provided the following additional volume information:
Number of blind / partially sighted individuals helped for the three constituent countries within Great Britain (England, Scotland, and Wales)
22
Access to Work Cost Benefit Analysis
Number of blind / partially sighted individuals benefitting for the three constituent countries within Great Britain (England, Scotland, and Wales)
Number of awards for blind / partially sighted individuals by type of support received for the three constituent countries within Great Britain (England, Scotland, and Wales)
4.4 The official ATW statistics do not contain any information on the costs of providing support. RNIB obtained the following information on costs from a FOI request to DWP in May 2015:
Cost of awards to blind / partially sighted individuals by type of support received for Great Britain, and England, Scotland, and Wales
Cost of awards to all individuals (all conditions) by type of support received for Great Britain, and England, Scotland, and Wales
Cost of awards by medical condition for Great Britain, and England, Scotland, and Wales
4.5 Overall cost and volume data is available for the three financial years: 2011-12 to 2013-14. Hence we can produce estimates of unit costs for these three financial years.
4.6 Given we have three volume measures of the amount of support offered by ATW we can construct three unit cost measures:
Costs / Number of individuals helped
Costs / Number of individuals benefitting
Costs / Number of awards (this is also the average award size)
Unit Cost Estimates for Blind / Partially Sighted Individuals
4.7 The unit cost per blind / partially sighted individual helped is shown in Figure 4.1 for Great Britain as a whole. Provision of a Support Worker is by some margin the category of support with the highest unit costs at around £10,000 per annum for the three financial years 2011-12 to 2013-14. Next most costly in these three financial years are Travel to Work support at around
23

Access to Work Cost Benefit Analysis
£4,000 per person helped and Special Aids and Equipment at around £3,000 per person helped. The overall unit costs across all types of support for blind / partially sighted individuals helped are around £4,500 for2011-12 to 2013-14.
Figure 4.1: ATW unit cost per blind / partially sighted individual helped for Great Britain
£0
£2,000
£4,000
£6,000
£8,000
£10,000
£12,000
2011/12
2012/13
2013/14
Note: The estimates for Adaptations to Premises and Vehicles are based on less than 10 cases. No individuals received support at interview.
4.8 The estimated unit costs per blind / partially sighted individual benefitting (including those deemed to be continuing to benefit from past support received) for Great Britain are shown in Figure 4.2.
Figure 4.2: ATW unit cost per blind / partially sighted individual benefitting for Great Britain
24

Access to Work Cost Benefit Analysis
0
2,000
4,000
6,000
8,000
10,000
12,000
2011/12
2012/13
2013/14
Note: As for Figure 4.1
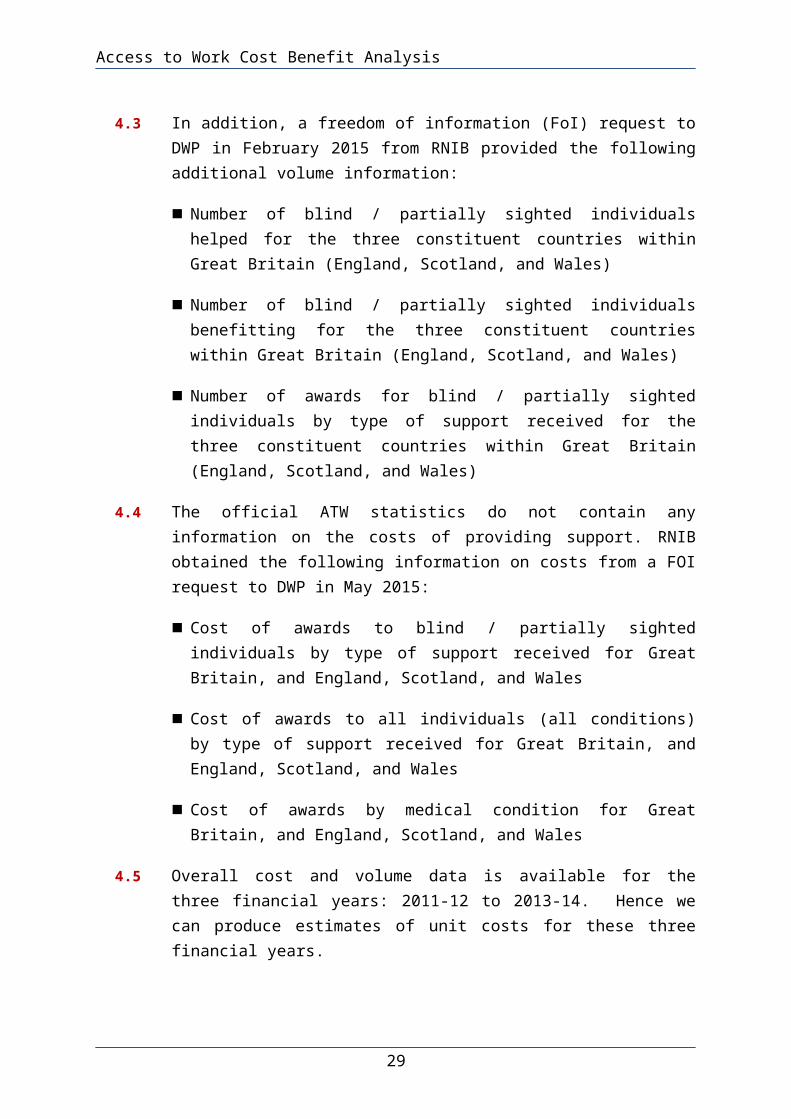
4.9 The unit costs on this basis are lower than per individual helped as the number people benefitting is greater than the number helped in any particular year due to the number of people who deemed to continue to benefit from past support. The pattern is the same as for individuals helped with support workers, travel to work and special aids and equipment being the three categories of support with the highest unit costs. The overall unit costs across all types of support for blind / partially sighted individuals rise from around £3,600 to around £4,000 per annum between 2011-12 and 2013-14.
4.10 Figure 4.3 shows the unit cost per award to a blind / partially sighted individual for Great Britain. The unit costs on this basis are lower than both per individual helped and per individual benefitting as the number of awards exceeds both the numbers of individuals helped and the numbers of individuals benefitting. The pattern is again the same as for individuals helped and individuals benefitting with support workers, travel to work and special aids and equipment being the three categories of support with the highest unit costs. The overall unit costs across all types of support for blind / partially sighted individuals are around £3,200 to £3,300 per annum over the three years 2011-12 t0 2013-14.
Figure 4.3: ATW unit cost per award to a blind / partially sighted individual for Great Britain
25

Access to Work Cost Benefit Analysis
0
2,000
4,000
6,000
8,000
10,000
12,000
2011/12
2012/13
2013/14
Note: As for Figure 4.1
4.11 The above has shown the pattern of unit costs on the three available bases for Great Britain as a whole for blind / partially sighted individuals. We have also calculated the equivalent figures for England, Scotland and Wales. The patterns are very similar to those shown for Great Britain. The figures for England, Scotland and Wales are shown alongside Great Britain in Appendix 1.
Unit Cost Estimates for All Conditions
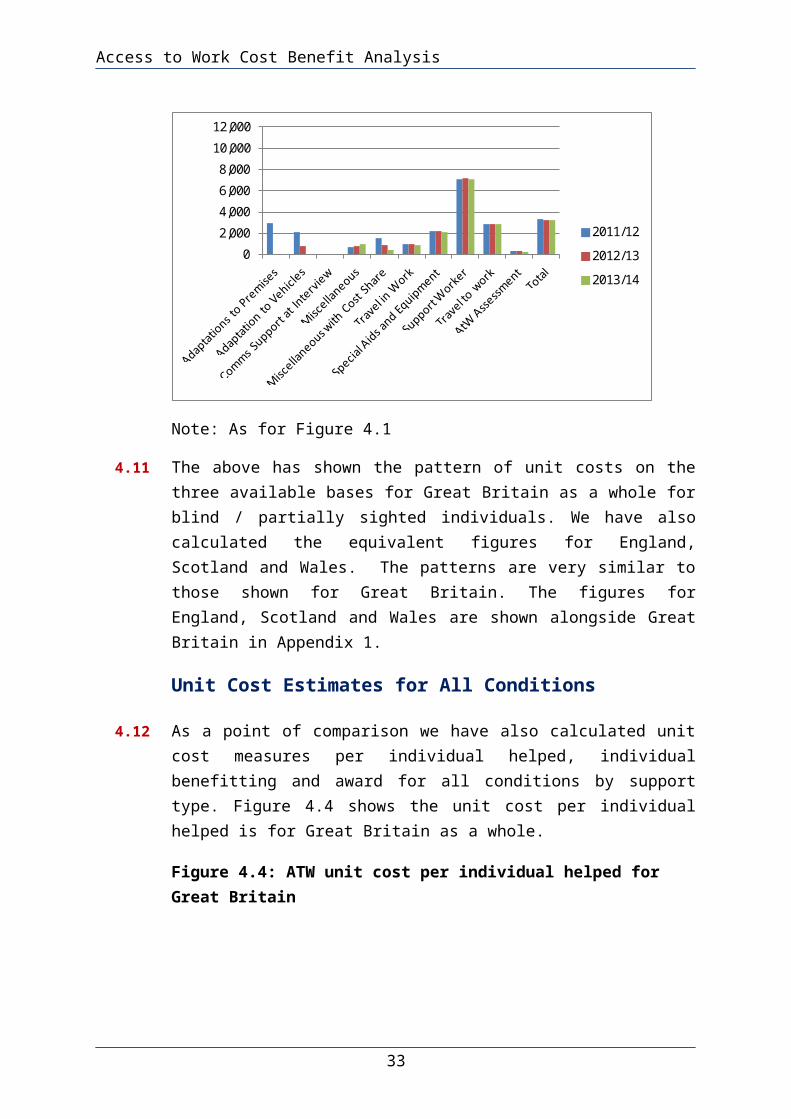
4.12 As a point of comparison we have also calculated unit cost measures per individual helped, individual benefitting and award for all conditions by support type. Figure 4.4 shows the unit cost per individual helped is for Great Britain as a whole.
Figure 4.4: ATW unit cost per individual helped for Great Britain
26
Access to Work Cost Benefit Analysis
£0
£2,000
£4,000
£6,000
£8,000
£10,000
£12,000
2011-12
2012-13
2013-14
4.13 The pattern of unit costs for all conditions is rather different to that for just blind / partially sighted individuals. The unit cost for Adaptations to Premises is the highest across the different support categories in 2011-12 and 2013-14 at around £8,000 and £10,000 per individual respectively. The unit costs for a Support Worker are the second highest amongst all categories of support in 2011-12 and 2013-14 and the highest in 2012-13 at £5,000 to £6,000. Adaptations to Vehicles are also generally a relatively costly form of support across the whole ATW caseload at around £3,000 to £5,000 between 2011-12 and 2013-14. The overall unit costs across all types of support for all conditions are around £3,000 during 2011-12 to 2013-14.
4.14 Unit costs on the basis of individuals benefitting are lower than per individual helped as the number people benefitting is greater than the number helped in any particular year (Figure 4.5). The pattern is the same as for individuals helped with Adaptations to Premises, Support Workers, and Adaptations to Vehicles being the three categories of support with the highest unit costs. The overall unit costs across all types of support for all conditions rose from around £2,000 to £2,500 per annum between 2011-12 and 2013-14.
Figure 4.5: ATW unit cost per individual benefitting for Great Britain
27

Access to Work Cost Benefit Analysis
£0
£2,000
£4,000
£6,000
£8,000
£10,000
£12,000
2011-12
2012-13
2013-14
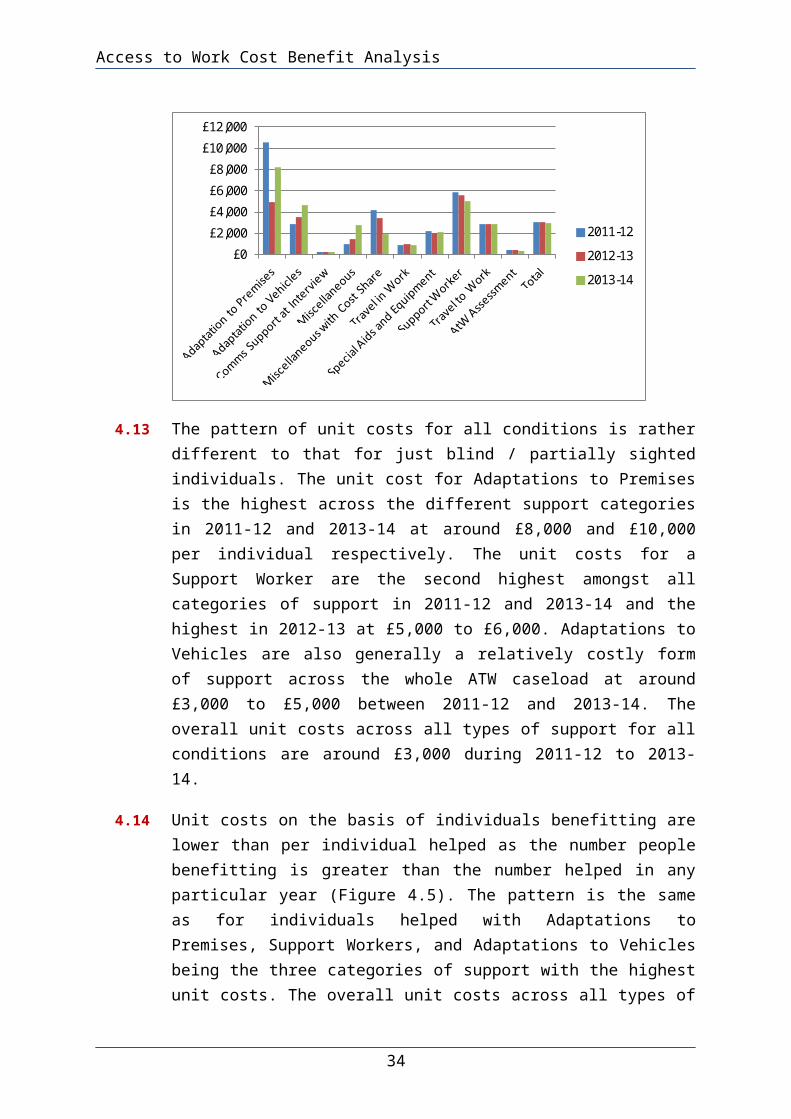
4.15 Figure 4.6 shows the unit cost per ATW award for Great Britain. The unit costs on this basis are lower than per individual helped as each individual helped can receive more than one award in a year.
Figure 4.6: ATW unit cost per award for Great Britain
£0
£2,000
£4,000
£6,000
£8,000
£10,000
£12,000
2011-12
2012-13
2013-14
4.16 The pattern is again the same as for individuals helped and individuals benefitting with Adaptations to Premises, Support Workers, and Adaptations to Vehicles being the three categories of support with the highest unit costs. The overall unit costs across all types of support for all conditions fell from around £2,600 to £2,300 per annum between 2011-12 and 2013-14.
28
Access to Work Cost Benefit Analysis
Unit Cost Estimates by Support Type Compared
4.17 Comparing the unit costs for blind / partially sighted individuals against those for all conditions, as discussed above, it is clear that blind / partially sighted individuals make very little or no use of supports in the form of adaptations to premises or vehicles or communication support at interview and where such support is used the unit cost is lower than for the whole ATW caseload. In contrast, the unit costs for blind / partially sighted individuals for travel in and to work, special aids and equipment, and support workers are higher than for the equivalent support provided to the whole ATW caseload. Overall, across all types of support the unit costs for blind / partially sighted individuals are higher than the equivalent unit costs for people of all medical conditions. In the next section we expand on this comparison by looking at how unit costs vary across the various medical conditions that are supported via ATW.
Unit Costs Compared Across Different Medical Conditions
4.18 The unit costs per individual helped by medical condition for 2011-12 to 2013-14 are shown in Table 4.1. Overall unit costs per individual helped have fallen from around £3,100 to around £2,900 between 2011-12 and 2013-14. People who are deaf or hard of hearing have the highest unit cost of any of the medical conditions, although this unit cost has fallen between 2011-12 and 2013-14 from around £6,600 to around £6,000. Blind / partially sighted people are the group with the second highest unit costs per individual helped at around £4,500. People with cerebral palsy are the group with the third highest unit cost at around £4,200. Unit costs per individual helped were lowest for people with dyslexia and mental health conditions.
Table 4.1: Unit Cost per individual helped by medical condition
29

Access to Work Cost Benefit Analysis
2011-12 2012-13 2013-14Missing/Unknown £190 £105 £533
Arms or hands £1,430 £1,500 £1,495Legs or feet £2,182 £2,229 £2,409Back or neck £1,347 £1,436 £1,454
Stomach, liver, kidney or digestion £1,919 £2,260 £2,275
Heart, blood, blood pressure or circulation £2,579 £2,409 £2,463
Chest or breathing £2,323 £2,655 £2,759Skin conditions and severe
disfigurement £1,630 £1,805 £1,645Deaf and hard of hearing £6,618 £6,368 £5,986
Difficulty in seeing £4,623 £4,545 £4,514Difficulty in speaking £3,514 £2,950 £2,319Learning disability £2,408 £2,413 £2,155Progressive illness £3,061 £3,154 £3,098
Dyslexia £736 £728 £787Epilepsy £2,307 £2,193 £2,347Diabetes £1,829 £1,994 £2,291
Mental health condition £1,168 £1,155 £1,121Cerebral Palsy £4,144 £4,188 £4,261
Spina Bifida £2,548 £2,397 £3,425Other £2,479 £2,520 £2,400Total £3,107 £3,087 £2,929
4.19 The unit costs per individual benefitting by medical condition for 2011-12 to 2013-14 are shown in Table 4.2. Overall unit costs per individual benefitting have increased from around £2,000 to around £2,500 between 2011-12 and 2013-14. Comparing different medical conditions, the patterns are same as for unit costs per individual helped. People who are deaf or hard of hearing, blind / partially sighted people and people with cerebral palsy are again the groups with the highest unit costs and people with dyslexia and mental health conditions are again the two groups with low unit costs.
Table 4.2: Unit Cost per individual benefitting by medical condition
30

Access to Work Cost Benefit Analysis
2011-12 2012-13 2013-14Missing/Unknown £126 £83 £469Arms or hands £947 £1,189 £1,315
Legs or feet £1,445 £1,767 £2,119Back or neck £892 £1,138 £1,279
Stomach, liver, kidney or digestion £1,270 £1,791 £2,002
Heart, blood, blood pressure or circulation £1,707 £1,910 £2,167
Chest or breathing £1,538 £2,104 £2,428Skin conditions and severe
disfigurement £1,079 £1,431 £1,447Deaf and hard of hearing £4,381 £5,048 £5,267
Difficulty in seeing £3,060 £3,603 £3,972Difficulty in speaking £2,326 £2,338 £2,040
Learning disability £1,594 £1,913 £1,896Progressive illness £2,026 £2,500 £2,726
Dyslexia £487 £577 £692Epilepsy £1,527 £1,738 £2,065Diabetes £1,211 £1,580 £2,016
Mental health condition £773 £916 £986Cerebral Palsy £2,743 £3,320 £3,749
Spina Bifida £1,687 £1,900 £3,014Other £1,641 £1,997 £2,112Total £2,055 £2,447 £2,576
4.20 Table 4.3 shows the unit costs per award by medical condition for 2011-12 to 2013-14. Overall unit costs per individual helped have decreased from around £2,600 to around £2,300 between 2011-12 and 2013-14. Comparing different medical conditions, the patterns are same as for unit costs per individual helped and per individual benefitting. People who are deaf or hard of hearing, blind / partially sighted people and people with cerebral palsy are again the groups with the highest unit costs and people with dyslexia and mental health conditions are again the two groups with low unit costs.
Table 4.3: Unit Cost per individual benefitting by medical condition
31

Access to Work Cost Benefit Analysis
2011-12 2012-13 2013-14Missing/Unknown £157 £85 £423
Arms or hands £1,182 £1,209 £1,185Legs or feet £1,804 £1,796 £1,910Back or neck £1,114 £1,157 £1,153
Stomach, liver, kidney or digestion £1,587 £1,821 £1,804
Heart, blood, blood pressure or circulation £2,133 £1,941 £1,953
Chest or breathing £1,921 £2,139 £2,188Skin conditions and severe
disfigurement £1,348 £1,455 £1,304Deaf and hard of hearing £5,472 £5,132 £4,747
Difficulty in seeing £3,822 £3,662 £3,579Difficulty in speaking £2,906 £2,377 £1,839Learning disability £1,991 £1,945 £1,709Progressive illness £2,531 £2,542 £2,457
Dyslexia £609 £586 £624Epilepsy £1,908 £1,767 £1,861Diabetes £1,513 £1,606 £1,817
Mental health condition £966 £931 £889Cerebral Palsy £3,427 £3,375 £3,379
Spina Bifida £2,107 £1,932 £2,716Other £2,050 £2,030 £1,903Total £2,567 £2,488 £2,322
Cost Benefit Analysis: ATW overall
4.21 Our cost benefit analysis is in conformity with the guidance set out in the Treasury’s Green Book51.
Costs
4.22 Data on the costs of ATW are based on the data on the costs of awards for 2011/12 to 2013/14 obtained by RNIB’s Freedom of Information Request to DWP, together with the information
51 https://www.gov.uk/government/uploads/system/uploads/attachment_data/file/220541/green_book_complete.pdf
32
Access to Work Cost Benefit Analysis
provided by DWP to the House of Commons Select Committee’s investigation into ATW. This information is shown in Table 4.4.
Table 4.4: Costs of Access to Work, £ million
2011/12 2012/13 2013/14
Cost of Awards1 95.6 97.3 104.2
Programme Costs2 93.0 96.0 108.0
Adjusted Programme Costs
99.2 100.8 108.0
Administration Costs2 8.0 7.0 7.0
Total Costs 107.2 107.8 115.0
Total Real Costs 111.1 110.0 115.0
Sources: 1. RNIB Freedom of Information Request to DWP. 2. DWP written evidence to the House of Commons Work and Pensions Committee’s investigation into Access to Work.
4.23 The first row of Table 4.4 shows the total cost of awards made under ATW. Logically, this cost must be less than the total programme spend on ATW. However this is not the case for 2011/12 and 2012/13 when these figures are compared against the Programme Spend figures which DWP provided to the House of Commons Select Committee. For 2013/14, the DWP’s total programme spend figures are 3.7% higher than the cost of awards. Hence we adjust the total programme expenditure figures for the previous two years by assuming that programme expenditure other than on awards represents 3.7% of the spending on awards. Figures for administration costs (from DWP’s evidence to the House of Commons Select Committee) are then added onto to these adjusted estimates of the programme costs to provide an estimate of the total cost of ATW. Finally, these costs are put on a real or constant price (2013/14 prices) basis by applying the latest figures for the GDP deflator for 2011/12 to 2013/14.
33
Access to Work Cost Benefit Analysis
Benefits
4.24 ATW provides benefits in two forms: the economic benefits of people being in employment who otherwise would not and the non-employment or wellbeing benefits that flow from these people being in work.
Employment Benefits
4.25 Potentially both those receiving an award in a particular financial year and those continuing to benefit from an award in previous years may have their employment impacted by the help they have received from ATW. The DWP’s official ATW statistics includes information on individuals who they deem to be continuing to benefit each financial year from awards received for special aids or equipment within the two years prior to the relevant reporting period. Hence, we take the number of individuals benefitting from ATW, rather than the number of individuals helped by ATW, as our starting point for calculating the programme’s employment impact. As some of these individuals may have moved out of employment since receiving their award(s), this could be seen as an overestimate of the gross employment effect of ATW. However, against this the two year rule that DWP applies implicitly assumes a very short asset life for special aids and equipment. Hence, it is not clear whether using these figures from the DWP’s official statistics is likely to over or under estimate the employment impact of ATW.
4.26 This number of people who benefit from ATW represents the gross employment impact of the programme. Some of these individuals would have continued to work in the absence of ATW (known as deadweight) either because there are other ways of funding the assistance received from ATW or because the individual could have continued to work in the absence of receiving this help. We denote these two types of deadweight as ‘financial deadweight’ and ‘employment deadweight’. Evidence as to the actual extent of these two types of deadweight is limited. Ideally, we would like to base estimates of deadweight on an explicit counterfactual comparing outcomes for those assisted by ATW with a similar group who are not. Unfortunately, such a counterfactual does not exist. However, both of these types of deadweight were investigated by Thornton and Corden
34

Access to Work Cost Benefit Analysis
(2002)52 and additionally financial deadweight was investigated by Dewson et al (2009)53. Below this evidence is reviewed.
Employment Deadweight
4.27 Thornton and Corden (2002) analysed the potential employment impact of ATW separately for four main types of support:
Support workers;
Travel to Work;
Alterations to Premises; and
Aids and Equipment
4.28 Questions were asked about the chances of being in employment both for the particular job the user was about to start or was already in, and more generally about being in any job. In principle, the latter is what matters for cost benefit analysis when considering the impact of an intervention on society as a whole. However, individuals will inevitably have more information about the particular job or workplace than about their general employment prospects in the absence of support from ATW. Hence responses concerning any job as opposed to their current situation will be more speculative and uncertain. In addition, given the individual’s disability would remain unchanged in any possible alternative job it may well be that this job would also not be possible in the absence of ATW support. For these reasons we take account of responses to questions about both the particular job in question and more generally about being in any job. This approach might lead to some underestimation of employment deadweight, but this risk is balanced by potentially having a less uncertain estimate.
4.29 Thornton and Corden (2002 interviewed 117 users of ATW and 124 employer representatives. Hence some of the disaggregated analysis is based on a relatively small number of responses. We have sought to mitigate against this by considering the responses to all the various questions that relate to the employment impact of ATW and the likelihood of the ATW 52 Thornton and Corden, (2002) “Evaluating the Impact of Access to Work: A Case Study Approach”, 53 Dewson, Hill, Meager and Willison (2009), “Evaluation of Access to Work: Core Evaluation”, DWP Research Report No. 619.
35
Access to Work Cost Benefit Analysis
provided assistance being alternatively funded by either users themselves or their employers.
Support workers
4.30 A number of different questions were asked of individuals receiving support under ATW and their employers about its impact on employment. These covered both the position at the time when applications to ATW were made and the later situation ‘now’. Respondents were asked to provide their likelihood of different outcomes on a scale from 0 to 100. Responses tended to cluster around 0%, 50% and 100%. This may reflect an ‘anchoring’ of responses which is one potential difficulty that research has identified in connection with individuals accurately valuing the goods or services they receive54. However, it is not clear whether such issues are likely to lead to an over or an underestimate of the impact of ATW. From these responses we have calculated estimates of the extent of employment deadweight for support worker assistance using a weighted average of the individual responses on the 0 to 100 scale. These are summarised in Table 4.5.
4.31 This research also noted that employers were rather more positive about the prospects of individuals remaining in work without Access to Work, but noted that “employers aspired out of good will for solutions that may not have been achievable”. Users’ perception of the extent to which they would have been able to remain in work without a Support Worker clearly varied depending on how the question was asked and whether the situation at the time of the application or now was considered. The research noted that many users expressed a strong commitment to work and so a determination to carrying on working at the time of their application even if the support provided by ATW was not forthcoming. However, having experienced continuing to work with the assistance of the Support Worker probably provides a better indication of the extent to which it would have been feasible for supported individuals to carrying on working in the absence of this support. Hence we place greater weight on the questions about the likely outcomes ‘now’ rather than at the point of application. Taking this into account suggests that an assumption of 45% 54 A fuller discussion of these valuation problems can be found in Fujiwara, D. and Campbell, R. (2011), Valuation Techniques for Social Cost-Benefit Analysis.
36
Access to Work Cost Benefit Analysis
employment deadweight is not unreasonable for those individuals assisted by an ATW funded Support Worker, that is: 45% of those supported would have stayed in work in the absence of having a Support Worker to assist them. In addition, all those users who had ever received assistance from a Support Worker via ATW were asked to rate their likelihood of being in their job without ATW as a whole. Based on the responses to this question we estimate employment deadweight at 46%. Hence the assumption we use for employment deadweight for those individuals benefiting from a Support Worker in our cost benefit analysis modelling is kept at 45%.
Table 4.5: Employment deadweight: Support workers under ATW
Respondent Likelihood Question Deadweight estimate (%)
User Taking up new job without Support Worker at application 38
User Giving up work altogether without Support Worker at application 70
User Carrying on working without a Support Worker at application 54
User Losing job now without a Support Worker 51
User Carrying on working without a Support Worker now 35
User Being in the job now without Access to Work 46
Travel to Work
4.32 Again a number of different questions were asked of individuals receiving travel to work support under ATW about its impact on employment. These covered both the position at the time when applications to ATW were made and the later situation ‘now’. Respondents again were asked to provide their likelihood of different outcomes on a scale from 0 to 100. From these
37

Access to Work Cost Benefit Analysis
responses we have calculated estimates of the extent of employment deadweight for travel to work support. These are summarised in Table 4.6.
4.33 Users’ perception of the extent to which they would have been able to remain in work without Travel to Work support again clearly varied depending on how the question was asked and whether the situation at the time of the application or now was considered. For the reasons outlined above, we again place greater weight on the responses that refer to the situation now rather than at the time of application for support. On this basis we conclude that 40% employment deadweight is not an unreasonable assumption to make.
4.34 In addition, all users who had ever received assistance with Travel to Work via ATW, and those who were currently receiving this form of assistance, were asked to rate their likelihood of being in their job without ATW as a whole. Based on the responses to these questions we estimate employment deadweight at 26% and 27% respectively. Given these rather lower estimates of employment deadweight, we use an estimate of 33% for employment deadweight for Travel to Work support in our cost benefit analysis modelling.
Table 4.6: Employment deadweight: Travel to Work support under ATW
Respondent Likelihood QuestionDeadweight estimate (%)
User Taking up new job without Travel to Work support at application 24
UserGiving up work altogether without Travel to Work support at application
73
User Getting another job without Travel to Work support at application 27
User Carrying on in work without Travel to Work support at application 62
User Losing job now 52
38

Access to Work Cost Benefit Analysis
User Being in the job now without Access to Work 26
Alterations to Premises
4.35 Individuals whose employers received assistance with the costs of altering their premises were asked about their likelihood of carrying on in work both at the time of application and at the time of their interview. Views did not differ much between these two questions, and we estimate from the responses that employment deadweight for alterations to premises is around 65%. However, all users whose employers had ever received assistance with Alterations to Premises via ATW, were asked to rate their likelihood of being in their job without ATW as a whole. Our estimate of employment deadweight on the basis of these responses is 37%. Taking these two rather different estimates into account we use an estimate of employment deadweight of 50%.
Aids and Equipment
4.36 Again a number of different questions were asked of individuals receiving aids and equipment to assist them with working from ATW about its impact on employment. These covered both the position at the time when applications to ATW were made and the later situation ‘now’. Respondents again were asked to provide their likelihood of different outcomes on a scale from 0 to 100. From these responses we have calculated estimates of the extent of employment deadweight. These are summarised in Table 4.7.
Table 4.7: Employment deadweight: Aids and Equipment support under ATW
Respondent Likelihood QuestionDeadweight estimate (%)
39

Access to Work Cost Benefit Analysis
User Taking up new job without Aids and Equipment at application 74
User Giving up work altogether without Aids and Equipment at application 85
User Carrying on in work without Aids and Equipment at application 60
User Losing job now without Aids and Equipment 66
User Having to leave job now without Aids and Equipment 74
User Carrying on in work now without Aids and Equipment 41
4.37 Users’ perception of the extent to which they would have been able to remain in work without the Aids and Equipment in place again clearly varied depending on how the question was asked and whether the situation at the time of the application or now was considered. For the reasons we have outlined above, we again place greater weight on the responses that refer to the situation now rather than at the time of application for support. On this basis we conclude that 60% employment deadweight is not an unreasonable assumption to make for Aids and Equipment. In addition, all users who had received Aids and Equipment via ATW, were asked to rate their likelihood of being in their job without ATW as a whole. Our estimate of employment deadweight on the basis of these responses is 53%. Hence, for our cost benefit analysis modelling we use an estimate of employment deadweight of 55%.
Financial Deadweight4.38 Thornton and Corden (2002) analyse the potential for ATW
support to be financed from sources other than ATW, notably either from employers or users themselves, focusing again on four main types of support:
Support workers;
Travel to Work;
Alterations to Premises; and
40

Access to Work Cost Benefit Analysis
Aids and Equipment
Support Workers
4.39 Users were asked to estimate the likelihood of either themselves or their employer being able to pay for the Support Worker at the time the application to ATW was made on a scale from 0 to 100. Using these responses we estimate that users would have been able to pay in around 18% of cases and that the employer would have paid in around 30% of cases. Employers themselves said that they were able to pay in around 42% of cases. On the grounds that employers are better aware of their own possibility of funding the Support Worker than their employees, we use this higher estimate for the capacity of employers to pay for a Support Worker. However, an important caveat mentioned by Thornton and Corden (2002) is that employers may overstate their willingness to pay, in order to be seen in a favourable light. Alternatively, both employers and users have an incentive to understate their willingness to pay if they believe that stating their true willingness will lead to reductions in the support available under ATW. Combining this estimate of employer willingness to pay with that provided by users for themselves suggests that either employers or users themselves would have been willing to pay for a Support Worker (financial deadweight) in 52% of cases.
Table 4.8: Financial deadweight: Support Worker under ATW
Respondent Likelihood QuestionDeadweight estimate (%)
User User paying for support worker at time of application 18
User Employer paying for support worker at time of application 30
Employer Employer paying for support worker at time of application 42
Travel to Work
41

Access to Work Cost Benefit Analysis
4.40 Users were asked to estimate the likelihood of their being able to pay the costs of Travel to Work (taxi fares) both at the time of the application to ATW and when the interview was undertaken (now) on a scale from 0 to 100. Employers were similarly asked their likelihood of being willing to pay for these travel to work expenses at the time of the application to ATW. Using these responses we estimate that users would have paid in around 27% of cases at the time of their application, and this rose to 39% at the time of interview, and that employers would have paid at the time of application in 26% of cases. However, Dewson et al (2009) concluded that travel to work costs were an example of “full (or nearly full) additionality” where full additionality was defined as “support and assistance to customers which would not otherwise have been put in place or funded by employers”. Given this finding we have reduced our estimate of employer willingness to pay travel to work costs to 10%.
4.41 Combining the estimates for users at the time of interview and the adjusted estimate for employer willingness to pay suggests that either employers or users themselves would have been willing to pay the costs of travel to work (financial deadweight) in 45% of cases.
Table 4.9: Financial deadweight: Travel to Work Support under ATW
Respondent Likelihood Question Deadweight estimate (%)
User User paying travel to work costs at time of application 27
Employer Employer paying travel to work costs at time of application 26
User User paying travel to work costs now 39
Alterations to Premises
4.42 It was not considered possible for users to fund adaptations to their employer’s premises. Employers were asked to estimate
42

Access to Work Cost Benefit Analysis
their possibility of paying for these alterations in the absence of ATW. On the basis of their responses we estimate that 62% would have paid for the alteration in the absence of ATW (financial deadweight). However Thornton and Corden (2002) noted that employers were sometimes unclear how the funds required to do this would be found. Hence we have used an estimate of 55% for financial deadweight for alterations to premises.
Aids and Equipment
4.43 Users and employers were asked to estimate the likelihood of their being able to pay the costs of Aids and Equipment both at the time of the application to ATW and when their interview was undertaken (now) on a scale from 0 to 100. In addition, users were asked to assess the likelihood that their employer would have been willing to pay at the time of their interview. From these responses we have calculated estimates of financial deadweight which are shown in Table 4.10. As for financial deadweight more generally, our approach is to base our assumptions on what employers and users say about their ability to pay now. However, Dewson et al (2009) concluded that ‘partial deadweight’, where employers would have funded some support but not to the same extent as ATW, as fairly common, including for aids and equipment. Given this we have reduced our estimate for employers’ willingness to pay to 60% and combined this with the 45% estimate for users’ willingness to pay now. This gives an overall financial deadweight of 78%.
Table 4.10: Financial deadweight: Aids and Equipment under ATW
Respondent Likelihood Question Deadweight estimate (%)
User User paying for aids and equipment at time of application 30
Employer Employer paying for aids and equipment at time of application 78
User User paying for aids and equipment, now 45
User Employer paying for aids and 44
43
Access to Work Cost Benefit Analysis
equipment, now
Employer Employer paying for aids and equipment, now 70
Other types of ATW support
4.44 ATW provides support other than the four categories discussed above. Hence we also need assumptions for employment and financial deadweight for these types of support. Thornton and Corden (2002) asked users to rate their likelihood of being in work without ATW. Based on the responses from all users regardless of what type of support they received from ATW we estimate employment deadweight to be 43% and we use this estimate in our cost benefit analysis modelling for all types of support other than the four we have discussed in detail above. For financial deadweight we note that Dewson et al (2009) concluded that ‘partial deadweight’ is fairly common and so assume financial deadweight of 55%.
Overall Deadweight
Table 4.11 summarises the estimates for employment and financial deadweight that we have outlined above together with what these imply for overall additionality55 of the different types of support available under ATW.
Table 4.11: ATW Deadweight and Additionality
Type of support
Employment deadweight (A)
Financial deadweight (B)
Overall additionality =(1-A) x (1-B)
Adaptation to premises 50% 55% 23%
Aids and equipment 55% 78% 10%
Support 45% 52% 26%
55 We assume that employment and financial deadweight are independent of each other. We have no information about the relationship between these two types of deadweight so this is the most sensible assumption to make.
44

Access to Work Cost Benefit Analysis
worker
Travel to work 33% 45% 37%
All other 43% 55% 26%
Net employment
4.45 As discussed our estimate of the gross employment benefits from ATW is the number of individuals benefitting from its support. These are shown in Table 4.12. These are then combined with the estimates for overall additionality shown in Table 4.11 to give our estimates of the net employment benefits of ATW which are shown in Table 4.13.
Table 4.12: Numbers benefitting from / gross employment impact of ATW
Type of support 2011-12 2012-13 2013-14
Adaptation to premises 50 41 36
Aids and equipment 4,083 4,313 5,182
Support worker 14,610 12,948 13,402
Travel to work 14,972 12,257 11,824All other 12,824 10,182 9,986Total 46,540 39,740 40,430
Table 4.13: Net employment impact of ATW
Type of support
2011-12 2012-13 2013-14Adaptation to premises
11 9 8
Aids and 404 427 513
45
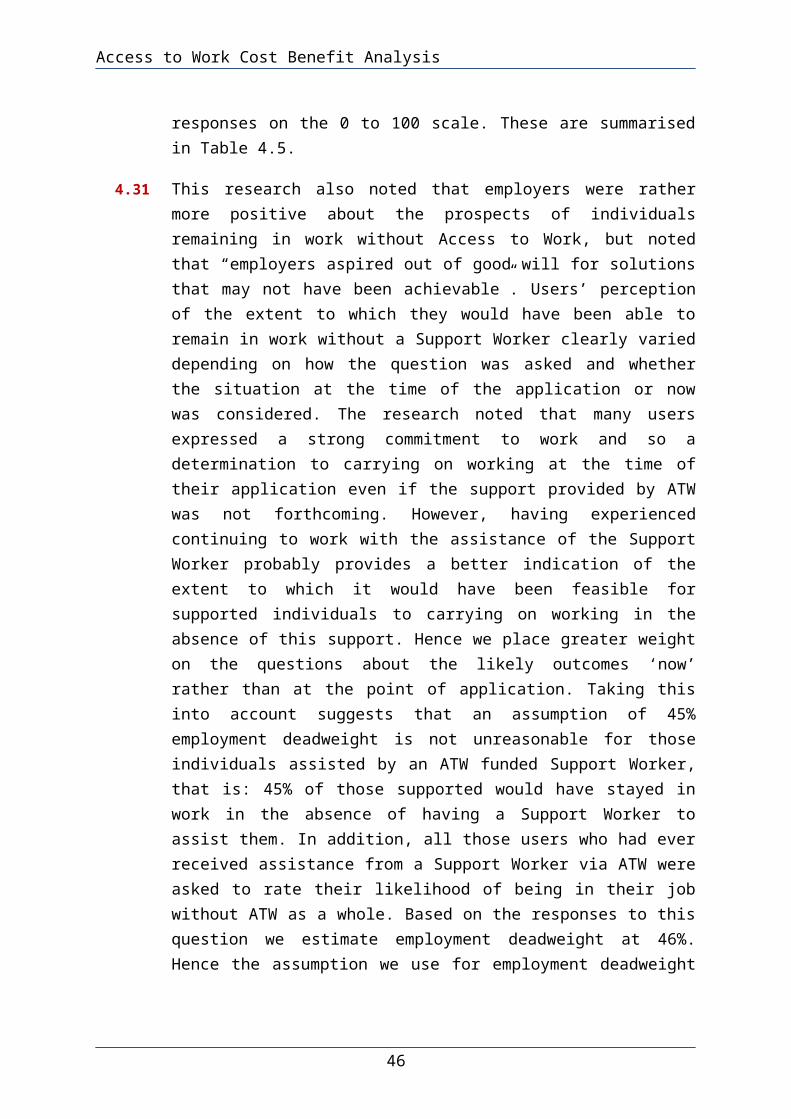
Access to Work Cost Benefit Analysis
equipment
Support worker
3,822 3,387 3,506
Travel to work 5,507 4,508 4,349
All other 3,289 2,612 2,561
Total 13,034 10,943 10,937
4.46 Overall the total net employment effect of ATW shown in Table 4.13 is slightly over a quarter of the size of the gross employment effects.
Value of the net employment benefits
4.47 In order to compare these net employment benefits against the costs of ATW we need to value them in monetary terms. In order to do this we need to estimate the number of hours these individuals work and the hourly pay they receive. Ideally, we would like to have information on these factors which is specific to those assisted by ATW. However, such information is not available from DWP’s official statistics on ATW and has also not been investigated by past studies. Hence we use reasonable assumptions based on other research and available statistical sources.
Working patterns of ATW beneficiaries
4.48 Our literature review reported that 33.5% of people with sight loss and 32.0% of those with other disabilities work part-time56. Hence we use these proportions to estimate the breakdown of the total net employment effect shown in Table 4.13 into part-time and full-time employment. This breakdown is shown in Table 4.14. This table also shows the median weekly working hours for part-time and full-time workers for 2011-12 to 2013-14 based on data from the Annual Survey of Hours and Earnings (ASHE).
56 Taken from Hewett and Keil (2015).
46
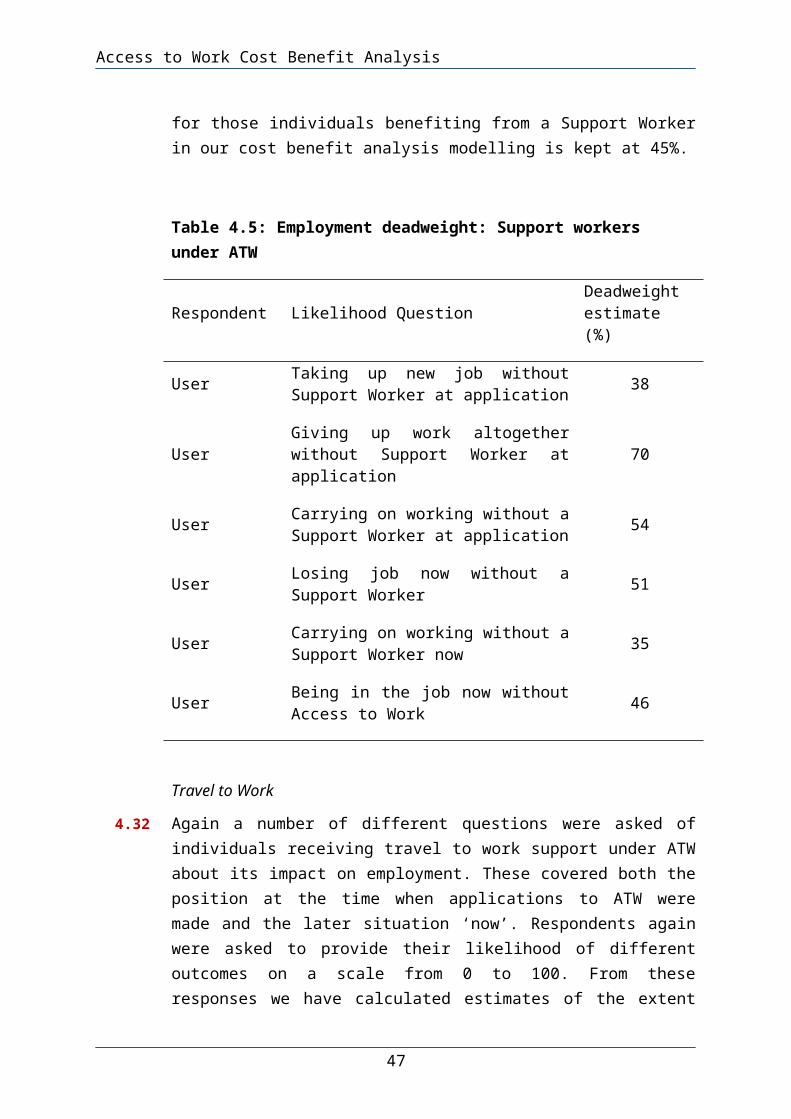
Access to Work Cost Benefit Analysis
Table 4.14: Net employment effect of ATW pat-time and full-time jobs and average weekly hours
2011-12 2012-13 2013-14Full time jobs 1,175 1,112 1,101
Part time jobs 592 560 555
Full-time weekly hours 37.5 37.5 37.5
Part-time weekly hours 18.8 18.8 18.8
Hourly Pay
4.49 Recipients of ATW are very largely in work (the rest are about to take up work). Hence we use estimates of median hourly earnings rather than entry level earnings. Occupation is a strong determinant of pay levels and our literature review showed that disabled workers are spread across occupations in a similar way to non-disabled workers. Hence their median hourly pay levels are likely to be similar to those for workers as a whole taken from ASHE data. However, we should adjust these general median hourly pay figures for any differences on average between the characteristics of disabled and non-disabled workers that could impact on pay levels.
4.50 Economists have traditionally argued that unadjusted pay gaps between two groups (e.g. men and women) and in our case disabled and non-disabled workers reflect a combination of differing average characteristics between the two groups and employer discrimination. Statistical methods are then used to identify the adjusted wage gap between the two groups in question, which controls for differences in characteristics and so should reflect just discrimination. Hence the difference between estimates of the unadjusted and adjusted wage gaps should reflect differences in characteristics.
4.51 Metcalf (2009)57 reviews the evidence on pay gaps including for disabled workers. She reviews seven studies for men and six 57 Metcalf (2009), “Pay gaps across the equality strands: a review”, Equality and Human Rights Commission, Research Report 14.
47

Access to Work Cost Benefit Analysis
studies for women which estimate unadjusted and adjusted pay gaps for disabled workers. The median difference between these measures of the pay gap is -2% and the average for men (excluding one study whose results are well out of line with the others) and for women is -3%. Hence we adjust the overall median pay data for all workers down by 2.5%. The resulting median hourly pay data is shown in Table 4.1558.
Table 4.15: Median hourly pay: Disabled workers
Median Hourly Pay 2011-12 2012-13 2013-14
Part-time £7.80 £7.94 £8.10Full-time £12.42 £12.66 £12.81
4.52 We can now calculate the total employment benefits per annum of ATW by combining the net employment effects with the median hourly pay and median weekly hours we have set out above and multiplying by 52 to convert from a weekly to a yearly basis. This approach assumes that people assisted by ATW are in work for a full year. One objection to this assumption is that individuals might receive help part way through the financial year and so cannot be in work for the full year as a result of ATW. In this case, part of the employment benefits should be counted in the next financial year. Otherwise someone who, for example, receives assistance on the last day of a financial year would be assumed to benefit for just one day. This more complicated approach would lead to slightly lower benefits once discounting of benefits to a net present value is undertaken. However as this cost benefit analysis of ATW is over just three financial years this would not have a significant impact on the results. Given we do not have precise information on the within year timing of awards we make a simpler assumption. Another potential objection relates to the fact that people flow in to and out of jobs all the time. Thus over a year not everyone who starts in employment will remain in employment for the whole time. Based on ONS labour market flows data we estimate that on average someone who starts a year in work will spend around 58 DWP have commented that women make up the majority of the recipients of ATW assistance. We would have liked to have taken account of gender differences in pay in the same way as we have for disability. However, this would have required more detailed information on the gender split of ATW recipients than is available from the DWP’s official statistics.
48
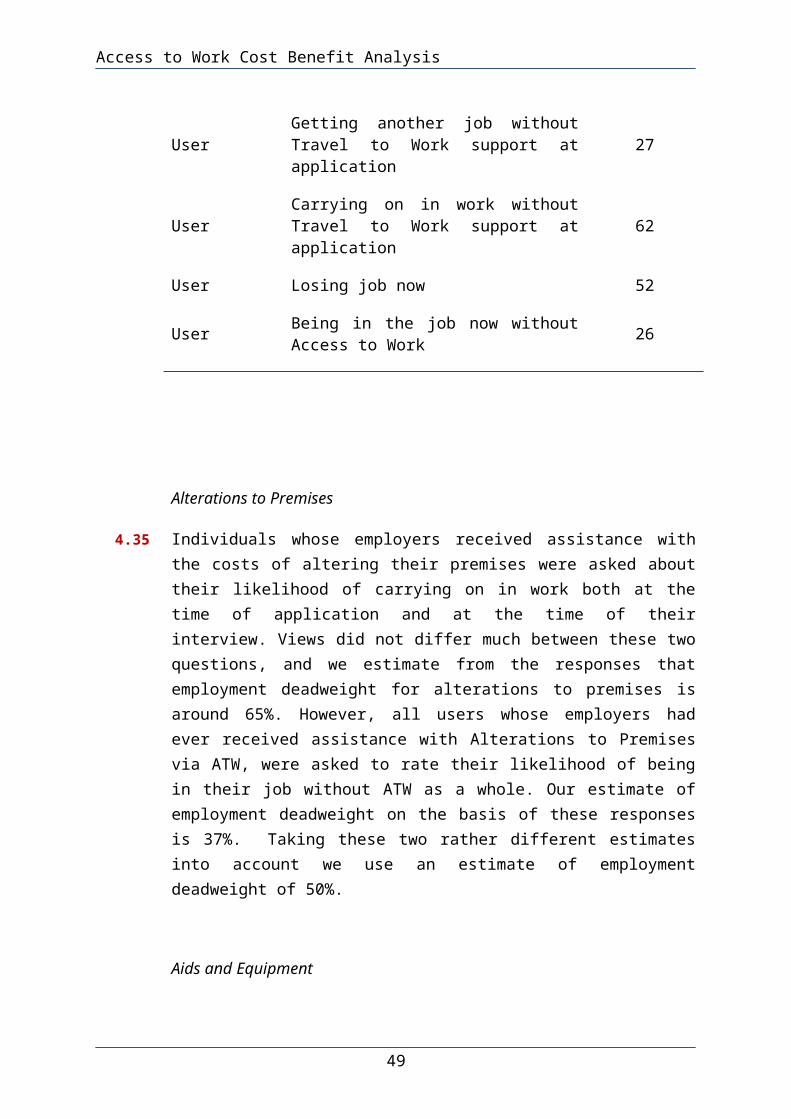
Access to Work Cost Benefit Analysis
95% of that year in employment. Hence allowing for this effect might reduce our estimated employment benefits by around 5%. However, in the balance against such a reduction it should be noted that our calculations only estimate employment benefits for the three years we have information on ATW for. Hence we do not take account of any longer term impacts of ATW. Labour market research has long recognised that current labour market outcomes can have important longer lasting effects, e.g. the ‘scarring effects’ of unemployment. Hence a programme like ATW which increases labour market attachment is likely to have longer lasting impacts which we do not take account of in our cost benefit analysis. The results of our approach are shown in Table 4.16.
Table 4.16: Total employment benefits of ATW
2011-12 2012-13 2013-14
Full-time workers
£214.2m £183.3m £185.5m
Part-time workers
£31.9m £27.3m £27.8m
Total £246.1m £210.6m £213.3m
4.53 Some argue that the value of foregone leisure time should be deducted from the employment benefits of interventions. The DWP social cost benefit analysis framework does not support including the loss of leisure time in cost benefit analyses of labour market programmes. This is on the grounds that being in work also has positive impacts on individuals’ levels of wellbeing and that the value of these is expected to outweigh that from the loss of leisure. In addition, there is considerable evidence that unemployed people do not value time not working positively as leisure. For example, valuing training or other activities in part because they relieve the boredom of being unemployed and provide opportunities to end their social isolation. While it is reasonable to take into account the cost of the loss of leisure time when someone in employment undertakes extra working hours, it is not reasonable to do so when someone moves from worklessness into employment.
49

Access to Work Cost Benefit Analysis
Non-Employment Benefits
4.54 Guidance on valuing wellbeing effects was included in the Treasury Green Book in 2011. Their valuation is challenging but, as the Green Book argues, is essential to a full assessment of the benefits of social and employment interventions. Our assessment of non-employment benefits that flow from ATW are based on a model designed by Manchester New Economy. This model sits alongside the overall Treasury guidance on cost benefit analysis set out in the Green Book. The model is designed for commissioners, performance officers, finance officers and practitioners to understand the value for money of public services. The model allows the estimation of the overall public value (total socio-economic benefits) created by a programme and the individual elements of overall public value, including economic benefits and wider social welfare/wellbeing benefits. For ATW we use this model to derive estimates of:
Increased confidence / self-esteem
Reduced isolation
Positive functioning (autonomy, control, aspirations)
Emotional well-being
4.55 In order to allow comparisons to be made between different interventions, a common framework for benefits has been developed in the Manchester model. Many social outcomes impacting on individuals affect their wellbeing. The Manchester cost benefit analysis (CBA) model draws on the wellbeing model developed by the Centre for Wellbeing, using their National Accounts of Well-being59 framework. The National Accounts of Well-being approach attempts to measure the wellbeing of the population, and its format is based on the well established system of national accounts that are used for measuring economic activity.
4.56 The Manchester CBA model takes one monetisation approach which is applied to the wellbeing outcomes drawn from the National Accounts of Well-being framework, and also draws on other sources for other more specific health and wellbeing benefits.59 New Economics Foundation, (2009) National Accounts of Well-being
50

Access to Work Cost Benefit Analysis
4.57 Mental health forms a significant part of individual wellbeing, and approaches from health economics that have been applied to mental health can be used to produce monetary valuations of changes in wellbeing60.
4.58 The Manchester model apportions individuals’ willingness to pay (value) to avoid the impact of depression (£35,400 per annum) across all the components of wellbeing as set out in the National Accounts of Wellbeing. The result is divided between different domains of wellbeing in the model as shown below:
Increased confidence / self-esteem £3,500Reduced isolation £8,500Positive functioning (autonomy, control, aspirations) £3,500Emotional well-being £3,500
4.59 The remainder (for vitality, satisfying life, trust and belonging) are not used within the Manchester model. This methodology forms part of official government guidance on cost benefit analysis and is recommended by the National Audit Office.
4.60 The resulting estimates of applying this approach to Access to Work are shown in Table 4.17 below.
Table 4.17: Non-employment benefits of Access to Work2011-12 2012-13 2013-14
Increased confidence / self-esteem £43.8m £36.7m £36.7mReduced isolation £106.3m £89.1m £89.1mPositive functioning (autonomy, control, aspirations)
£43.8m £36.7m £36.7m
Emotional well-being £43.8m £36.7m £36.7mTotal £239.0m £200.6m £201.1m
60 Centre for Mental Health, The economic and social costs of mental illness, June 2003, updated October 2010
51

Access to Work Cost Benefit Analysis
Total benefits4.61 Having estimated both the employment and non-employment
benefits of ATW we can now combine these to give the total socio-economic benefits of ATW and adjust for inflation using the latest figures for the GDP deflator to put these benefits on a real or constant price (2013/14 prices) basis. These are shown in Table 4.18 below.
Table 4.18: Total benefits of ATW2011-12 2012-13 2013-14
Total Benefits £485.1m £411.1m £414.4mTotal Real Benefits £503.1m £419.6m £414.4m
Comparing costs and benefits
4.62 We can now bring the estimated costs and benefits together and calculate the net present value of the programme and the benefit to cost ratio. In line with the Treasury Green Book we discount the costs and benefits (in real terms) to a common year using a real discount rate of 3.5% per annum, in this case 2011-12 which is the first date of our analysis as is standard for calculating net present values. Table 4.19 shows that the overall net present value (NPV) of ATW is estimated to be around £960 million and the ratio of benefits to costs is 3.86, that is every £1 spent on ATW is estimated to generate £3.86 of overall economic and social benefits.
52
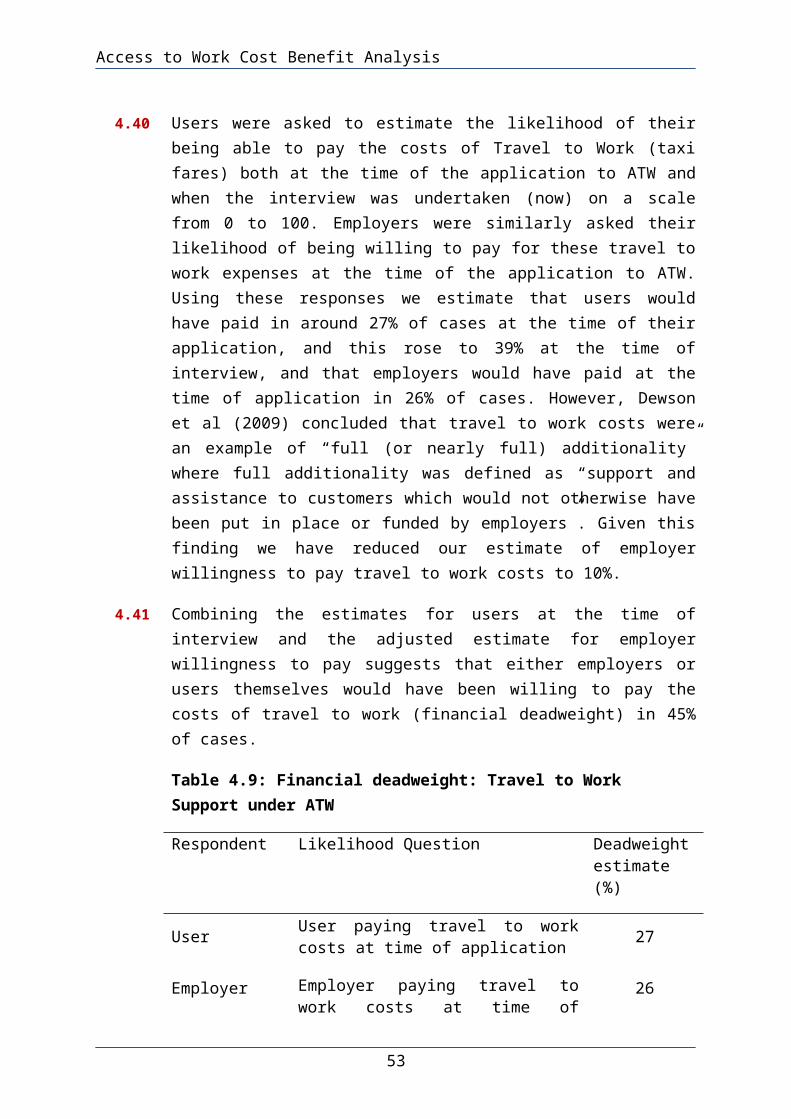
Access to Work Cost Benefit Analysis
Table 4.19: Net present values (NPVs)
Benefits (1) £1295.4mCosts (2) £336.0mOverall (1 - 2) £959.4mBenefit to cost ratio (1/2) 3.86
4.63 This calculated return to spending on ATW is not the same as the fiscal flow backs that result from ATW. Our estimates for that are discussed later. First, we repeat this analysis for just that part of the ATW programme which supports blind and partially sighted individuals.
Cost Benefit Analysis: ATW for blind and partially sighted individualsCosts
4.64 Data on the costs of that part of ATW that benefit blind and partially sighted individuals for 2011/12 to 2013/14 is taken from the RNIB’s Freedom of Information Request to DWP. In line with our approach to estimating the costs of ATW as a whole we assume that other programme costs amount to 3.7% of the cost of awards. Similarly, we assume that the administration costs are in proportion to those for ATW as a whole and so represent 8.1%, 6.9% and 6.5% respectively of programme costs in 2011-12, 2012-13, and 2013-14. These cost estimates are shown in Table 4.20, together with the total costs in real terms (2013/14 prices) calculated using the latest estimates for the GDP deflator.
Table 4.20: Costs of Access to Work for blind and partially sighted individuals, £ million
2011/12 2012/13 2013/14
Cost of Awards £22.4m £22.2m £23.2m
Programme Costs
£23.2m £23.0m £24.1m
Administration Costs
£1.9m £1.6m £1.6m
Total Costs £25.1m £24.6m £25.6m
53
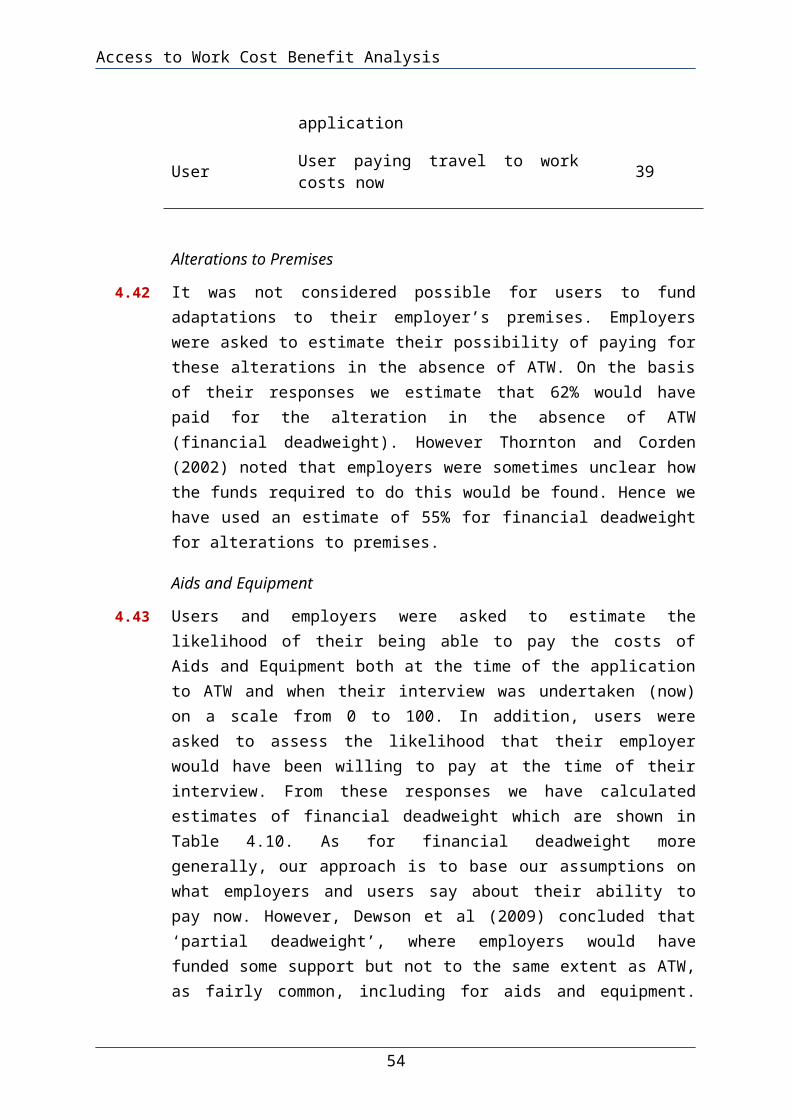
Access to Work Cost Benefit Analysis
Total Real Costs
£26.0m £25.2m £25.6m
Employment benefits
4.65 As for ATW as a whole we take the number of blind and partially sighted individuals benefitting from ATW as the gross employment effect of the programme. These are then adjusted using the same estimates for employment and financial deadweight as discussed earlier which are used for ATW as a whole and which are summarised in Table 4.11. Table 4.21 shows these gross and net employment impacts of ATW for blind and partially sighted individuals.
Table 4.21: Gross and net employment impacts of ATW for blind and partially sighted individuals
2011/12 2012/13 2013/14
Gross impacts 6,150 5,820 5,790
Net impacts 1,767 1,672 1,655
4.66 We then use the same assumptions for full-time / part-time status, weekly working hours and hourly pay rates as for ATW as a whole in order to calculate the monetary value of these net employment impacts. The resulting estimates of the employment benefits are shown in Table 4.22.
Table 4.22: Total employment benefits of ATW for blind and partially sighted individuals
2011-12 2012-13 2013-14
Full-time workers
£28.4m £27.4m £27.5m
Part-time workers
£4.5m £4.3m £4.4m
Total £33.0m £31.8m £31.9m
54

Access to Work Cost Benefit Analysis
Non-Employment Benefits
4.67 Our assessment of non-employment benefits that flow from ATW for blind and partially sighted individuals are again based the Manchester New Economy model. We again use this model to derive estimates for ATW as it assists blind and partially sighted individuals of:
Increased confidence / self-esteem
Reduced isolation
Positive functioning (autonomy, control, aspirations)
Emotional well-being
4.68 These estimates are shown in Table 4.23 below.
Table 4.23: Non-employment benefits of Access to Work for blind and partially sighted individuals
2011-12 2012-13 2013-14Increased confidence / self-esteem £5.8m £5.5m £5.3mReduced isolation £14.1m £13.3m £12.9mPositive functioning (autonomy, control, aspirations)
£5.8m £5.5m £5.3m
Emotional well-being £5.8m £5.5m £5.3mTotal £31.5m £29.7m £28.8m
Comparing costs and benefits
4.69 We can now bring these estimated costs and benefits together and calculate the net present value and the benefit to cost ratio of that part of ATW which assists blind and partially sighted individuals. In line with the Treasury Green Book we discount the costs and benefits (in real terms) to a common year, in this case 2011-12, which is the first date of our analysis as is standard for calculating net present values. Table 4.24 shows that the overall net present value (NPV) of that part of ATW that assists blind and partially sighted individuals is estimated to be around £184.2 million and the ratio of benefits to costs (BCR) is 2.48, that is
55

Access to Work Cost Benefit Analysis
every £1 spent on blind and partially sighted individuals via ATW is estimated to generate £2.48 of economic and social benefits.
Table 4.24: Net present values (NPVs)Benefits (1) £184.2mCosts (2) £74.2mOverall (1 - 2) £109.9mBenefit to cost ratio (1/2) 2.48
4.70 Again it should be stressed that this calculated return to spending on ATW for blind and partially sighted people is not the same as the fiscal flow backs that result from such ATW spending. Our estimates for that are discussed later. Next we set out some sensitivity analyses.
In work costs and multipliers
4.71 The DWP's social cost benefit analysis framework notes that there are certain costs that individuals in work incur and focuses in particular on travel to work and child care costs. Taking account of these costs when they are borne by the individuals in employment gives a more accurate assessment of the net benefits of employment to the individuals affected. While accepting this, we argue that if account is to be taken of these costs, then account should also be taken of the benefits that such expenditures generate in terms of additional employment in the transport and child care sectors as part of wider multiplier effects. Multiplier effects quantify the additional economic activity (e.g. jobs) generated by an intervention’s direct benefits. They take two forms: an income (or induced) multiplier from the additional spending of those employed as a consequence of the intervention and a supply chain (or indirect) multiplier from the additional purchases by organisations from suppliers as a result of the intervention. We have not included multiplier effects in our cost benefit analysis because while they are not recommended by the DWP’s social cost benefit analysis framework they are included in the Treasury's Green Book which provides the overarching official guidance on cost benefit analysis methodology. The inclusion of in-work costs in the absence of also including multiplier effects, would produce an unbalanced estimate of the costs and benefits of ATW, so we include neither.
56

Access to Work Cost Benefit Analysis
If both were included then this would increase the magnitudes of the net present values and benefit to cost ratios of ATW and that part of ATW which assists blind and partially sighted individuals.
Sensitivity analysis
4.72 The DWP social cost-benefit analysis framework suggests that allowance for substitution effects are included as a sensitivity analysis within cost benefit analysis, and that benefits be reduced by 20% in order to do so, as ATW is a supply side programme which increases the supply of labour available to employers. Substitution effects occur where participants in a programme take jobs that individuals outside of the programme would otherwise have held. Table 4.25 shows the results of this sensitivity analysis on the NPV and BCR for both ATW as a whole and that part of the programme which assists blind and partially sighted individuals. Even with substitution effects included the NPVs are substantially positive and the BCRs are well in excess of one.
Table 4.25: Allowing for Substitution EffectsNPV BCR
ATW overall £700.3m 3.08
ATW (blind and partially sighted individuals) £73.1m 1.99
4.73 The DWP social cost benefit analysis framework argues that a sensitivity analysis should be undertaken to allow for what it calls the Social Cost of Exchequer Finance which is more usually referred to by economists as the deadweight cost of taxation. This deadweight cost reflects the fact that the funds required to support public interventions have to be raised by taxation. Taxation imposes distortions or economic costs, for example, income taxes will reduce the return to individuals of working and so leads to a reduction in labour supply and consequently economic output. These deadweight costs are normally measured as a percentage of the revenue that has to be raised to meet the costs of an intervention. The DWP social cost benefit analysis framework recommends using a figure of 20%.
57

Access to Work Cost Benefit Analysis
4.74 In contrast with the DWP guidance, the Treasury’s Green Book is silent on the issue of the deadweight cost of taxation. The principal author of this report has previously discussed this issue with Treasury officials. The usual Treasury approach is not to include the deadweight costs of taxation in cost benefit analyses. This is on the grounds that if funds are not spent by a department on one programme then they will be spent on another and so the overall level of public spending will not change and so the overall level of the deadweight costs of taxation will not change either. The demand led nature of ATW lends weight to this usual Treasury view as if ATW is higher (or lower) than assumed by DWP for their internal financial planning purposes then presumably the level of other spending will be reduced (increased) to keep DWP spending within their overall budget.
4.75 Hence we do not undertake a sensitivity analysis to allow for the deadweight costs of taxation. It is worth noting that were we to do so using the 20% figure recommended by DWP then the result would be to reduce the benefit to cost ratios for ATW as a whole and for that part which assists blind and partially sighted individuals to 3.21 and 2.07 respectively. Hence even if this sensitivity analysis were undertaken then it would not invalidate our conclusions that the benefits of ATW exceed its costs by a considerable margin.
4.76 A very testing stress test for our cost benefit analysis would be to take a narrow view of its benefits and include only our calculated employment benefits and ignore the wider social and wellbeing impacts. The results of this stress test are shown in Table 4.26. Again the NPVs remain positive and the BCRs above one.
Table 4.26: Stress test, including only employment benefits
NPV BCR
ATW overall £326.0m 1.97
ATW (blind and partially sighted individuals) £21.1m 1.28
58

Access to Work Cost Benefit Analysis
Capping Access to Work
4.77 From October 2015, changes to Access to Work will mean that it only provides awards up to a limit set at one and half times average salary (£40,800 per person per year at October 2015). This figure will be uprated annually in line with the increases in average wages. DWP’s equality analysis of this change61 concluded that this change would reduce the costs of the programme by 3% and the number of people benefiting by 0.5%. Using these figures we can estimate the potential impact that such a cap would have had on the results of our cost benefit analysis results if it had been in place from 2011/12 to 2013/14. Our results indicate that the cap might be expected to lead to slightly higher positive NPVs and slightly higher BCRs.
Table 4.27: Impact of the cap on ATW
NPV BCR
ATW overall £963.0m 3.96
ATW (blind and partially sighted individuals) £111.3m 2.55
Fiscal Impacts
4.78 As well as calculating the full costs and benefits to society, we have also looked at the narrower question of how the fiscal flow backs from the programme in terms of higher taxes and lower benefit payments compare with the costs to the exchequer. To fully address the issue of fiscal flow backs would require detailed information on the differing wage levels that ATW recipients receive in work, and their personal and household circumstances in order to assess what types and levels of out of work support they would be entitled to, if they were out of work rather than employed, and what in work tax credit support they are entitled to. This information is not available so we have use a broad brush approach. Hence the results of our calculations are subject
61 DWP (2015), “Equality analysis for the future of Access to Work.”
59

Access to Work Cost Benefit Analysis
to a greater degree of uncertainty than is the case for our main cost-benefit analysis results above.
Direct Taxes
4.79 We estimated that ATW increased the number of disabled people who would be in work (our estimates of the net employment effects). For these people their incomes will be higher because they are working and in receipt of wages rather than out of work benefits. Hence income tax, employee national insurance and employer national insurance receipts will be higher as a consequence.
4.80 Based on the Office for Budget Responsibility (OBR)’s July 2015 Economic and Fiscal Outlook income tax receipts and employee national insurance contributions receipts amounted to 23% of total wages and salaries in the economy in 2014-15. Similarly, the ratio of receipts from employers’ national insurance contributions to total wages and salaries in the economy in 2014-15 was 7%. Hence we use these ratios to estimate the additional direct taxes that flow back to the exchequer as a result of ATW.
Indirect Taxes
4.81 In addition to direct taxes, those who have higher incomes as result of being in work due to the support provided by ATW will spend more and so generate additional VAT and other indirect tax receipts (such as alcohol and tobacco duties). Again using figures from the OBR for 2014-15 gives the ratio of indirect tax receipts to total wages and salaries in the economy of 18%. This ratio is used to estimate the additional indirect tax receipts that flow from ATW.
Benefit Savings
4.82 Both the level of out of work benefits and the receipt of in work tax credits will depend on individuals’ particular personal and household circumstances. In the absence of this data we have simply used figures for average benefit payments (JSA and ESA/
60

Access to Work Cost Benefit Analysis
IB) and average in work tax credit payments for 2011-12 to 2013-1462.
Fiscal flow backs and budgetary impacts
4.83 Using this broad brush methodology we can estimate the total fiscal flow backs both from ATW overall and that part of the programme which assists blind and partially sighted individuals. These are then compared against the cost of the programme to estimate the overall budgetary impact of the programme. The results of this approach are shown in tables 4.28 and 4.29.
Table 4.28 indicates that the estimated fiscal flow backs exceed the costs of ATW in 2011/12 to 2013/14. However, the amount of flow backs is estimated to have fallen so that while in 2011/12 every £1 spent on ATW generated an estimated £1.28 for the exchequer in return, this had fallen to £1.05 by 2013/14.
62 The figures used are based on DWP and HMRC figures for benefit / tax credit expenditure and caseloads prepared for the Summer 2015 Budget.
61

Access to Work Cost Benefit Analysis
Table 4.28: Budgetary impact of ATW
2011/12
2012/13
2013/14
Direct Taxes £60.5m £51.7m £52.1mIndirect Taxes £33.9m £28.9m £29.1mNet Benefit / Tax Credit Savings
£42.8m £37.9m £40.0m
Total Flow backs £137.3m
£118.5m
£121.3m
Costs of ATW £107.2m
£107.8m
£115.0m
Budgetary Impact £30.1m £10.7m £6.3mFlow backs / Costs 1.28 1.10 1.05
4.84 The results for that part of ATW which assists blind and partially sighted individuals contrast with those for the programme as whole. Here the fiscal flow backs are less than the cost of the programme so that the overall impact on the government’s fiscal account is negative. However, the ratio of flow backs to costs has remained roughly constant so that over the three years 2011/12 to 2013/14 every £1 spent on ATW in support of blind or partially sighted individuals has returned around £0.72 to the exchequer.
Table 4.29: Budgetary impact of ATW for blind and partially sighted individuals
2011/12
2012/13
2013/14
Direct Taxes £8.1m £7.8m £7.8mIndirect Taxes £4.5m £4.3m £4.3mNet Benefit / Tax Credit Savings
£5.8m £5.8m £6.0m
Total Flow backs £18.4m £17.9m £18.1mCosts of ATW £25.1m £24.6m £25.6mBudgetary Impact -£6.7m -£6.8m £7.5mFlow backs / Costs 0.73 0.73 0.71
62

Access to Work Cost Benefit Analysis
5 Conclusions5.1 Our literature review has demonstrated that blind and partially
sighted individuals, and indeed people with disabilities more generally, are far less likely to be in work than the general population. Blind and partially sighted individuals face a whole range of barriers to work, not just their sight disability / any other additional disabilities, but also anxiety and confidence, transport issues, employer attitudes and the need for specialist support. ATW is designed to address at least some of these barriers. The 2002 and 2009 evaluations provide evidence of a range of benefits from ATW to both disabled workers and employers.
5.2 The unit costs of ATW whether per person helped, per person benefiting, or per award vary by support received. For blind and partially sighted individuals support workers and travel to work support are the categories of support with the highest unit costs. For all medical conditions overall, adaptations to premises and support workers are the categories of support with the highest unit costs.
5.3 ATW unit costs also vary by medical condition with unit costs being highest for deaf and hard of hearing individuals. Unit costs for blind and partially sighted individuals and those with cerebral palsy are also relatively high.
5.4 Our cost benefit analysis compares the cost of the ATW programme, and that part which assists blind and partially sighted individuals, against the employment and non-employment benefits that we estimate that the programme generates. Not all of these benefits would have occurred in the absence of the ATW support. This is known as deadweight and comes in two forms: employment deadweight, where the individual assisted would have been in work without the ATW support, and financial deadweight where the support would have been funded by employers or users themselves. Allowing for these two types of deadweight leads to our estimates of the net employment impacts of ATW.
63
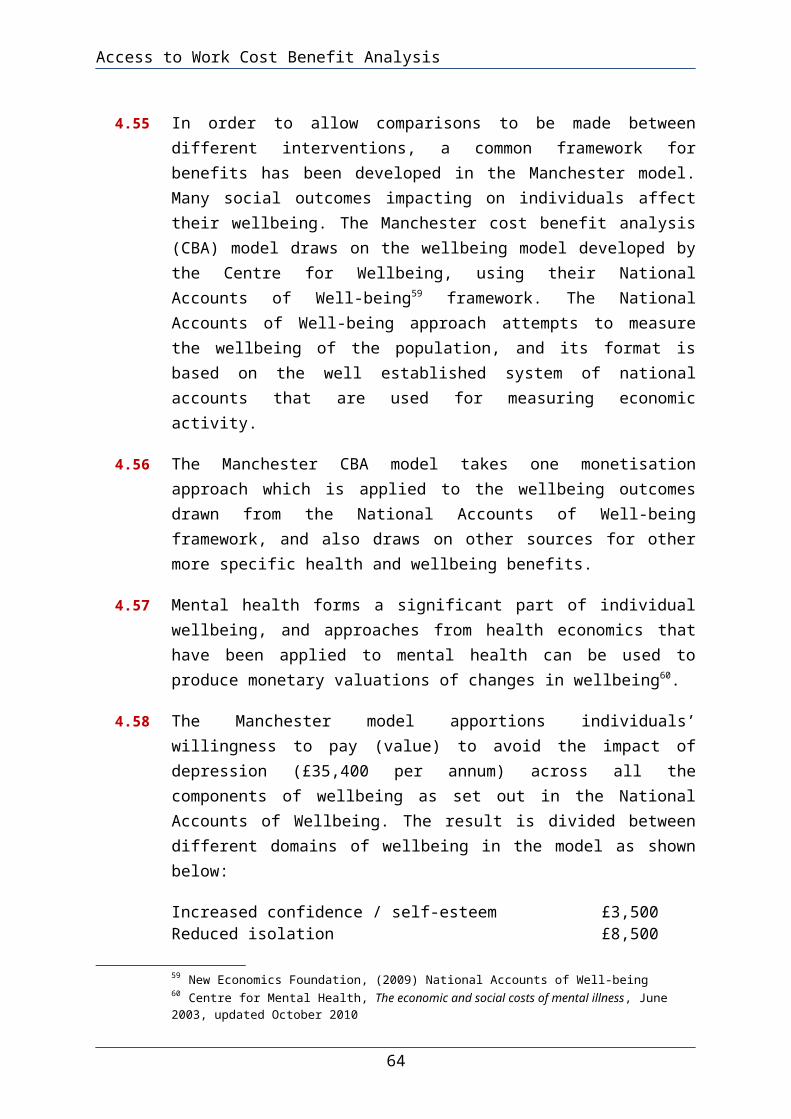
Access to Work Cost Benefit Analysis
5.5 The monetary value of these employment benefits is estimated using assumptions for hourly pay and working hours. Non-employment wellbeing benefits are estimated using the Manchester New Economy model. We estimate on the basis of the available evidence that that the overall benefits of ATW to society outweigh its costs by a considerable margin with ratios of these benefits to the costs of 3.86 for ATW as a whole and 2.48 for that part of the programme that assists blind and partially sighted individuals. This demonstrates that ATW is a beneficial form of public spending.
5.6 We have also calculated the fiscal impact of ATW comparing the costs of the programme against the estimated fiscal flow backs to the public purse in terms of additional tax revenues and reduced benefit expenditure. For ATW as a whole over 2011-12 to 2013-14, the programme is estimated to generate on average £1.14 in fiscal flow backs per £1 spent on the programme. The equivalent figure for that part of the programme assisting blind and partially sighted individuals is £0.72. It should be stressed that these narrow fiscal impact calculations are not the correct basis on which to determine whether a public programme represents good value for money. The basis for that decision is our wider cost benefit analysis figures which take account of all potential benefits to society against the programme’s costs.
64

Access to Work Cost Benefit Analysis
6 Appendix 1: Unit Costs Geographical Breakdown
6.1 This appendix sets outs our calculated unit cost figures for Great Britain and also for its three constituent countries: England, Scotland, and Wales. Figures in italics indicate that the calculated unit costs are based on a very small number of cases and should be treated with considerable caution. A dash indicates that no support in this category was provided to blind or partially sighted individuals in that particular financial year.
Table A1: Unit cost per blind / partially sighted individual helped, Great Britain, £s
2011-12 2012-13 2013-14Adaptation to premises 3,000 - 100Adaptation to vehicles 2,133 800 100Communication support at interview - - -Miscellaneous 1,009 1,105 1,426Miscellaneous with Cost Share 2,142 1,250 643Travel in work 1,326 1,333 1,322Special aids and equipment 3,102 3,046 2,968Support worker 9,776 10,029 9,988Travel to work 4,031 4,001 4,034ATW assessment 522 413 386Total 4,623 4,554 4,523
65

Access to Work Cost Benefit Analysis
Table A2: Unit cost per blind / partially sighted individual helped, England, £s
2011-12 2012-13 2013-14Adaptation to premises 3,000 - 100Adaptation to vehicles 2,133 800 100Communication support at interview - - -Miscellaneous 1,014 2,199 1,127Miscellaneous with Cost Share 5,167 612 648Travel in work 1,426 1,422 1,382Special aids and equipment 3,116 3,167 3,105Support worker 10,125 10,299 10,331Travel to work 3,975 3,948 4,028ATW assessment 497 384 371Total 4,713 4,635 4,628
Table A3: Unit cost per blind / partially sighted individual helped, Scotland, £s
2011-12 2012-13 2013-14Adaptation to premises - - -Adaptation to vehicles - - -Communication support at interview - - -Miscellaneous - - 733Miscellaneous with Cost Share - 500 -Travel in work 577 757 846Special aids and equipment 2,604 2,047 1,752Support worker 8,220 9,270 7,292Travel to work 4,022 4,010 3,722ATW assessment 535 583 466Total 3,662 3,641 3,441
66
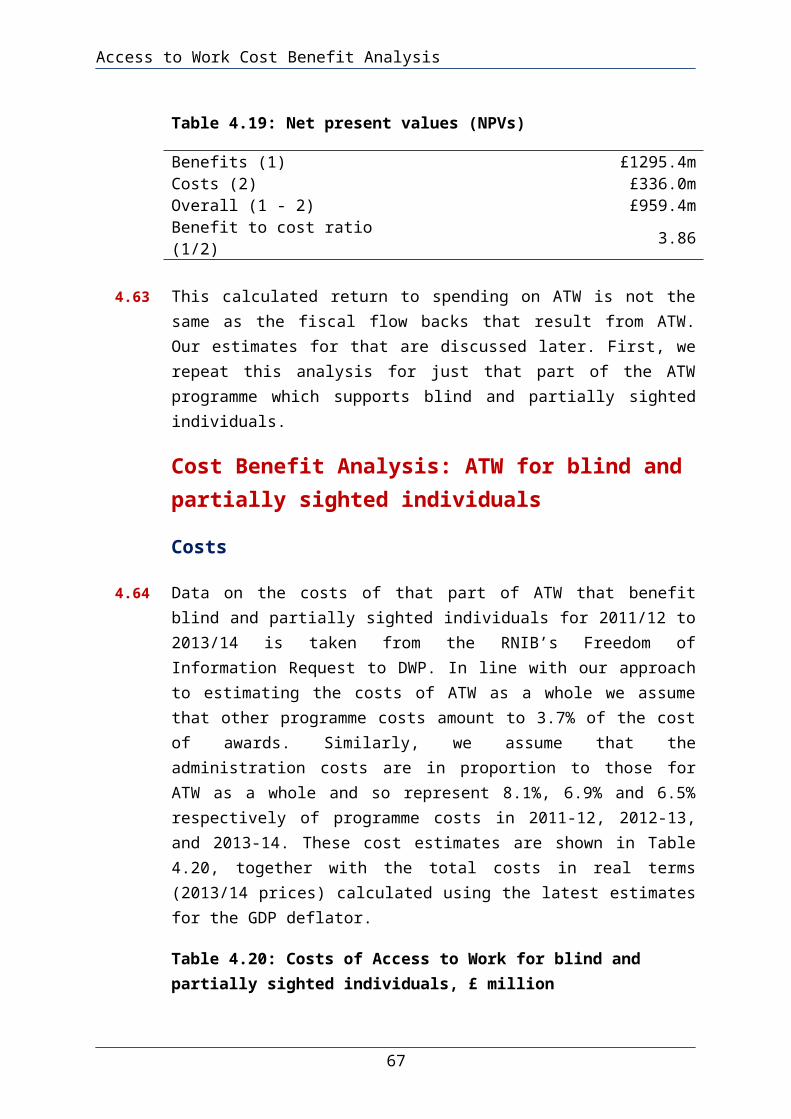
Access to Work Cost Benefit Analysis
Table A4: Unit cost per blind / partially sighted individual helped, Wales, £s
2011-12 2012-13 2013-14Adaptation to premises - - -Adaptation to vehicles - - -Communication support at interview - - -Miscellaneous - 33 -Miscellaneous with Cost Share - 1,067 -Travel in work 882 837 726Special aids and equipment 3,287 2,585 2,755Support worker 7,057 7,749 8,113Travel to work 4,877 4,536 4,586ATW assessment 1,565 623 541Total 4,827 4,453 4,454
Table A5: Unit cost per blind / partially sighted individual benefitting, Great Britain, £s
2011-12 2012-13 2013-14Adaptation to premises 3,000 - 100Adaptation to vehicles 2,133 800 100Communication support at interview - - -Miscellaneous 794 926 1,263Miscellaneous with Cost Share 1,686 1,048 570Travel in work 1,043 1,117 1,171Special aids and equipment 2,441 2,554 2,630Support worker 7,694 8,410 8,849Travel to work 3,172 3,355 3,574ATW assessment 411 346 342Total 3,638 3,819 4,007
67

Access to Work Cost Benefit Analysis
Table A6: Unit cost per blind / partially sighted individual benefitting, England, £s
2011-12 2012-13 2013-14Adaptation to premises 3,000 - 100Adaptation to vehicles 2,133 800 100Communication support at interview - - -Miscellaneous 797 1,848 998Miscellaneous with Cost Share 5,167 515 574Travel in work 1,122 1,195 1,224Special aids and equipment 2,452 2,661 2,749Support worker 7,966 8,655 9,149Travel to work 3,127 3,318 3,567ATW assessment 391 323 328Total 3,708 3,895 4,098
Table A7: Unit cost per blind / partially sighted individual benefitting, Scotland, £s
2011-12 2012-13 2013-14Adaptation to premises - - -Adaptation to vehicles - - -Communication support at interview - - -Miscellaneous - - 733Miscellaneous with Cost Share - 500 -Travel in work 453 615 723Special aids and equipment 2,042 1,663 1,496Support worker 6,447 7,532 6,229Travel to work 3,154 3,258 3,180ATW assessment 420 474 398Total 2,872 2,958 2,939
68

Access to Work Cost Benefit Analysis
Table A8: Unit cost per blind / partially sighted individual benefitting, Wales, £s
2011-12 2012-13 2013-14Adaptation to premises - - -Adaptation to vehicles - - -Communication support at interview - - -Miscellaneous - 33 -Miscellaneous with Cost Share - 1,067 -Travel in work 695 735 682Special aids and equipment 2,590 2,272 2,588Support worker 5,560 6,810 7,621Travel to work 3,842 3,986 4,308ATW assessment 1,233 548 508Total 3,803 3,914 4,184
Table A9: Unit cost per award to blind / partially sighted individuals, Great Britain, £s
2011-12 2012-13 2013-14Adaptation to premises 3,000 - 100Adaptation to vehicles 2,133 800 100Communication support at interview - - -Miscellaneous 730 795 1,020Miscellaneous with Cost Share 1,550 900 460Travel in work 959 959 946Special aids and equipment 2,244 2,193 2,124Support worker 7,073 7,219 7,146Travel to work 2,916 2,880 2,886ATW assessment 378 297 276Total 3,344 3,278 3,236
69
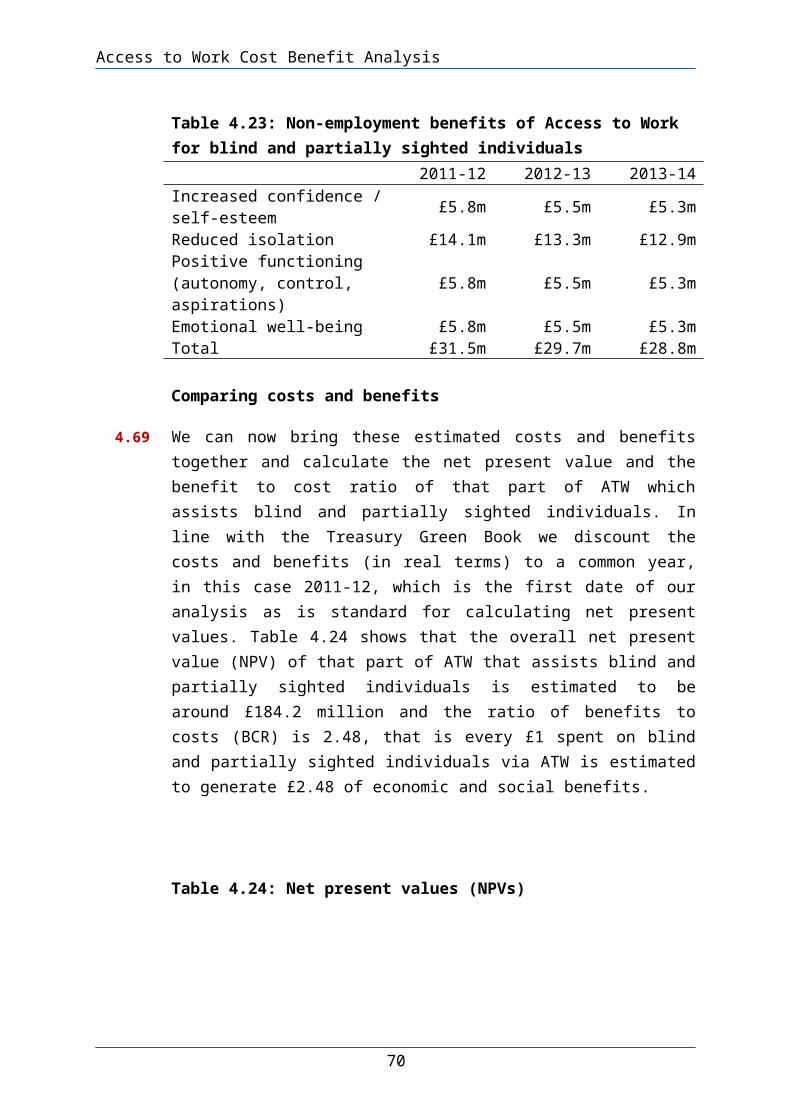
Access to Work Cost Benefit Analysis
Table A10: Unit cost per award to blind / partially sighted individuals, England, £s
2011-12 2012-13 2013-14Adaptation to premises 3,000 - 100Adaptation to vehicles 2,133 800 100Communication support at interview - - -Miscellaneous 730 1,580 800Miscellaneous with Cost Share 5,167 440 460Travel in work 1,027 1,022 982Special aids and equipment 2,244 2,275 2,205Support worker 7,292 7,399 7,337Travel to work 2,863 2,837 2,860ATW assessment 358 276 263Total 3,394 3,330 3,287
Table A11: Unit cost per award to blind / partially sighted individuals, Scotland, £s
2011-12 2012-13 2013-14Adaptation to premises - - -Adaptation to vehicles - - -Communication support at interview - - -Miscellaneous - - 733Miscellaneous with Cost Share - 500 -Travel in work 428 568 643Special aids and equipment 1,929 1,535 1,330Support worker 6,089 6,953 5,537Travel to work 2,979 3,008 2,826ATW assessment 396 438 354Total 2,713 2,731 2,612
70

Access to Work Cost Benefit Analysis
Table A12: Unit cost per award to blind / partially sighted individuals, Wales, £s
2011-12 2012-13 2013-14Adaptation to premises - - -Adaptation to vehicles - - -Communication support at interview - - -Miscellaneous - 33 -Miscellaneous with Cost Share - 1,067 -Travel in work 620 607 523Special aids and equipment 2,310 1,874 1,986Support worker 4,959 5,618 5,849Travel to work 3,427 3,288 3,307ATW assessment 1,100 452 390Total 3,392 3,229 3,211
71