executive summary · purpose whatsoever without prior permission in writing from unodc....
TRANSCRIPT

1EXECUTIVE SUMMARYConclusions and policy implications
2019
1EXECUTIVE SUMMARYConclusions and policy implications
2019

© United Nations, June 2019. All rights reserved worldwide.ISBN: 978-92-1-148314-7eISBN: 978-92-1-004174-4United Nations publication, Sales No. E.19.XI.9
This publication may be reproduced in whole or in part and in any formfor educational or non-profit purposes without special permission fromthe copyright holder, provided acknowledgement of the source is made.The United Nations Office on Drugs and Crime (UNODC) would appreciatereceiving a copy of any publication that uses this publication as a source.
Suggested citation:,World Drug Report 2019 (United Nations publication, Sales No. E.19.XI.8).
No use of this publication may be made for resale or any other commercialpurpose whatsoever without prior permission in writing from UNODC.Applications for such permission, with a statement of purpose and intent of thereproduction, should be addressed to the Research and Trend Analysis Branch of UNODC.
DISCLAIMER
The content of this publication does not necessarily reflect the views orpolicies of UNODC or contributory organizations, nor does it imply any endorsement.
Comments on the report are welcome and can be sent to:
Division for Policy Analysis and Public AffairsUnited Nations Office on Drugs and CrimePO Box 5001400 Vienna AustriaTel: (+43) 1 26060 0Fax: (+43) 1 26060 5827
E-mail: [email protected]: www.unodc.org/wdr2019

1
PREFACE
The findings of this year’s World Drug Report fill in and further complicate the global picture of drug challenges, underscoring the need for broader inter-national cooperation to advance balanced and integrated health and criminal justice responses to drug supply and demand.
With improved research and more precise data from India and Nigeria – both among the 10 most-pop-ulous countries in the world – we see that there are many more opioid users and people with drug use disorders than previously estimated. Globally, some 35 million people, up from an earlier estimate of 30.5 million, suffer from drug use disorders and require treatment services. The death toll is also higher: 585,000 people died as a result of drug use in 2017.
Prevention and treatment continue to fall far short of needs in many parts of the world. This is particu-larly true in prisons, where those incarcerated are especially vulnerable to drug use and face higher risks of HIV and hepatitis C transmission. This gap represents a major impediment to achieving the Sus-tainable Development Goals and fulfilling the international community’s pledge to leave no one behind.
Synthetic opioids continue to pose a serious threat to health, with overdose deaths rising in North America and trafficking in fentanyl and its analogues expanding in Europe and elsewhere. The opioid crisis that has featured in far fewer headlines but that requires equally urgent international attention is the non-medical use of the painkiller tramadol, particularly in Africa. The amount of tramadol seized globally reached a record 125 tons in 2017; the limited data available indicate that the tramadol being used for non-medical purposes in Africa is being illicitly manufactured in South Asia and traf-ficked to the region, as well as to parts of the Middle East.
The response to the misuse of tramadol illustrates the difficulties faced by countries in balancing nec-essary access for medical purposes while curbing abuse – with limited resources and health-care sys-tems that are already struggling to cope – and at the
same time clamping down on organized crime and trafficking.
Opium production and cocaine manufacture remain at record levels. The amounts intercepted are also higher than ever, with the amount of cocaine seized up 74 per cent over the past decade, compared with a 50 per cent rise in manufacture during the same period. This suggests that law enforcement efforts have become more effective and that strengthened international cooperation may be helping to increase interception rates.The World Drug Report 2019 also registers a decline in opiate trafficking from Afghanistan along the “northern” route through Central Asia to the Rus-sian Federation. In 2008, some 10 per cent of the morphine and heroin intercepted globally was seized in countries along the northern route; by 2017 it had fallen to 1 per cent. This may be due in part to a shift in demand to synthetics in destination mar-kets. The increased effectiveness of regional responses may also play a role. Countries in central Asia, with the support of the United Nations Office on Drugs and Crime (UNODC), have committed considerable resources to strengthening regional cooperation through inte-grated UNODC country, regional and global programmes, as well as through platforms such as the Central Asian Regional Information and Coordination Centre, the Afghanistan–Kyrgyzstan–Tajikistan Initiative and the Triangular Initiative and its Joint Planning Cell. More research is needed, including to identify lessons learned and best prac-tices that could inform further action. International cooperation has also succeeded in checking the growth in new psychoactive substances. The Vienna-based Commission on Narcotic Drugs has acted swiftly in recent years to schedule the most harmful new psychoactive substances, and the UNODC early warning advisory has helped to keep the international community abreast of developments. Political will and adequate funding remain prereq-uisites for success. Efforts by Colombia to reduce cocaine production following the 2016 peace deal

2
WO
RLD
DRU
G R
EPO
RT 2
019 EXECUTIVE SUMMARY
with the Revolutionary Armed Forces of Colombia (FARC) are a case in point. Alternative development initiatives have enabled farmers in central areas of the country previously under FARC control to aban-don coca bush cultivation and join the licit economy. The result has been a drastic reduction in cocaine production. However, in other areas previously con-trolled by FARC, criminal groups have moved in to fill the vacuum and expand cultivation. Alternative development can succeed, but not without sustained attention and integration into broader development goals. The successes identified amid the many, formidable problems that countries continue to face in grap-pling with drug supply and demand highlight that international cooperation works. The challenge before us is to make this cooperation work for more people.
International cooperation is based on agreed frame-works. Nearly every country in the world has reaffirmed its commitment to balanced, rights-based action based on the international drug control con-ventions. The most recent reaffirmation of that commitment is the Ministerial Declaration on Strengthening Our Actions at the National, Regional and International Levels to Accelerate the Imple-mentation of Our Joint Commitments to Address and Counter the World Drug Problem, adopted at the ministerial segment of the sixty-second session of the Commission on Narcotic Drugs.
UNODC supports countries in putting their com-mitments into action through the application of international standards on the prevention and treat-ment of drug use disorders and HIV, as well as standards and norms on the administration of justice and the treatment of prisoners. We provide tailored technical assistance through our field offices and global programmes, and through toolkits and research.
I hope the World Drug Report 2019 will shed further light on the world drug problem and inform inter-national community responses. By working together and focusing attention and resources, we can help people get the services they need without discrimi-nation, promote security and bring criminals to justice, safeguard health and achieve the Sustainable Development Goals.
Yury FedotovExecutive Director
United Nations Office on Drugs and Crime

3
CONTENTS
BOOKLET 1 EXECUTIVE SUMMARY, CONCLUSIONS AND POLICY IMPLICATIONS
BOOKLET 2 GLOBAL OVERVIEW OF DRUG DEMAND AND SUPPLY
BOOKLET 3 DEPRESSANTS
BOOKLET 4 STIMULANTS
BOOKLET 5 CANNABIS AND HALLUCINOGENS
PREFACE ..................................................................................................................... 1EXPLANATORY NOTES .............................................................................................. 5EXECUTIVE SUMMARY .............................................................................................. 7
LATEST TRENDS ....................................................................................................... 7Improved data sharpen understanding of the extent of drug use globally ................................ 7Cocaine production and seizures reach record highs .................................................................... 8Methamphetamine use causes rising concern across several regions .......................................... 9Synthetic opioid markets boom despite associated adverse health consequences ................... 10Heroin still reaching the market despite declining opium production and rising seizures ...... 11Cannabis market undergoes transition amid changes in legal status in some countries ......... 13
LAW ENFORCEMENT ............................................................................................ 14Authorities make inroads into hard-to-reach drug markets ....................................................... 14Hallucinogen trafficking is more geographically clustered than trafficking in other drug types...................................................................................................... 15Complex global smuggling networks underpin heroin and cocaine markets ........................... 15Relationship between licit production and illicit markets remains sometimes unclear ............ 18
HEALTH CONSEQUENCES ..................................................................................... 19The adverse health consequences associated with the use of drugs remain considerable ...... 19Patterns of drug use and treatment needs vary according to gender ....................................... 20Prisoners are vulnerable to drug use but underserved by treatment programmes .................. 20Help for those who need it ........................................................................................................... 23
CONCLUSIONS AND POLICY IMPLICATIONS ........................................................ 23Mitigate concentrations of high risk ............................................................................................ 24The global paradox of too much and not enough ...................................................................... 24Law enforcement is an integral part of the solution .................................................................. 25Cannabis markets need to be closely monitored......................................................................... 25Evolving complexity highlights need for further research .......................................................... 26
ANNEX ...................................................................................................................... 29GLOSSARY ................................................................................................................ 51REGIONAL GROUPINGS ........................................................................................... 53

Acknowledgements
The World Drug Report 2019 was prepared by the Research and Trend Analysis Branch, Division for Policy Analysis and Public Affairs, United Nations Office on Drugs and Crime (UNODC), under the supervision of Jean-Luc Lemahieu, Director of the Division, and Angela Me, Chief of the Research and Trend Analysis Branch.
General coordination and content overviewChloé Carpentier Angela Me
Analysis and draftingPhilip Davis Kamran Niaz Thomas Pietschmann
Data management and estimates production Enrico BisognoConor Crean Hernan EpsteinVirginia Macdonald (WHO)Riku Lehtovuori Sabrina LevissianosAndrea OterováUmidjon RakhmonberdievAli Saadeddin Tun Nay SoeKeith Sabin (UNAIDS)Irina TsoyFatma UshevaLorenzo Vita
EditingJoseph Boyle Jonathan Gibbons
Graphic design and productionAnja KorenblikSuzanne KunnenKristina KuttnigFabian Rettenbacher
Coordination Francesca Massanello
Administrative supportIulia Lazar
Review and commentsThe World Drug Report 2019 benefited from the expertise of and invaluable contributions from INCB and from UNODC colleagues in all divisions. The Research and Trend Analysis Branch acknowledges the important contribution from its colleagues in the Laboratory and Scientific Section and in the Programme Development and Management Unit.
The Research and Trend Analysis Branch acknowledges the invaluable contributions and advice provided by the World Drug Report Scientific Advisory Committee:Jonathan CaulkinsPaul GriffithsMarya HynesVicknasingam B. KasinatherCharles Parry
Afarin Rahimi-MovagharPeter ReuterAlison RitterFrancisco Thoumi
The research and production of the joint UNODC/UNAIDS/WHO/World Bank estimates of the number of people who inject drugs were partly funded by the HIV/AIDS Section of the Drug Prevention and Health Branch of the Division for Operations of UNODC.

5
EXPLANATORY NOTES
The boundaries and names shown and the designa-tions used on maps do not imply official endorsement or acceptance by the United Nations. A dotted line represents approximately the line of control in Jammu and Kashmir agreed upon by India and Paki-stan. The final status of Jammu and Kashmir has not yet been agreed upon by the parties. Disputed boundaries (China/India) are represented by cross-hatch owing to the difficulty of showing sufficient detail.
The designations employed and the presentation of the material in the World Drug Report do not imply the expression of any opinion whatsoever on the part of the Secretariat of the United Nations con-cerning the legal status of any country, territory, city or area, or of its authorities or concerning the delimi-tation of its frontiers or boundaries.
Countries and areas are referred to by the names that were in official use at the time the relevant data were collected.
All references to Kosovo in the World Drug Report, if any, should be understood to be in compliance with Security Council resolution 1244 (1999).
Since there is some scientific and legal ambiguity about the distinctions between “drug use”, “drug misuse” and “drug abuse”, the neutral term “drug use” is used in the World Drug Report. The term “misuse” is used only to denote the non-medical use of prescription drugs.
All uses of the word “drug” and the term “drug use” in the World Drug Report refer to substances con-trolled under the international drug control conventions, and their non-medical use.
All analysis contained in the World Drug Report is based on the official data submitted by Member States to the UNODC through the annual report questionnaire unless indicated otherwise.
The data on population used in the World Drug Report are taken from: World Population Prospects: The 2017 Revision (United Nations, Department of Economic and Social Affairs, Population Division).
References to dollars ($) are to United States dollars, unless otherwise stated.
References to tons are to metric tons, unless other-wise stated.
The following abbreviations have been used in the present booklet:
CBD cannabidiol
DALYs disability-adjusted life years
DMT dimethyltryptamine
FARC Revolutionary Armed Forces of Colombia
HIV human immunodeficiency virus
LSD lysergic acid diethylamide
NPS new psychoactive substances
PCP phencyclidine
PWID people who inject drugs
THC tetrahydrocannabinol
UNAIDS Joint United Nations Programme on HIV and AIDS
UNODC United Nations Office on Drugs and Crime


7
EXECUTIVE SUMMARY
LATEST TRENDS
Improved data sharpen under-standing of the extent of drug use globally
Number of people using drugs is 30 per cent higher than in 2009
In 2017, an estimated 271 million people, or 5.5 per cent of the global population aged 15–64, had used drugs in the previous year. While that figure is similar to the 2016 estimate, a longer-term view reveals that the number of people who use drugs is now 30 per cent higher than it was in 2009, when 210 million had used drugs in the previous year.
Although that increase was in part due to a 10 per cent growth in the global population aged 15–64, data now show a higher prevalence of the use of opioids in Africa, Asia, Europe and North America and of the use of cannabis in North America, South America and Asia. The most widely used drug worldwide continues to be cannabis, with an esti-mated 188 million people having used the drug in the previous year. The prevalence of cannabis use has remained broadly stable at the global level for a decade, even with the rising trends in the Americas and Asia.
New surveys in India and Nigeria alter the picture of global drug use – the number of opioid users and the number of people suffering from drug use disorders globally are much higher than previously thought
In 2017, some 53.4 million people worldwide had used opioids in the previous year, 56 per cent higher than the estimate for 2016. Among those people, 29.2 million had used opiates such as heroin and opium, 50 per cent higher than the 2016 estimate of 19.4 million.
The higher estimates in 2017 are the result of improved knowledge of the extent of drug use from new surveys conducted in two highly populated countries, namely India and Nigeria. In Asia, the number of past-year users of opioids is now thought to be higher, at 29.5 million, than the previous esti-mate of 13.6 million. In Africa, the survey data from Nigeria led to a revision of the number of past-year users of opioids to 6.1 million, compared with the previous estimate of 2.2 million.
Overall, North America continues to be the subre-gion with the highest annual prevalence of opioid use, with 4.0 per cent of the population using opi-oids. The Near and Middle East and South-West Asia is the subregion with the highest annual preva-lence of opiate use (opium, morphine and heroin),
585,000deaths(2017)
of "healthy"life lost(2017)
42 million yearsHepa��s CHIV/AIDSOpioid use disordersCocaine use disordersAmphetamine use diordersCannabis use disordersOther drug use disordersOther causes
Hepatitis C and opioid use disorders are responsible for most of the deathsand disability attributed to the use of drugs
Sources: Institute for Health Metrics and Evaluation, “Global Burden of Disease Study 2017”, Global Health Data Exchange.
8
WO
RLD
DRU
G R
EPO
RT 2
019 EXECUTIVE SUMMARY
The Colombian Government’s 2016 peace deal with the Revolutionary Armed Forces of Colombia (FARC) has helped to drastically reduce cocaine production in central areas of the country, where farmers in areas previously controlled by FARC have abandoned cultivation. But in other areas previously controlled by FARC, criminal groups have moved in to continue and expand coca bush cultivation.
A third dynamic in Colombia saw entirely new areas given over to coca bush cultivation during 2016, reflected in the production data for 2017. These areas are often far away from major cities, making it difficult for the central authorities to provide incentives to farmers to stop cultivation. Also, a reduction in eradication efforts might have fostered the idea that cultivation was relatively risk-free.
Record seizures help to keep cocaine supply in check
The global quantity of cocaine seized in 2017 increased to 1,275 tons – the largest quantity ever reported, and an increase on the previous year of 13 per cent. While cocaine seizures have risen by 74 per cent over the past decade, production has risen by 50 per cent.
Overall, the interceptions mean that the amount of cocaine available for consumption has increased at a slower rate than has manufacture. This suggests that at the global level, law enforcement efforts and international cooperation have likely become more
at 1.6 per cent of the population. However, in terms of numbers of users, 35 per cent of the global opioid users and almost half of all opiate users worldwide reside in South Asia.
With the new information from India and Nigeria, the number of people who are thought to suffer from drug use disorders is now estimated to be 35.3 mil-lion. This number is 15 per cent higher than the previous estimate of 30.5 million. The term “people with drug use disorders” designates people whose drug use is harmful to the point where they may experience drug dependence and/or require treatment.
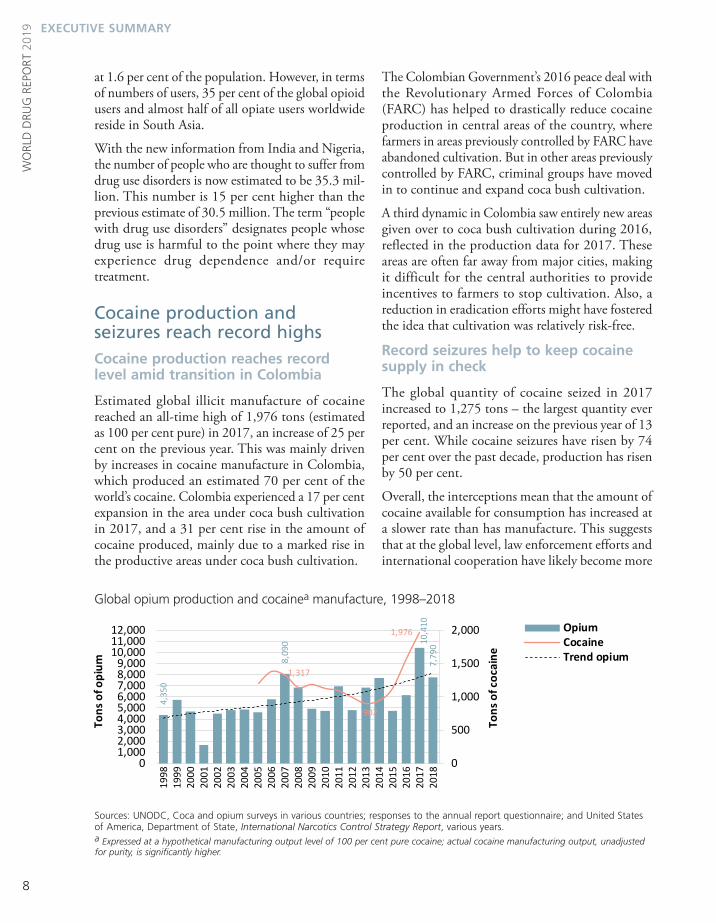
Cocaine production and seizures reach record highs Cocaine production reaches record level amid transition in Colombia
Estimated global illicit manufacture of cocaine reached an all-time high of 1,976 tons (estimated as 100 per cent pure) in 2017, an increase of 25 per cent on the previous year. This was mainly driven by increases in cocaine manufacture in Colombia, which produced an estimated 70 per cent of the world’s cocaine. Colombia experienced a 17 per cent expansion in the area under coca bush cultivation in 2017, and a 31 per cent rise in the amount of cocaine produced, mainly due to a marked rise in the productive areas under coca bush cultivation.
Global opium production and cocainea manufacture, 1998–2018
Sources: UNODC, Coca and opium surveys in various countries; responses to the annual report questionnaire; and United States of America, Department of State, International Narcotics Control Strategy Report, various years.a Expressed at a hypothetical manufacturing output level of 100 per cent pure cocaine; actual cocaine manufacturing output, unadjusted for purity, is significantly higher.
4,35
0
8,09
0 10,4
10
7,79
0
1,317
902
1,976
0
500
1,000
1,500
2,000
01,0002,0003,0004,0005,0006,0007,0008,0009,000
10,00011,00012,000
1998
1999
2000
2001
2002
2003
2004
2005
2006
2007
2008
2009
2010
2011
2012
2013
2014
2015
2016
2017
2018
Tons
of c
ocai
ne
Tons
of o
pium
OpiumCocaineTrend opium
9
Latest trends 1
Asia report methamphetamine as the main drug of concern in treatment. In countries in the subregion with recent data, annual prevalence of metham-phetamine use ranges between 0.5 and 1.1 per cent, which is rather high compared with the global aver-age. There are also signs of an increase in crystalline methamphetamine use in South-East Asia.
Potential harm from methampheta-mine use is on the rise in North America
North America is the subregion with the highest prevalence of the use of amphetamines (ampheta-mine and methamphetamine), at 2.1 per cent of the population aged 15-64. While the non-medical use of pharmaceutical stimulants is more prevalent in North America, a significant number of people also use methamphetamine.
effective with the interception of a larger share of cocaine products than in the past.
The bulk of cocaine seizures are in the Americas, which accounted for almost 90 per cent of the global total in 2017. Interception close to the source of manufacture is significant; Colombia alone inter-cepted 38 per cent of the global total in 2017.
Cocaine use is on the rise in North America and Western and Central Europe
An estimated 18.1 million people used cocaine in the past year, with the highest rates reported in North America (2.1 per cent) and Oceania (1.6 per cent). North America had seen a decline in cocaine use between 2006 and 2012, but there are now signs of an increase, as there are in Western and Central Europe, Oceania and some South American coun-tries. In parts of Asia and West Africa, increasing amounts of cocaine have been reported to be seized, which suggests that cocaine use could potentially increase, especially among affluent, urban dwellers in subregions where use had previously been low.
Methamphetamine use causes rising concern across several regionsSouth-East Asia emerges as the world’s fastest-growing methamphetamine market
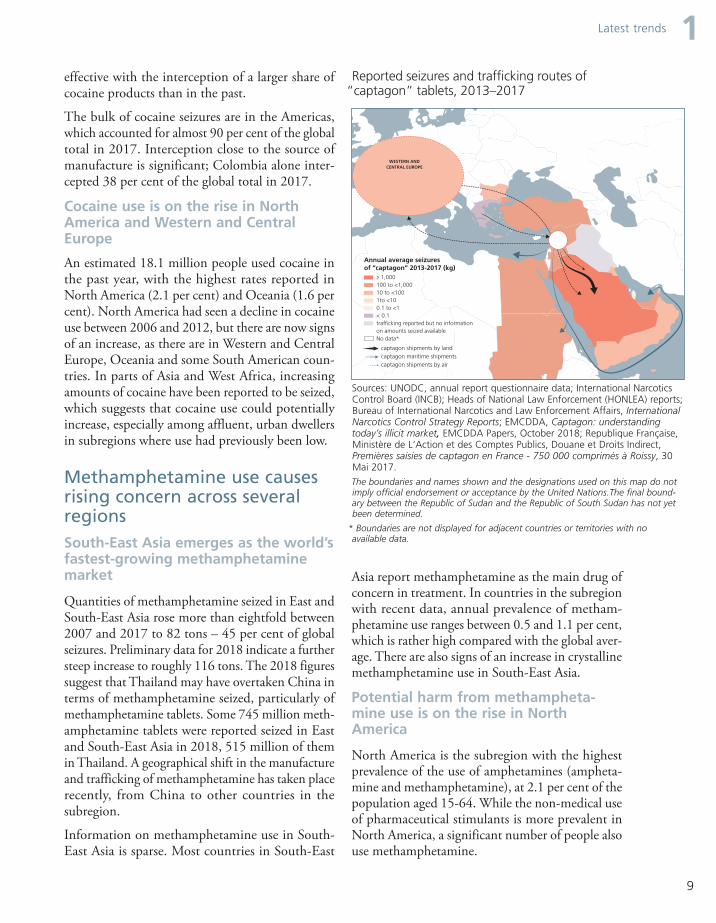
Quantities of methamphetamine seized in East and South-East Asia rose more than eightfold between 2007 and 2017 to 82 tons – 45 per cent of global seizures. Preliminary data for 2018 indicate a further steep increase to roughly 116 tons. The 2018 figures suggest that Thailand may have overtaken China in terms of methamphetamine seized, particularly of methamphetamine tablets. Some 745 million meth-amphetamine tablets were reported seized in East and South-East Asia in 2018, 515 million of them in Thailand. A geographical shift in the manufacture and trafficking of methamphetamine has taken place recently, from China to other countries in the subregion.
Information on methamphetamine use in South-East Asia is sparse. Most countries in South-East
Reported seizures and trafficking routes of “captagon” tablets, 2013–2017
Sources: UNODC, annual report questionnaire data; International Narcotics Control Board (INCB); Heads of National Law Enforcement (HONLEA) reports; Bureau of International Narcotics and Law Enforcement Affairs, International Narcotics Control Strategy Reports; EMCDDA, Captagon: understanding today’s illicit market, EMCDDA Papers, October 2018; Republique Française, Ministère de L‘Action et des Comptes Publics, Douane et Droits Indirect, Premières saisies de captagon en France - 750 000 comprimés à Roissy, 30 Mai 2017.
The boundaries and names shown and the designations used on this map do not imply official endorsement or acceptance by the United Nations.The final bound-ary between the Republic of Sudan and the Republic of South Sudan has not yet been determined.
* Boundaries are not displayed for adjacent countries or territories with no available data.
captagon shipments by landcaptagon maritime shipmentscaptagon shipments by air
Annual average seizuresof “captagon” 2013-2017 (kg)
≥ 1,000 100 to <1,000 10 to <100 1to <10 0.1 to <1 < 0.1trafficking reported but no informationon amounts seized availableNo data*
WESTERN AND CENTRAL EUROPE

10
WO
RLD
DRU
G R
EPO
RT 2
019 EXECUTIVE SUMMARY
deaths reported in 2016. Fentanyl or fentanyl ana-logues were involved in 69 per cent of those deaths in 2017, compared with 50 per cent in 2016.
Trafficking in fentanyl and its analogues rises and expands outside North America
North America is the principal market for fentanyls, but seizure data suggest that trafficking has expanded worldwide. While just four countries reported fen-tanyl seizures to UNODC in 2013, 12 countries did so in 2016 and 16 countries in 2017.
Europe hosts a small but growing market for fenta-nyls. Seizures or use have been reported in most European countries. In Western and Central Europe, seizures have risen from 1 kg in 2013 to 5 kg in 2016 and 17 kg in 2017. The substances are often sold on the Internet, sometimes as “legal” replace-ments for controlled opioids.
Tramadol: the other opioid crisis in low- and middle-income countries
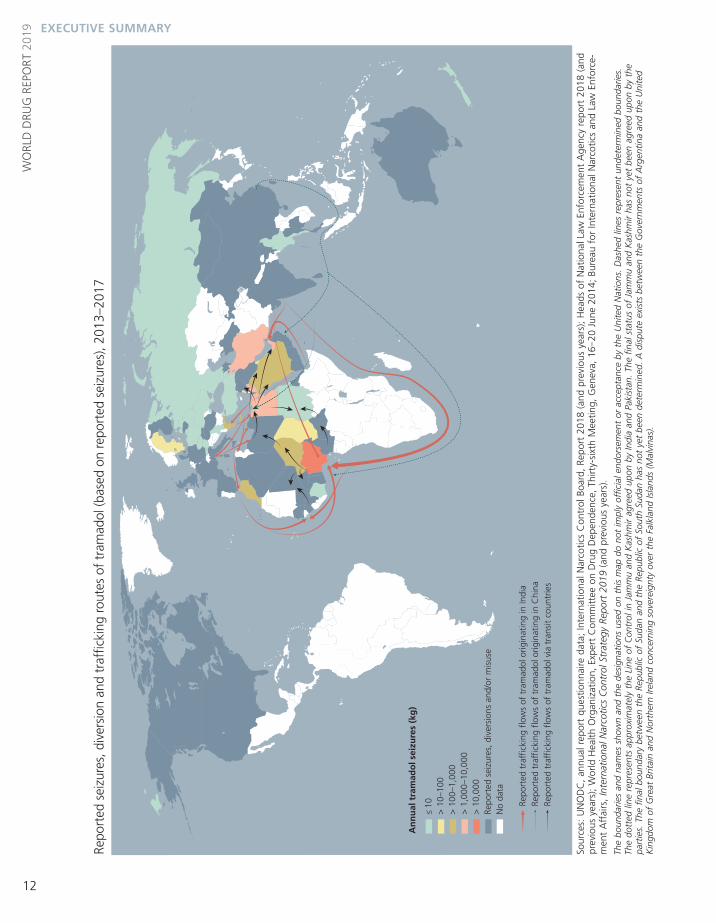
West and Central and North Africa are currently experiencing a crisis of another synthetic opioid: tramadol, which has been used as a painkiller for decades. Limited information on the supply of tram-adol for non-medical use points to tramadol being (illicitly) manufactured in South Asia and trafficked to African countries and parts of the Middle East.
People using methamphetamine tend to be more frequent and more intense users than those who misuse pharmaceutical stimulants, and they face potentially more damaging consequences. For instance, the number of overdose deaths attributed to the use of psychostimulants including metham-phetamine has risen considerably in the United States, from 1,300 cases in 2007 to more than 10,000 in 2017; this increase was led by the concur-rent involvement of synthetic opioids (fentanyls) in those deaths.
Synthetic opioid markets boom despite associated adverse health consequences
North America’s synthetic opioid overdose crisis reached new heights in 2017
North America has seen a rising number of overdose deaths resulting from the use of opioids. More than 47,000 opioid overdose deaths were recorded in the United States in 2017, an increase of 13 per cent from the previous year. Those deaths were largely attributed to synthetic opioids such as fentanyl and its analogues, which were involved in nearly 50 per cent more deaths than in 2016. In Canada, nearly 4,000 opioid-related deaths were reported in 2017, a 33 per cent increase from the 3,000 overdose
Global opioid crisis
2013
2017 X14
Cen
tral
, Wes
t and
North Africa: non-medical use of tram
ado
l
tramadol seizures
2013
2017 X2
Nor
th A
mer
ica:
fen
tany
ls, non-medical use of pharm
aceutical op
ioid
s, heroin
opioid overdose deaths

11
Latest trends 1Global seizures of tramadol rose from less than 10 kg in 2010 to almost 9 tons in 2013 and reached a record high of 125 tons in 2017. New data from Nigeria suggest the problem is greater than previ-ously thought. The national drug use survey conducted in 2017 shows that 4.7 per cent of the population aged 15–64 reported the non-medical use of prescription opioids in the previous year, with tramadol being by far the most common opioid misused.
Rapidly growing numbers of synthetic opioid new psychoactive substances emerging on the market
The number of new psychoactive substances (NPS) that are synthetic opioids, mostly fentanyl analogues, reported on the market has been rising at an unprec-edented rate. It rose from just 1 substance in 2009 to 15 in 2015 and 46 in 2017, while the overall number of NPS present on the market stabilized at around 500 substances per year over the period 2015–2017.
Synthetic opioids have become the second most important substance group, after stimulants, in terms of NPS reported for the first time. The group accounted for 29 per cent of the newly identified NPS in 2017.
Heroin still reaching the market despite declining opium production and rising seizures
Drought in Afghanistan causes decline in cultivation and production of opium in 2018
Afghanistan was again the country responsible for the vast majority of the world’s illicit opium poppy cultivation and opium production in 2018. The 263,000 ha under cultivation in Afghanistan in 2018 dwarfs cultivation in nearest rivals Myanmar (37,300 ha in 2018) and Mexico (30,600 ha in 2016/17).
Overall, the global area cultivated fell by some 17 per cent in 2018 to 346,000 ha, largely as a result of a drought in Afghanistan. Also, opium prices in Afghanistan fell rapidly between 2016 and 2018, probably because of overproduction in previous
benz
odiazepines
Non-medical use of tranquillizers(benzodiazepines)
ranked as 1 of the top 3 commonly used substances
by 40 countries
higher among women
main substance within polydrug use patterns, especially among opioid
users
12
WO
RLD
DRU
G R
EPO
RT 2
019 EXECUTIVE SUMMARY
Repo
rted
sei
zure
s, d
iver
sion
and
tra
ffick
ing
rout
es o
f tr
amad
ol (b
ased
on
repo
rted
sei
zure
s), 2
013–
2017
Sour
ces:
UN
OD
C,
annu
al r
epor
t qu
estio
nnai
re d
ata;
Inte
rnat
iona
l Nar
cotic
s C
ontr
ol B
oard
, Re
port
201
8 (a
nd p
revi
ous
year
s);
Hea
ds o
f N
atio
nal L
aw E
nfor
cem
ent
Age
ncy
repo
rt 2
018
(and
pr
evio
us y
ears
); W
orld
Hea
lth O
rgan
izat
ion,
Exp
ert
Com
mitt
ee o
n D
rug
Dep
ende
nce,
Thi
rty-
sixt
h M
eetin
g, G
enev
a, 1
6‒20
Jun
e 20
14;
Bure
au f
or In
tern
atio
nal N
arco
tics
and
Law
Enf
orce
-m
ent
Aff
airs
, In
tern
atio
nal N
arco
tics
Con
trol
Str
ateg
y Re
port
201
9 (a
nd p
revi
ous
year
s).
The
boun
darie
s an
d na
mes
sho
wn
and
the
desi
gnat
ions
use
d on
thi
s m
ap d
o no
t im
ply
offic
ial e
ndor
sem
ent
or a
ccep
tanc
e by
the
Uni
ted
Nat
ions
. D
ashe
d lin
es r
epre
sent
und
eter
min
ed b
ound
arie
s.
The
dott
ed li
ne r
epre
sent
s ap
prox
imat
ely
the
Line
of
Con
trol
in J
amm
u an
d K
ashm
ir ag
reed
upo
n by
Indi
a an
d Pa
kist
an.
The
final
sta
tus
of J
amm
u an
d K
ashm
ir ha
s no
t ye
t be
en a
gree
d up
on b
y th
e pa
rtie
s. T
he f
inal
bou
ndar
y be
twee
n th
e Re
publ
ic o
f Su
dan
and
the
Repu
blic
of
Sout
h Su
dan
has
not
yet
been
det
erm
ined
. A
dis
pute
exi
sts
betw
een
the
Gov
ernm
ents
of
Arg
entin
a an
d th
e U
nite
d
Kin
gdom
of
Gre
at B
ritai
n an
d N
orth
ern
Irela
nd c
once
rnin
g so
vere
ignt
y ov
er t
he F
alkl
and
Isla
nds
(Mal
vina
s).
Sour
ces:
UN
OD
C, a
nnua
l rep
ort
ques
tionn
aire
dat
a, In
tern
atio
nal N
arco
tics
Con
trol
Boa
rd, R
epor
t 20
16 (a
nd p
revi
ous
year
s),
Hea
ds o
f N
atio
nal L
aw E
nfor
cem
ent
Age
ncy
(HO
NLE
A) r
epor
t 20
16 (a
nd p
revi
ous
year
s),
Wor
ld H
ealth
Org
anis
atio
n, E
xper
t C
omm
ittee
on
Dru
g D
epen
denc
e,
Thirt
y-si
xth
Mee
ting,
Gen
eva,
16-
20 J
une
2014
, Bur
eau
for
Inte
rnat
iona
l Nar
cotic
s an
d La
w E
nfor
cem
ent
Aff
airs
, Int
erna
tiona
l Nar
cotic
s C
ontr
ol S
trat
egy
Repo
rt 2
017
(and
pre
viou
s ye
ars)
.
The
boun
darie
s an
d na
mes
sho
wn
and
the
desi
gnat
ions
use
d on
thi
s m
ap d
o no
t im
ply
offic
ial e
ndor
sem
ent
or a
ccep
tanc
e by
the
Uni
ted
Nat
ions
. Das
hed
lines
rep
rese
nt u
ndet
erm
ined
bou
ndar
ies.
The
dot
ted
line
repr
esen
ts a
ppro
xim
atel
y th
e Li
ne o
f C
ontr
ol in
Jam
mu
and
Kas
hmir
agre
ed u
pon
by In
dia
and
Paki
stan
. The
fin
al s
tatu
s of
Jam
mu
and
Kas
hmir
has
not
yet
been
agr
eed
upon
by
the
part
ies.
The
fin
al b
ound
ary
betw
een
the
Repu
blic
of
Suda
n an
d th
e Re
publ
ic o
f So
uth
Suda
n ha
s no
t ye
t be
en d
eter
min
ed. A
dis
pute
exi
sts
betw
een
the
Gov
ernm
ents
of
Arg
entin
a an
d th
e U
nite
d K
ingd
om o
f G
reat
Brit
ain
and
Nor
ther
n Ire
land
con
cern
ing
sove
reig
nty
over
the
Fal
klan
d Is
land
s (M
alvi
nas)
.
Repo
rted
tra
ffic
king
flo
ws
of t
ram
adol
orig
inat
ing
in In
dia
Repo
rted
tra
ffic
king
flo
ws
of t
ram
adol
orig
inat
ing
in C
hina
Repo
rted
tra
ffic
king
flo
ws
of t
ram
adol
via
tra
nsit
coun
trie
s
An
nu
al t
ram
ado
l sei
zure
s (k
g)
≤ 10
> 1
0–10
0 >
100
–1,0
00
> 1
,000
–10,
000
> 1
0,00
0 Re
port
ed s
eizu
res,
div
ersi
ons
and/
or m
isus
eN
o da
ta
Rep
ort
ed t
ram
ado
l sei
zure
s (a
nd
/or
div
ersi
on
s) a
nd
maj
or
tram
ado
l tra
ffic
kin
g/d
iver
sio
n r
ou
tes,
201
3 —
201
7

13
Latest trends 1heroin seizures exceed those of morphine and opium.
Some 86 per cent of all opiates seized in 2017 were intercepted in Asia, the region that accounts for more than 90 per cent of global illicit opium production.
Global interceptions of heroin have increased at a faster pace than production, suggesting a likely increase in the efficiency of law enforcement efforts and international cooperation.
Cannabis market undergoes transition amid changes in legal status in some countries
Interception of cannabis herb appears less of a priority in North America despite continued existence of illicit market
The Americas continue to account for the largest share of cannabis herb seizures. South America accounted for 38 per cent of the global total in 2017, and North America for 21 per cent. However, in
years, making the crop less lucrative for farmers. However, the area under cultivation today is more than 60 per cent larger than it was a decade ago and the estimated cultivation area in Afghanistan in 2018 is the second largest estimate ever.
Global production of opium was even more affected than was cultivation by the drought in Afghanistan, which produced 82 per cent of the world’s opium in 2018. After an upward trend over the last two decades, global production fell by 25 per cent from 2017 to 2018, to some 7,790 tons. Despite that drop, the amount of opium produced was the third largest amount since UNODC started to systemati-cally monitor opium production in the 1990s.
Opiate seizures increase to record levels
Quantities of opiates seized globally again reached an all-time high in 2017. Some 693 tons of opium were seized, which was five per cent more than in the previous year. In addition, 103 tons of heroin were intercepted, 13 per cent more than in 2016, and 87 tons of morphine, a 33 per cent rise. Express-ing these seizures in common heroin equivalents,
Diversification of cannabis products consumed in some juridictions that allow the non-medical use of cannabis
two decades
mainly cannabis flower
≤ 10% THC
2017
20% THC
up to 69% THC
cannabis flower
edibles and others
Based on Orens and others, "Market size and demand for marijuana in Colorado".
14
WO
RLD
DRU
G R
EPO
RT 2
019 EXECUTIVE SUMMARY
the proportion of tested cannabis concentrates that contain over 75 per cent THC has increased fivefold in recent years. There is also an increase in Colorado in the demand for non-flower products such as oil-filled vaporizer cartridges, wax/shatter concentrates and infused edibles.
LAW ENFORCEMENT
Authorities make inroads into hard-to-reach drug marketsControl of “legal highs” helps to snuff out emerging drug markets
The NPS market is diverse and dynamic, with new substances being synthesized regularly and often sold as “legal highs” – as alternatives to, or mixed with, controlled substances. Despite this, very few NPS have established a long-term niche for themselves. Some evidence suggests that legal changes aimed at controlling NPS may have discouraged their use among the general population, although they have established themselves among small subpopulation groups. There was a marked general decline in the use of “bath salts” (mostly synthetic cathinones) among young people in the United States after the sale of such stimulants was outlawed in 2011. Also, in the United Kingdom, use of mephedrone, another cathinone, declined sharply in the years after it was placed under national control in 2010.
Initial drops in drug sales on the darknet after AlphaBay take-down
In mid-2017, law enforcement agencies took down AlphaBay, one of the world’s biggest markets for drugs on the darknet. They also infiltrated another prominent marketplace, Hansa, and kept it running to gather data before shutting it down. More recently, extensive undercover operations led to the take-down in April 2019 of Wall Street Market, at that time the world’s second largest darknet market after Dream Market, which announced its shutdown for the end of the same month.
Some of those who bought drugs on the darknet changed their behaviour after the take-downs, with 15 per cent of customers saying they used the
previous years, it had been North America leading the way. Seizures of cannabis in North America are in long-term decline – down 77 per cent from the level in 2010. This is reflected in data on global sei-zures, which are 20 per cent lower than in 2016.
The decline in seizures in North America has been accompanied by a rise in the non-medical use of cannabis in a context in which measures legalizing the non-medical use of cannabis were implemented in some jurisdictions.
Despite the aim of preventing criminals from gen-erating profits from the illicit trade in cannabis, residual illicit cannabis markets continue to exist in many of the states that have legalized the non-med-ical use of the drug. This is especially evident in Colorado and the State of Washington, which were among the first jurisdictions to allow such measures, in 2012. In California, the initial attempts to license the sale of cannabis in 2018 resulted in prices that were higher than in the illicit market and thus failed to entice users away from the illicit market.
Intensity of cannabis use has been increasing in the context of cannabis legalization
While more people are using cannabis in North America than they were a decade earlier, the increase has been more pronounced in the regular (non-med-ical) use of the drug. For instance, in the United States, the number of past-year users of cannabis rose by some 60 per cent between 2007 and 2017, while the number of daily or nearly daily users of cannabis more than doubled over the period. This group of regular users accounts for the largest share of the cannabis consumed.
Cannabis products have diversified and increased in potency since legalization
In Colorado, while the potency (tetrahydrocannabi-nol (THC) level) of cannabis flower has remained lower than that of cannabis concentrates (20 per cent versus 69 per cent, in 2017), the potency of both product types increased by about 20 per cent over the period 2014–2017.
The market for cannabis concentrates has also evolved rapidly, with a wide range of products now available, each with varying levels of THC, although

15
Law enforcement 1authorities in Asia, mostly in East and South-East Asia. However, ketamine trafficking appears to be spreading to other regions, including Europe, the Americas and Oceania.
LSD and other hallucinogens are mostly intercepted in North America
Some 88 per cent of seizures of hallucinogens other than ketamine were carried out in the Americas over the period 2015–2017. These operations were mostly carried out by law enforcement authorities in the United States.
In terms of weight, the most frequently intercepted substance in this group at the global level was phen-cyclidine (PCP), also known by its street name “angel dust”, which accounted for 44 per cent of the total quantity of hallucinogens seized between 2011 and 2017. However, dimethyltryptamine (DMT) started to dominate global seizures of hal-lucinogens (excluding ketamine) in 2016 and 2017.
Complex global smuggling networks underpin heroin and cocaine markets
The Balkan route remains the world’s busiest heroin trafficking channel
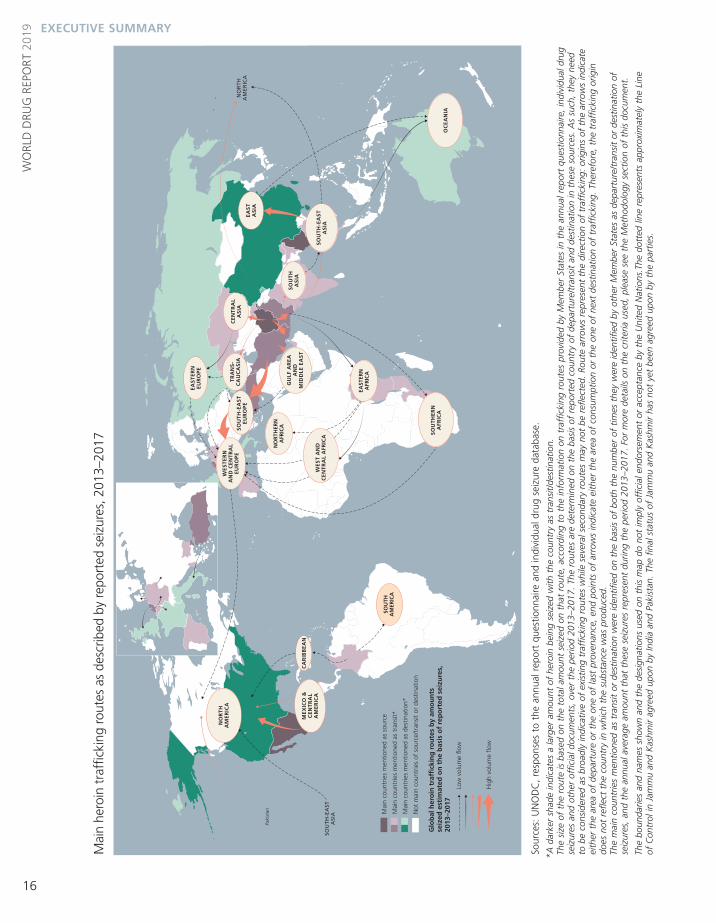
The world’s single largest heroin trafficking pathway continues to be the Balkan route, which sees drugs smuggled from Afghanistan through the Islamic Republic of Iran, Turkey and the Balkan countries and on to various destinations in Western and Cen-tral Europe. Seizures made by countries along the Balkan route accounted for 47 per cent of global quantities of heroin and morphine seized outside Afghanistan in 2017.
Other routes take heroin out of Afghanistan via Pakistan to South Asia or Africa (the southern route), or through Central Asia to markets in the Russian Federation (the northern route). However, those routes seem to be less important, and that importance is declining further, as in the case of the northern route. For example, in 2008, 10 per cent of global heroin and morphine interceptions were made in countries along the northern route; by 2017, this had fallen to 1 per cent.
darknet less frequently and 9 per cent saying they had completely stopped using the darknet as of Janu-ary 2018. Online surveys point to a potential decline in the proportion of users purchasing drugs on the darknet in 2018, notably in North America, Oce-ania and Latin America.
Hallucinogen trafficking is more geographically clustered than trafficking in other drug typesEast and South-East Asia continues to provide the biggest markets for ketamine
Ketamine, a substance not under international con-trol, accounts for 87 per cent of the quantity of hallucinogens seized in the last five years – although a typical dose of ketamine is far larger than a typical dose of lysergic acid diethylamide (LSD). If calcu-lated in terms of doses rather than by weight, LSD would account for 95 per cent of the hallucinogens seized in the past 20 years.
Over the period 2013–2017, 96 per cent of all keta-mine quantities seized worldwide were reported by
The market for NPS is in a constantstate of flux
73 NPSnot reported
since 2014
492 different NPS on the
market in 2017
78 newlyemerging
NPS in 2017
16
WO
RLD
DRU
G R
EPO
RT 2
019 EXECUTIVE SUMMARY
Mai
n he
roin
tra
ffick
ing
rout
es a
s de
scrib
ed b
y re
port
ed s
eizu
res,
201
3–20
17
Sour
ces:
UN
OD
C,
resp
onse
s to
the
ann
ual r
epor
t qu
estio
nnai
re a
nd in
divi
dual
dru
g se
izur
e da
taba
se.
*A d
arke
r sh
ade
indi
cate
s a
larg
er a
mou
nt o
f he
roin
bei
ng s
eize
d w
ith t
he c
ount
ry a
s tr
ansi
t/de
stin
atio
n.
The
size
of
the
rout
e is
bas
ed o
n th
e to
tal a
mou
nt s
eize
d on
tha
t ro
ute,
acc
ordi
ng t
o th
e in
form
atio
n on
tra
ffic
king
rou
tes
prov
ided
by
Mem
ber
Stat
es in
the
ann
ual r
epor
t qu
estio
nnai
re,
indi
vidu
al d
rug
seiz
ures
and
oth
er o
ffic
ial d
ocum
ents
, ov
er t
he p
erio
d 20
13–2
017.
The
rou
tes
are
dete
rmin
ed o
n th
e ba
sis
of r
epor
ted
coun
try
of d
epar
ture
/tra
nsit
and
dest
inat
ion
in t
hese
sou
rces
. A
s su
ch,
they
nee
d to
be
cons
ider
ed a
s br
oadl
y in
dica
tive
of e
xist
ing
traf
ficki
ng r
oute
s w
hile
sev
eral
sec
onda
ry r
oute
s m
ay n
ot b
e re
flect
ed.
Rout
e ar
row
s re
pres
ent
the
dire
ctio
n of
tra
ffic
king
: or
igin
s of
the
arr
ows
indi
cate
ei
ther
the
are
a of
dep
artu
re o
r th
e on
e of
last
pro
vena
nce,
end
poi
nts
of a
rrow
s in
dica
te e
ither
the
are
a of
con
sum
ptio
n or
the
one
of
next
des
tinat
ion
of t
raff
icki
ng.
Ther
efor
e, t
he t
raff
icki
ng o
rigin
do
es n
ot r
efle
ct t
he c
ount
ry in
whi
ch t
he s
ubst
ance
was
pro
duce
d.
The
mai
n co
untr
ies
men
tione
d as
tra
nsit
or d
estin
atio
n w
ere
iden
tifie
d on
the
bas
is o
f bo
th t
he n
umbe
r of
tim
es t
hey
wer
e id
entif
ied
by o
ther
Mem
ber
Stat
es a
s de
part
ure/
tran
sit
or d
estin
atio
n of
se
izur
es,
and
the
annu
al a
vera
ge a
mou
nt t
hat
thes
e se
izur
es r
epre
sent
dur
ing
the
perio
d 20
13–2
017.
For
mor
e de
tails
on
the
crite
ria u
sed,
ple
ase
see
the
Met
hodo
logy
sec
tion
of t
his
docu
men
t.
The
boun
darie
s an
d na
mes
sho
wn
and
the
desi
gnat
ions
use
d on
thi
s m
ap d
o no
t im
ply
offic
ial e
ndor
sem
ent
or a
ccep
tanc
e by
the
Uni
ted
Nat
ions
.The
dot
ted
line
repr
esen
ts a
ppro
xim
atel
y th
e Li
ne
of C
ontr
ol in
Jam
mu
and
Kas
hmir
agre
ed u
pon
by In
dia
and
Paki
stan
. Th
e fin
al s
tatu
s of
Jam
mu
and
Kas
hmir
has
not
yet
been
agr
eed
upon
by
the
part
ies.
M
ain
coun
trie
s m
entio
ned
as s
ourc
e
M
ain
coun
trie
s m
entio
ned
as t
rans
it*
M
ain
coun
trie
s m
entio
ned
as d
estin
atio
n*
N
ot m
ain
coun
trie
s of
sou
rce/
tran
sit
or d
estin
atio
n
Glo
bal
her
oin
tra
ffic
kin
g r
ou
tes
by
amo
un
ts
seiz
ed e
stim
ated
on
th
e b
asis
of
rep
ort
ed s
eizu
res,
20
13–2
017
Sour
ces:
UN
OD
C.
* A
dar
ker
shad
e in
dica
tes
a la
rger
am
ount
of
hero
in b
eing
sei
zed
with
the
cou
ntry
as
tran
sit/
dest
inat
ion.
The
size
of
the
rout
e is
bas
ed o
n th
e to
tal a
mou
nt s
eize
d on
tha
t ro
ute,
acc
ordi
ng t
o th
e in
form
atio
n on
tra
ffic
king
rou
tes
prov
ided
by
Mem
ber
Stat
es in
the
ann
ual r
epor
t qu
estio
nnai
re, i
ndiv
idua
l dru
g se
izur
es a
nd o
ther
off
icia
l doc
umen
ts, o
ver
the
2013
-201
7 pe
riod.
The
rou
tes
are
dete
rmin
ed o
n th
e ba
sis
of r
epor
ted
coun
try
of d
epar
ture
/tra
nsit
and
dest
inat
ion
in t
hese
sou
rces
. As
such
, the
y ne
ed t
o be
con
side
red
as b
road
ly in
dica
tive
of e
xist
ing
traf
ficki
ng r
oute
s w
hile
sev
eral
sec
onda
ry r
oute
s m
ay n
ot b
e re
flect
ed. R
oute
arr
ows
repr
esen
t th
e di
rect
ion
of t
raff
icki
ng: o
rigin
s of
the
arr
ows
indi
cate
eith
er t
he a
rea
of d
epar
ture
or
the
one
of la
st p
rove
nanc
e, e
nd p
oint
s of
arr
ows
indi
cate
eith
er t
he a
rea
of c
onsu
mpt
ion
or t
he o
ne o
f ne
xt d
estin
atio
n of
tra
ffic
king
. The
refo
re, t
he t
raff
icki
ng o
rigin
doe
s no
t re
flect
the
cou
ntry
in w
hich
the
sub
stan
ce w
as p
rodu
ced.
The
mai
n co
untr
ies
men
tione
d as
tra
nsit
or d
estin
atio
n w
ere
iden
tifie
d on
the
bas
is o
f bo
th t
he n
umbe
r of
tim
es t
hey
wer
e id
entif
ied
by o
ther
Mem
ber
Stat
es a
s de
part
ure/
tran
sit
or d
estin
atio
n of
sei
zure
s, a
nd t
he a
nnua
l ave
rage
am
ount
tha
t th
ese
seiz
ures
rep
rese
nt d
urin
g th
e 20
13-2
017
perio
d. F
or m
ore
deta
ils o
n th
e cr
iteria
use
d, p
leas
e se
e th
e M
etho
dolo
gy s
ectio
n of
thi
s do
cum
ent.
The
boun
darie
s an
d na
mes
sho
wn
and
the
desi
gnat
ions
use
d on
thi
s m
ap d
o no
t im
ply
offic
ial e
ndor
sem
ent
or a
ccep
tanc
e by
the
Uni
ted
Nat
ions
. The
dot
ted
line
repr
esen
ts a
ppro
xim
atel
y th
e Li
ne o
f C
ontr
ol in
Jam
mu
and
Kas
hmir
agre
ed u
pon
by In
dia
and
Paki
stan
. The
fin
al s
tatu
s of
Jam
mu
and
Kas
hmir
has
not
yet
been
agr
eed
upon
by
the
part
ies.
A d
ispu
te e
xist
s be
twee
n th
e G
over
nmen
ts o
f A
rgen
tina
and
the
Uni
ted
Kin
gdom
of
Gre
at B
ritai
n an
d N
orth
ern
Irela
nd c
once
rnin
g so
vere
ignt
y ov
er t
he F
alkl
and
Isla
nds
(Mal
vina
s).
NO
RT
H
AM
ER
ICA
NO
RTH
ERN
AFR
ICA
EAST
ERN
AFR
ICA
EA
ST
AS
IA
CE
NT
RA
L A
SIA
EA
ST
ER
N
EU
RO
PE
TR
AN
S-
CA
UC
AS
IA
WE
ST
ER
N
AN
D C
EN
TR
AL
EU
RO
PE
WE
ST
AN
D
CE
NT
RA
L A
FRIC
A
SO
UT
H
AS
IAG
ULF
AR
EA
A
ND
M
IDD
LE E
AS
T
SO
UT
HE
RN
A
FRIC
A
SO
UT
H-E
AS
TA
SIA
OC
EA
NIA
SOU
TH
-EA
STA
SIA
SO
UT
H-E
AS
T
EU
RO
PE
NO
RT
HA
ME
RIC
A
SOU
THA
MER
ICA
ME
XIC
O &
CE
NT
RA
L A
ME
RIC
A
CA
RIB
BE
AN
Mai
n h
ero
in t
raff
icki
ng
ro
ute
s as
d
escr
ibed
by
rep
ort
ed s
eizu
res,
201
3-20
17
Low
vol
ume
flow
Hig
h vo
lum
e flo
w
Paki
stan
17
Law enforcement 1M
ain
coca
ine
traf
ficki
ng r
oute
s as
des
crib
ed b
y re
port
ed s
eizu
res,
201
3–20
17
Sour
ces:
UN
OD
C.
* A
dar
ker
shad
e in
dica
tes
a la
rger
am
ount
of
coca
ine
bein
g se
ized
with
the
cou
ntry
as
tran
sit/
dest
inat
ion.
Th
e si
ze o
f th
e ro
ute
is b
ased
on
the
tota
l am
ount
sei
zed
on t
hat
rout
e, a
ccor
ding
to
the
info
rmat
ion
on t
raff
icki
ng r
oute
s pr
ovid
ed b
y M
embe
r St
ates
in t
he a
nnua
l rep
ort
ques
tionn
aire
, in
divi
dual
dru
g se
izur
es a
nd o
ther
off
icia
l doc
umen
ts,
over
the
per
iod
2013
–201
7. T
he r
oute
s ar
e de
term
ined
on
the
basi
s of
rep
orte
d co
untr
y of
dep
artu
re/t
rans
it an
d de
stin
atio
n in
the
se s
ourc
es.
As
such
, th
ey n
eed
to b
e co
nsid
ered
as
broa
dly
indi
cativ
e of
exi
stin
g tr
affic
king
rou
tes
whi
le s
ever
al s
econ
dary
rou
tes
may
not
be
refle
cted
. Ro
ute
arro
ws
repr
esen
t th
e di
rect
ion
of t
raff
icki
ng:
orig
ins
of t
he a
rrow
s in
dica
te
eith
er t
he a
rea
of d
epar
ture
or
the
one
of la
st p
rove
nanc
e, e
nd p
oint
s of
arr
ows
indi
cate
eith
er t
he a
rea
of c
onsu
mpt
ion
or t
he o
ne o
f ne
xt d
estin
atio
n of
tra
ffic
king
. Th
eref
ore,
the
tra
ffic
king
orig
in
does
not
ref
lect
the
cou
ntry
in w
hich
the
sub
stan
ce w
as p
rodu
ced.
Th
e m
ain
coun
trie
s m
entio
ned
as t
rans
it or
des
tinat
ion
wer
e id
entif
ied
on t
he b
asis
of
both
the
num
ber
of t
imes
the
y w
ere
iden
tifie
d by
oth
er M
embe
r St
ates
as
depa
rtur
e/tr
ansi
t or
des
tinat
ion
of
seiz
ures
, an
d th
e an
nual
ave
rage
am
ount
tha
t th
ese
seiz
ures
rep
rese
nt d
urin
g th
e pe
riod
2013
–201
7. F
or m
ore
deta
ils o
n th
e cr
iteria
use
d, p
leas
e se
e th
e M
etho
dolo
gy s
ectio
n of
thi
s do
cum
ent.
The
boun
darie
s an
d na
mes
sho
wn
and
the
desi
gnat
ions
use
d on
thi
s m
ap d
o no
t im
ply
offic
ial e
ndor
sem
ent
or a
ccep
tanc
e by
the
Uni
ted
Nat
ions
.
Sour
ces:
UN
OD
C.
* A
dar
ker
shad
e in
dica
tes
a la
rger
am
ount
of
coca
ine
bein
g se
ized
with
the
cou
ntry
as
tran
sit/
dest
inat
ion.
The
size
of
the
rout
e is
bas
ed o
n th
e to
tal a
mou
nt s
eize
d on
tha
t ro
ute,
acc
ordi
ng t
o th
e in
form
atio
n on
tra
ffic
king
rou
tes
prov
ided
by
Mem
ber
Stat
es in
the
ann
ual r
epor
t qu
estio
nnai
re, i
ndiv
idua
l dru
g se
izur
es a
nd o
ther
off
icia
l doc
umen
ts, o
ver
the
2013
-201
7 pe
riod.
The
rou
tes
are
dete
rmin
ed o
n th
e ba
sis
of r
epor
ted
coun
try
of d
epar
ture
/tra
nsit
and
dest
inat
ion
in t
hese
sou
rces
. As
such
, the
y ne
ed t
o be
con
side
red
as b
road
ly in
dica
tive
of e
xist
ing
traf
ficki
ng r
oute
s w
hile
sev
eral
sec
onda
ry r
oute
s m
ay n
ot b
e re
flect
ed. R
oute
arr
ows
repr
esen
t th
e di
rect
ion
of t
raff
icki
ng: o
rigin
s of
the
arr
ows
indi
cate
eith
er t
he a
rea
of d
epar
ture
or
the
one
of la
st p
rove
nanc
e, e
nd p
oint
s of
arr
ows
indi
cate
eith
er t
he a
rea
of c
onsu
mpt
ion
or t
he o
ne o
f ne
xt d
estin
atio
n of
tra
ffic
king
. The
refo
re, t
he t
raff
icki
ng o
rigin
doe
s no
t re
flect
the
cou
ntry
in w
hich
the
sub
stan
ce w
as p
rodu
ced.
The
mai
n co
untr
ies
men
tione
d as
tra
nsit
or d
estin
atio
n w
ere
iden
tifie
d on
the
bas
is o
f bo
th t
he n
umbe
r of
tim
es t
hey
wer
e id
entif
ied
by o
ther
Mem
ber
Stat
es a
s de
part
ure/
tran
sit
or d
estin
atio
n of
sei
zure
s, a
nd t
he a
nnua
l ave
rage
am
ount
tha
t th
ese
seiz
ures
rep
rese
nt d
urin
g th
e 20
13-2
017
perio
d. F
or m
ore
deta
ils o
n th
e cr
iteria
use
d, p
leas
e se
e th
e M
etho
dolo
gy s
ectio
n of
thi
s do
cum
ent.
The
boun
darie
s an
d na
mes
sho
wn
and
the
desi
gnat
ions
use
d on
thi
s m
ap d
o no
t im
ply
offic
ial e
ndor
sem
ent
or a
ccep
tanc
e by
the
Uni
ted
Nat
ions
. A d
ispu
te e
xist
s be
twee
n th
e G
over
nmen
ts o
f A
rgen
tina
and
the
Uni
ted
Kin
gdom
of
Gre
at B
ritai
n an
d N
orth
ern
Irela
nd c
once
rnin
g so
vere
ignt
y ov
er t
he F
alkl
and
Isla
nds
(Mal
vina
s).
NO
RT
H
AM
ER
ICA
SOU
THA
MER
ICA
NO
RTH
ERN
AFR
ICA
WE
ST
ER
N
AN
D C
EN
TR
AL
EU
RO
PE
WE
ST
AN
D
CE
NT
RA
L A
FRIC
A
ME
XIC
O &
CE
NT
RA
L A
ME
RIC
A
CA
RIB
BE
AN
EA
ST A
ND
SOU
TH
-EA
ST
ASI
A
SO
UT
H
AS
IA
NE
AR
AN
D
MID
DLE
EA
ST
A
ND
S
OU
TH
-WE
ST
AS
IA
SO
UT
HE
RN
A
FRIC
A
EA
ST
AN
DS
OU
TH
-EA
ST
AS
IA
OC
EA
NIA
OC
EA
NIA
SO
UT
H-E
AS
T
EU
RO
PE
SOU
TH
AM
ER
ICA
EA
ST
ER
N
EU
RO
PE
AN
DE
AN
CO
UN
TR
IES
M
ain
coun
trie
s m
entio
ned
as s
ourc
e
M
ain
coun
trie
s m
entio
ned
as t
rans
it*
M
ain
coun
trie
s m
entio
ned
as d
estin
atio
n*
M
ain
coun
trie
s m
entio
ned
as b
oth
tran
sit
an
d de
stin
atio
n*
N
ot m
ain
coun
trie
s of
sou
rce/
tran
sit
or d
estin
atio
n
AN
DE
AN
CO
UN
TR
IES
Low
vol
ume
�ow
Hig
h vo
lum
e �o
w
Glo
bal
co
cain
e tr
affi
ckin
g r
ou
tes
by
amo
un
t se
ized
es
tim
ated
on
th
e b
asis
of
rep
ort
ed s
eizu
res,
20
13-2
017

18
WO
RLD
DRU
G R
EPO
RT 2
019 EXECUTIVE SUMMARY
Most of the heroin trafficked in the Americas originates within the region
The amount of heroin seized in the Americas has shown a clear upward trend over the last decade. Most of this trafficking takes place within North America, usually from Mexico to the United States, although the heroin found in Canada originates in Afghanistan.
Analysis of wholesale seizures of heroin in the United States has shown the increasing predominance of heroin originating in Mexico. Some 80 per cent of the heroin samples analysed in 2016 came from Mexico.
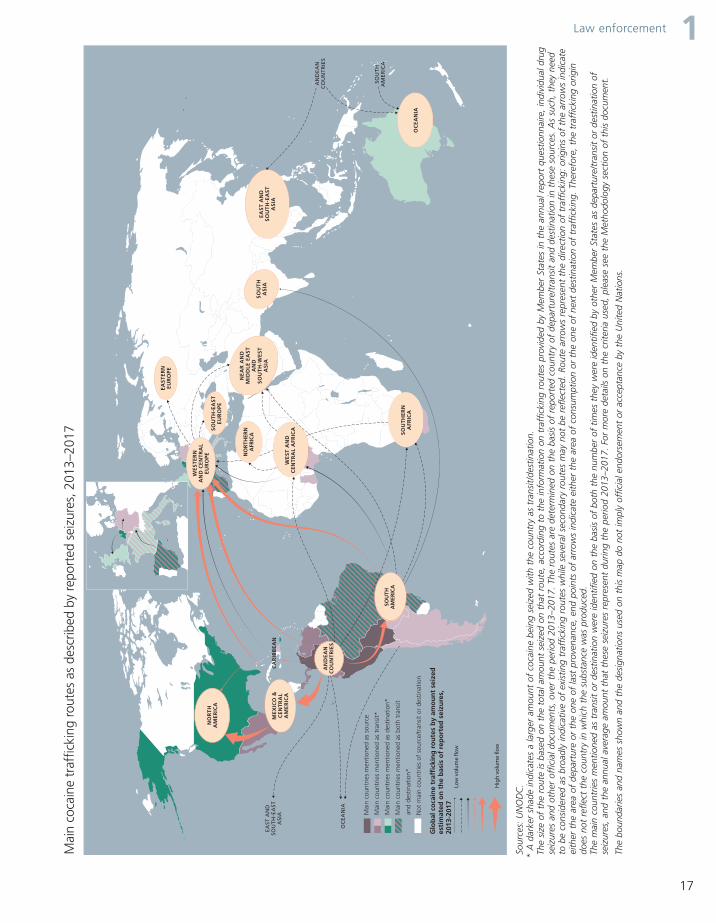
Cocaine trafficking has expanded into a global phenomenon since the 1980s
Some 143 countries across all regions reported cocaine seizures over the period 2013–2017, up from 99 countries over the period 1983–1987.
Most of the cocaine trafficked from the Andean countries of South America is destined for the main consumer markets in North America and Western and Central Europe. Seizures in North America have more than doubled in recent years, from 94 tons in 2013 to 238 tons in 2017.
The second most important cocaine trafficking flow worldwide is from the Andean countries to Western Europe. The quantity of cocaine seized in Western and Central Europe has also more than doubled in the past five years, from 65 tons in 2013 to 141 tons in 2017.
Relationship between licit production and illicit markets remains sometimes unclearFentanyl and tramadol markets are likely underpinned by illicit supply
Data that can help explain whether pharmaceutical opioids are diverted from the licit to the illicit market or are illicitly produced at source are limited, although the situation varies depending on the sub-stance and region.
In the case of fentanyl, for example, the bulk of the substance found on the illicit market comes from illicit manufacture, although some small diversions of fentanyl have been reported in the United States. The large market for tramadol for non-medical use in North Africa and the Near and Middle East also seems to be supplied by tramadol specifically manu-factured and trafficked for the illegal market, but information remains limited.
The illicit market for other pharmaceu-tical opioids is likely sourced from licit channels, although illicit manufacture also occurs
Outside North America, where the diversion of pharmaceutical opioids such as codeine and oxyco-done from the licit to the illicit market is evident, such diversions are not reported in large quantities. This could be the result of underreporting or the limited capacity of law enforcement authorities to detect diversions. There is a gap in knowledge about the supply chain of codeine, a substance used non-medically in many subregions. The fact that most seized codeine is lic-itly manufactured and the lack of evidence of illicit laboratories manufacturing codeine suggest that non-medical use of codeine is largely fuelled by the legal supply chain.However, it is unclear how and at what stage the supply of codeine for medical use is diverted for non-medical use. There may be a combination of scenarios: some codeine preparations may be easy to access through pharmacies or other types of out-lets, and some diversion may take place before the drug reaches the retail market, resulting in the licit supply being diverted to the illicit market.

19
Health consequences 1 More than 11 million
people inject drugs
1.4 million people who inject drugs are living with HIV
5.6 million are living with hepatitis C
1.2 million are living with both hepatitis C and HIV
HEALTH CONSEQUENCES
The adverse health consequences associated with the use of drugs remain considerable
More than 11 million people worldwide inject drugs
People who inject drugs (PWID) experience mul-tiple negative health consequences. They are at an increased risk of fatal overdose and are dispropor-tionately affected by blood-borne infectious diseases such as HIV and hepatitis C. The number of people who inject drugs worldwide stood at 11.3 million in 2017.
A small number of countries account for a consid-erable proportion of the global number of PWID. Some 43 per cent of all PWID reside in just three countries: China, the Russian Federation and the United States.
Patterns of HIV infection among people who inject drugs have wide regional variations
Roughly one in eight people who inject drugs lives with HIV, amounting to 1.4 million people. UNAIDS estimates that injecting drug users are 22 times more likely than the general population to be infected with HIV.
The prevalence of HIV among PWID is the highest by far in South-West Asia and in Eastern and South-Eastern Europe, with rates that are 2.3 and 1.8 times the global average, respectively. Those two subre-gions also have higher than average proportions of injecting drug users.
Action to tackle hepatitis C epidemic among people who inject drugs has been slow
Hepatitis C is highly prevalent among PWID, with almost one half of PWID, or some 5.6 million people, living with hepatitis C.
Highly effective treatment for hepatitis C has recently become available in the form of direct-act-ing antivirals, potentially transforming the management and outlook for PWID living with
hepatitis C. However, despite the opportunity afforded by these new medications in addressing the high burden of hepatitis C among PWID, progress in scaling-up prevention and treatment services among PWID has been slow.
Deaths and years of “healthy” life lost attributed to the use of drugs remain unacceptably high
Some 585,000 people are estimated to have died as a result of drug use in 2017. More than half of those deaths were the result of untreated hepatitis C lead-ing to liver cancer and cirrhosis; almost one third were attributed to drug use disorders. Most (two thirds) of the deaths attributed to drug use disorders were related to opioid use.
Some 42 million years of “healthy” life were lost (premature deaths and years lived with disability) as a result of drug use. They were also mostly attrib-uted to drug use disorders, especially from the use of opioids.

20
WO
RLD
DRU
G R
EPO
RT 2
019 EXECUTIVE SUMMARY
Numbers of countries implemen�ng interven�ons in at least one prison
Opioid-subs�tu�on therapy
Needle-syringe programmes
Both
56
11
10
The greatest burden of disease is seen in East and South-East Asia, North America and South Asia, reflecting the large numbers of opioid users and PWID in those subregions.
Treatment demand for cannabis use disorders is increasing in most regions
All regions except Africa, where the proportion is higher than in other regions, have seen an increas-ing proportion of people entering treatment for cannabis use disorders as the primary drug of con-cern. Opioids (predominantly heroin) remain the main drug type for which people receive treatment in Europe (particularly in Eastern and South-Eastern Europe) and Asia. In Europe, an ageing cohort of opioid users, many of them in contact with drug treatment services, remains a health concern.
Cocaine users increasingly seek treatment in Europe, most often for polydrug use
The number of people seeking treatment for the first time for cocaine use disorders has increased over the past two years in European Union coun-tries. Three quarters of those who accessed specialized drug treatment services for the first time were reported in just three countries: Italy, Spain and the United Kingdom.Among all cocaine users entering drug treatment in the European Union, one third were seeking treat-ment only for cocaine use disorders. The rest also reported the use of secondary substances, especially alcohol and cannabis. Many of the “crack” cocaine users entering treatment reported using heroin as a secondary drug.
Patterns of drug use and treatment needs vary according to genderWomen disproportionately affected by the non-medical use of tranquillizers and sedatives
The non-medical use of sedatives and tranquillizers was reported in all regions in 2017. Women are particularly affected by this kind of substance use.
In countries in South and Central America, the non-medical use of tranquillizers in the past year concerns more than 2 per cent of the general population, and such use is higher among women than among men.
Similarly, 14 countries in Western and Central Europe reported on the non-medical use of tran-quillizers in 2017, and in all countries the rate was higher among women than among men. Also, in 8 of the 14 countries, the non-medical use of tran-quillizers was more prevalent than the use of cannabis.
Substance use by women tends to progress to drug use disorders in a shorter time period than substance use by men. However, women may be afraid to seek treatment, in particular if they are pregnant and fear legal issues and social stigma. If they are mothers or caregivers, childcare arrangements can become an issue, for example.
Prisoners are vulnerable to drug use but underserved by treatment programmesPeople with a history of drug use or drug use disorders form a substantial part of the prison population in some countries
Drug use and drug use disorders are highly prevalent among people who are incarcerated. Based on stud-ies from high-income countries, drug use disorders are more prevalent in female prisoners than in male
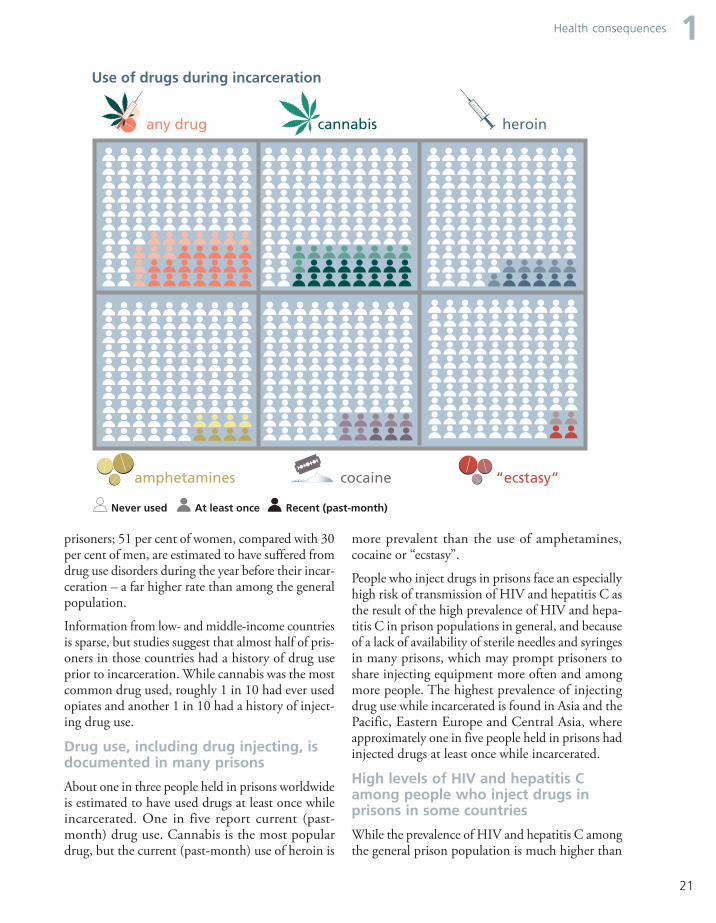
21
Health consequences 1
more prevalent than the use of amphetamines, cocaine or “ecstasy”.
People who inject drugs in prisons face an especially high risk of transmission of HIV and hepatitis C as the result of the high prevalence of HIV and hepa-titis C in prison populations in general, and because of a lack of availability of sterile needles and syringes in many prisons, which may prompt prisoners to share injecting equipment more often and among more people. The highest prevalence of injecting drug use while incarcerated is found in Asia and the Pacific, Eastern Europe and Central Asia, where approximately one in five people held in prisons had injected drugs at least once while incarcerated.
High levels of HIV and hepatitis C among people who inject drugs in prisons in some countries
While the prevalence of HIV and hepatitis C among the general prison population is much higher than
any drug
cocaineamphetamines
Use of drugs during incarceration
cannabis
“ecstasy”
heroin
Recent (past-month)At least onceNever used
prisoners; 51 per cent of women, compared with 30 per cent of men, are estimated to have suffered from drug use disorders during the year before their incar-ceration – a far higher rate than among the general population.
Information from low- and middle-income countries is sparse, but studies suggest that almost half of pris-oners in those countries had a history of drug use prior to incarceration. While cannabis was the most common drug used, roughly 1 in 10 had ever used opiates and another 1 in 10 had a history of inject-ing drug use.
Drug use, including drug injecting, is documented in many prisons
About one in three people held in prisons worldwide is estimated to have used drugs at least once while incarcerated. One in five report current (past-month) drug use. Cannabis is the most popular drug, but the current (past-month) use of heroin is
22
WO
RLD
DRU
G R
EPO
RT 2
019 EXECUTIVE SUMMARY
among the general population in the community, the limited data available point to rates that are substan-tially higher among PWID in prisons (injected any drug before or during incarceration) than among non-injecting prisoners.
A review of available studies found that PWID in prison had six times the prevalence of HIV and more than eight times the prevalence of hepatitis C com-pared with the non-injecting prison population.
Major gaps in the prevention and treatment services for infectious diseases in prison
Fifty-six countries reported that they provided opioid substitution therapy in at least one prison in 2017, while 46 countries reported not having such a treat-ment option in prison settings. Needle-syringe programmes are far less available in prison: 11 coun-tries reported their availability in at least one prison, but such programmes were confirmed as absent in 83 countries. While the provision of both interven-tions in combination can be particularly effective in preventing the spread of HIV and hepatitis C, there were only 10 countries that provided such interven-tions in at least one prison, although both were not necessarily available in the same prisons.
The high prevalence of hepatitis C and HIV in prison populations, especially among PWID, and the con-siderable adverse health consequences associated with these infectious diseases underscore the need for test-ing and access to treatment in prison settings. Fewer countries report the availability of testing and treat-ment, in at least one prison, for hepatitis C (42 countries had testing and 39 countries had treatment) than for HIV (78 countries had testing and 87 coun-tries had treatment).
23
substance use through interventions proven to be effective and supported by international standards. Vulnerability to initiating and developing substance use disorders is contingent on a number of protec-tive and risk factors related to an individual and aspects of their environment – parents, family, school and peers – as well as the influence of the physical and socioeconomic environment. Interven-tions can be successful only if they strengthen protective conditions while attenuating or prevent-ing factors that increase vulnerability, including by contributing to the overall positive engagement of young people and their families, schools and communities.
Understanding drug use as a complex, multifaceted and relapsing chronic condition that requires con-tinuing care and interventions, drawing on many disciplines, can help to dispel the stigma associated with drug use. This can also support increased efforts to:• Scale up scientific evidence-based interventions
for the treatment of drug use disorders that are integrated within the health-care delivery system of each country, encompass universal access to services, are available and accessible in different settings to people in need, are based on principles of human rights and ethics, and address the varied needs of people with drug use disorders.
• Scale up the provision of the comprehensive package of nine interventions for the prevention and treatment of hepatitis C, HIV and other in-fections among people who use or inject drugs, which is a package based on the principles of equality, comprehensiveness, accessibility and sus-tainability and which encompasses universal access to services.
• Ensure that emergency room interventions for acute drug intoxication and overdose cases in hos-pitals and in community settings are available and accessible to people who use drugs; for each fatal overdose there are at least 20 cases of non-fatal overdose.
• Scale up overdose prevention interventions, especially in the case of opioids, by promoting access to naloxone and the training of potential first responders in overdose management, and
Strengthened international cooperation and con-certed support are needed to stop global drug challenges from endangering efforts to achieve Sus-tainable Development Goal targets to ensure healthy lives and promote peace and justice. Changing global patterns of drug use, involving controlled drugs (heroin, cocaine, amphetamines and canna-bis), NPS and non-medical use of pharmaceutical drugs, have contributed to increasingly complex challenges. Some 35 million people suffer from drug use disorders and 11 million inject drugs, of whom 1.4 million live with HIV and 5.6 million live with hepatitis C. Evidence on the adverse health consequences of drug use suggests a higher burden of disease than what had previously been estimated, with over half a mil-lion deaths and 42 million years of “healthy” life lost due to drug use. Illicit drug crop cultivation and plant-based manufacture are at historically high levels. Despite a decline in 2017, the area under opium poppy cultivation and global opium produc-tion remain at high levels, and coca bush cultivation and the global manufacture of cocaine have also reached record levels.An area where the international community has had a degree of success is in addressing NPS, evidenced by a decline in the number of NPS identified and reported for the first time to UNODC. NPS have not been taken up in the market to the extent feared a few years ago, and the international community has reacted in a timely manner to assess the harms caused by NPS and to schedule those that warranted international control.
Help for those who need itPublic health responses continue to fall short. Effec-tive treatment interventions based on scientific evidence and in line with international human rights obligations are not as available or accessible as they need to be, and national governments and the inter-national community need to step up interventions to address this gap.
Greater commitments and resources are needed, first and foremost to scale up the prevention of
CONCLUSIONS AND POLICY IMPLICATIONS

24
WO
RLD
DRU
G R
EPO
RT 2
019 EXECUTIVE SUMMARY
upon the wider society, especially in relation to infec-tious diseases and mental health conditions, as almost all people in prison eventually return to their communities. Improving the health outcomes of people in prisons, in turn, improves public health and reduces health inequalities among the general population.
The global paradox of too much and not enough
Pharmaceutical opioids are essential medicines for the management of pain and other conditions. Yet a large proportion of the global population contin-ues to have minimal access to such medicines because of legislative, regulatory, administrative and human resource impediments. The aim of the inter-national drug control conventions has always been to ensure the availability of controlled substances for medical and scientific purposes while preventing their diversion and misuse. Applying the spirit of the international drug conventions calls for the removal of barriers that can limit the availability and accessibility of controlled drugs for their medi-cal use. Legal and regulatory frameworks and clinical guidelines based on rational prescription practices can help increase accessibility to prescription drugs, including pharmaceutical opioids, while reducing the risk of their diversion.
However, irrational prescription practices, unjusti-fied promotion and uncontrolled availability of prescription drugs result in negative consequences and their non-medical use has become detrimental to public and individual health in many subregions worldwide. The non-medical use of prescription drugs, in particular of pharmaceutical opioids, poses a dilemma for both national and international con-trol mechanisms.
As the analysis in the present report shows, non-medical use of prescription drugs is a major component of overall polydrug use patterns and of the adverse health consequences of drug use. People misuse prescription drugs to self-medicate, especially in the context of a weak health system; to intensify the effects of the main substance used; to overcome the side effects of the main drug, or to alleviate the adverse effects and severity of withdrawal symptoms.
set up such overdose prevention programmes in the many subregions where they do not yet ex-ist. Opioids contribute to a major proportion of disability-adjusted life years (DALYs) attributed to drug use disorders.
Mitigate concentrations of high risk
A central principle of the 2030 Agenda for Sustain-able Development is to “ensure that no one is left behind” and to “reach the furthest behind first”. Among the population groups most affected by the drug problem are people held in prisons. This year, the World Drug Report provides in-depth analysis of drug use and its adverse health consequences in prison settings, which suggests that the risks associ-ated with drug use disorders and mental health disorders, HIV, hepatitis C and tuberculosis are higher than among the general population. The prevalence of infectious diseases such as HIV, hepa-titis C and active tuberculosis are also disproportionally higher among prison populations, in particular among those who inject drugs in prison.
One strategy to mitigate risks associated with drug use and its adverse health consequences is to pro-mote alternatives to incarceration, in line with the international drug control conventions, by provid-ing people who use drugs and with drug use disorders who have come into contact with the crim-inal justice system with the option of entering voluntarily evidence-based drug treatment services within the community.
People held in prisons have the same right to health and well-being as any other person. The Nelson Mandela Rules emphasize that health care for people in prison should be of the same standard as that available in the community, and that continuity of treatment and care should be ensured on admission, transfer and release from prison. The provision of the comprehensive package of 15 evidence-based key interventions that are essential for effective pre-vention and treatment of HIV, hepatitis C and tuberculosis in prison settings must be a key com-ponent of health-care services for people who use drugs in such closed settings. It is also important to consider that the health of people in prison impacts
25
Conclusions and policy implications 1Effectively addressing the supply of drugs requires shifting the focus of law enforcement agencies from measuring success by quantities of drugs seized to dismantling drug trafficking organizations and transnational organized criminal groups. This in turn requires increased sophistication, the develop-ment of a critical mass of basic knowledge and the sharing of operational information among law enforcement authorities and specialized units in dif-ferent jurisdictions. In addition, the business structure of organized crime groups is changing, at times moving towards more loosely associated net-works that are difficult to interdict, and thus there is a need to enhance training for law enforcement officials and investment in analysis to understand these new dynamics and design effective counter-narcotic interventions. Such actions would benefit from effective coordination among national, regional and international institutions.
Cannabis markets need to be closely monitoredWhile it is too early to assess the ultimate impact of the legislation allowing the non-medical use of can-nabis in Canada, Uruguay and jurisdictions in the United States of America, some early trends are worthy of close monitoring. One stated aim of legal-ization was to prevent organized crime groups from generating profits from cannabis; however, thriving illicit cannabis markets still exist in many of the states in the United States that allow the non-med-ical use of cannabis. This is particularly evident in the states of Colorado and Washington, which, in 2012, were among the first jurisdictions in the coun-try to adopt measures allowing the non-medical use of cannabis.
Another outcome of such legislation is that com-mercial companies are rapidly replacing artisanal producers of cannabis. With the market for non-medical use of cannabis expanding rapidly, profits are more likely to dictate and control the course of the cannabis industry than are public health con-siderations. The marketing and availability of a wide range of cannabis products with a THC content far higher than that seen a couple of decades ago in states allowing non-medical use is a case in point.
More research is needed to improve understanding of the dynamics of non-medical use of prescription drugs to address their misuse effectively while guar-anteeing the availability and accessibility of essential medicines. The challenge is to strike the correct bal-ance between legitimate medical accessibility and the risk of diversion of prescription drugs. A case in point is tramadol, which is medically in high demand yet, due to its limited regulation, a source of profit for criminal groups operating in Central, West and North Africa, the Near and Middle East and subregions in Asia. Tightening control of trama-dol in countries where its supply originates and in destination countries helps to counter the traffick-ing of such falsified medicines. This was the basis of the recent measures introduced in India to control tramadol under the narcotics law and thus give law enforcement authorities official powers to deal with the illicit manufacturing and smuggling of the sub-stance. However, such national efforts rely on international cooperation, based on the principle of the shared and common responsibility.
Law enforcement is an integral part of the solution
Where vulnerability exists, criminal opportunity exploits. Addressing both in a balanced and com-prehensive manner through health-centred, rights-based criminal justice responses is essential. The record levels of cocaine and opiate production in the last couple of years, together with a still expanding market for synthetic drugs such as illicitly manufactured fentanyl and its analogues, require intensified efforts by law enforcement authorities. International cooperation remains a tool crucial to successfully countering drug trafficking. For exam-ple, China introduced national legislation in May 2019 that scheduled most of the fentanyl analogues currently known worldwide.
Nevertheless, since drug traffickers can replace drugs lost at wholesale cost, drug seizures per se cannot be expected to disrupt drug markets unless they are exceedingly large. If a seizure is associated with the dismantling of an organization that had a substantial share of market throughput capacity, a correlation between seizures and price changes, as well as an impact on the drug market, may be observed.

26
WO
RLD
DRU
G R
EPO
RT 2
019 EXECUTIVE SUMMARY
Evolving complexity highlights need for further researchThe availability of new and reliable data in 2019 on the extent of drug use from two countries with large populations, Nigeria and India, has improved regional and global estimates of drug use enor-mously. This new empirical evidence has led to an increase in the estimated global number of opioid users: there are 50 per cent more than previously thought. This has implications for global measures to address adverse health consequences attributed to the use of opioids and scale up services to address the global opioid crisis. It is also a reminder of the continuing need to improve data and analysis in a context where perceptions often dominate public debate. Global drug challenges are evolving and complex, requiring an evolving and refined under-standing to inform responses. This requires the scaling-up of data collection, dissemination, analysis and research. This will enable national and interna-tional stakeholders to assess the drug problem with precision, guide global policy discussions and drive the international cooperation agenda and direct sup-port where it is needed.
The international data collection system needs to be brought up to date in order to reflect the dynam-ics of both drug use and the supply of controlled substances. The monitoring of the modi operandi of drug traffickers and their trafficking routes needs to capture the dynamics and incentive systems inher-ent to drug trafficking. There is a need to understand, in particular, the complexity and variability of the spectrum of drug trafficking modalities. The dynam-ics of the recent opioid crisis in North America, which are now coming to light, highlight the need to address both sophisticated trafficking of large shipments in containers and the smuggling of small packages containing NPS and synthetic opioids (fen-tanyl analogues) via the postal system. Some end users buy their products directly online or via the darknet, posing additional challenges. This chang-ing landscape is a far cry from the situation of just two decades ago, with mostly organic psychoactive substances being trafficked across borders.
Another illustration of how today’s dynamics demand new insight is the decline in the trafficking of opiates along the northern route at a time when
It is also noteworthy that in the United States, every single state that has legalized non-medical use of cannabis first legalized it in a medical capacity; with the exception of one state, ballots have been the main route to the acceptance, first of medical and then of non-medical use. The ongoing policy debate and its coverage in the media appear to have impacted the risk perceptions of harm caused by cannabis use, especially among young people. This is illustrated by the marked increase in more frequent and heavy use of cannabis and, while frequent and heavy users constitute only a small share of all annual cannabis users, they account for the vast majority of the consumption of cannabis products in the market. The scientific literature suggests that people using cannabis who progress to daily use have a higher probability of developing cannabis use dis-orders, while regular and heavy use of cannabis with a high THC content has been identified as a risk factor for acute and chronic adverse health out-comes, including mental health problems and cannabis use disorders.
The availability of cannabis with a comparatively higher THC content has resulted in an increasing number of people seeking treatment for cannabis use disorders in many subregions. In addition to evidence-based prevention strategies that start at an early age, there is a need to improve understanding, especially among young people, of the negative health consequences, both of early initiation and the long-term heavy and frequent non-medical use of cannabis.
Moreover, public debate tends to confuse or conflate non-medical use of cannabis, including use of can-nabis flower and other concentrates with high levels of THC, with medical use of cannabis products such as THC and CBD, often in the form of pharma-ceutical preparations for treating and managing health conditions including chronic pain, multiple sclerosis and spasticity symptoms, and sleep distur-bances associated with fibromyalgia and chronic pain. CBD, a cannabinoid that is not a psychoactive agent and is often promoted as a health and well-ness product, should not be confused with THC, a very different and psychoactive cannabinoid. Policy, legislation and public debate would do well to address these very different issues with greater clarity.

27
Conclusions and policy implications 1Improving the quality and coverage of data on indi-cators of drug use and its health consequences (especially estimates from highly populated coun-tries) as well as supply indicators will strengthen the analysis and evidence presented in the World Drug Report and better inform the global policy debate. This requires promoting cooperation among differ-ent international and regional stakeholders on data collection, reporting and research. It also requires promoting initiatives for building capacities in Member States to improve the quality and coverage of national data and conduct operational research on drug markets.
Afghan opiate production is at its peak. The decline in the quantities of opiates seized along the northern route can be attributed to altering trade incentives and risks, resulting in a possible displacement to other routes. Among the potential reasons to be studied are the decline in demand for opiates along the northern route and the shift from the use of opiates to the use of other drugs, including synthetic opioids, regional cooperation and the increasing ability of national authorities to prevent opiate trafficking.
To ensure better control of the illicit manufacture and trafficking of synthetic opioids (fentanyl and analogues) and other NPS, there is also a need to further develop national monitoring and research capacity not only to enhance forensic capacity but also to identify and report on the emergence of psy-choactive substances.
The evolving situation related to the non-medical use of cannabis and the expanding cannabis market has spurred understanding of the need for more research and consistent data. In the jurisdictions with legislation allowing the non-medical use of cannabis, the different cannabis products, their potency, health effects and use, including for medi-cal purposes, are not yet fully documented, making it difficult for policymakers, pharmaceutical com-panies and potential users to assess the public health impact.

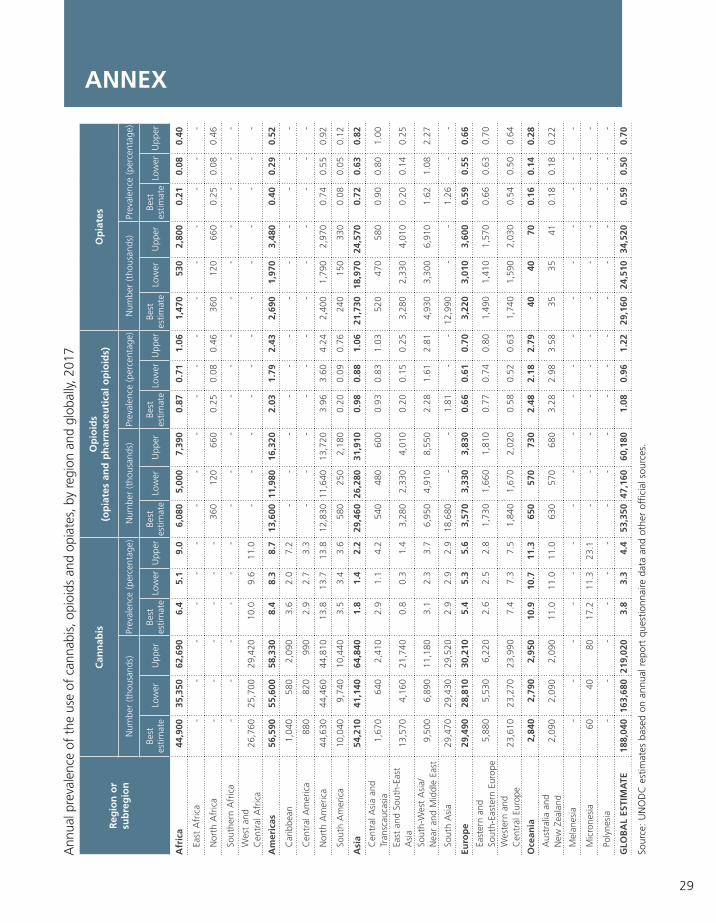
29
ANNEX A
nnua
l pre
vale
nce
of t
he u
se o
f ca
nnab
is, o
pioi
ds a
nd o
piat
es, b
y re
gion
and
glo
bally
, 201
7
Sour
ce:
UN
OD
C e
stim
ates
bas
ed o
n an
nual
rep
ort
ques
tionn
aire
dat
a an
d ot
her
offic
ial s
ourc
es.
Reg
ion
or
sub
reg
ion
Can
nab
isO
pio
ids
(op
iate
s an
d p
har
mac
euti
cal
op
ioid
s)O
pia
tes
Num
ber
(tho
usan
ds)
Prev
alen
ce (
perc
enta
ge)
Num
ber
(tho
usan
ds)
Prev
alen
ce (
perc
enta
ge)
Num
ber
(tho
usan
ds)
Prev
alen
ce (
perc
enta
ge)
Best
es
timat
eLo
wer
Upp
erBe
st
estim
ate
Low
erU
pper
Best
es
timat
eLo
wer
Upp
erBe
st
estim
ate
Low
erU
pper
Best
es
timat
eLo
wer
Upp
erBe
st
estim
ate
Low
erU
pper
Afr
ica
44,9
0035
,350
62,6
906.
45.
19.
06,
080
5,00
07,
390
0.87
0.71
1.06
1,47
053
02,
800
0.21
0.08
0.40
East
Afr
ica
--
--
--
--
--
--
--
--
--
Nor
th A
fric
a-
--
--
-36
012
066
00.
250.
080.
4636
012
066
00.
250.
080.
46
Sout
hern
Afr
ica
--
--
--
--
--
--
--
--
--
Wes
t an
d
Cen
tral
Afr
ica
26,7
6025
,700
29,4
2010
.09.
611
.0-
--
--
--
--
--
-
Am
eric
as56
,590
55,6
0058
,330
8.4
8.3
8.7
13,6
0011
,980
16,3
202.
031.
792.
432,
690
1,97
03,
480
0.40
0.29
0.52
Car
ibbe
an1,
040
580
2,09
03.
62.
07.
2-
--
--
--
--
--
-
Cen
tral
Am
eric
a88
082
099
02.
92.
73.
3-
--
--
--
--
--
-
Nor
th A
mer
ica
44,6
3044
,460
44,8
1013
.813
.713
.812
,830
11,6
4013
,720
3.96
3.60
4.24
2,40
01,
790
2,97
00.
740.
550.
92
Sout
h A
mer
ica
10,0
409,
740
10,4
403.
53.
43.
658
025
02,
180
0.20
0.09
0.76
240
150
330
0.08
0.05
0.12
Asi
a54
,210
41,1
4064
,840
1.8
1.4
2.2
29,4
6026
,280
31,9
100.
980.
881.
0621
,730
18,9
7024
,570
0.72
0.63
0.82
Cen
tral
Asi
a an
d
Tran
scau
casi
a1,
670
640
2,41
02.
91.
14.
254
048
060
00.
930.
831.
0352
047
058
00.
900.
801.
00
East
and
Sou
th-E
ast
Asi
a13
,570
4,16
021
,740
0.8
0.3
1.4
3,28
02,
330
4,01
00.
200.
150.
253,
280
2,33
04,
010
0.20
0.14
0.25
Sout
h-W
est
Asi
a/N
ear
and
Mid
dle
East
9,50
06,
890
11,1
803.
12.
33.
76,
950
4,91
08,
550
2.28
1.61
2.81
4,93
03,
300
6,91
01.
621.
082.
27
Sout
h A
sia
29,4
7029
,430
29,5
202.
92.
92.
918
,680
--
1.81
--
12,9
90-
-1.
26-
-
Euro
pe
29,4
9028
,810
30,2
105.
45.
35.
63,
570
3,33
03,
830
0.66
0.61
0.70
3,22
03,
010
3,60
00.
590.
550.
66
East
ern
and
So
uth-
East
ern
Euro
pe5,
880
5,53
06,
220
2.6
2.5
2.8
1,73
01,
660
1,81
00.
770.
740.
801,
490
1,41
01,
570
0.66
0.63
0.70
Wes
tern
and
C
entr
al E
urop
e23
,610
23,2
7023
,990
7.4
7.3
7.5
1,84
01,
670
2,02
00.
580.
520.
631,
740
1,59
02,
030
0.54
0.50
0.64
Oce
ania
2,84
02,
790
2,95
010
.910
.711
.365
057
073
02.
482.
182.
7940
4070
0.16
0.14
0.28
Aus
tral
ia a
nd
New
Zea
land
2,09
02,
090
2,09
011
.011
.011
.063
057
068
03.
282.
983.
5835
3541
0.18
0.18
0.22
Mel
anes
ia-
--
--
--
--
--
--
--
--
-
Mic
rone
sia
6040
8017
.211
.323
.1-
--
--
--
--
--
-
Poly
nesi
a-
--
--
--
--
--
--
--
--
-
GLO
BA
L ES
TIM
ATE
188,
040
163,
680
219,
020
3.8
3.3
4.4
53,3
5047
,160
60,1
801.
080.
961.
2229
,160
24,5
1034
,520
0.59
0.50
0.70

30
WO
RLD
DRU
G R
EPO
RT 2
019 EXECUTIVE SUMMARY
Ann
ual p
reva
lenc
e of
the
use
of
coca
ine,
a am
phet
amin
esb
and
“ecs
tasy
”, b
y re
gion
and
glo
bally
, 201
7
Sour
ce:
UN
OD
C e
stim
ates
bas
ed o
n an
nual
rep
ort
ques
tionn
aire
dat
a an
d ot
her
offic
ial s
ourc
es.
a C
ocai
ne in
clud
es c
ocai
ne s
alt,
"cr
ack"
coc
aine
and
oth
er t
ypes
suc
h as
coc
a pa
ste,
coc
aine
bas
e, "
basu
co",
"pa
co"
and
"mer
la".
b
Am
phet
amin
es in
clud
e bo
th a
mph
etam
ine
and
met
ham
phet
amin
e.
Reg
ion
or
sub
reg
ion
Co
cain
eaA
mp
het
amin
esb
an
d
ph
arm
aceu
tica
l st
imu
lan
ts“E
csta
sy”
Num
ber
(tho
usan
ds)
Prev
alen
ce (
perc
enta
ge)
Num
ber
(tho
usan
ds)
Prev
alen
ce (
perc
enta
ge)
Num
ber
(tho
usan
ds)
Prev
alen
ce (
perc
enta
ge)
Best
es
timat
eLo
wer
Upp
erBe
st
estim
ate
Low
erU
pper
Best
es
timat
eLo
wer
Upp
erBe
st
estim
ate
Low
erU
pper
Best
es
timat
eLo
wer
Upp
erBe
st
estim
ate
Low
erU
pper
Afr
ica
1,30
016
02,
570
0.19
0.02
0.37
3,68
090
06,
600
0.53
0.13
0.94
1,80
010
07,
880
0.26
0.01
1.13
East
Afr
ica
--
--
--
--
--
--
--
--
--
Nor
th A
fric
a-
--
--
-50
034
061
00.
340.
230.
42-
--
--
-
Sout
hern
Afr
ica
--
--
--
--
--
--
--
--
--
Wes
t an
d C
entr
al A
fric
a25
01
633
0.09
0.00
0.24
--
--
--
--
--
--
Am
eric
as9,
930
9,20
010
,590
1.48
1.37
1.58
7,86
06,
660
9,23
01.
170.
991.
383,
500
3,39
03,
630
0.52
0.51
0.54
Car
ibbe
an18
080
330
0.62
0.29
1.15
250
2070
00.
870.
052.
4260
3010
00.
230.
100.
36
Cen
tral
Am
eric
a20
010
031
00.
660.
341.
0260
3010
00.
210.
090.
3150
2010
00.
170.
070.
33
Nor
th A
mer
ica
6,80
06,
660
6,95
02.
102.
062.
156,
840
5,99
07,
690
2.11
1.85
2.38
2,87
02,
870
2,87
00.
890.
890.
89
Sout
h A
mer
ica
2,74
02,
360
3,00
00.
950.
821.
0471
063
074
00.
250.
220.
2651
047
055
00.
180.
160.
19
Asi
a1,
670
1,14
02,
220
0.06
0.04
0.07
14,1
404,
980
23,2
900.
470.
170.
7811
,490
1,60
021
,380
0.38
0.05
0.71
Cen
tral
Asi
a an
d
Tran
scau
casi
a-
--
--
--
--
--
--
--
--
-
East
and
Sou
th-E
ast
Asi
a-
--
--
--
--
--
--
--
--
-
Sout
h-W
est
Asi
a/N
ear
and
Mid
dle
East
7030
130
0.02
0.01
0.04
--
--
--
--
--
--
Sout
h A
sia
1,03
01,
030
1,03
00.
100.
100.
101,
850
1,85
01,
850
0.18
0.18
0.18
--
--
--
Euro
pe
4,74
04,
460
5,14
00.
870.
820.
952,
900
2,35
03,
480
0.53
0.43
0.64
4,06
02,
930
6,97
00.
540.
390.
93
East
ern
and
So
uth-
East
ern
Euro
pe50
034
072
00.
220.
150.
3271
041
01,
040
0.32
0.18
0.46
1,31
025
04,
040
0.31
0.06
0.95
Wes
tern
and
C
entr
al E
urop
e4,
240
4,12
04,
420
1.33
1.29
1.39
2,18
01,
940
2,44
00.
680.
610.
762,
750
2,68
02,
930
0.86
0.84
0.92
Oce
ania
430
410
440
1.65
1.57
1.67
350
320
360
1.34
1.24
1.38
440
410
450
1.68
1.56
1.72
Aus
tral
ia a
nd
New
Zea
land
420
410
420
2.20
2.15
2.23
250
250
250
1.34
1.34
1.34
410
400
430
2.17
2.12
2.23
Mel
anes
ia-
--
--
--
--
--
--
--
--
-
Mic
rone
sia
--
--
--
52
111.
580.
563.
10-
--
--
-
Poly
nesi
a-
--
--
--
--
--
--
--
--
-
GLO
BA
L ES
TIM
ATE
18,0
7015
,380
20,9
600.
370.
310.
4228
,920
15,2
1042
,960
0.59
0.31
0.87
21,2
908,
420
40,3
100.
410.
160.
78

31
Annex - PWID/HIV 1Es
timat
ed n
umbe
r an
d pr
eval
ence
(per
cent
age)
of
peop
le w
ho in
ject
dru
gs a
nd t
hose
livi
ng w
ith H
IV a
mon
g th
is g
roup
, by
regi
on, 2
017
Sour
ce:
Resp
onse
s to
the
ann
ual r
epor
t qu
estio
nnai
re;
prog
ress
rep
orts
of
the
Join
t U
nite
d N
atio
ns P
rogr
amm
e on
HIV
/AID
S (U
NA
IDS)
on
the
glob
al A
IDS
resp
onse
(va
rious
yea
rs);
the
form
er R
efer
ence
Gro
up t
o th
e U
nite
d N
atio
ns o
n H
IV a
nd In
ject
ing
Dru
g U
se;
publ
ishe
d pe
er-r
evie
wed
art
icle
s; a
nd g
over
nmen
t re
port
s.N
ote:
Pre
vale
nce
of p
eopl
e w
ho in
ject
dru
gs is
the
per
cent
age
of t
he p
opul
atio
n ag
ed 1
5–64
yea
rs.
Reg
ion
or
sub
reg
ion
Peo
ple
wh
o i
nje
ct d
rug
sH
IV a
mo
ng
peo
ple
wh
o i
nje
ct d
rug
s
Estim
ated
num
ber
Prev
alen
ce (
%)
Dat
aco
vera
ge o
f po
pula
tion
aged
15-
64
year
s
Estim
ated
num
ber
Prev
alen
ce
(%)
Best
es
timat
e
Dat
a co
vera
ge
of e
stim
ated
nu
mbe
r of
pe
ople
who
in
ject
dru
gsLo
wBe
stH
igh
Low
Best
Hig
hLo
wBe
stH
igh
Afr
ica
450,
000
810,
000
2,14
0,00
00.
060.
120.
3157
.8%
42,0
0093
,000
515,
000
11.4
75.4
%
Am
eric
a1,
860,
000
2,37
0,00
02,
870,
000
0.28
0.35
0.43
86.1
%10
9,00
017
4,00
025
9,00
07.
393
.9%
Nor
th A
mer
ica
1,56
0,00
01,
790,
000
2,02
0,00
00.
480.
550.
6210
0%94
,000
124,
000
159,
000
6.9
100%
Latin
Am
eric
a
and
the
Car
ibbe
an30
0,00
058
0,00
085
0,00
00.
090.
170.
2573
.2%
16,0
0050
,000
100,
000
8.5
75.2
%
Asi
a4,
130,
000
5,43
0,00
06,
900,
000
0.14
0.18
0.23
95.0
%44
9,00
066
7,00
092
5,00
012
.398
.0%
Cen
tral
Asi
a
and
Tran
scau
casi
a40
0,00
045
0,00
053
0,00
00.
690.
780.
9193
.6%
28,0
0034
,000
44,0
007.
593
.6%
East
and
So
uth-
East
Asi
a2,
210,
000
3,21
0,00
04,
200,
000
0.14
0.20
0.26
95.1
%18
1,00
032
0,00
048
2,00
010
.098
.7%
Sout
h-W
est
Asi
a57
0,00
075
0,00
095
0,00
00.
290.
380.
4810
0%15
4,00
021
6,00
028
4,00
028
.910
0%
Nea
r an
d M
iddl
e Ea
st40
,000
90,0
0027
0,00
00.
030.
080.
2539
.0%
1,80
03,
200
10,4
003.
855
.6%
Sout
h A
sia
910,
000
930,
000
950,
000
0.09
0.09
0.09
99.9
%84
,000
93,0
0010
5,00
010
.099
.9%
Euro
pe
2,35
0,00
02,
570,
000
2,99
0,00
00.
440.
480.
5590
.0%
483,
000
505,
000
556,
000
19.6
99.9
%
East
ern
and
So
uth-
East
ern
Euro
pe1,
760,
000
1,80
0,00
01,
860,
000
0.80
0.82
0.84
100%
416,
000
423,
000
431,
000
23.5
100%
Wes
tern
and
C
entr
al E
urop
e59
0,00
077
0,00
01,
130,
000
0.19
0.24
0.35
83.0
%67
,000
82,0
0012
6,00
010
.699
.9%
Oce
ania
130,
000
130,
000
140,
000
0.51
0.52
0.54
73.0
%1,
300
1,60
01,
700
1.2
73.0
%
Glo
bal
8,93
0,00
011
,320
,000
15,0
30,0
000.
180.
230.
3087
.9%
1,09
0,00
01,
440,
000
2,26
0,00
012
.795
.7%

32
WO
RLD
DRU
G R
EPO
RT 2
019 EXECUTIVE SUMMARY
Op
ium
/her
oin
Illic
it cu
ltiva
tion
of o
pium
pop
py, 2
007–
2018
(hec
tare
s)
2007
2008
2009
2010
2011
2012
2013
2014
2015
2016
2017
2018
SO
UTH
-WES
T A
SIA
Afg
hani
stan
(b
est
estim
ate)
193,
000
157,
000
123,
000
123,
000
131,
000
154,
000
209,
000
224,
000
183,
000
201,
000
328,
000
263,
000
lo
wer
bou
nd a
10
2,00
010
4,00
010
9,00
012
5,00
017
3,00
019
6,00
016
3,00
018
2,00
030
1,00
024
2,00
0
up
per
boun
d a
13
7,00
014
5,00
015
5,00
018
9,00
023
8,00
024
7,00
020
2,00
022
1,00
035
5,00
028
3,00
0
SO
UTH
-EA
ST A
SIA
Lao
Peop
le’s
D
emoc
ratic
Rep
ublic
(b
est
estim
ate)
b1,
500
1,60
01,
900
3,00
04,
100
6,80
03,
900
6,20
05,
700
....
..
lo
wer
bou
nd a
1,
230
710
1,10
01,
900
2,50
03,
100
1,90
03,
500
3,90
0
up
per
boun
d a
1,
860
2,70
02,
700
4,00
06,
000
11,5
005,
800
9,00
07,
600
Mya
nmar
(b
est
estim
ate)
b27
,700
28,5
0031
,700
38,1
0043
,600
51,0
0057
,800
57,6
00c
55,5
00c
..41
,000
37,3
00c
lo
wer
bou
nd a
22
,500
17,9
0020
,500
17,3
0029
,700
38,2
4945
,710
41,4
0042
,800
30,
200
29,
700
up
per
boun
d a
32
,600
37,0
0042
,800
58,1
0059
,600
64,3
5769
,918
87,3
0069
,600
51,
900
47,
200
SOU
TH A
ND
C
ENTR
AL
AM
ERIC
A
Col
ombi
a
(bes
t es
timat
e)71
539
435
634
133
831
329
838
759
546
228
2..
Mex
ico
(bes
t
estim
ate)
b,
d, f
, h
6,90
015
,000
19,5
0014
,000
12,0
0010
,500
11,0
0017
,000
26,1
0025
,200
30,6
00..
lo
wer
bou
nd a
21
,800
20,4
0022
,800
up
per
boun
d a
30,4
0030
,000
38,4
00
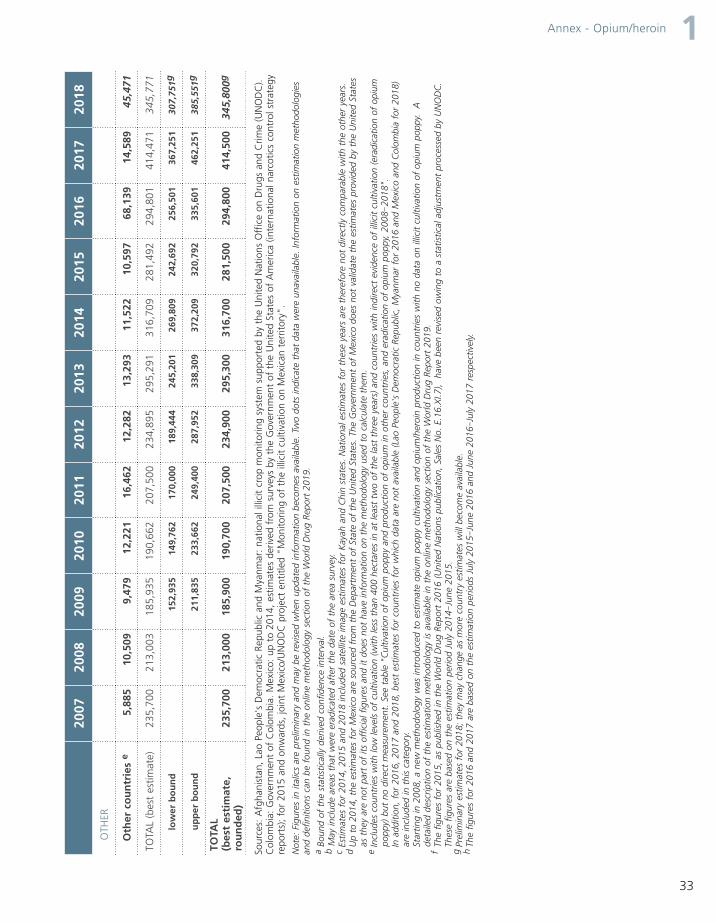
33
Annex - Opium/heroin 1
Sour
ces:
Afg
hani
stan
, La
o Pe
ople
's D
emoc
ratic
Rep
ublic
and
Mya
nmar
: na
tiona
l illi
cit
crop
mon
itorin
g sy
stem
sup
port
ed b
y th
e U
nite
d N
atio
ns O
ffic
e on
Dru
gs a
nd C
rime
(UN
OD
C).
Col
ombi
a: G
over
nmen
t of
Col
ombi
a. M
exic
o: u
p to
201
4, e
stim
ates
der
ived
fro
m s
urve
ys b
y th
e G
over
nmen
t of
the
Uni
ted
Stat
es o
f A
mer
ica
(inte
rnat
iona
l nar
cotic
s co
ntro
l str
ateg
y re
port
s);
for
2015
and
onw
ards
, jo
int
Mex
ico/
UN
OD
C p
roje
ct e
ntitl
ed "
Mon
itorin
g of
the
illic
it cu
ltiva
tion
on M
exic
an t
errit
ory"
.
Not
e: F
igur
es in
ital
ics
are
prel
imin
ary
and
may
be
revi
sed
whe
n up
date
d in
form
atio
n be
com
es a
vaila
ble.
Tw
o do
ts in
dica
te t
hat
data
wer
e un
avai
labl
e. In
form
atio
n on
est
imat
ion
met
hodo
logi
es
and
defin
ition
s ca
n be
fou
nd in
the
onl
ine
met
hodo
logy
sec
tion
of t
he W
orld
Dru
g Re
port
201
9.a
Boun
d of
the
sta
tistic
ally
der
ived
con
fiden
ce in
terv
al.
b M
ay in
clud
e ar
eas
that
wer
e er
adic
ated
aft
er t
he d
ate
of t
he a
rea
surv
ey.
c Es
timat
es f
or 2
014,
201
5 an
d 20
18 in
clud
ed s
atel
lite
imag
e es
timat
es f
or K
ayah
and
Chi
n st
ates
. N
atio
nal e
stim
ates
for
the
se y
ears
are
the
refo
re n
ot d
irect
ly c
ompa
rabl
e w
ith t
he o
ther
yea
rs.
d U
p to
201
4, t
he e
stim
ates
for
Mex
ico
are
sour
ced
from
the
Dep
artm
ent
of S
tate
of
the
Uni
ted
Stat
es.
The
Gov
ernm
ent
of M
exic
o do
es n
ot v
alid
ate
the
estim
ates
pro
vide
d by
the
Uni
ted
Stat
es
as t
hey
are
not
part
of
its o
ffic
ial f
igur
es a
nd it
doe
s no
t ha
ve in
form
atio
n on
the
met
hodo
logy
use
d to
cal
cula
te t
hem
.e
Incl
udes
cou
ntrie
s w
ith lo
w le
vels
of
culti
vatio
n (w
ith le
ss t
han
400
hect
ares
in a
t le
ast
two
of t
he la
st t
hree
yea
rs)
and
coun
trie
s w
ith in
dire
ct e
vide
nce
of il
licit
culti
vatio
n (e
radi
catio
n of
opi
um
popp
y) b
ut n
o di
rect
mea
sure
men
t. S
ee t
able
"C
ultiv
atio
n of
opi
um p
oppy
and
pro
duct
ion
of o
pium
in o
ther
cou
ntrie
s, a
nd e
radi
catio
n of
opi
um p
oppy
, 20
08‒2
018"
.
In a
dditi
on,
for
2016
, 20
17 a
nd 2
018,
bes
t es
timat
es f
or c
ount
ries
for
whi
ch d
ata
are
not
avai
labl
e (L
ao P
eopl
e's
Dem
ocra
tic R
epub
lic,
Mya
nmar
for
201
6 an
d M
exic
o an
d C
olom
bia
for
2018
) ar
e in
clud
ed in
thi
s ca
tego
ry.
St
artin
g in
200
8, a
new
met
hodo
logy
was
intr
oduc
ed t
o es
timat
e op
ium
pop
py c
ultiv
atio
n an
d op
ium
/her
oin
prod
uctio
n in
cou
ntrie
s w
ith n
o da
ta o
n ill
icit
culti
vatio
n of
opi
um p
oppy
. A
de
taile
d de
scrip
tion
of t
he e
stim
atio
n m
etho
dolo
gy is
ava
ilabl
e in
the
onl
ine
met
hodo
logy
sec
tion
of t
he W
orld
Dru
g Re
port
201
9.f
The
figur
es f
or 2
015,
as
publ
ishe
d in
the
Wor
ld D
rug
Repo
rt 2
016
(Uni
ted
Nat
ions
pub
licat
ion,
Sal
es N
o. E
.16.
XI.7
), h
ave
been
rev
ised
ow
ing
to a
sta
tistic
al a
djus
tmen
t pr
oces
sed
by U
NO
DC
. Th
ese
figur
es a
re b
ased
on
the
estim
atio
n pe
riod
July
201
4‒Ju
ne 2
015.
g Pr
elim
inar
y es
timat
es f
or 2
018;
the
y m
ay c
hang
e as
mor
e co
untr
y es
timat
es w
ill b
ecom
e av
aila
ble.
h
The
figur
es f
or 2
016
and
2017
are
bas
ed o
n th
e es
timat
ion
perio
ds J
uly
2015
‒Jun
e 20
16 a
nd J
une
2016
‒Jul
y 20
17 r
espe
ctiv
ely.
2007
2008
2009
2010
2011
2012
2013
2014
2015
2016
2017
2018
OTH
ER
O
ther
co
un
trie
s e
5,88
510
,509
9,47
912
,221
16,4
6212
,282
13,2
9311
,522
10,5
9768
,139
14,5
8945
,471
TOTA
L (b
est
estim
ate)
235,
700
213,
003
185,
935
190,
662
207,
500
234,
895
295,
291
316,
709
281,
492
294,
801
414,
471
345,
771
lo
wer
bo
un
d15
2,93
514
9,76
217
0,00
018
9,44
424
5,20
126
9,80
924
2,69
225
6,50
136
7,25
130
7,75
1g
u
pp
er b
ou
nd
211,
835
233,
662
249,
400
287,
952
338,
309
372,
209
320,
792
335,
601
462,
251
385,
551g
TOTA
L
(bes
t es
tim
ate,
ro
un
ded
) 23
5,70
021
3,00
018
5,90
019
0,70
020
7,50
023
4,90
029
5,30
031
6,70
028
1,50
029
4,80
041
4,50
034
5,80
0g
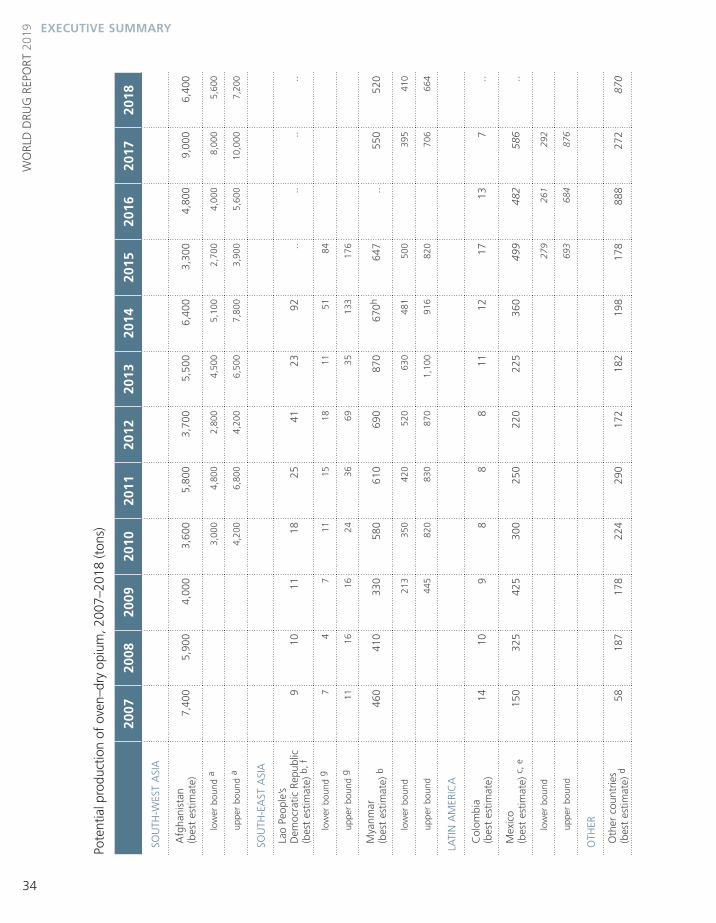
34
WO
RLD
DRU
G R
EPO
RT 2
019 EXECUTIVE SUMMARY
Pote
ntia
l pro
duct
ion
of o
ven–
dry
opiu
m, 2
007–
2018
(ton
s)
2007
2008
2009
2010
2011
2012
2013
2014
2015
2016
2017
2018
SO
UTH
-WES
T A
SIA
Afg
hani
stan
(b
est
estim
ate)
7,40
05,
900
4,00
03,
600
5,80
03,
700
5,50
06,
400
3,30
04,
800
9,00
06,
400
lo
wer
bou
nd a
3,
000
4,80
02,
800
4,50
05,
100
2,70
04,
000
8,00
05,
600
up
per
boun
d a
4,20
06,
800
4,20
06,
500
7,80
03,
900
5,60
010
,000
7,20
0
SO
UTH
-EA
ST A
SIA
Lao
Peop
le’s
D
emoc
ratic
Rep
ublic
(b
est
estim
ate)
b,
f 9
1011
18 2
5 41
2392
....
....
lo
wer
bou
nd g
7
47
1115
1811
5184
up
per
boun
d g
1116
1624
3669
3513
317
6
Mya
nmar
(b
est
estim
ate)
b
460
410
330
580
610
69
087
067
0h64
7..
550
520
lo
wer
bou
nd 2
13
350
4
20
520
6
30
481
500
395
410
up
per
boun
d 4
45
820
8
30
870
1
,100
91
682
070
666
4
LATI
N A
MER
ICA
Col
ombi
a (b
est
estim
ate)
1410
98
88
1112
1713
7..
Mex
ico
(bes
t es
timat
e) c
, e
150
325
425
300
250
220
225
360
499
482
586
..
lo
wer
bou
nd27
926
129
2
up
per
boun
d69
368
487
6
OTH
ER
Oth
er c
ount
ries
(b
est
estim
ate)
d58
187
178
224
290
172
182
198
178
888
272
870

35
Annex - Opium/heroin 120
0720
0820
0920
1020
1120
1220
1320
1420
1520
1620
1720
18
TOTA
L
(bes
t es
tim
ate)
8,09
16,
841
4,95
34,
730
6,98
34,
831
6,81
07,
732
4,77
16,
184
10,4
157,
790
lo
wer
bo
un
d3,
894
5,78
33,
738
5,55
86,
202
3,75
84,
973
8,92
06,
540
u
pp
er b
ou
nd
5,57
68,
214
5,53
98,
052
9,41
95,
784
7,39
111
,907
9,07
0
TOTA
L b
est
esti
mat
e (r
ou
nd
ed)
8,0
90
6,8
40
4,9
50
4,7
30
6,9
80
4,8
30
6,8
10
7,7
30
4,7
70
6,1
80
10,
410
7,7
90
Sour
ces:
Afg
hani
stan
, La
o Pe
ople
's D
emoc
ratic
Rep
ublic
and
Mya
nmar
: na
tiona
l illi
cit
crop
mon
itorin
g sy
stem
sup
port
ed b
y th
e U
nite
d N
atio
ns O
ffic
e on
Dru
gs a
nd C
rime
(UN
OD
C).
Col
ombi
a: N
atio
nal i
llici
t cr
op m
onito
ring
syst
em s
uppo
rted
by
UN
OD
C.
Sinc
e 20
08,
prod
uctio
n w
as c
alcu
late
d ba
sed
on u
pdat
ed r
egio
nal y
ield
fig
ures
and
con
vers
ion
ratio
s fr
om
the
Dep
artm
ent
of S
tate
and
the
Dru
g En
forc
emen
t A
dmin
istr
atio
n of
the
Uni
ted
Stat
es o
f A
mer
ica.
Mex
ico:
up
to 2
014,
est
imat
es d
eriv
ed f
rom
sur
veys
by
the
Uni
ted
Stat
es
Gov
ernm
ent;
for
201
5 an
d on
war
ds,
UN
OD
C e
stim
ate.
Not
e: F
igur
es in
ital
ics
are
prel
imin
ary
and
may
be
revi
sed
whe
n up
date
d in
form
atio
n be
com
es a
vaila
ble.
Tw
o do
ts in
dica
te t
hat
data
wer
e un
avai
labl
e. In
form
atio
n on
est
imat
ion
met
hodo
logi
es
and
defin
ition
s ca
n be
fou
nd in
the
onl
ine
met
hodo
logy
sec
tion
of t
he W
orld
Dru
g Re
port
201
9.a
Boun
d of
the
sta
tistic
ally
der
ived
con
fiden
ce in
terv
al.
b Ba
sed
on c
ultiv
atio
n fig
ures
whi
ch m
ay in
clud
e ar
eas
erad
icat
ed a
fter
the
dat
e of
the
are
a su
rvey
.c
Up
to 2
014,
the
est
imat
es a
re s
ourc
ed f
rom
the
Dep
artm
ent
of S
tate
of
the
Uni
ted
Stat
es.
The
Gov
ernm
ent
of M
exic
o do
es n
ot v
alid
ate
the
estim
ates
pro
vide
d by
the
Uni
ted
Stat
es a
s th
ey a
re
not
part
of
its o
ffic
ial f
igur
es a
nd it
doe
s no
t ha
ve in
form
atio
n on
the
met
hodo
logy
use
d to
cal
cula
te t
hem
.d
Incl
udes
cou
ntrie
s w
ith lo
w le
vels
of
culti
vatio
n an
d co
untr
ies
with
indi
rect
evi
denc
e of
illic
it cu
ltiva
tion
(era
dica
tion
of o
pium
pop
py)
but
no d
irect
mea
sure
men
t. S
ee t
able
"C
ultiv
atio
n of
op
ium
pop
py a
nd p
rodu
ctio
n of
opi
um in
oth
er c
ount
ries,
and
era
dica
tion
of o
pium
pop
py,
2008
‒201
8".
In
add
ition
, fo
r 20
16,
2017
and
201
8, b
est
estim
ates
for
cou
ntrie
s fo
r w
hich
dat
a ar
e no
t av
aila
ble
(Lao
Peo
ple'
s D
emoc
ratic
Rep
ublic
, M
yanm
ar f
or 2
016
and
Mex
ico
and
Col
ombi
a fo
r 20
18)
are
incl
uded
in t
his
cate
gory
.
St
artin
g in
200
8, a
new
met
hodo
logy
was
intr
oduc
ed t
o es
timat
e op
ium
pop
py c
ultiv
atio
n an
d op
ium
/her
oin
prod
uctio
n in
cou
ntrie
s w
ith n
o da
ta o
n ill
icit
culti
vatio
n of
opi
um p
oppy
. Th
ese
es
timat
es a
re h
ighe
r th
an t
he p
revi
ous
figur
es b
ut h
ave
a si
mila
r or
der
of m
agni
tude
. A
det
aile
d de
scrip
tion
of t
he e
stim
atio
n m
etho
dolo
gy is
ava
ilabl
e in
the
onl
ine
met
hodo
logy
sec
tion
of t
he
Wor
ld D
rug
Repo
rt 2
019.
e Th
e fig
ures
for
201
5, a
s pu
blis
hed
in t
he W
orld
Dru
g Re
port
201
6 (U
nite
d N
atio
ns p
ublic
atio
n, S
ales
No.
E.1
6.X
I.7),
hav
e be
en r
evis
ed o
win
g to
a s
tatis
tical
adj
ustm
ent
proc
esse
d by
UN
OD
C.
The
Gov
ernm
ent
of M
exic
o do
es n
ot v
alid
ate
any
opiu
m p
rodu
ctio
n es
timat
es.
The
prod
uctio
n fig
ures
will
be
pres
ente
d on
ce y
ield
dat
a fr
om t
he jo
int
Mex
ico/
UN
OD
C p
roje
ct e
ntitl
ed "
Mon
itor-
ing
of t
he il
licit
culti
vatio
n on
Mex
ican
ter
ritor
y" b
ecom
e av
aila
ble.
Opi
um p
rodu
ctio
n fig
ures
est
imat
ed b
y U
NO
DC
for
201
5‒20
17 a
re b
ased
on:
(a)
the
are
a un
der
culti
vatio
n, e
stab
lishe
d by
th
e jo
int
proj
ect
of t
he G
over
nmen
t of
Mex
ico
and
UN
OD
C;
(b)
yiel
d da
ta,
base
d on
yie
ld s
tudi
es c
ondu
cted
by
the
Uni
ted
Stat
es in
Mex
ico
over
the
per
iod
2001
‒200
3. T
he o
pium
pro
duct
ion
figur
es s
how
n fo
r 20
15-2
017
are
prel
imin
ary
and,
for
met
hodo
logi
cal r
easo
ns,
are
not
com
para
ble
with
the
pro
duct
ion
figur
es o
ver
the
perio
d 19
98‒2
014.
f O
win
g to
the
late
tim
ing
of t
he m
onito
ring
activ
ities
in 2
013,
the
sur
vey
may
not
hav
e ca
ptur
ed il
licit
culti
vatio
n in
thi
s ye
ar in
its
entir
ety.
g Bo
und
of t
he s
tatis
tical
ly d
eriv
ed c
onfid
ence
inte
rval
, w
ith t
he e
xcep
tion
of 2
015.
The
fig
ures
for
201
5 re
pres
ent
inde
pend
ently
der
ived
upp
er a
nd lo
wer
est
imat
es;
the
mid
poin
t w
as u
sed
for
the
calc
ulat
ion
of t
he g
loba
l tot
al.
h Es
timat
es f
or 2
014,
201
5 an
d 20
18 in
clud
e es
timat
es f
or K
ayah
and
Chi
n st
ates
. N
atio
nal e
stim
ates
for
the
se y
ears
are
the
refo
re n
ot d
irect
ly c
ompa
rabl
e w
ith t
he o
ther
yea
rs.

36
WO
RLD
DRU
G R
EPO
RT 2
019 EXECUTIVE SUMMARY
Cul
tivat
ion
of o
pium
pop
py a
nd p
rodu
ctio
n of
opi
um in
oth
er c
ount
ries,
and
era
dica
tion
of o
pium
pop
py, 2
008–
2018
Co
un
try
Ind
ica-
tor
2008
2009
2010
2011
2012
2013
2014
2015
2016
2017
2018
Gua
tem
ala
Cul
tivat
ion
(hec
tare
s)22
031
064
026
031
070
0
Gua
tem
ala
Prod
uctio
n (t
ons)
46
146
615
Paki
stan
Cul
tivat
ion
(hec
tare
s)1,
909
1,77
91,
721
362
382
493
217
372
130
90
Paki
stan
Prod
uctio
n (t
ons)
4844
439
912
59
32
Thai
land
Cul
tivat
ion
(hec
tare
s)28
821
128
928
920
926
539
9
Thai
land
Prod
uctio
n (t
ons)
53
56
34
Afg
hani
stan
Erad
icat
ion
(hec
tare
s)5,
480
5,35
12,
316
3,81
09,
672
7,34
82,
692
3,76
035
575
040
6
Alg
eria
Erad
icat
ion
(pla
nts)
868
340
204
2,72
17,
470
Alg
eria
Seiz
ure
popp
y pl
ants
(in
kg
equi
vale
nts)
7,7
61
962
8734
20.4
272.
110
6
Arg
entin
aSe
izur
e po
ppy
plan
ts (
in k
g eq
uiva
lent
s)0.
2
Arm
enia
Seiz
ure
popp
y pl
ants
(in
kg
equi
vale
nts)
0.1
8 0
.13
60
Aus
tral
ia
Seiz
ure
popp
y pl
ants
(in
kg
equi
vale
nts)
3726
4
Aus
tria
Se
izur
e po
ppy
plan
ts (
in k
g eq
uiva
lent
s) 8
.76
13.
83
4.6
0 1
.91
2.0
7 1
.41
0.0
5 0.
2
Aze
rbai
jan
Erad
icat
ion
(hec
tare
s)2.
260.
210.
400.
45
Aze
rbai
jan
Erad
icat
ion
(pla
nts)
201
2,62
834
284
49,1
54
Bang
lade
shEr
adic
atio
n (h
ecta
res)
822

37
Annex - Opium/heroin 1C
ou
ntr
yIn
dic
a-to
r20
0820
0920
1020
1120
1220
1320
1420
1520
1620
1720
18
Bang
lade
shSe
izur
e po
ppy
plan
ts (
in k
g eq
uiva
lent
s) 1
45,0
21
Bela
rus
Erad
icat
ion
(hec
tare
s)14
5226
9215
7
Bela
rus
Seiz
ure
popp
y pl
ants
(in
kg
equi
vale
nts)
59
81
51
94
119
Can
ada
Erad
icat
ion
(hec
tare
s)7
7
Can
ada
Erad
icat
ion
(pla
nts)
60,0
0060
,000
Can
ada
Seiz
ure
popp
y pl
ants
(in
kg
equi
vale
nts)
6,60
09.
37.
385
.9
Chi
naEr
adic
atio
n
(hec
tare
s)6
Col
ombi
aEr
adic
atio
n
(hec
tare
s)38
154
671
229
432
051
481
361
345
039
7
Cyp
rus
Seiz
ure
popp
y pl
ants
(in
kg
equi
vale
nts)
6
Cze
chia
Seiz
ure
popp
y pl
ants
(in
kg
equi
vale
nts)
40
Ecua
dor
Erad
icat
ion
(pla
nts)
74,5
5511
5,58
012
8,65
322
,100
2,17
0,90
01,
797,
966
2,02
3,38
518
3,57
31,
207,
147
279,
074
Ecua
dor
Seiz
ure
popp
y pl
ants
(in
kg
equi
vale
nts)
7,4
56
11,
558
12,
865
2,2
10
185
,490
7
5,76
5
Egyp
tEr
adic
atio
n (h
ecta
res)
121
9822
21
398
105
60
Geo
rgia
Seiz
ure
popp
y pl
ants
(in
kg
equi
vale
nts)
89
Gre
ece
Erad
icat
ion
(pla
nts)
192
6014
414
562
444
Gua
tem
ala
Erad
icat
ion
(hec
tare
s)53
61,
345
918
1,49
059
02,
568
1,19
743
045
803

38
WO
RLD
DRU
G R
EPO
RT 2
019 EXECUTIVE SUMMARY
Co
un
try
Ind
ica-
tor
2008
2009
2010
2011
2012
2013
2014
2015
2016
2017
2018
Gua
tem
ala
Erad
icat
ion
(pla
nts)
17,6
43,4
4741
7,00
4,27
8
Gua
tem
ala
Seiz
ure
popp
y pl
ants
(in
kg
equi
vale
nts)
27,
880,
441
69,
228,
416
54,
612,
442
10,
935,
532
864
,150
Hun
gary
Seiz
ure
popp
y pl
ants
(in
kg
equi
vale
nts)
1,5
02
2,1
52
1917
Indi
aEr
adic
atio
n (h
ecta
res)
624
2,42
03,
052
5,74
61,
332
865
1,63
63,
461
2,87
53,
076
Indi
aSe
izur
e po
ppy
plan
ts (
in k
g eq
uiva
lent
s) 3
,770
Iran
(Isla
mic
Rep
ublic
of
)Er
adic
atio
n (h
ecta
res)
2 1
1
1
1
0
.5
Iran
(Isla
mic
Rep
ublic
of
)Er
adic
atio
n (p
lant
s)14
0,00
010
0,00
012
0,00
090
,000
90,0
00
Italy
Erad
icat
ion
(pla
nts)
1,79
72,
007
6,71
7
Italy
Seiz
ure
popp
y pl
ants
(in
kg
equi
vale
nts)
716
3
75
168
3
0 1
,098
Japa
nSe
izur
e po
ppy
plan
ts (
in k
g eq
uiva
lent
s) 5
35
104
9
0 2
6 2
0 1
1
Kaz
akhs
tan
Erad
icat
ion
(hec
tare
s)0.
2
Kaz
akhs
tan
Erad
icat
ion
(pla
nts)
1,69
22,
254
19,5
1015
,515
Kaz
akhs
tan
Seiz
ure
popp
y pl
ants
(in
kg
equi
vale
nts)
68
127
1
05
90
30
2
8
298
Kyr
gyzs
tan
Seiz
ure
popp
y pl
ants
(in
kg
equi
vale
nts)
102
3
44
58
200
3
99
147
6
3 5
5
Lao
PDR
Erad
icat
ion
(hec
tare
s)57
565
157
966
270
739
780
9
Latv
iaSe
izur
e po
ppy
plan
ts (
in k
g eq
uiva
lent
s) 2
3 3
1 1
1
2 7
9
4
3
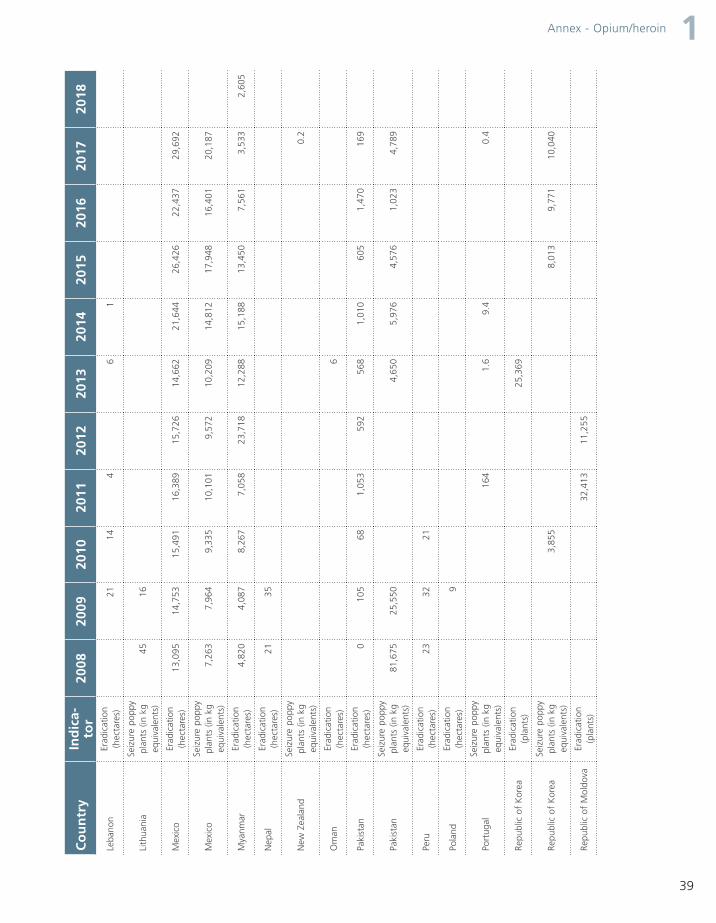
39
Annex - Opium/heroin 1C
ou
ntr
yIn
dic
a-to
r20
0820
0920
1020
1120
1220
1320
1420
1520
1620
1720
18
Leba
non
Erad
icat
ion
(hec
tare
s)21
144
61
Lith
uani
aSe
izur
e po
ppy
plan
ts (
in k
g eq
uiva
lent
s) 4
5 1
6
Mex
ico
Erad
icat
ion
(hec
tare
s)13
,095
14,7
5315
,491
16,3
8915
,726
14,6
6221
,644
26,4
2622
,437
29,6
92
Mex
ico
Seiz
ure
popp
y pl
ants
(in
kg
equi
vale
nts)
7,2
63
7,9
64
9,3
35
10,
101
9,5
72
10,
209
14,
812
17,
948
16,
401
20,
187
Mya
nmar
Erad
icat
ion
(hec
tare
s)4,
820
4,08
78,
267
7,05
823
,718
12,2
8815
,188
13,4
507,
561
3,53
32,
605
Nep
alEr
adic
atio
n (h
ecta
res)
2135
New
Zea
land
Seiz
ure
popp
y pl
ants
(in
kg
equi
vale
nts)
0.2
Om
anEr
adic
atio
n (h
ecta
res)
6
Paki
stan
Erad
icat
ion
(hec
tare
s)0
105
681,
053
592
568
1,01
060
51,
470
169
Paki
stan
Seiz
ure
popp
y pl
ants
(in
kg
equi
vale
nts)
81,
675
25,
550
4,6
50
5,9
76
4,5
76
1,0
23
4,7
89
Peru
Erad
icat
ion
(hec
tare
s)23
3221
Pola
ndEr
adic
atio
n (h
ecta
res)
9
Port
ugal
Seiz
ure
popp
y pl
ants
(in
kg
equi
vale
nts)
164
1
.6
9.4
0.
4
Repu
blic
of
Kor
eaEr
adic
atio
n (p
lant
s)25
,369
Repu
blic
of
Kor
eaSe
izur
e po
ppy
plan
ts (
in k
g eq
uiva
lent
s) 3
,855
8
,013
9
,771
10
,040
Repu
blic
of
Mol
dova
Erad
icat
ion
(pla
nts)
32,4
1311
,255
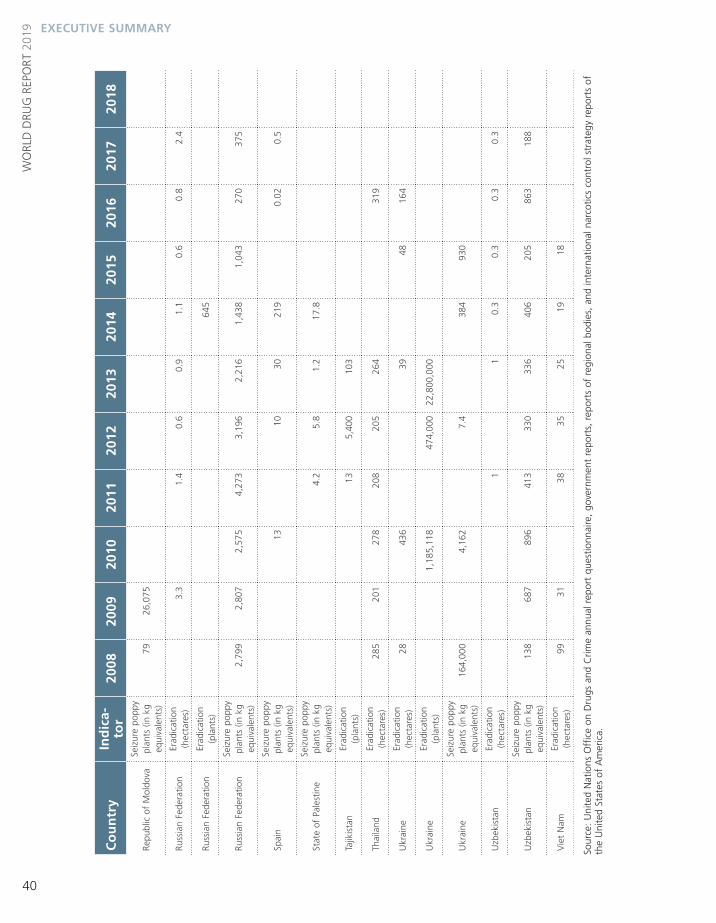
40
WO
RLD
DRU
G R
EPO
RT 2
019 EXECUTIVE SUMMARY
Co
un
try
Ind
ica-
tor
2008
2009
2010
2011
2012
2013
2014
2015
2016
2017
2018
Repu
blic
of
Mol
dova
Seiz
ure
popp
y pl
ants
(in
kg
equi
vale
nts)
79
26,
075
Russ
ian
Fede
ratio
nEr
adic
atio
n (h
ecta
res)
3.3
1.4
0.6
0.9
1.1
0.6
0.8
2.4
Russ
ian
Fede
ratio
nEr
adic
atio
n (p
lant
s)64
5
Russ
ian
Fede
ratio
nSe
izur
e po
ppy
plan
ts (
in k
g eq
uiva
lent
s) 2
,799
2
,807
2
,575
4
,273
3
,196
2
,216
1
,438
1
,043
2
70
375
Spai
nSe
izur
e po
ppy
plan
ts (
in k
g eq
uiva
lent
s) 1
3 1
0 3
0 2
19
0.0
2 0.
5
Stat
e of
Pal
estin
eSe
izur
e po
ppy
plan
ts (
in k
g eq
uiva
lent
s) 4
.2
5.8
1
.2
17.
8
Tajik
ista
nEr
adic
atio
n (p
lant
s)13
5,40
010
3
Thai
land
Erad
icat
ion
(hec
tare
s)28
520
127
820
820
526
431
9
Ukr
aine
Erad
icat
ion
(hec
tare
s)28
436
3948
164
Ukr
aine
Erad
icat
ion
(pla
nts)
1,18
5,11
847
4,00
022
,800
,000
Ukr
aine
Seiz
ure
popp
y pl
ants
(in
kg
equi
vale
nts)
164
,000
4
,162
7
.4
384
9
30
Uzb
ekis
tan
Erad
icat
ion
(hec
tare
s)1
10.
30.
30.
30.
3
Uzb
ekis
tan
Seiz
ure
popp
y pl
ants
(in
kg
equi
vale
nts)
138
687
896
413
330
336
406
205
863
188
Vie
t N
amEr
adic
atio
n (h
ecta
res)
9931
3835
2519
18
Sour
ce:
Uni
ted
Nat
ions
Off
ice
on D
rugs
and
Crim
e an
nual
rep
ort
ques
tionn
aire
, go
vern
men
t re
port
s, r
epor
ts o
f re
gion
al b
odie
s, a
nd in
tern
atio
nal n
arco
tics
cont
rol s
trat
egy
repo
rts
of
the
Uni
ted
Stat
es o
f A
mer
ica.
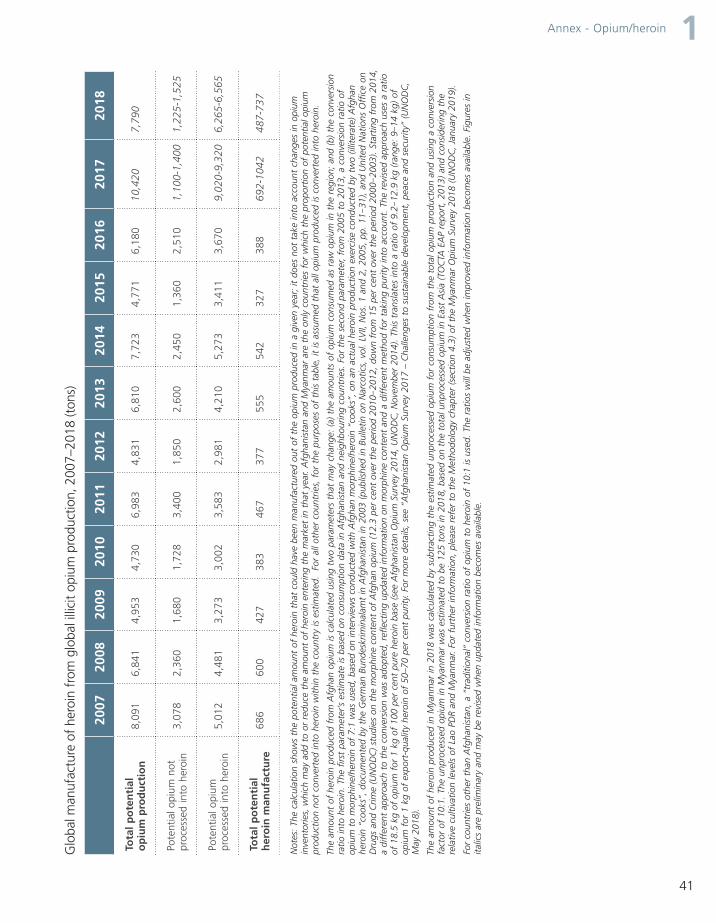
41
Annex - Opium/heroin 1G
loba
l man
ufac
ture
of
hero
in f
rom
glo
bal i
llici
t op
ium
pro
duct
ion,
200
7–20
18 (t
ons)
Not
es:
The
calc
ulat
ion
show
s th
e po
tent
ial a
mou
nt o
f he
roin
tha
t co
uld
have
bee
n m
anuf
actu
red
out
of t
he o
pium
pro
duce
d in
a g
iven
yea
r; it
doe
s no
t ta
ke in
to a
ccou
nt c
hang
es in
opi
um
inve
ntor
ies,
whi
ch m
ay a
dd t
o or
red
uce
the
amou
nt o
f he
roin
ent
erin
g th
e m
arke
t in
tha
t ye
ar.
Afg
hani
stan
and
Mya
nmar
are
the
onl
y co
untr
ies
for
whi
ch t
he p
ropo
rtio
n of
pot
entia
l opi
um
prod
uctio
n no
t co
nver
ted
into
her
oin
with
in t
he c
ount
ry is
est
imat
ed.
For
all
othe
r co
untr
ies,
for
the
pur
pose
s of
thi
s ta
ble,
it is
ass
umed
tha
t al
l opi
um p
rodu
ced
is c
onve
rted
into
her
oin.
The
amou
nt o
f he
roin
pro
duce
d fr
om A
fgha
n op
ium
is c
alcu
late
d us
ing
two
para
met
ers
that
may
cha
nge:
(a)
the
am
ount
s of
opi
um c
onsu
med
as
raw
opi
um in
the
reg
ion;
and
(b)
the
con
vers
ion
ratio
into
her
oin.
The
firs
t pa
ram
eter
’s e
stim
ate
is b
ased
on
cons
umpt
ion
data
in A
fgha
nist
an a
nd n
eigh
bour
ing
coun
trie
s. F
or t
he s
econ
d pa
ram
eter
, fr
om 2
005
to 2
013,
a c
onve
rsio
n ra
tio o
f op
ium
to
mor
phin
e/he
roin
of
7:1
was
use
d, b
ased
on
inte
rvie
ws
cond
ucte
d w
ith A
fgha
n m
orph
ine/
hero
in “
cook
s”,
on a
n ac
tual
her
oin
prod
uctio
n ex
erci
se c
ondu
cted
by
two
(illit
erat
e) A
fgha
n he
roin
“co
oks”
, do
cum
ente
d by
the
Ger
man
Bun
desk
rimin
alam
t in
Afg
hani
stan
in 2
003
(pub
lishe
d in
Bul
letin
on
Nar
cotic
s, v
ol.
LVII,
Nos
. 1
and
2, 2
005,
pp.
11‒
31),
and
Uni
ted
Nat
ions
Off
ice
on
Dru
gs a
nd C
rime
(UN
OD
C)
stud
ies
on t
he m
orph
ine
cont
ent
of A
fgha
n op
ium
(12
.3 p
er c
ent
over
the
per
iod
2010
‒201
2, d
own
from
15
per
cent
ove
r th
e pe
riod
2000
‒200
3).
Star
ting
from
201
4,
a di
ffer
ent
appr
oach
to
the
conv
ersi
on w
as a
dopt
ed,
refle
ctin
g up
date
d in
form
atio
n on
mor
phin
e co
nten
t an
d a
diff
eren
t m
etho
d fo
r ta
king
pur
ity in
to a
ccou
nt.
The
revi
sed
appr
oach
use
s a
ratio
of
18.
5 kg
of
opiu
m f
or 1
kg
of 1
00 p
er c
ent
pure
her
oin
base
(se
e A
fgha
nist
an O
pium
Sur
vey
2014
, U
NO
DC
, N
ovem
ber
2014
). Th
is t
rans
late
s in
to a
rat
io o
f 9.
2‒12
.9 k
g (r
ange
: 9‒
14 k
g) o
f op
ium
for
1 k
g of
exp
ort-
qual
ity h
eroi
n of
50–
70 p
er c
ent
purit
y. F
or m
ore
deta
ils,
see
“Afg
hani
stan
Opi
um S
urve
y 20
17 –
Cha
lleng
es t
o su
stai
nabl
e de
velo
pmen
t, p
eace
and
sec
urity
” (U
NO
DC
, M
ay 2
018)
.
The
amou
nt o
f he
roin
pro
duce
d in
Mya
nmar
in 2
018
was
cal
cula
ted
by s
ubtr
actin
g th
e es
timat
ed u
npro
cess
ed o
pium
for
con
sum
ptio
n fr
om t
he t
otal
opi
um p
rodu
ctio
n an
d us
ing
a co
nver
sion
fa
ctor
of
10:1
. Th
e un
proc
esse
d op
ium
in M
yanm
ar w
as e
stim
ated
to
be 1
25 t
ons
in 2
018,
bas
ed o
n th
e to
tal u
npro
cess
ed o
pium
in E
ast
Asi
a (T
OC
TA E
AP
repo
rt,
2013
) an
d co
nsid
erin
g th
e
rela
tive
culti
vatio
n le
vels
of
Lao
PDR
and
Mya
nmar
. Fo
r fu
rthe
r in
form
atio
n, p
leas
e re
fer
to t
he M
etho
dolo
gy c
hapt
er (
sect
ion
4.3)
of
the
Mya
nmar
Opi
um S
urve
y 20
18 (
UN
OD
C,
Janu
ary
2019
).
For
coun
trie
s ot
her
than
Afg
hani
stan
, a
“tra
ditio
nal”
con
vers
ion
ratio
of
opiu
m t
o he
roin
of
10:1
is u
sed.
The
rat
ios
will
be
adju
sted
whe
n im
prov
ed in
form
atio
n be
com
es a
vaila
ble.
Fig
ures
in
italic
s ar
e pr
elim
inar
y an
d m
ay b
e re
vise
d w
hen
upda
ted
info
rmat
ion
beco
mes
ava
ilabl
e.
2007
2008
2009
2010
2011
2012
2013
2014
2015
2016
2017
2018
Tota
l p
ote
nti
al
op
ium
pro
du
ctio
n
8,0
91
6,8
41
4,9
53
4,7
30
6,9
83
4,8
31
6,8
10
7,7
23
4,7
71
6,1
80
10,
420
7,7
90
Pote
ntia
l opi
um n
ot
proc
esse
d in
to h
eroi
n 3
,078
2
,360
1
,680
1
,728
3
,400
1
,850
2
,600
2
,450
1
,360
2
,510
1
,100
-1,4
00
1,2
25-1
,525
Pote
ntia
l opi
um
proc
esse
d in
to h
eroi
n 5
,012
4
,481
3
,273
3
,002
3
,583
2
,981
4
,210
5
,273
3
,411
3
,670
9
,020
-9,3
20
6,2
65-6
,565
Tota
l p
ote
nti
al
her
oin
man
ufa
ctu
re
686
6
00
427
3
83
467
3
77
555
5
42
327
3
88
692
-104
2 4
87-7
37

42
WO
RLD
DRU
G R
EPO
RT 2
019 EXECUTIVE SUMMARY
Repo
rted
era
dica
tion
of c
oca
bush
, 200
7–20
17
Sour
ce:
Uni
ted
Nat
ions
Off
ice
on D
rugs
and
Crim
e an
nual
rep
ort
ques
tionn
aire
and
gov
ernm
ent
repo
rts.
Not
e: T
he t
otal
s fo
r Bo
livia
(Pl
urin
atio
nal S
tate
of)
and
Per
u in
clud
e vo
lunt
ary
and
forc
ed e
radi
catio
n. R
epor
ted
erad
icat
ion
refe
rs t
o th
e su
m o
f al
l are
as e
radi
cate
d in
a y
ear,
incl
udin
g re
peat
ed
erad
icat
ion
of t
he s
ame
field
s. T
wo
dots
indi
cate
tha
t da
ta a
re n
ot a
vaila
ble.
Glo
bal i
llici
t cu
ltiva
tion
of c
oca
bush
, 200
7–20
17 (h
ecta
res)
Sour
ces:
Plu
rinat
iona
l Sta
te o
f Bo
livia
: na
tiona
l illi
cit
crop
mon
itorin
g sy
stem
sup
port
ed b
y th
e U
nite
d N
atio
ns O
ffic
e on
Dru
gs a
nd C
rime
(UN
OD
C).
Col
ombi
a: n
atio
nal i
llici
t cr
op
mon
itorin
g sy
stem
sup
port
ed b
y U
NO
DC
. Pe
ru:
natio
nal i
llici
t cr
op m
onito
ring
syst
em s
uppo
rted
by
UN
OD
C.
Not
e: D
iffer
ent
area
con
cept
s an
d th
eir
effe
ct o
n co
mpa
rabi
lity
wer
e pr
esen
ted
in t
he W
orld
Dru
g Re
port
201
2 (U
nite
d N
atio
ns p
ublic
atio
n, S
ales
No.
E.1
2.X
I.1)
(p.
41-4
2).
Effo
rts
to im
prov
e th
e co
mpa
rabi
lity
of e
stim
ates
bet
wee
n co
untr
ies
cont
inue
; si
nce
2011
the
net
are
a un
der
coca
bus
h cu
ltiva
tion
on t
he r
efer
ence
dat
e of
31
Dec
embe
r w
as e
stim
ated
for
Per
u, in
add
ition
to
C
olom
bia.
The
est
imat
e pr
esen
ted
for
the
Plur
inat
iona
l Sta
te o
f Bo
livia
rep
rese
nts
the
area
und
er c
oca
culti
vatio
n as
inte
rpre
ted
on s
atel
lite
imag
ery.
a N
et a
rea
on 3
1 D
ecem
ber.
b Fi
gure
s re
pres
ent
the
area
und
er c
oca
culti
vatio
n as
inte
rpre
ted
on s
atel
lite
imag
ery.
c N
et a
rea
on 3
1 D
ecem
ber,
dedu
ctin
g fie
lds
erad
icat
ed a
fter
sat
ellit
e im
ager
y w
as t
aken
.
d Th
e gl
obal
coc
a cu
ltiva
tion
figur
e w
as c
alcu
late
d w
ith t
he "
area
as
inte
rpre
ted
on s
atel
lite
imag
ery"
for
Per
u in
201
1.
Co
ca/c
oca
ine
2007
2008
2009
2010
2011
2012
2013
2014
2015
2016
2017
Boliv
ia
(Plu
rinat
iona
l Sta
te o
f)
28,9
0030
,500
30,9
0031
,000
27,2
0025
,300
23,0
0020
,400
20,2
00 2
3,10
0 2
4,50
0
Col
ombi
a a
99,0
0081
,000
73,0
0062
,000
64,0
0048
,000
48,0
0069
,000
96,0
00 1
46,0
00
171
,000
Peru
b53
,700
56,1
0059
,900
61,2
0064
,400
Peru
c62
,500
60,4
0049
,800
42,9
0040
,300
43,
900
49,
900
Tota
l18
1,60
0 16
7,60
0 16
3,80
0 15
4,20
0 15
5,60
0 d
133,
700
120,
800
132,
300
156,
500
213,
000
245,
400
Met
ho
d o
f er
adic
atio
nU
nit
2008
2009
2010
2011
2012
2013
2014
2015
2016
2017
Boliv
ia
(Plu
rinat
iona
l Sta
te o
f)m
anua
lhe
ctar
e5,
484
6,34
18,
200
10,5
0911
,044
11,4
0711
,144
11,0
206,
577
7,23
7
Col
ombi
am
anua
lhe
ctar
e96
,003
60,5
6543
,804
35,2
0130
,456
22,1
2111
,703
13,4
7317
,642
52,0
01
spra
ying
hect
are
133,
496
104,
772
101,
940
103,
302
100,
549
47,0
5255
,532
36,4
940
0
Peru
man
ual
hect
are
10,1
4310
,025
12,0
3310
,290
14,1
7123
,785
31,2
0535
,868
30,1
5025
,784
Ecua
dor
man
ual
hect
are
126
314
....
....
....
plan
ts15
2,00
057
,765
3,87
055
,030
122,
656
41,9
9615
,874
45,2
6620
,896
10,1
00

43
Annex - Coca/cocaine 1Po
tent
ial m
anuf
actu
re o
f 10
0 pe
r ce
nt p
ure
coca
ine,
200
7–20
17 (t
ons)
Sour
ces:
Plu
rinat
iona
l Sta
te o
f Bo
livia
: ow
n ca
lcul
atio
ns b
ased
on
coca
leaf
yie
ld s
urve
ys b
y th
e U
nite
d N
atio
ns O
ffic
e on
Dru
gs a
nd C
rime
(UN
OD
C)
(Yun
gas
de L
a Pa
z) a
nd s
cien
tific
st
udie
s by
the
Dru
g En
forc
emen
t A
dmin
istr
atio
n of
the
Uni
ted
Stat
es o
f A
mer
ica
(Cha
pare
). C
olom
bia:
UN
OD
C/G
over
nmen
t of
Col
ombi
a. P
eru:
ow
n ca
lcul
atio
ns b
ased
on
coca
leaf
to
coc
aine
con
vers
ion
ratio
fro
m s
cien
tific
stu
dies
by
the
Dru
g En
forc
emen
t A
dmin
istr
atio
n. D
etai
led
info
rmat
ion
on t
he o
ngoi
ng r
evis
ion
of c
onve
rsio
n ra
tios
and
coca
ine
labo
rato
ry
effic
ienc
y is
ava
ilabl
e in
the
Wor
ld D
rug
Repo
rt 2
010
(Uni
ted
Nat
ions
pub
licat
ion,
Sal
es N
o. E
.10.
XI.1
3),
p. 2
49.
a C
onve
rsio
n of
are
as u
nder
coc
a cu
ltiva
tion
into
coc
a le
af a
nd t
hen
into
coc
aine
hyd
roch
lorid
e, t
akin
g yi
elds
, am
ount
s of
coc
a le
af u
sed
for
licit
purp
oses
and
coc
aine
labo
rato
ry e
ffic
ienc
y in
to
acco
unt.
Not
es:
Ow
ing
to a
lack
of
upda
ted
conv
ersi
on f
acto
rs in
Bol
ivia
(Pl
urin
atio
nal S
tate
of)
and
Per
u, n
o fin
al e
stim
ates
of
the
leve
l of
coca
ine
prod
uctio
n ca
n be
pro
vide
d.
With
res
pect
to
data
pub
lishe
d in
the
Wor
ld D
rug
Repo
rt 2
016
(Uni
ted
Nat
ions
pub
licat
ion,
Sal
es N
o. E
.16.
XI.7
), th
e fo
llow
ing
amen
dmen
ts h
ave
been
mad
e: (
a) d
ata
for
Col
ombi
a (2
005‒
2008
) ha
ve b
een
revi
sed
in o
rder
to
ensu
re a
con
sist
ent
impl
emen
tatio
n of
rev
isio
ns t
o th
e m
etho
dolo
gy,
affe
ctin
g th
e w
ay c
oca
prod
uctio
n is
cal
cula
ted,
for
the
ent
ire t
ime
serie
s 20
05‒2
015
(for
de
tails
, se
e C
olom
bia
Coc
a C
ultiv
atio
n Su
rvey
Rep
ort
2014
(U
NO
DC
, 20
15)
and
Col
ombi
a Su
rvey
of
terr
itorie
s af
fect
ed b
y ill
icit
crop
s 20
15,
Ann
ex 3
(U
NO
DC
201
6));
(b)
tota
ls f
or 2
009‒
2012
ba
sed
on "
old"
and
"ne
w"
conv
ersi
on r
atio
s ha
ve b
een
revi
sed
to r
ectif
y m
inor
inac
cura
cies
in d
ata
proc
essi
ng.
Figu
res
in it
alic
s ar
e su
bjec
t to
rev
isio
n. T
wo
dots
indi
cate
tha
t da
ta a
re n
ot a
vaila
ble.
Info
rmat
ion
on e
stim
atio
n m
etho
dolo
gies
and
def
initi
ons
can
be f
ound
in t
he o
nlin
e m
etho
dolo
gy s
ectio
n of
th
e W
orld
Dru
g Re
port
201
9.
2007
2008
2009
2010
2011
2012
2013
2014
2015
2016
2017
Boliv
ia
(Plu
rinat
iona
l Sta
te o
f)
104
113
....
....
....
....
..
Col
ombi
a68
3 47
1 48
8 42
438
433
329
044
264
61,
053
1,37
9
Peru
290
302
....
....
....
....
..
Tota
l b
ased
on
“o
ld”
co
nve
rsio
n r
atio
sa 1
,077
8
86
920
8
62
815
7
38
662
7
46
936
1
,378
1
,743
Tota
l b
ased
on
“n
ew”
co
nve
rsio
n r
atio
sa 1
,317
1
,143
1
,188
1
,134
1
,090
9
97
902
9
43
1,1
24
1,5
86
1,9
76

44
WO
RLD
DRU
G R
EPO
RT 2
019 EXECUTIVE SUMMARY
Can
nabi
s cu
ltiva
tion,
pro
duct
ion
and
erad
icat
ion,
late
st y
ear
avai
labl
e fr
om t
he p
erio
d 20
12–2
017
Can
nab
is
Yea
rC
ou
ntr
yPr
od
uct
Ou
tdo
ors
/
ind
oo
rs
Are
a
cult
ivat
ed
(ha)
Are
a
erad
icat
ed
(ha)
Har
vest
able
ar
ea (
ha)
Pro
du
ctio
n
(to
ns)
Plan
ts
erad
icat
edSi
tes
er
adic
ated
2012
Afg
hani
stan
resi
nou
tdoo
rs 1
0,00
0 1
,400
2017
Alb
ania
herb
indo
ors
7,7
66
2016
Alb
ania
herb
outd
oors
2,5
36,2
88
5,2
05
2017
Alb
ania
herb
outd
oors
66,
927
500
2014
Alg
eria
resi
nou
tdoo
rs 2
,522
2016
Arm
enia
herb
outd
oors
0.50
a0.
500.
0075
720
2017
Arm
enia
herb
outd
oors
0.50
a0.
500.
002,
547
21
2016
Aus
tral
iahe
rbin
door
s31
,266
408
2017
Aus
tral
iahe
rbin
door
s78
,310
433
2016
Aus
tral
iahe
rbou
tdoo
rs22
,257
1,02
1
2017
Aus
tral
iahe
rbou
tdoo
rs1.
00 a
1.00
0.00
31,4
3194
8
2015
Aus
tria
herb
outd
oors
3.00
a3.
000.
00
2013
Aze
rbai
jan
herb
outd
oors
23.9
5 a
23.9
50.
0026
3.96
8,46
915
1
2014
Aze
rbai
jan
herb
outd
oors
17.5
0 a
17.5
00.
0014
,889
195
2017
Aze
rbai
jan
herb
outd
oors
0.25
a0.
2533
6,79
1
2015
Baha
mas
herb
outd
oors
17,2
70
2012
Bang
lade
shhe
rbou
tdoo
rs39
,848
2013
Bang
lade
shhe
rbou
tdoo
rs35
,012
2014
Bang
lade
shhe
rbou
tdoo
rs35
,988
2015
Bang
lade
shhe
rbou
tdoo
rs39
,967
2016
Bang
lade
shhe
rbou
tdoo
rs47
,104
2016
Bela
rus
herb
indo
ors
28
2017
Bela
rus
herb
indo
ors
32
2016
Bela
rus
herb
oudo
ors
123.
801,
945
2017
Bela
rus
herb
oudo
ors
125.
902,
283
2015
Belg
ium
herb
indo
ors
345,
518
1,16
4
2017
Belg
ium
herb
indo
ors
415,
728
1,17
5
2015
Belg
ium
herb
outd
oors
4,88
593
2017
Belg
ium
herb
outd
oors
848
59
2015
Beliz
ehe
rbou
tdoo
rs50
,897
2016
Boliv
ia (
Plur
inat
iona
l Sta
te o
f)he
rbou
tdoo
rs14
.60
35

45
Annex - Cannabis 1
Yea
rC
ou
ntr
yPr
od
uct
Ou
tdo
ors
/
ind
oo
rs
Are
a
cult
ivat
ed
(ha)
Are
a
erad
icat
ed
(ha)
Har
vest
able
ar
ea (
ha)
Pro
du
ctio
n
(to
ns)
Plan
ts
erad
icat
edSi
tes
er
adic
ated
2017
Boliv
ia (
Plur
inat
iona
l Sta
te o
f)he
rbou
tdoo
rs14
.00
52
2016
Bosn
ia a
nd H
erze
govi
nahe
rbin
door
s39
.00
2017
Bosn
ia a
nd H
erze
govi
nahe
rbin
door
s1
1
2016
Bosn
ia a
nd H
erze
govi
nahe
rbou
tdoo
rs1,
680.
00
2017
Bosn
ia a
nd H
erze
govi
nahe
rbou
tdoo
rs0.
02 a
0.02
0.00
539
53
2014
Braz
ilhe
rbou
tdoo
rs44
.01
1,3
64,3
16
2017
Braz
ilhe
rbou
tdoo
rs11
7.51
1,9
10,4
51
604
2015
Bulg
aria
herb
indo
ors
323
2015
Bulg
aria
herb
outd
oors
37.7
79,
488
2017
Cen
tral
Afr
ican
Rep
ublic
herb
outd
oors
130.
0060
.00
5510
.00
250
,000
22
2016
Chi
lehe
rbin
door
s26
,988
2,74
0
2017
Chi
lehe
rbin
door
s50
,414
2,40
8
2016
Chi
lehe
rbou
tdoo
rs58
,950
264
2017
Chi
lehe
rbou
tdoo
rs19
4,69
420
2
2016
Chi
nahe
rbou
tdoo
rs9.
801,
390,
000
2016
Col
ombi
ahe
rbou
tdoo
rs13
5.00
2017
Col
ombi
ahe
rbou
tdoo
rs17
3.71
2016
Cos
ta R
ica
herb
indo
ors
678
5
2017
Cos
ta R
ica
herb
indo
ors
2
2016
Cos
ta R
ica
herb
outd
oors
17.5
92,
122,
244
201
2017
Cos
ta R
ica
herb
outd
oors
215
2016
Côt
e d’
Ivoi
rehe
rbou
tdoo
rs5
2017
Côt
e d’
Ivoi
rehe
rbou
tdoo
rs0.
251
2016
Cze
chia
herb
indo
ors
53,5
4922
9
2017
Cze
chia
herb
indo
ors
50,9
2530
5
2016
Cze
chia
herb
outd
oors
4,11
1
2017
Cze
chia
herb
outd
oors
3,46
7
2015
Den
mar
khe
rbin
door
s/
outd
oors
14,5
6097
2016
Den
mar
khe
rbin
door
s/
outd
oors
13,2
1710
5
2017
Den
mar
khe
rbin
door
s/
outd
oors
34,8
0165
2014
Dom
inic
an R
epub
liche
rbou
tdoo
rs6.
00 a
6.00
0.00
0.21
111
8
2016
Ecua
dor
herb
outd
oors
224
34

46
WO
RLD
DRU
G R
EPO
RT 2
019 EXECUTIVE SUMMARY
Yea
rC
ou
ntr
yPr
od
uct
Ou
tdo
ors
/
ind
oo
rs
Are
a
cult
ivat
ed
(ha)
Are
a
erad
icat
ed
(ha)
Har
vest
able
ar
ea (
ha)
Pro
du
ctio
n
(to
ns)
Plan
ts
erad
icat
edSi
tes
er
adic
ated
2017
Ecua
dor
herb
outd
oors
397
10
2015
Egyp
the
rb/r
esin
outd
oors
140.
00
2017
Egyp
the
rb/r
esin
outd
oors
126.
00
2014
Esw
atin
ihe
rbou
tdoo
rs1,
500.
001,
069.
5043
0.50
3,00
0,00
021
0
2017
Geo
rgia
herb
indo
ors
0.01
186
91
2017
Geo
rgia
herb
outd
oors
0.02
a0.
020.
0093
19
2016
El S
alva
dor
herb
outd
oors
1.00
227
25
2014
Fran
cehe
rbou
tdoo
rs15
8,59
283
7
2015
Ger
man
yhe
rbin
door
s13
5,92
578
6
2017
Ger
man
yhe
rbin
door
s85
,226
573
2015
Ger
man
yhe
rbou
tdoo
rs 9
,136
12
7
2017
Ger
man
yhe
rbou
tdoo
rs95
2016
Gre
ece
herb
indo
ors
16,
554
2017
Gre
ece
herb
indo
ors
19,
498
2016
Gre
ece
herb
oudo
ors
39,
151
2017
Gre
ece
herb
oudo
ors
27,
409
2016
Gua
tem
ala
herb
outd
oors
9.00
3,1
38,2
98
427
2017
Gua
tem
ala
herb
outd
oors
3.50
a3.
811.
61 6
,033
,345
15
0
2015
Guy
ana
herb
outd
oors
20.0
0 9.
4010
.60
1,00
0.00
419
,700
19
2016
Hon
dura
she
rbin
door
s 7
2
2016
Hon
dura
she
rbou
tdoo
rs 2
4,25
3 19
2017
Hon
dura
she
rbou
tdoo
rs59
.58
a59
.59
0.00
2016
Chi
na,
Hon
g K
ong
SAR
herb
indo
ors
329
1
2016
Hun
gary
herb
indo
ors
5,00
03
2016
Hun
gary
herb
outd
oors
2,00
020
2013
Icel
and
herb
indo
ors
6,65
232
3
2016
Indi
ahe
rbou
tdoo
rs3,
414.
74
2017
Indi
ahe
rbou
tdoo
rs3,
445.
906,
687,
376
2016
Indo
nesi
ahe
rbou
tdoo
rs48
2.00
a48
2.00
0.00
2017
Indo
nesi
ahe
rbou
tdoo
rs89
.00
a89
.00
0.00
738,
020
14
2016
Irela
ndhe
rbin
door
s7,
273
2017
Irela
ndhe
rbin
door
s9,
046
50
2017
Italy
herb
indo
ors
56,1
251,
161
2017
Italy
herb
outd
oors
209,
510
401

47
Annex - Cannabis 1
Yea
rC
ou
ntr
yPr
od
uct
Ou
tdo
ors
/
ind
oo
rs
Are
a
cult
ivat
ed
(ha)
Are
a
erad
icat
ed
(ha)
Har
vest
able
ar
ea (
ha)
Pro
du
ctio
n
(to
ns)
Plan
ts
erad
icat
edSi
tes
er
adic
ated
2014
Italy
herb
indo
ors
51,5
3463
9
2014
Italy
herb
outd
oors
70,1
251,
134
2012
Jam
aica
herb
outd
oors
456
382
2016
Kaz
akhs
tan
herb
outd
oors
18.0
0 a
18.0
00.
0017
0,00
020
2
2017
Kaz
akhs
tan
herb
outd
oors
12.3
0 a
12.3
00.
0093
0,77
491
2016
Ken
yahe
rbou
tdoo
rs12
.00
8,74
746
2017
Ken
yahe
rbou
tdoo
rs0.
104,
662
2015
Kyr
gyzs
tan
herb
outd
oors
5,01
4.00
5,01
4.00
2016
Latv
iahe
rbin
door
s55
735
2017
Latv
iahe
rbin
door
s79
834
2016
Latv
iahe
rbou
tdoo
rs78
6
2017
Latv
iahe
rbou
tdoo
rs66
15
2015
Leba
non
herb
outd
oors
3,50
0.00
3,50
0.00
2017
Leba
non
herb
outd
oors
40,7
72.0
0
2016
Lith
uani
ahe
rbin
door
s4
2017
Lith
uani
ahe
rbin
door
s8
2017
Lith
uani
ahe
rbou
tdoo
rs7
2015
Mad
agas
car
herb
outd
oors
11.0
021
,325
2017
Mad
agas
car
herb
outd
oors
9.00
57,7
08
2013
Mal
tahe
rbin
door
s27
2016
Mex
ico
herb
outd
oors
5,47
8.42
6,57
4.1
38,4
32
2017
Mex
ico
herb
outd
oors
4,19
3.34
5,03
2.0
34,5
23
2013
Mon
golia
herb
outd
oors
15,0
00.0
04,
000.
0011
,000
.00
4,00
04,
000
2016
Mor
occo
plan
tou
tdoo
rs47
,000
.00
395.
0046
,605
.00
2017
Mor
occo
plan
tou
tdoo
rs47
,500
.00
523.
0046
,977
.00
2016
Mor
occo
herb
outd
oors
35,6
52.8
3
2017
Mor
occo
herb
outd
oors
35,7
02.9
0
2016
Mor
occo
resi
nou
tdoo
rs71
3.00
2017
Mor
occo
resi
nou
tdoo
rs71
4.06
2014
Mya
nmar
herb
outd
oors
15.0
010
.00
5.00
3
2016
Net
herla
nds
herb
indo
ors
994,
068
5,85
6
2017
Net
herla
nds
herb
indo
ors
883,
163
5,53
8
2016
New
Zea
land
herb
indo
ors
18,9
0360
7
2017
New
Zea
land
herb
indo
ors
19,9
92

48
WO
RLD
DRU
G R
EPO
RT 2
019 EXECUTIVE SUMMARY
Yea
rC
ou
ntr
yPr
od
uct
Ou
tdo
ors
/
ind
oo
rs
Are
a
cult
ivat
ed
(ha)
Are
a
erad
icat
ed
(ha)
Har
vest
able
ar
ea (
ha)
Pro
du
ctio
n
(to
ns)
Plan
ts
erad
icat
edSi
tes
er
adic
ated
2016
New
Zea
land
herb
outd
oors
104,
725
2017
New
Zea
land
herb
outd
oors
19,5
59
2014
Nic
arag
uahe
rbou
tdoo
rs0.
301,
507.
003,
014
30
2016
Nig
eria
herb
outd
oors
718.
7865
2017
Nig
eria
herb
outd
oors
317.
12
2015
Nor
way
herb
indo
ors
0.04
4,00
030
2013
Pana
ma
herb
indo
ors
0.50
a0.
500.
0037
2
2013
Pana
ma
herb
outd
oors
10.5
0 a
10.5
00.
0078
,633
2
2016
Para
guay
plan
tou
tdoo
rs1,
298.
50 a
1,29
8.50
0.00
5,65
6,26
64
2017
Para
guay
plan
tou
tdoo
rs1,
462.
0036
,550
,000
2016
Para
guay
herb
outd
oors
1,29
8.50
2016
Para
guay
resi
nou
tdoo
rs1.
15
2016
Peru
herb
outd
oors
87.8
31,
429,
749
2017
Peru
herb
outd
oors
61.3
04,
671,
387
47
2016
Phili
ppin
eshe
rbou
tdoo
rs8.
6724
,635
,153
337
2017
Phili
ppin
eshe
rbou
tdoo
rs4.
8222
1,03
527
2016
Pola
ndhe
rbin
door
s14
6,75
51,
403
2017
Pola
ndhe
rbin
door
s44
810
2016
Pola
ndhe
rbin
door
s/
outd
oors
4,58
521
9
2017
Pola
ndhe
rbin
door
s/
outd
oors
54
2017
Port
ugal
herb
indo
ors/
ou
tdoo
rs22
,910
158
2013
Repu
blic
of
Kor
eahe
rbou
tdoo
rs8,
072
2014
Repu
blic
of
Mol
dova
herb
outd
oors
100
.00
59.0
041
.00
10,0
00.0
020
0,54
8
2017
Repu
blic
of
Mol
dova
herb
outd
oors
0.1
5 2.
5725
7,23
6
2014
Repu
blic
of
Mol
dova
herb
indo
ors
41.0
0
2016
Rom
ania
herb
indo
ors
1,43
341
2017
Rom
ania
herb
indo
ors
1,87
546
2016
Rom
ania
herb
outd
oors
6.99
42
2017
Rom
ania
herb
outd
oors
1.90
4,90
532
2016
Russ
ian
Fede
ratio
nhe
rbin
door
s0.
6678
8
2017
Russ
ian
Fede
ratio
nhe
rbin
door
s0.
871,
990
2016
Russ
ian
Fede
ratio
nhe
rbou
tdoo
rs7.
61 a
7.61
0.00
68.6
41,
143

49
Annex - Cannabis 1
Yea
rC
ou
ntr
yPr
od
uct
Ou
tdo
ors
/
ind
oo
rs
Are
a
cult
ivat
ed
(ha)
Are
a
erad
icat
ed
(ha)
Har
vest
able
ar
ea (
ha)
Pro
du
ctio
n
(to
ns)
Plan
ts
erad
icat
edSi
tes
er
adic
ated
2017
Russ
ian
Fede
ratio
nhe
rbou
tdoo
rs15
9.00
a15
9.00
0.00
30.0
75,
379
2015
Serb
iahe
rbou
tdoo
rs0.
05
2013
Sier
ra L
eone
herb
outd
oors
190.
0019
0.00
190
3
2016
Slov
akia
herb
indo
ors
385
2017
Slov
akia
herb
outd
oors
2.00
a2.
000.
002,
299
31
2014
Slov
enia
herb
indo
ors
9,22
311
8
2017
Slov
enia
herb
indo
ors
10,2
5978
2014
Slov
enia
herb
outd
oors
1,84
4
2015
Spai
nhe
rbin
door
s24
4,77
210
8
2015
Spai
nhe
rbou
tdoo
rs13
5,07
444
2014
Suda
nhe
rbou
tdoo
rs8.
00 a
8.00
0.00
345.
00
2017
Suda
nhe
rbou
tdoo
rs1,
250.
00 a
1,25
0.00
0.00
205.
0010
0
2014
Swed
enhe
rbin
door
s10
,000
56
2015
Swed
enhe
rbou
tdoo
rs18
2.00
2017
Swed
enhe
rbou
tdoo
rs5,
100
44
2016
Switz
erla
ndhe
rbin
door
s11
,386
83
2017
Switz
erla
ndhe
rbin
door
s71
,750
2012
Tajik
ista
nhe
rbou
tdoo
rs2,
180,
121
2016
Thai
land
herb
outd
oors
1.00
a1.
000.
007.
501
2015
Trin
idad
and
Tob
ago
herb
outd
oors
0.31
375,
925
58
2012
Uga
nda
herb
outd
oors
150.
0088
.00
62.0
05
2016
Ukr
aine
herb
outd
oors
91.0
0 a
91.0
00.
00
2017
Ukr
aine
herb
outd
oors
166.
904,
600,
000
2016
Uni
ted
Stat
es o
f A
mer
ica
herb
indo
ors
406,
125
1,86
5
2017
Uni
ted
Stat
es o
f A
mer
ica
herb
indo
ors
303,
654
1,39
9
2016
Uni
ted
Stat
es o
f A
mer
ica
herb
outd
oors
4,94
0,59
65,
513
2017
Uni
ted
Stat
es o
f A
mer
ica
herb
outd
oors
3,07
8,41
84,
062
2016
Uru
guay
herb
indo
ors
661
2017
Uru
guay
herb
indo
ors
1,92
6
2016
Uzb
ekis
tan
herb
outd
oors
0.20
a0.
200.
0058
6
2017
Uzb
ekis
tan
herb
outd
oors
0.20
a0.
200.
0061
8
2015
Vie
t N
amhe
rbou
door
s1.
00
Sour
ce:
Uni
ted
Nat
ions
Off
ice
on D
rugs
and
Crim
e an
nual
rep
ort
ques
tionn
aire
, go
vern
men
t re
port
s an
d an
d in
tern
atio
nal n
arco
tics
cont
rol s
trat
egy
repo
rts
of t
he U
nite
d St
ates
of
Am
eric
a.a
Are
a id
entif
ied
by t
he a
utho
ritie
s fo
r er
adic
atio
n.


51
GLOSSARY
amphetamine-type stimulants — a group of sub-stances composed of synthetic stimulants controlled under the Convention on Psychotropic Substances of 1971 and from the group of substances called amphetamines, which includes amphetamine, meth-amphetamine, methcathinone and the “ecstasy”-group substances (3,4-methylenedioxym-ethamphetamine (MDMA) and its analogues).
amphetamines — a group of amphetamine-type stimulants that includes amphetamine and methamphetamine.
annual prevalence — the total number of people of a given age range who have used a given drug at least once in the past year, divided by the number of people of the given age range, and expressed as a percentage.
coca paste (or coca base) — an extract of the leaves of the coca bush. Purification of coca paste yields cocaine (base and hydrochloride).
“crack” cocaine — cocaine base obtained from cocaine hydrochloride through conversion processes to make it suitable for smoking.
cocaine salt — cocaine hydrochloride.
drug use — use of controlled psychoactive substances for non-medical and non-scientific purposes, unless otherwise specified.
fentanyls — fentanyl and its analogues.
new psychoactive substances — substances of abuse, either in a pure form or a preparation, that are not controlled under the Single Convention on Narcotic Drugs of 1961 or the 1971 Convention, but that may pose a public health threat. In this context, the term “new” does not necessarily refer to new inven-tions but to substances that have recently become available.
opiates — a subset of opioids comprising the various products derived from the opium poppy plant, including opium, morphine and heroin.
opioids — a generic term that refers both to opiates and their synthetic analogues (mainly prescription or pharmaceutical opioids) and compounds synthe-sized in the body.
problem drug users — people who engage in the high-risk consumption of drugs. For example, people who inject drugs, people who use drugs on a daily basis and/or people diagnosed with drug use disorders (harmful use or drug dependence), based on clinical criteria as contained in the Diagnostic and Statistical Manual of Mental Disorders (fifth edi-tion) of the American Psychiatric Association, or the International Classification of Diseases and Related Health Problems (tenth revision) of WHO.
people who suffer from drug use disorders/people with drug use disorders — a subset of people who use drugs. Harmful use of substances and dependence are features of drug use disorders. People with drug use disorders need treatment, health and social care and rehabilitation.
harmful use of substances — defined in the Interna-tional Statistical Classification of Diseases and Related Health Problems (tenth revision) as a pattern of use that causes damage to physical or mental health.
dependence — defined in the International Statistical Classification of Diseases and Related Health Problems (tenth revision) as a cluster of physiological, behav-ioural and cognitive phenomena that develop after repeated substance use and that typically include a strong desire to take the drug, difficulties in control-ling its use, persisting in its use despite harmful consequences, a higher priority given to drug use than to other activities and obligations, increased tolerance, and sometimes a physical withdrawal state.
substance or drug use disorders — referred to in the Diagnostic and Statistical Manual of Mental Disorders (fifth edition) as patterns of symptoms resulting from the repeated use of a substance despite expe-riencing problems or impairment in daily life as a result of using substances. Depending on the number of symptoms identified, substance use dis-order may be mild, moderate or severe.
prevention of drug use and treatment of drug use dis-orders — the aim of “prevention of drug use” is to prevent or delay the initiation of drug use, as well as the transition to drug use disorders. Once a person develops a drug use disorder, treatment, care and rehabilitation are needed


53
REGIONAL GROUPINGS
• East and South-East Asia: Brunei Darussalam, Cambodia, China, Democratic People’s Republic of Korea, Indonesia, Japan, Lao People’s Democratic Republic, Malaysia, Mongolia, Myanmar, Philippines, Republic of Korea, Singapore, Thailand, Timor-Leste, Viet Nam, Hong Kong, China, Macao, China, and Taiwan Province of China
• South-West Asia: Afghanistan, Iran (Islamic Republic of ) and Pakistan
• Near and Middle East: Bahrain, Iraq, Israel, Jordan, Kuwait, Lebanon, Oman, Qatar, Saudi Arabia, State of Palestine, Syrian Arab Republic, United Arab Emirates and Yemen
• South Asia: Bangladesh, Bhutan, India, Maldives, Nepal and Sri Lanka
• Eastern Europe: Belarus, Republic of Moldova, Russian Federation and Ukraine
• South-Eastern Europe: Albania, Bosnia and Herzegovina, Bulgaria, Croatia, Montenegro, North Macedonia, Romania, Serbia, Turkey and Kosovo
• Western and Central Europe: Andorra, Austria, Belgium, Cyprus, Czechia, Denmark, Estonia, Finland, France, Germany, Greece, Hungary, Iceland, Ireland, Italy, Latvia, Liechtenstein, Lithuania, Luxembourg, Malta, Monaco, Netherlands, Norway, Poland, Portugal, San Marino, Slovakia, Slovenia, Spain, Sweden, Switzerland, United Kingdom of Great Britain and Northern Ireland, Faroe Islands, Gibraltar and Holy See
Oceania (comprising four subregions): • Australia and New Zealand: Australia and
New Zealand• Polynesia: Cook Islands, Niue, Samoa, Tonga,
Tuvalu, French Polynesia, Tokelau and Wallis and Futuna Islands
• Melanesia: Fiji, Papua New Guinea, Solomon Islands, Vanuatu and New Caledonia
• Micronesia: Kiribati, Marshall Islands, Micronesia (Federated States of ), Nauru, Palau, Guam and Northern Mariana Islands
The World Drug Report uses a number of regional and subregional designations. These are not official designations, and are defined as follows:• East Africa: Burundi, Comoros, Djibouti, Eritrea,
Ethiopia, Kenya, Madagascar, Mauritius, Rwanda, Seychelles, Somalia, South Sudan, Uganda, United Republic of Tanzania and Mayotte
• North Africa: Algeria, Egypt, Libya, Morocco, Sudan and Tunisia
• Southern Africa: Angola, Botswana, Eswatini, Lesotho, Malawi, Mozambique, Namibia, South Africa, Zambia, Zimbabwe and Reunion
• West and Central Africa: Benin, Burkina Faso, Cabo Verde, Cameroon, Central African Republic, Chad, Congo, Côte d’Ivoire, Democratic Republic of the Congo, Equatorial Guinea, Gabon, Gambia, Ghana, Guinea, Guinea-Bissau, Liberia, Mali, Mauritania, Niger, Nigeria, Sao Tome and Principe, Senegal, Sierra Leone, Togo and Saint Helena
• Caribbean: Antigua and Barbuda, Bahamas, Barbados, Cuba, Dominica, Dominican Republic, Grenada, Haiti, Jamaica, Saint Kitts and Nevis, Saint Lucia, Saint Vincent and the Grenadines, Trinidad and Tobago, Anguilla, Aruba, Bonaire, Netherlands, British Virgin Islands, Cayman Islands, Curaçao, Guadeloupe, Martinique, Montserrat, Puerto Rico, Saba, Netherlands, Sint Eustatius, Netherlands, Sint Maarten, Turks and Caicos Islands and United States Virgin Islands
• Central America: Belize, Costa Rica, El Salvador, Guatemala, Honduras, Nicaragua and Panama
• North America: Canada, Mexico, United States of America, Bermuda, Greenland and Saint-Pierre and Miquelon
• South America: Argentina, Bolivia (Plurinational State of ), Brazil, Chile, Colombia, Ecuador, Guyana, Paraguay, Peru, Suriname, Uruguay, Venezuela (Bolivarian Republic of ) and Falkland Islands (Malvinas)
• Central Asia and Transcaucasia: Armenia, Azerbaijan, Georgia, Kazakhstan, Kyrgyzstan, Tajikistan, Turkmenistan and Uzbekistan

The World Drug Report 2019 is again presented in five separate parts that divide the wealth of information and analysis contained in the report into individual reader-friendly booklets in which drugs are grouped by their psychopharmacological effect for the first time in the report’s history.
Booklet 1 provides a summary of the four subsequent booklets by reviewing their key findings and highlighting policy implications based on their conclusions. Booklet 2 contains a global overview of the latest estimates of and trends in the supply, use and health consequences of drugs. Booklet 3 looks at recent trends in the market for depressants (including opioids, sedatives, tranquillizers and hypnotics), while Booklet 4 deals with recent trends in the market for stimulants (including cocaine, amphetamine-type stimulants and new psychoactive substances). Booklet 5 contains a review of recent trends in the market for cannabis and for hallucinogens. The section on cannabis also includes a review of the latest developments in the jurisdictions that have adopted measures allowing the non-medical use of cannabis.
As in previous years, the World Drug Report 2019 is aimed at improving the understanding of the world drug problem and contributing towards fostering greater international cooperation for countering its impact on health, governance and security.
The statistical annex is published on the UNODC website: https://www.unodc.org/wdr2019
ISBN 978-92-1-148314-7
ResearchVienna International Centre, PO Box 500, 1400 Vienna, AustriaTel: +(43) (1) 26060-0, Fax: +(43) (1) 26060-5866, www.unodc.org
1EXECUTIVE SUMMARYConclusions and policy implications
2019