exchange rate misalignment in oil exporting countries ... · iran. econ. rev. vol. 20, no. 2, 2016....
TRANSCRIPT

Iran. Econ. Rev. Vol. 20, No. 2, 2016. pp. 261-276
Exchange Rate Misalignment in Oil Exporting
Countries (OPEC): Focusing on Iran
Amir H. Mozayani*1
Sanaz Parvizi2
Received: 2016/05/21 Accepted: 2016/06/21
Abstract n this paper, we investigate the existence and the nature of real
exchange rate misalignment in Organization of the Petroleum
Exporting Countries (OPEC). To do this we estimated a cross country
basic real exchange rate determination model for 1990-2012 and
extracted historic trend of misalignment. The results imply that all
OPEC countries have had misalignment -of different kinds though- in
their real exchange rate. In order to ensure the robustness of results, we
also focused on historic trend of real exchange rate misalignment in
Iran, which was derived by model, and observed considerable
consistency with realities of policy making and economic performances
in Iran. This indicated the compatibility of the estimation results with
countries’ actual events.
Keywords: Misalignment, Real Exchange Rate, OPEC Countries, Iran,
Oil.
JEL Classification: O24, F31, O57.
1. Introduction
Since the exchange rate links the national economy to the world economy, it is
obvious that any country often tries to achieve an equilibrium level of
exchange rate or to manage it in a desired band based on its objectives and
preferences. Accordingly, well-known views on international macroeconomics
express that an equilibrium exchange rate can help authorities to manage
current and capital account, domestic inflation, national competitiveness and
allocation of resources. Otherwise, a misaligned exchange rate may lead to
distortion in balance of payment, relative prices, competitiveness and etc.
Behaviors of countries’ foreign exchange markets, especially those of
1. Assistant Professor, Department of Economics, Tarbiat Modares University, Tehran, Iran.
(Corresponding Author: [email protected]). 2. Department of Economics, Tarbiat Modares University, Tehran, Iran.
I

262/ Exchange Rate Misalignment in Oil Exporting Countries (OPEC) …
developing countries, imply the considerable deviation from equilibrium
level of the exchange rate. It seems that economic authorities have
acknowledged the disadvantages of misaligned exchange rate in favor of
their national preferences. In other words, they are used to manipulate their
exchange rate or manage it in certain intervals in order to meet their
domestic economic needs. As if they are facing a tradeoff between
advantages and disadvantages of disequilibrium exchange rate. For instance,
some countries set their exchange rate undervalued to stimulate their current
account. This phenomenon is known as “Currency War” and has been
recently intensified within the international trade relations. On the other
hand, some countries set their exchange rate overvalued to prevent the
penetration of global inflation into their domestic economies. This
phenomenon (overvaluation) is usually observed in oil exporting countries
which are highly relying on their exogenous oil revenues. Apparently, the
substantial amount of crude oil revenues and hence considerable foreign
exchange reserves has enabled them to stabilize their nominal exchange rate
in a certain band and in an overvalued condition.
During last decades, a number of studies have attempted to estimate the
equilibrium exchange rate or the deviation from that rate in different
countries. For instance, Buchs (2005) showed that the exchange rate in
Brazil has been slightly overvalued; or Su, Tsangyao, & Chang (2011) stated
that Purchasing Power Parity (PPP) is valid only for some Latin American
countries, whereas the majority of the exchange rates in these countries do
not follow an equilibrium rule (Giannellis & Koukouritakis, 2013, P. 202).
Similarly, some other researchers such as Aflouk, Jeang, & Saadaoui (2010),
Vieira and MacDonald (2012) tried to quantify the absolute value of
misalignment, in order to understand the nature or historic trend of
countries’ misalignment.
Review of literature implies frequent studies which calculated exchange
rate misalignment in (groups of) countries. Nevertheless, such studies are
rarely found for oil exporting countries. However, these countries due to
their intrinsic characteristics such as: stabilized foreign exchange regimes,
reliance on oil revenues, possession of great amount of foreign reserves can
be good cases for study (Dike, 2014 & 2015).
Based on the above mentioned grounds, the main aim of this paper is to
provide a quantitative assessment about nature and historic trend of
misalignment in foreign exchange markets of oil exporting countries
(OPEC1). Subsequently, to have a robust and sensible analysis of our results,
1. Algeria, Angola, Ecuador, Iran, Iraq, Kuwait, Libya, Nigeria, Qatar, Saudi Arabia, United
Arab Emirates and Venezuela. We excluded Iraq due to lack of data.

Iran. Econ. Rev. Vol. 20, No. 2, 2016 /263
we will focus particularly on Iran which has undergone great fluctuations in
its foreign exchange market; these include such cases as implementing two
separate unification policies in 1993 and 2002, being affected by global
society sanctions and etc. In so doing, we estimate a cross country basic real
exchange rate1 determination model for 1990-2012 in order to extract
countries’ misalignment.
The rest of the paper is organized as follows: Section 2 presents
misalignment review of literature while section 3 reports the data and
estimation. Section 4 illustrates the empirical evidence for Iran (as one of the
OPEC countries) and in the final section conclusion of this study is
presented.
2. Review of Literature
2.1 Empirical Background
Since the adoption of floating exchange rate regime in 1970s, investigating
the equilibrium exchange rate and its deviation have been subjects of
empirical studies. Review of literature implies that these studies can be
classified to two main categories. The first category includes those studies
focusing on equilibrium exchange rate and its influencing factors or the
relevant causal relations; among these studies, one may refer to Iimi (2006),
Wang, Hui & Soofi (2007), Musyoki, Pokhariyal & Pundo (2012), Baak
(2012) & Palamalai et al. (2014) taking as their subject the equilibrium level
of exchange rate in Botswana, china, Kenya, South Korea and India. The
second category consists in that group of studies which deal directly with
misalignment; this category can be subdivided into three separate branches.
The first branch includes studies which have tried to calculate and analyze
misalignment within a single country; some instances are Dagdeviren,
Binatli and Sohrabji (2012), Panday (2014), Mozayani & Ghornani (2015)
who did so for Turkey, Nepal and Iran, respectively. The second branch
consists in studies which have tried to study this phenomenon in a cross
country scope. These include studies such as: Sallenave (2010), Grossmann
& Olrov (2012), Holtemoller & Mallick (2012), Gnimassoun & Mignon
(2015), Nouira & Sekkat (2015). In the third branch including Salvatore
(2012), Wong Hoch (2011), Ghosh (2013), the nature, causes and
consequences of misalignment have been discussed. The implications of
literature review can be summarized as follows:
- Huge real exchange rate misalignments are mostly observed in
developing countries rather than in developed ones.
1. By choosing real exchange rate, besides the nominal exchange rate, we try to capture the
relative price level of countries as well.
264/ Exchange Rate Misalignment in Oil Exporting Countries (OPEC) …
- By implementing foreign exchange reforms, most countries would be
able to narrow down their misalignment.
- In most cases, exchange rate crisis leads to an undervalued exchange
rate misalignment.
- Exchange rate misalignments negatively affect the economic growth
and the export.
- Countries’ exchange rate regimes have had significant impact on the
nature of misalignment (the higher flexibility of the regime, the lower
misalignment).
- There is no distinct study engaging directly in exchange rate
misalignment in OPEC countries.
2.2 Theoretical Arguments
Review of international finance theories involves a variety of approaches
about determinant factors of exchange rate. Hoontrakul (1999) classified
them to two main approaches as follows:
A- Traditional Approaches:
I. Elasticity Approach (Marshall 1923, Lerner,1944)
II. Purchasing Power Parity (PPP)
III. Absorption approach (Alexander 1952)
B- Modern Asset Approaches:
I. Portfolio - Balance Approaches:
i. Small Country Model, (Kouri,1978)
ii. Preferred Local Habital Model (Kouri and De Macedo, 1978)
iii. Uniform Preference Model (Frankel, 1993)
II. Monetary Approaches:
i. Mundell– Fleming Model (1963,1962)
ii. Political Economy Model (Gartner,1993)
iii. Exchange Rate Bubble (Gartner,1993)
iv. Overshooting Model (Dornbusch,1976)
Since exchange rate determination models mostly focus on a specific
approach for nominal exchange rate, we employed a hybrid model in this
study for determining factors which influence the real exchange rate; this
model is proposed by Chen & Chou (2015), Coulibaly & Gnimassoun
(2013), Couharde et al. (2012) which is inspired from Edwards (1988),
Baffes et al. (1999). They derived relevant determinants of the real exchange
rate for developing economies which were properly summarized by
Coulibaly & Gnimassoun (2013) as follows:
A. Relative Productivity Differentials (PRO): Based on the Balassa–
Samuelson effect, a positive productivity shock in the tradable good sector

Iran. Econ. Rev. Vol. 20, No. 2, 2016 /265
relative to the non-tradable good sector leads to a wage increase in the
former sector; and thus the moving of the workforce towards this sector.
Thus, the real exchange rate appreciates through price increase in sheltered
sectors since their demands exceed their supplies. The impact on the
equilibrium real exchange is then expected to be positive (Coulibaly &
Gnimassoun, 2013, 466-67).
B. Terms of Trade (TOT): This factor is measured by the ratio of export
prices to import prices. The improvement of the terms of trade leads to an
increased production of tradable goods and a reallocation of resources in
favor of those sectors. Consequently, the trade balance will be improved
through rising exports leading to an appreciation of the equilibrium real
exchange rate. At the same time, this process may be accompanied by a
substitution between local products—which become more expensive—and
imported products, leading therefore to a depreciation of the real exchange
rate. Consequently, the impact of the terms-of-trade variable is undefined
and depends on the income and substitution effects' magnitude. However,
empirical works generally suggest that the income effect dominates the
substitution one (Coulibaly & Gnimassoun, 2013, 467).
C. Net Foreign Asset Position (NFA): Basic macroeconomic models
predict that debtor countries will need more depreciation of real exchange
rate in order to generate the trade surpluses necessary to pay their external
liabilities (Lee et al., 2008). Similarly, when countries have relatively high
net foreign assets, they can “afford” a higher appreciation of their real
exchange rate while remaining solvent even if it is likely to generate current
account deficits. So, the expected effect is positive (Coulibaly &
Gnimassoun, 2013, 467).
D. Oil Revenues (OR): Basic Theories consider trade openness as of the
determinant factors of real exchange rate. If the current account deteriorates,
the real exchange rate should depreciate to restore external equilibrium. On
the contrary, the equilibrium exchange rate will appreciate when the
reduction of tariff leads to a current account improvement. So the response
of the real exchange rate is ambiguous and depends on the impact of
openness on the current account. But the empirical literature generally found
a negative impact (Coulibaly & Gnimassoun, 2013, 467). But as long as oil
export revenue, as exogenous variable, has prevailing role in OPEC
members trade balance, most studies considered oil revenue as proxy for
trade openness in real exchange rate determinant models (MacDonald, 1997)
and (Asgharpour et al.,2015). Real increase in oil revenue can improve real
exchange rate in oil exporting countries (Amano & Norden, 1998).
E. Government Spending (GOV): If public expenditures are mainly

266/ Exchange Rate Misalignment in Oil Exporting Countries (OPEC) …
composed of tradable goods, their increase will lead to the depreciation of
the real equilibrium exchange rate. However, it is usually assumed that
government spending in developing countries is mainly composed of non-
tradable goods. In this case, the increase of public spending leads to a rise in
internal prices, which generates the appreciation of the real equilibrium
exchange rate. The impact of this variable on the real exchange rate must
then be positive (Coulibaly & Gnimassoun, 2013, 467).
Thus, the real exchange rate (RER) can be considered as a function of the
following variables stated by mainstream studies such Edwards (1988),
Montiel (1999), Terra & Valladares (2010), Schröder (2013), (MacDonald,
1997) and (Asgharpour et al.,2015).
RER = α0 + α1. PRO + α2. TOT + α3. NFA + α4. OR + α5. GOV (1)
Equation 1 is the basic stylized model which expresses real exchange rate
determinant factors and can be applied for estimation.
3. Data and Estimation
Our study covers a panel of 11 OPEC countries pending on the availability
of data for 1990-2012. Our methodology has two main steps for recognizing
misalignment in real exchange rate in OPEC countries. The first step is to
estimate our basic stylized model (eq.1) including main determinant factors
of real exchange rate in order to derive residual for each country. The second
step is to extract countries’ misalignment values in the way that Holtemöller
& Mallick (2012), Terra & Valladares (2010), Dubas (2009), Kemme & Roy
(2006) have done it. They considered misalignment as the difference
between observed RER and its predicted value. They believed that the
residual of basic stylized model estimation can be considered as
misalignment. Positive misalignment implies undervaluation and negative
misalignment implies overvaluation. Our variables for estimation are:
- Real Exchange Rate (RER): Ratio of the domestic CPI to United States
CPI (as world proxy)1 multiplied by nominal exchange rate (Source:
WDI).
- Productivity Differentials (PRO): Labor Productivity as proxy,
measured as GDP per Person Employed (Source: Conference board
Org2).
- Terms of Trade (TOT): Unit Value of Exports divided by Unit Value of
Imports indices (Source: UNCTAD).
- Net foreign asset (NFA): Sum of foreign assets held by monetary
1. Bahmani-Oskooee and Kara (2000) 2. https://www.conference-board.org/data/ economydatabase.

Iran. Econ. Rev. Vol. 20, No. 2, 2016 /267
authorities and deposit money banks, less their foreign liabilities to
GDP (Source: WDI).
- Oil Revenue (OR): Real value of oil exporting revenues (Source:
UNCTAD).
- Government spending (GOV): Government consumption as a percent of
GDP (Source: UNCTAD).
Before estimating Eq. (1), we have to make sure stationary of variables.
We rely on most frequently used panel unit root tests (LLC ،ADF-Fisher ،
pp-Fisher). The results are reported in table 1. As can be seen, the null
hypothesis of variables for having unit root at 5% is rejected. It means that
all variables are stationary and thus there is no need for cointegration tests.
Then we apply F & Hausman test in order to understand basic model
estimation condition. The results (table 2) show that the proper option for
estimation is panel & fixed effects form. The results of estimation are
reported in table 3. Table 3 demonstrates that all considered explanatory
variables are significant at conventional levels and have expected signs
highlighting the relevance of the theoretical model and the estimators
(Coulibaly & Gnimassoun, 2013, 468).
Table 1: Unit Root Tests Results
Variable(s) Levin, Lin & Chu ADF - Fisher Chi-square PP - Fisher Chi-square
Statistic Prob Statistic Prob Statistic Prob
lnRER lnTOT lnNFA lnGOV lnPRO LnOR
-2.44 0.007 -4.002 0.0000 -32.44 0.0000 -3.93 0.0000 -3.81 0.0001 -10.69 0.0000
35.79 0.03 45.07 0.002 287.30 0.0000 48.75 0.0000 58.32 0.0000 149.19 0.0000
41.29 0.007 60.94 0.0000 290.10 0.0000 42.70 0.005 48.23 0.001 230.39 0.0000
- “Ln” denotes Neperian Logarithm of variables.
Table 2: F & Hausman Test Results
Statistic Prob Effects Test: Cross-section F 1021.5984 0.0000
Hausman Test: Cross-section random 16.5047 0.0055
Table 3: Estimation Results
Variable Coefficient t-Statistic Prob
lnPRO lnTOT lnOR
lnNFA lnGOV
C
0.65 0.36 0.59 0.01 0.38 2.31
11.25 11.39 21.38 4.44
11.69 3.53
0.0000 0.0000 0.0000 0.0000 0.0000 0.0005

268/ Exchange Rate Misalignment in Oil Exporting Countries (OPEC) …
As predicted in theoretical macroeconomic models, the net foreign asset
& productivity position have positive and significant impacts on the real
exchange rate. The positive relationship between the terms of trade and real
exchange rate indicates that the income effect outweighs the substitution
effect. The government spending has also a positive effect on the real
exchange rate confirming that in these countries, government spending is
mainly composed of non-tradable goods (Coulibaly & Gnimassoun, 2013,
468). Finally Oil Revenue has positive impact on improving real exchange
rate as predicted theoretically. With regard to the basic estimated model and
according to residuals for each country, misalignment values can be derived
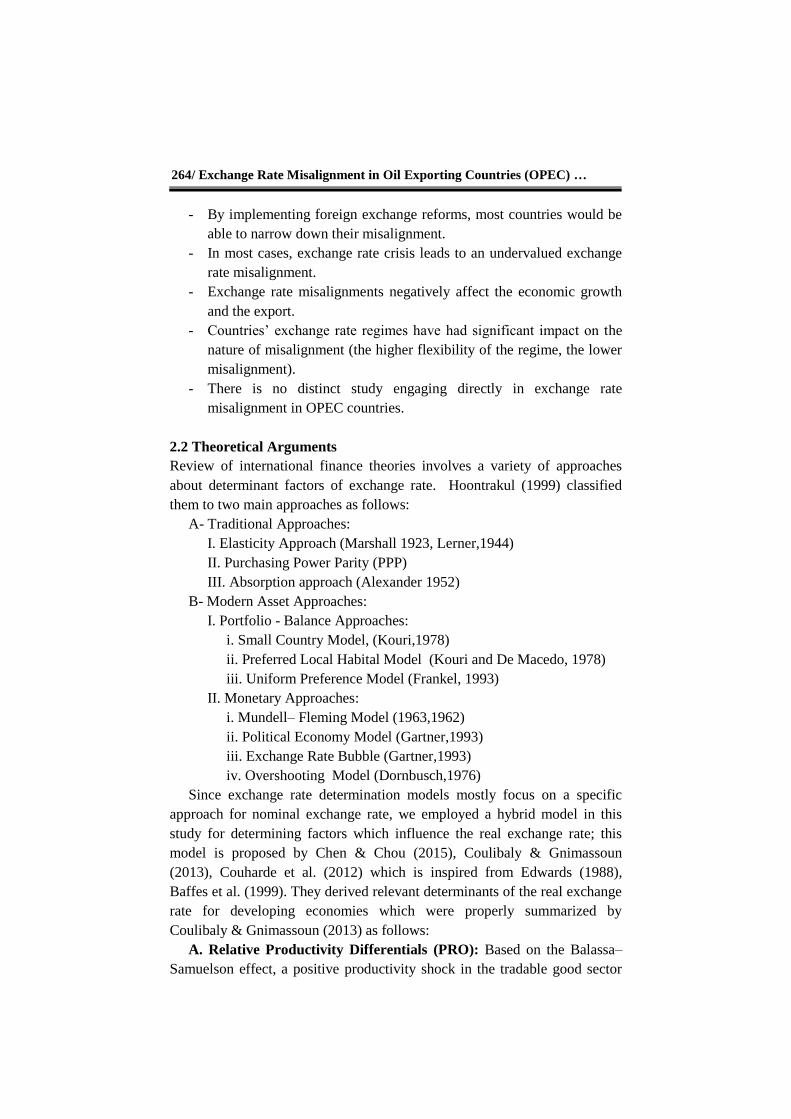
separately. Figure 1, 2 show relative situation of real exchange rate
misalignments in OPEC countries. Our results confirm the presence – of
course of different kinds- of exchange rate misalignments in all OPEC
countries. Figure 1 shows that misalignment in United Arab Emirates,
Kuwait, Qatar, Angola and Iran fluctuated from positive (undervalued) to
negative (overvalued) amount and vice versa. The direction of misalignment
in Algeria and Libya changed from negative to positive position. Meanwhile
the misalignment in Ecuador and Venezuela has changed from positive to
negative position. Also the absolute fluctuation of misalignment in Saudi
Arabia, United Arab Emirates, Qatar and Angola were considerable and
Kuwait has had minimum deviation real exchange rate among OPEC
countries during 1992-2012.
In the following section, for ensuring the robustness of our research
through matching the results with actual economic fluctuations of countries,
we do a case study on Iran in which the foreign exchange events in this
country during the period of study are analyzed.
Iran. Econ. Rev. Vol. 20, No. 2, 2016 /269
Fig. 1: Real Exchange Rate Misalignment in OPEC Countries
Note: Positive Misalignment implies Undervaluation
Negative Misalignment implies Overvaluation
4. Empirical Evidence for Iran
Since the beginning of 1980s, Iranian authorities have implemented
controversial foreign exchange policies. They have been moving between
different exchange rate regimes (Sanginabadi & Heidari, 2012). The heavy state
control which was in operation till the beginning of 1990s and had given rise to
a very active and dynamic black market was gradually replaced by the so called
‘unification’ policies with clear targets to reduce and eventually eliminate the
significant black market premium of the exchange rate and to stabilize the
Rial/US$ (Molana & Mozayani, 2006, 321). The first unification policy which
was implemented over the 1993-1995 period failed and had to be abandoned
(Molana & Mozayani, 2006). In the post-unification period, Iranian authorities
tried to control foreign currency demand by applying multiple exchange rates
and stabilized nominal official exchange rate and subsequently tried to converge
to an equilibrium rate for the second unification policy which started since 2002
and continued successfully till 2011 when Iranian authorities, due to
strengthening of international sanctions, had to leave unified system and
implemented a seriously state control regime in foreign exchange market.
270/ Exchange Rate Misalignment in Oil Exporting Countries (OPEC) …
During 2002-10, authorities via a highly managed exchange rate regime
tried to stabilize the nominal exchange rate, despite of the great increase in
money supply and the consequent persistent double digit inflation rate
(Fig.3). The official statistics imply that during 2001-2010 period, although
currency volume and CPI grew up by %986 and %292, nominal exchange
rate was allowed to be depreciated only by %30; this led to great over-
valuation in foreign exchange market especially after 2006 when this
phenomenon was coincided by the jump in global oil price and consequently
great increase in Iran substantial crude oil export revenues. It seems that
gaining great amount of foreign reserves exogenously enabled Iranian
authorities to afford highly managed (and almost fixed) nominal exchange
rate regime by injecting considerable amount of foreign reserves to the
market. Some studies suggested that the nominal exchange rate1 at the end of
2010 had been 0.53% over-valued (misaligned) compared to its equilibrium
rate (Mozayani & Ghorbani, 2015). It seems that during 2006-2010, the
nominal exchange rate in Iran had been stabilized artificially, counter to
other macroeconomic fundamentals. This is due to the approach of Iranian
authorities which have had a strong preference toward maintaining stable
nominal exchange rate.
But by the beginning of 2011, due to great restrictions caused by
international sanctions, especially in earning and transmission of foreign
reserves, the authorities could no longer continue the nominal exchange rate
management policy and exchange rate overshoot beyond its equilibrium
level and consequently unified exchange rate system was abandoned once
more by imposing great restrictions on domestic foreign currency market.
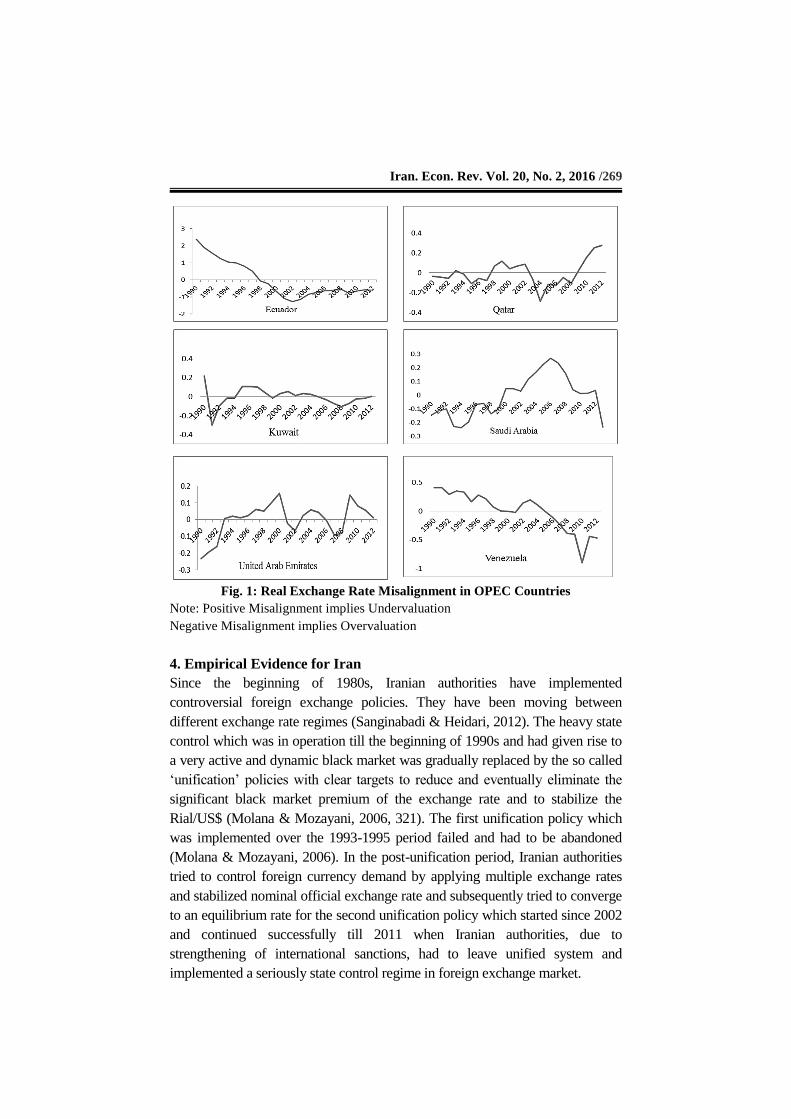
Fig. 2: Real Exchange Rate Misalignment in Iran
1. Nominal Exchange Rate: Number of Iran’s national currency (Rial) per each US dollar.

Iran. Econ. Rev. Vol. 20, No. 2, 2016 /271
Fig. 3: Relative inflation in Iran
The interpretation of the above-mentioned events can be observed in Iran
misalignment trend depicted in figure 2. This figure can be explained as follows:
- 1990-95: Undervaluation of real exchange rate due to great speculative
demand and highly active black market which was eliminated by spastic
policies after failure of the first unification policy during 1993-5.
- 1996-99: Abandoning unification policy and controlling foreign
currency demand and consequently imposing a mild overvaluation to
foreign exchange market through multiple exchange rate system.
- 2000-06: Converging multiple rates and starting the second unification
policy (2002) and proper performance of unification policy in order to
minimize misalignment.
- 2007-2011: Emergence of the new government and lavish injection of
foreign reserves into the market in order to stabilize nominal exchange
rate despite of growing double-digit inflation rate which led to
overvalued real exchange rate.
- 2012: Intensification of international sanctions and inability of
government to stabilize nominal exchange rate anymore and the
consequent depreciation of nominal exchange rate and the gradual
elimination of real exchange rate overvaluation.
5. Conclusion
Behaviors of countries in their foreign exchange markets imply the existence
of considerable deviation from the equilibrium level of the exchange rate,
known as misalignment, especially in developing countries. During the last
decades, a number of studies attempted to estimate the equilibrium level of
exchange rate or the deviation of exchange rate from the equilibrium level,
which can lead to distortion in balance of payment, relative prices,
competitiveness and etc.
The main target of this paper was the investigation of nature and historic
Iran Consumerprice index (2010=100) United States Consumer price index (2010=100)

272/ Exchange Rate Misalignment in Oil Exporting Countries (OPEC) …
trend of misalignment within foreign exchange markets of oil exporting
countries (OPEC). Thus, we estimated a cross country basic real exchange rate
determination model for 1990-2012 and extracted countries’ misalignment. To
sum up, our results showed the presence of real exchange rate misalignments in
all OPEC countries, but in different styles. Subsequently, in order to make sure
to have robust and sensible results, we focused on Iran economic performance,
which has experienced great fluctuations in its foreign exchange market, as case
study. We discussed that historic trend of misalignment in Iran can be perfectly
explained by its foreign exchange market fluctuations such as: implementing
two unification policies, being affected by international sanctions and etc.
References
Aflouk, N., Jeang, S., Mazier, J., & Saadaoui, J. (2010). Exchange Rate
Misalignments and International Imbalances: A FEER Approach for
Emerging Countries. International Economics, 124, 31–74.
Alexander, S. (1952). The Effect of Devaluation on a Trade Balance. IMF
Staff Paper, Retrieved from http://www.jstor.org/stable/3866218.
Amano, R. A., & Norden, S. V. (1998). Oil Prices and the Rise and Fall of the
US Real Exchange Rate. Journal of International Money and Finance, 17, 299–
316.
Asgharpour, H., Mehdilou, A., & Esmaili, S. M. (2015). Determinants of
Real Effective Exchange Rate in Iran using Fuzzy Regression. Quarterly
Journal of Applied Theories of Economics, 1(3), 25-56.
Baak, S. J. (2012). Measuring Misalignments in the Korean Exchange Rate.
Japan and the Word Economy, 24(4), 227-234.
Baffes, J., Elbadawi, I., & O'Connell, S. (1999). Single-Equation Estimation
of the Equilibrium Real Exchange Rate. Retrieved from
https://www.researchgate.net/profile/John_Baffes/publication/23548884_Sin
gleEquation_Estimation_of_the_Equilibrium_Real_Exchange_Rate/links/0d
eec5331aa5120a2f000000.pdf.
Bahmani-Oskooee, M., & Kara, O. (2000). Exchange Rate Overshooting in
Turkey. Economics Letters, 68, 83-93.
Buchs, T. (2005). Equilibrium Real Exchange Rate in Brazil Estimation and
Policy Implications. 9th Meeting of the Latin American and Caribbean
Economic Association (LACEA) Conference, San José (Costa Rica), Spain.
Retrieved from http://econwpa.repec.org/eps/it/papers/0502/0502013.pdf.

Iran. Econ. Rev. Vol. 20, No. 2, 2016 /273
Chen, Sh., & Chou, Y. (2015). Revisiting the Relationship between Exchange
Rates and Fundamentals. Journal of Macroeconomics, 46, 1–22.
Couharde, C., Coulibaly, I., & Damette, O. (2012). La dynamique
d'ajustement des taux de change réels dans la zone franc CFA. Revue
Economique, 63 (3), 545–555.
Coulibaly, I., & Gnimassoun, B. (2013). Optimality of a Monetary Union:
New Evidence from Exchange Rate Misalignments in West Africa.
Economic Modeling, 32, 463–482.
Dagdeviren, S., Binatli, A. O., & Sohrabji, N. (2012). Misalignment under
Different Exchange Rate Regimes: The Case of Turkey. International
Economics, 130, 81-98.
Dike, V. E. (2015). Why Nations Fail to Develop: The Case of Nigeria.
SAGE Open, October-December: 1-12, DOI: 10.1177/2158244015611714.
--------------. (2014). Leadership and the Nigerian Economy. SAGE Open,
January-March: 1-10, DOI: 10.1177/2158244014523792.
Dornbusch, R. (1976). Expectation and Exchange Rate Dynamic. Journal of
Political Economy, 84 (6), 1161-1176.
Dubas, J. M. (2009). The Importance of the Exchange Rate Regime in
Limiting Misalignment. World Development, 37(10), 1612–1622.
Edwards, S. (1988). Real and Monetary Determinants of Real Exchange
Rate Behavior: Theory and Evidence from Developing Countries. Journal of
Development Economics, 29, 311-341.
Fleming, J. M. (1962). Domestic Financial Policies under Fixed and under
Floating Exchange Rate. Staff Papers (International Monetary Fund), 9 (3),
369-380.
Frankel, J. (1993). Monetary and Portfolio-Balance Models of Exchange
Rate Determination. Cambridge: MIT Press.
Gartner, M. (1993). Macroeconomics under Flexible Exchange Rates.
Manchester: Harvester Wheatsheaf Publication.
Ghosh, A. (2013). Exchange Rate Pass through, Macro Fundamentals and
Regime Choice in Latin America. Journal of Macroeconomics, 35, 163–171.

274/ Exchange Rate Misalignment in Oil Exporting Countries (OPEC) …
Giannellis, N., & Koukouritakis, M. (2013). Exchange Rate Misalignment
and Inflation Rate Persistence: Evidence from Latin American Countries.
International Review of Economics and Finance, 25, 202–218.
Gnimassoun, B. & Mignon, V. (2015). Persistence of Current-account
Disequilibria and Real Exchange-rate Misalignments. Review of
International Economics, 23(1), 137–159.
Grossmann, A., & Olarv, A. G. (2012). Exchange Rate Misalignments in
Frequency Domain. International Review of the Economics & Finance, 24, 185-
199.
Holtemöller, O., & Mallick, S. (2012). Exchange Rate Regime, Real
Misalignment and Currency Crises. Economic Modeling, 34, 5–14.
Hoontrakul, P. (1999). Exchange Rate Theory: A Review. Chulalongkorn
University Discussion Paper, Retrieved from
http://www.ibrarian.net/navon/paper/_Exchange_Rate_Theory___A_Review
_.pdf?paperid=351764.
Iimi, A. (2006). Exchange Rate Misalignment: An Application of the
Behavioral Equilibrium Exchange Rate (BEER) to Botswana. IMF Working
Paper, Retrieved from
https://www.imf.org/external/pubs/ft/wp/2006/wp06140.pdf.
Kemme, D. M., & Roy, S. (2006). Real Exchange Rate to Crisis? Economic
Systems, 30, 207- 230.
Kouri, P. J. K., & de Macedom, J. B. (1978). Exchange Rates and the
International Adjustment Process. Brookings Papers on Economic Activity,
1978 (1), 111-157.
Kouri, P. (1978). The Exchange Rate and the Balance of Payments in the
Short Run and in the Long Run: a Monetary Approach. Scandinavian
Journal of Economics, 78 (2), 280-304.
Lee, J., Milesi-Ferretti, G., Ostry, J., Prati, A., & Ricci, L. (2008). Exchange
Rate Assessments: CGER methodologies. IMF Occasional Paper, 261,
Retrieved from https://www.imf.org/external/pubs/nft/op/261/op261.pdf.
Lerner, A. P. (1944). The Economics of Control: Principles of Welfare
Economics. New York: The Macmillan Company.
Marshall, A. (1923). Money Credit and Commerce. London: Macmillan & Co. Ltd.

Iran. Econ. Rev. Vol. 20, No. 2, 2016 /275
MacDonald, R. (1997). What Determine Real Exchange Rates? The Long
and Short of It. IMF Working Paper, 21, Retrieved from
http://www.imf.org/external/pubs/ft/wp/wp9721.pdf.
Molana, H., & Mozayani, A. H. (2006). Is Monetary Discipline a
Precondition for the Effectiveness of Iran’s Export Promotion Policies.
Journal of International Development, 18, 319–330.
Montiel, P. (1999). Determinants of the Long-Run Equilibrium Real
Exchange Rate: an Analytical Model. Hinkle, L., Montiel, P. (Eds.),
Exchange Rate Misalignment: Concepts and Measurement for Developing
Countries. Oxford: Oxford University Press.
Mozayani, A. H., & Ghorbani, S. (2015). Nominal Exchange Rate
Misalignment in Iran’s economy. Majles & Rahbord, 22(82), 199-233.
Mundell, R. A. (1963). Capital Mobility and Stabilization Policy under
Fixed and Flexible Exchange Rate. Canadian Journal of Economics and
Political Science, 29, 4, 475-485.
Musyoki, D., Pokhariyal, G., & Pundo, M. (2012). Real Exchange Rate
Equilibrium and Misalignment in Kenya. Journal of Business Studies
Quarterly, 3(4), 24-42.
Nouira, R., & Sekkat. Kh. (2015). What Determines the Extent of Real
Exchange Rate Misalignment in Developing Countries? International
Economics, 141, 135–151.
Palamalai, S., Mariappan, K., & Devakumar, C. (2014). On the Temporal
Causal Relationship between Macroeconomic Variables: Empirical Evidence
from India. SAGE Open, 4 (1), 1-14.
Panday, A. (2014). Exchange Rate Misalignment in Nepal. Journal of South
Asian Development, 9(1), 1–25.
Sallenave, A. (2010). Real Exchange Rate Misalignments and Economic
Performance for the G20 Countries. International Economics, 121, 59–80.
Salvatore, D. (2012). Exchange Rate Misalignments and the Resent
International Monetary System. Journal of Policy Modeling, 34(4), 594-640.
Sanginabadi, B., & Heidari, H. (2012). The Effects of Exchange Rate
Volatility on Economic Growth of Iran. Actual Problems of Economics, 6,
430-441.

276/ Exchange Rate Misalignment in Oil Exporting Countries (OPEC) …
Schröder, M. (2013). Should Developing Countries Undervalue their
Currencies? Journal of Development Economics, 105, 140–151.
Su, C. W., Tsangyao, C., & Chang, H. L. (2011). Purchasing Power Parity
for Fifteen Latin American Countries: Stationary Tests with a Fourier
Function. International Review of Economics and Finance, 20, 839–845.
Terra, C., & Valladares, F. (2010). Real Exchange Rate Misalignments.
International Review of Economics and Finance, 19, 119–144.
Vieira, F. V., & MacDonald, R. (2012). A Panel Data Investigation of Real
Exchange Rate Misalignment and Growth. Econ., 42(3), 433-456.
Wang, Y., Hui, X. & Soofi, A. (2007). Estimating Renminbi Equilibrium
Exchange Rate. Journal of Policy Modeling, 29(3), 417–429.
Wong Hoch, T. (2011). The Real Exchange Rate Determination: An
Empirical Investigation. International Review of Economics & Finance, 20
(4), 800–811.