8.1 geopolitics of oil and gas exporting countries
TRANSCRIPT
The geopolitics of oil and gas exporting countriesis fundamentally related to the money flows, whichoriginate from the production and trade of thesenatural resources. This wealth is shared between allthe participants in the industry: nationalgovernments, state agencies, political parties,state-owned companies, and national orinternational private companies. Therefore, part ofit is returned to citizens through different types ofpublic expenditure, such as educational orhealthcare services, infrastructure building, thesubsidization of social tariffs for transportation,and water and energy goods.
In this setup, three different issues are relevant.The first one concerns the amount of money whichis generated each year and its evolution over time.The second issue is the appropriation forredistribution of this money and its impact on localeconomies, an impact which is frequentlyassociated with ‘the curse of oil’. Finally, the thirdissue relates to governance systems and the actualfunctioning of political institutions. The geopoliticsof oil and gas exporting countries is at theconfluence between the economics of oil and gasand the political dynamics of each country. Inaddition, each country has to define its ownposition within the international geopolitics of oiland gas (Table 1).
8.1.1 Oil and gas revenues
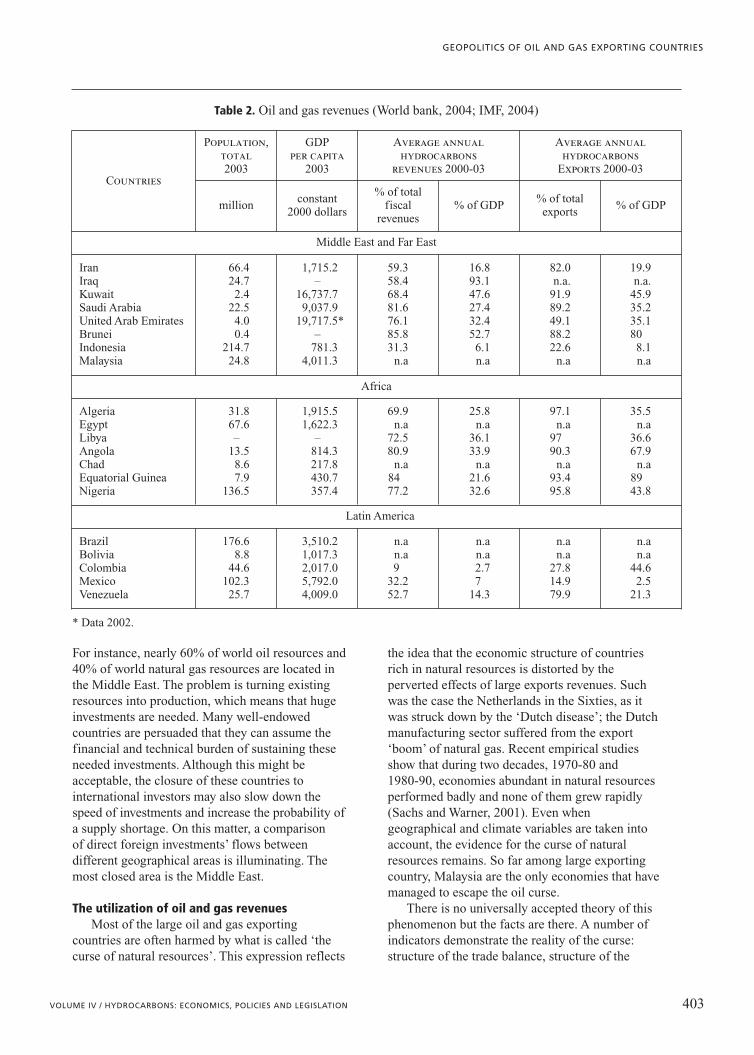
For energy exporting countries, oil and gasrevenues represent, in most cases, a significantshare of their Gross Domestic Product (GDP) andalso of their state fiscal resources. For 11 of the 20surveyed countries, oil and gas export revenuesrepresent more than 17% of their GDP and more
than 58% of their budget resources (Table 2). Withsuch a degree of dependency, it is no wonder thatthe evolution of these revenues over time plays akey role in explaining the economic and politicaldevelopment of these countries. In particular, twoelements have a direct connection with eachcountry’s development dynamic: the price of oil(and gas) and the volume of its exports.
For most countries, the level of oil price and itsvariations are an exogenous factor, although theycan sometimes play some role through theOrganization of Petroleum Exporting Countries(OPEC). Most of the time, the level of world oilprice is far above the average cost of producingcrude oil, which is estimated to be around 7dollars/bbl (worldwide average). The differencebetween the world price of oil and the domesticcost is the basis on which each country receives itsoil rent. In the case of natural gas, the volume ofthe rent is less important than that for oil (on anequivalent energy basis) because the cost of gastransmission is much higher than the cost of oiltransportation (7 to 10 times higher). Moreover, atthe end user stage, gas faces the competition ofmany energy substitutes, while many oil productsenjoy monopoly situations. For governments, thedifficulty in managing oil and gas rents comesfrom the fact that oil and gas prices are volatile. Inaddition, as these commodities are priced indollars, they may hurt the purchasing power of anexporting country that buys abroad in differentcurrencies when the dollar is weak. This was thecase in 2004-05, with the low exchange rate of thedollar versus the euro. Incoming revenues are notpredictable and high revenues may encourageexpenditures at risk.
The volume of exports is less of an exogenouselement. It actually depends on several factors,
401VOLUME IV / HYDROCARBONS: ECONOMICS, POLICIES AND LEGISLATION
8.1
Geopoliticsof oil and gas exporting countries
both discretional and non-discretional. First, thevolume of exports depends on the existingproductive capacity and on the rhythm ofproduction that is decided by governments and/oroil firms, sometimes under the constraints ofOPEC’s quotas. Only part of the actual productionis exported, the rest is used for domesticconsumption. Therefore, in some countries, therapid growth of domestic demand, sustained bydemographic growth, may lead to a problematicdecline in oil and gas exports volumes andrevenues (such as in Indonesia since the 1990s).This question underlines the importance ofdefining a national policy for natural resources,which is a second factor for acting on volumes.
The issue of developing proven reserves andencouraging oil and gas exploration is a questionof pure economic policy. Some countries want tokeep oil and gas development as a domestic
preference, with a nationalistic position aiming tofunnel oil and gas investments to their state-ownedcompanies. Others may concede more or lessliberal entry conditions to international investors.In Latin America, for instance, there is apermanent political debate about the place to begiven to international investors and also about theamount of money to be invested in the oil sector bystate-owned companies. Gas reserves are generallymore open to international investors than oilreserves because delivering gas to the markets ismore complex, and also because gas rent is lowerthan oil rent.
These differences notwithstanding, solving thequestion of a political opening to internationalinvestors remains crucial for the equilibrium ofenergy markets. The amount of resources at stakein this issue is immense. A great deal of thesereserves is located in politically turbulent areas.
402 ENCYCLOPAEDIA OF HYDROCARBONS
PRODUCER-EXPORTER COUNTRIES
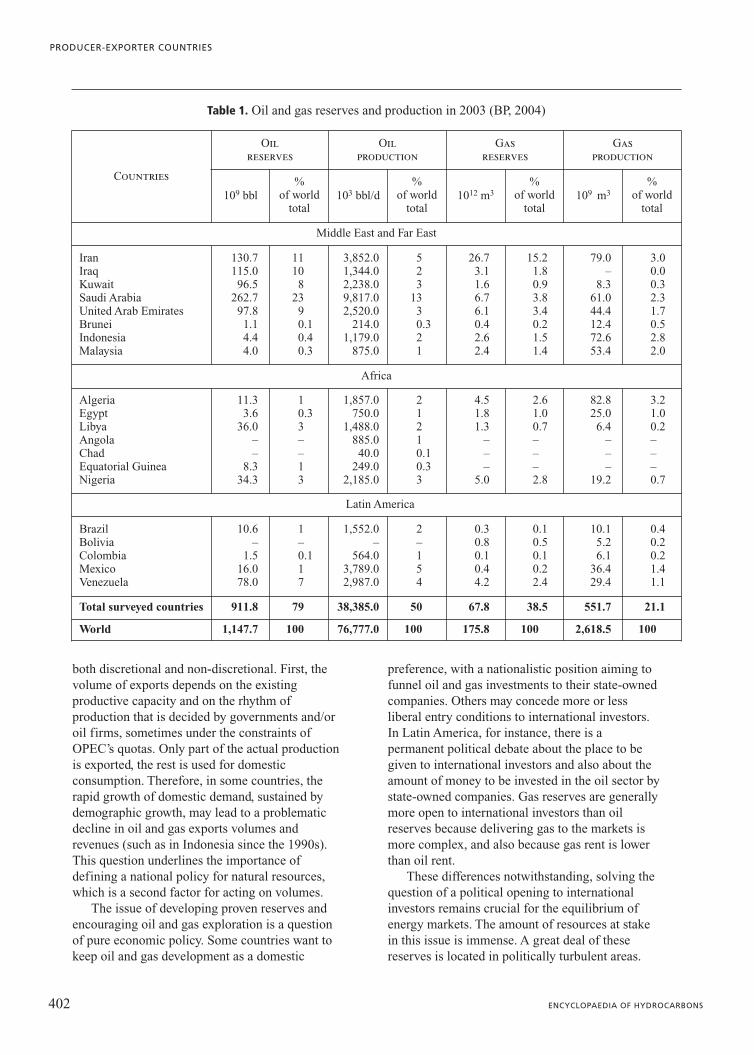
Table 1. Oil and gas reserves and production in 2003 (BP, 2004)
Countries
Oilreserves
Oilproduction
Gasreserves
Gasproduction
109 bbl%
of worldtotal
103 bbl/d%
of worldtotal
1012 m3%
of worldtotal
109 m3%
of worldtotal
Middle East and Far East
Iran 130.7 11 3,852.0 5 26.7 15.2 79.0 3.0Iraq 115.0 10 1,344.0 2 3.1 1.8 – 0.0Kuwait 96.5 8 2,238.0 3 1.6 0.9 8.3 0.3Saudi Arabia 262.7 23 9,817.0 13 6.7 3.8 61.0 2.3United Arab Emirates 97.8 9 2,520.0 3 6.1 3.4 44.4 1.7Brunei 1.1 0.1 214.0 0.3 0.4 0.2 12.4 0.5Indonesia 4.4 0.4 1,179.0 2 2.6 1.5 72.6 2.8Malaysia 4.0 0.3 875.0 1 2.4 1.4 53.4 2.0
Africa
Algeria 11.3 1 1,857.0 2 4.5 2.6 82.8 3.2Egypt 3.6 0.3 750.0 1 1.8 1.0 25.0 1.0Libya 36.0 3 1,488.0 2 1.3 0.7 6.4 0.2Angola – – 885.0 1 – – – –Chad – – 40.0 0.1 – – – –Equatorial Guinea 8.3 1 249.0 0.3 – – – –Nigeria 34.3 3 2,185.0 3 5.0 2.8 19.2 0.7
Latin America
Brazil 10.6 1 1,552.0 2 0.3 0.1 10.1 0.4Bolivia – – – – 0.8 0.5 5.2 0.2Colombia 1.5 0.1 564.0 1 0.1 0.1 6.1 0.2Mexico 16.0 1 3,789.0 5 0.4 0.2 36.4 1.4Venezuela 78.0 7 2,987.0 4 4.2 2.4 29.4 1.1
Total surveyed countries 911.8 79 38,385.0 50 67.8 38.5 551.7 21.1
World 1,147.7 100 76,777.0 100 175.8 100 2,618.5 100
For instance, nearly 60% of world oil resources and40% of world natural gas resources are located inthe Middle East. The problem is turning existingresources into production, which means that hugeinvestments are needed. Many well-endowedcountries are persuaded that they can assume thefinancial and technical burden of sustaining theseneeded investments. Although this might beacceptable, the closure of these countries tointernational investors may also slow down thespeed of investments and increase the probability ofa supply shortage. On this matter, a comparisonof direct foreign investments’ flows betweendifferent geographical areas is illuminating. Themost closed area is the Middle East.
The utilization of oil and gas revenuesMost of the large oil and gas exporting
countries are often harmed by what is called ‘thecurse of natural resources’. This expression reflects
the idea that the economic structure of countriesrich in natural resources is distorted by theperverted effects of large exports revenues. Suchwas the case the Netherlands in the Sixties, as itwas struck down by the ‘Dutch disease’; the Dutchmanufacturing sector suffered from the export‘boom’ of natural gas. Recent empirical studiesshow that during two decades, 1970-80 and1980-90, economies abundant in natural resourcesperformed badly and none of them grew rapidly(Sachs and Warner, 2001). Even whengeographical and climate variables are taken intoaccount, the evidence for the curse of naturalresources remains. So far among large exportingcountry, Malaysia are the only economies that havemanaged to escape the oil curse.
There is no universally accepted theory of thisphenomenon but the facts are there. A number ofindicators demonstrate the reality of the curse:structure of the trade balance, structure of the
403VOLUME IV / HYDROCARBONS: ECONOMICS, POLICIES AND LEGISLATION
GEOPOLITICS OF OIL AND GAS EXPORTING COUNTRIES
Table 2. Oil and gas revenues (World bank, 2004; IMF, 2004)
* Data 2002.
Countries
Population,total2003
GDPper capita
2003
Average annualhydrocarbons
revenues 2000-03
Average annualhydrocarbons
Exports 2000-03
millionconstant
2000 dollars
% of totalfiscal
revenues% of GDP
% of totalexports
% of GDP
Middle East and Far East
Iran 66.4 1,715.2 59.3 16.8 82.0 19.9Iraq 24.7 – 58.4 93.1 n.a. n.a.Kuwait 2.4 16,737.7 68.4 47.6 91.9 45.9Saudi Arabia 22.5 9,037.9 81.6 27.4 89.2 35.2United Arab Emirates 4.0 19,717.5* 76.1 32.4 49.1 35.1Brunei 0.4 – 85.8 52.7 88.2 80Indonesia 214.7 781.3 31.3 6.1 22.6 8.1Malaysia 24.8 4,011.3 n.a n.a n.a n.a
Africa
Algeria 31.8 1,915.5 69.9 25.8 97.1 35.5Egypt 67.6 1,622.3 n.a n.a n.a n.aLibya – – 72.5 36.1 97 36.6Angola 13.5 814.3 80.9 33.9 90.3 67.9Chad 8.6 217.8 n.a n.a n.a n.aEquatorial Guinea 7.9 430.7 84 21.6 93.4 89Nigeria 136.5 357.4 77.2 32.6 95.8 43.8
Latin America
Brazil 176.6 3,510.2 n.a n.a n.a n.aBolivia 8.8 1,017.3 n.a n.a n.a n.aColombia 44.6 2,017.0 9 2.7 27.8 44.6Mexico 102.3 5,792.0 32.2 7 14.9 2.5Venezuela 25.7 4,009.0 52.7 14.3 79.9 21.3
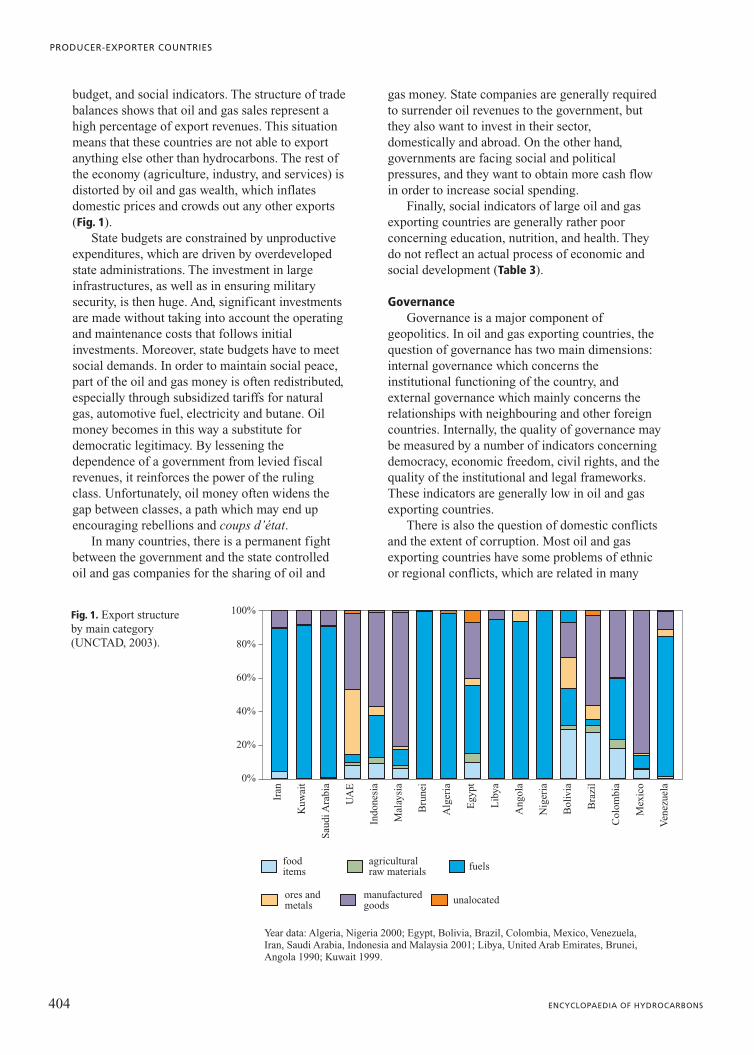
budget, and social indicators. The structure of tradebalances shows that oil and gas sales represent ahigh percentage of export revenues. This situationmeans that these countries are not able to exportanything else other than hydrocarbons. The rest ofthe economy (agriculture, industry, and services) isdistorted by oil and gas wealth, which inflatesdomestic prices and crowds out any other exports(Fig. 1).
State budgets are constrained by unproductiveexpenditures, which are driven by overdevelopedstate administrations. The investment in largeinfrastructures, as well as in ensuring militarysecurity, is then huge. And, significant investmentsare made without taking into account the operatingand maintenance costs that follows initialinvestments. Moreover, state budgets have to meetsocial demands. In order to maintain social peace,part of the oil and gas money is often redistributed,especially through subsidized tariffs for naturalgas, automotive fuel, electricity and butane. Oilmoney becomes in this way a substitute fordemocratic legitimacy. By lessening thedependence of a government from levied fiscalrevenues, it reinforces the power of the rulingclass. Unfortunately, oil money often widens thegap between classes, a path which may end upencouraging rebellions and coups d’état.
In many countries, there is a permanent fightbetween the government and the state controlledoil and gas companies for the sharing of oil and
gas money. State companies are generally requiredto surrender oil revenues to the government, butthey also want to invest in their sector,domestically and abroad. On the other hand,governments are facing social and politicalpressures, and they want to obtain more cash flowin order to increase social spending.
Finally, social indicators of large oil and gasexporting countries are generally rather poorconcerning education, nutrition, and health. Theydo not reflect an actual process of economic andsocial development (Table 3).
GovernanceGovernance is a major component of
geopolitics. In oil and gas exporting countries, thequestion of governance has two main dimensions:internal governance which concerns theinstitutional functioning of the country, andexternal governance which mainly concerns therelationships with neighbouring and other foreigncountries. Internally, the quality of governance maybe measured by a number of indicators concerningdemocracy, economic freedom, civil rights, and thequality of the institutional and legal frameworks.These indicators are generally low in oil and gasexporting countries.
There is also the question of domestic conflictsand the extent of corruption. Most oil and gasexporting countries have some problems of ethnicor regional conflicts, which are related in many
404 ENCYCLOPAEDIA OF HYDROCARBONS
PRODUCER-EXPORTER COUNTRIES
0%
20%
40%
60%
fooditems
agriculturalraw materials
ores andmetals
manufacturedgoods
fuels
Year data: Algeria, Nigeria 2000; Egypt, Bolivia, Brazil, Colombia, Mexico, Venezuela,Iran, Saudi Arabia, Indonesia and Malaysia 2001; Libya, United Arab Emirates, Brunei,Angola 1990; Kuwait 1999.
unalocated
Iran
Kuw
ait
Sau
di A
rabi
a
UA
E
Indo
nesi
a
Mal
aysi
a
Bru
nei
Alg
eria
Egy
pt
Lib
ya
Ang
ola
Nig
eria
Bol
ivia
Bra
zil
Col
ombi
a
Mex
ico
Ven
ezue
la
80%
100%Fig. 1. Export structure by main category (UNCTAD, 2003).
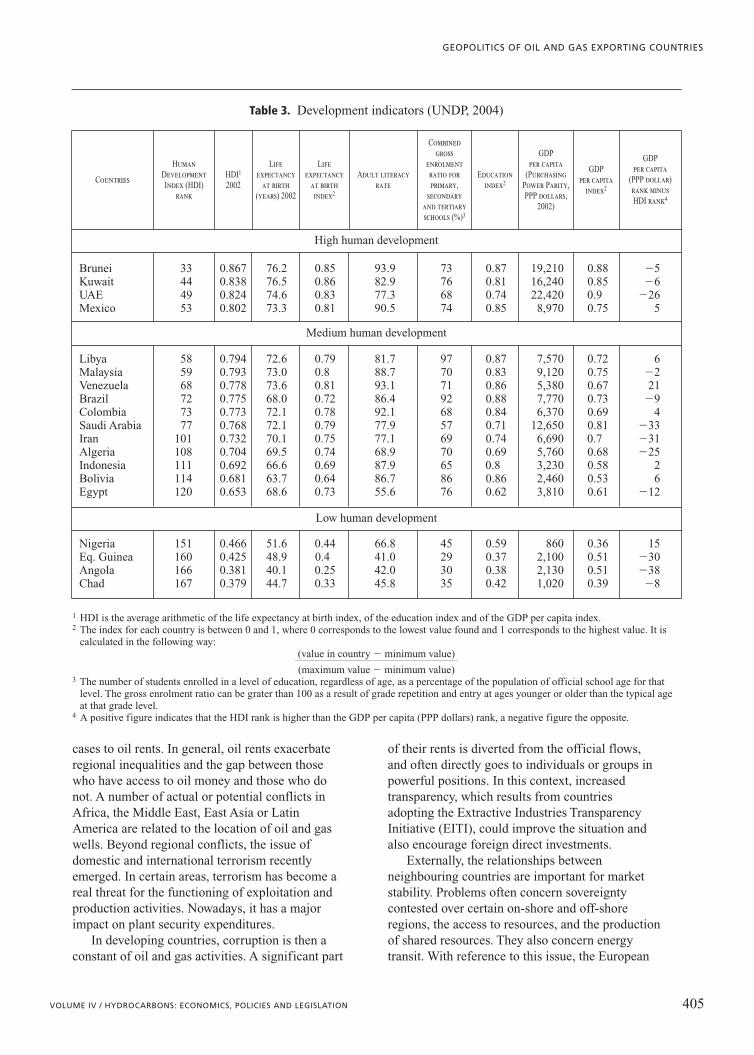
cases to oil rents. In general, oil rents exacerbateregional inequalities and the gap between thosewho have access to oil money and those who donot. A number of actual or potential conflicts inAfrica, the Middle East, East Asia or LatinAmerica are related to the location of oil and gaswells. Beyond regional conflicts, the issue ofdomestic and international terrorism recentlyemerged. In certain areas, terrorism has become areal threat for the functioning of exploitation andproduction activities. Nowadays, it has a majorimpact on plant security expenditures.
In developing countries, corruption is then aconstant of oil and gas activities. A significant part
of their rents is diverted from the official flows,and often directly goes to individuals or groups inpowerful positions. In this context, increasedtransparency, which results from countriesadopting the Extractive Industries TransparencyInitiative (EITI), could improve the situation andalso encourage foreign direct investments.
Externally, the relationships betweenneighbouring countries are important for marketstability. Problems often concern sovereigntycontested over certain on-shore and off-shoreregions, the access to resources, and the productionof shared resources. They also concern energytransit. With reference to this issue, the European
405VOLUME IV / HYDROCARBONS: ECONOMICS, POLICIES AND LEGISLATION
GEOPOLITICS OF OIL AND GAS EXPORTING COUNTRIES
Table 3. Development indicators (UNDP, 2004)
Countries
HumanDevelopmentIndex (HDI)
rank
HDI1
2002
Lifeexpectancy
at birth(years) 2002
Lifeexpectancy
at birthindex2
Adult literacyrate
Combinedgross
enrolmentratio forprimary,
secondaryand tertiaryschools (%)3
Educationindex2
GDPper capita
(PurchasingPower Parity,PPP dollars,
2002)
GDPper capita
index2
GDPper capita
(PPP dollar)rank minusHDI rank4
High human development
Brunei 33 0.867 76.2 0.85 93.9 73 0.87 19,210 0.88 �5Kuwait 44 0.838 76.5 0.86 82.9 76 0.81 16,240 0.85 �6UAE 49 0.824 74.6 0.83 77.3 68 0.74 22,420 0.9 �26Mexico 53 0.802 73.3 0.81 90.5 74 0.85 8,970 0.75 5
Medium human development
Libya 58 0.794 72.6 0.79 81.7 97 0.87 7,570 0.72 6Malaysia 59 0.793 73.0 0.8 88.7 70 0.83 9,120 0.75 �2Venezuela 68 0.778 73.6 0.81 93.1 71 0.86 5,380 0.67 21Brazil 72 0.775 68.0 0.72 86.4 92 0.88 7,770 0.73 �9Colombia 73 0.773 72.1 0.78 92.1 68 0.84 6,370 0.69 4Saudi Arabia 77 0.768 72.1 0.79 77.9 57 0.71 12,650 0.81 �33Iran 101 0.732 70.1 0.75 77.1 69 0.74 6,690 0.7 �31Algeria 108 0.704 69.5 0.74 68.9 70 0.69 5,760 0.68 �25Indonesia 111 0.692 66.6 0.69 87.9 65 0.8 3,230 0.58 2Bolivia 114 0.681 63.7 0.64 86.7 86 0.86 2,460 0.53 6Egypt 120 0.653 68.6 0.73 55.6 76 0.62 3,810 0.61 �12
Low human development
Nigeria 151 0.466 51.6 0.44 66.8 45 0.59 860 0.36 15Eq. Guinea 160 0.425 48.9 0.4 41.0 29 0.37 2,100 0.51 �30Angola 166 0.381 40.1 0.25 42.0 30 0.38 2,130 0.51 �38Chad 167 0.379 44.7 0.33 45.8 35 0.42 1,020 0.39 �8
1 HDI is the average arithmetic of the life expectancy at birth index, of the education index and of the GDP per capita index.2 The index for each country is between 0 and 1, where 0 corresponds to the lowest value found and 1 corresponds to the highest value. It is
calculated in the following way:(value in country � minimum value)1111111111311111
(maximum value � minimum value)3 The number of students enrolled in a level of education, regardless of age, as a percentage of the population of official school age for that
level. The gross enrolment ratio can be grater than 100 as a result of grade repetition and entry at ages younger or older than the typical ageat that grade level.
4 A positive figure indicates that the HDI rank is higher than the GDP per capita (PPP dollars) rank, a negative figure the opposite.
energy charter is an important step for increasingtransit opportunities. The charter is an internationaltreaty which gives legal and institutional structureto transit conditions. Energy transit createsinterdependency between countries. Theirappropriate management is thus an element ofstability.
Finally, each oil and gas exporting country hasto find its position within the big game of world oiland gas geopolitics. Major importers of oil and gas(the United States, Western Europe, China, Japan)are keen to secure their energy supply and to buildspecial relationships with oil and gas exportingcountries. The United States have built a long-standing relationship with Saudi Arabia, but theyneed to diversify toward Africa, Latin America andRussia. One of the major priorities of their foreignpolicy is to secure access to Middle East oil. TheUnited States, the European Community, Chinaand Japan form a pool of strong competitors whovie to gain access to resources. The current oil andgas world situation is a combination ofglobalization and renewed nationalism. Marketmechanisms are complemented by politicalinterferences. The oil and gas international pictureis complex and leaves room for negotiations, tradeoff, and compromises.
8.1.2 The Middle East and Far East
Since oil was discovered at the beginning of theTwentieth century, the Middle East1 has acquiredstrategic importance for international superpowers.Middle East proven oil reserves are estimated at702.7 billion barrels, i.e. 61% of world oilreserves, for 59 million people (1% of worldpopulation). Its contribution to the world energyproduction is 26% for oil and 7% for gas in 2003.Access to these cheap resources remains vital forthe functioning of the world economy. Despitegeographical diversification efforts, world oildependence on the Middle East is still large andshould continue growing in the next decades. Therich Arab oil and gas exporting countries, whichbelong to the Gulf Cooperation Council (GCC),2
remain the main suppliers of crude oil to the worldmarket.
Middle East oil exporting countries can bedivided into two categories. On the one hand, thereare the oil-rich Gulf monarchies like Kuwait andUnited Arab Emirates, which are characterized bysmall populations and vast natural resources. Onthe other hand, there are countries with largepopulations and oil rents more strictly correlated to
the international context (Iran, Iraq and, to a lesserextent, Syria).
Saudi Arabia, a key country, lies in the middlewith huge resource endowment but also a large andfast growing population. With a population ofabout 22 million inhabitants, Saudi Arabia has thelargest oil proven reserves in the world. The size ofthe fields and their flexibility enabled the Kingdomto play an important role as market regulator (aswing producer) for many years by modulating itsproduction between 8 and 10 Mbbl/d. In 2003 forexample, Saudi Arabia, with Kuwait and theEmirates, was able to compensate for the ‘missingbarrels’ that resulted from political crisis inVenezuela, social unrest in Nigeria and war in Iraq.
The hydrocarbons endowment of the Far Eastcountries (Sultanate of Brunei, Malaysia andIndonesia) is much more modest. Despite theirsmaller oil and gas rents, the comparison of the FarEast exporting countries to the Middle East statesis nonetheless relevant and telling, since they haveexperimented opposed policies in the managementof oil wealth, so as to escape the oil curse.
Income from oil and gas exportsOil revenues of Middle East surveyed countries
between 1999 and 2003 are indicated in Table 2.One may notice the high volatility and variation ofthese revenues. Despite some diversificationefforts, the Middle East countries remain extremelydependent on oil and gas revenues. Between 2000and 2003, about 78% of their exports revenuescame from hydrocarbon exports and 69% of theirfiscal revenues from hydrocarbon revenues. Oiland gas exports are also the main source of foreignexchange inflows. For instance, 75% of the Saudibudget is fed by oil revenues. In this setting, oilprice fluctuation remains the principal determinantof growth, as its current balance depends mainlyon the oil price level: a 10% increase in oil pricesgenerates a rise of 14% of the Saudi GDP(ESMAP, 2005). The level of prices needed bySaudi Arabia to balance its budget is todayestimated at around 30 dollars/bbl.
During the oil boom in the 1970s, all producingcountries, especially the Middle East states,received an exceptionally large rent stream. They
406 ENCYCLOPAEDIA OF HYDROCARBONS
PRODUCER-EXPORTER COUNTRIES
1 According to the World Bank, the Middle East includesIran, Iraq, Kuwait, Oman, Qatar, Saudi Arabia, Syria, UnitedArab Emirates and Yemen. In this article, the Middle Eastsurveyed countries are Saudi Arabia, Iraq, Iran, United ArabEmirates and Kuwait.
2 The GCC consist of Bahrain, Kuwait, Oman, Qatar,Saudi Arabia and the United Arab Emirates.
became ‘rentier’ economies, i.e. ‘‘countries thatreceive on a regular basis substantial amounts ofexternal economic rents from foreign individuals,concerns or governments’’ (Mahdavy, 1970).Today, the renting system is reaching its limits.Revenues depend on the oil price, which remainsan exogenous factor. So, Middle Easterneconomies are highly vulnerable to price shocksand exchange rates.
As for the Far East countries, their oildependency dropped significantly since the 1970s.Malaysia and Indonesia’s profiles are indeed highlymixed. Their agricultural sectors accountrespectively for 9.5% and 16.6% of the GDP.Indonesia is the only OPEC member who hassucceeded its diversification strategy. Between1983 and 2003, the ratio of oil exports to totalexports fell from 64% to 15.5%. This declinecontrasts with the export structure of MiddleEastern countries, whose exports are dominated byfuel products, with a very low share for the othergoods (Fig. 1).
With 1.1 billion barrels of proven oil reserves,i.e. 0.1% of world oil reserves in 2003, BruneiDarussalam is the only Far Eastern country largelydependent on oil and gas exports: 88% of itsexports are hydrocarbons. The oil and gas sectorcontribute about 40% of its GDP. Given the lack ofdiversity of its economy and the heavy reliance onvolatile hydrocarbon revenues, Brunei is startingnow to promote development of non-oil exports(and re-exports), such as tourism and financialservices. However, the main source of publicfinances is corporate tax (around 30%) and is stillprimarily collected from the oil and gas sector.
The evolution of the Middle East oil productiondepends on the future investments in the oil andgas sectors. Despite robust oil prices in the pastfew years, few investments were made to increaseoil production. Thus, in 2004, the low spareproduction capacity of the OPEC members did notmeet the rising oil demand, mainly because of theChinese (and American) economic growth.
Consequently, there are serious doubts aboutthe effectiveness of OPEC’s future role in the oilmarket. Following to the International EnergyAgency (IEA), large investments are needed inorder to meet global oil demand prospects. Themain share of these investments must be done inthe Middle East region in order to expand capacity.To a large extent, however, the decision remainscentralized in the hands of national oil companiesand governments, since most of their oil reservesare still precluded to foreign investment (Kuwaitand Saudi Arabia). The core producer, Saudi
Arabia, affirms that the investments will be madeand that the Kingdom can easily increase itscapacity. However, funding and technologicalmeans continue to be major obstacles for theinvestments and future production increase.
Furthermore, the evolution of the Iraqi situationis an important determinant of the geopolitics ofoil. Iraq’s oil recoverable reserves are estimated at115 billion of barrels, i.e. 10% share of worldreserves. Nevertheless, its position in the global oil(and gas) market is not as significant as it shouldbe. In fact, these estimations do not take intoaccount that only 10% of the territory has beenexplored. The reserves evaluation took place in the1960’s, which at that time had low recovery rates.In addition, Iraqi oil production comes from only20% of the discovered fields. For this reason,3 theInstitut Français du Pétrole (IFP) estimates Iraqiundiscovered reserves at around 100 and 150billion barrels, that is at least the equivalent of thecurrent reserves. As it is well known, this countryunderwent two decades of war and a decade ofsanctions. It needs now huge investments torecover the existing production capacity, and todevelop and modernize the existing fields. Thecurrent turmoil does not encourage investments.
Offshore production developments alsorepresent an important alternative for the future ofoil in the Middle and Far East. For instance,although Malaysian reserves have declined since1996, Malaysian production has been rising since2002, thanks to new offshore developments. Thissituation may be a positive outlook on productionin these areas.
The utilization of oil and gas revenues and their impact on the economy
As previously stated, oil and gas revenues arethe main financial resource of government andstate budgets. These resources often transit throughNational Oil Companies (NOC). In the Middle andFar East, they are generally administered understrong nationalistic rationale. In these areas,countries have created their own companiesfollowing national pressures in order to take statecontrol of resource exploitation. Examples areeverywhere in the first region: the National IranianOil Company (NIOC, in the 1950s), the IraqiNational Oil Company (INOC, in 1965), theKuwait National Petroleum Company (KNPC, in
407VOLUME IV / HYDROCARBONS: ECONOMICS, POLICIES AND LEGISLATION
GEOPOLITICS OF OIL AND GAS EXPORTING COUNTRIES
3 According to the IFP, the density of the discoveredfields per unit area is very low in Iraq relatively to the otherGulf countries: 1 field in Iraq against 2 for its neighbors per4,000 km2 (3 for Kuwait and the United Arab Emirates).
1960) and Saudi Aramco in 19884 in Saudi Arabia.As for the Far East countries, they have also
their own NOC, but they have more significantlyopened their oil and gas sector to internationalinvestors. Many foreign companies are todayinvolved in oil production in Malaysia andIndonesia. The former created its national oil andgas company, Petronas, in 1974, which is located inthe world’s tallest buildings (Petronas TwinTowers). The latter formed its state company,Pertamina, in 1957. Brunei’s oil industry iscompletely dominated by Brunei Shell Petroleum(BSP), a fifty-fifty joint venture between RoyalDutch/Shell and the government of Brunei. Since2002, the sector is opened to other oil companies.
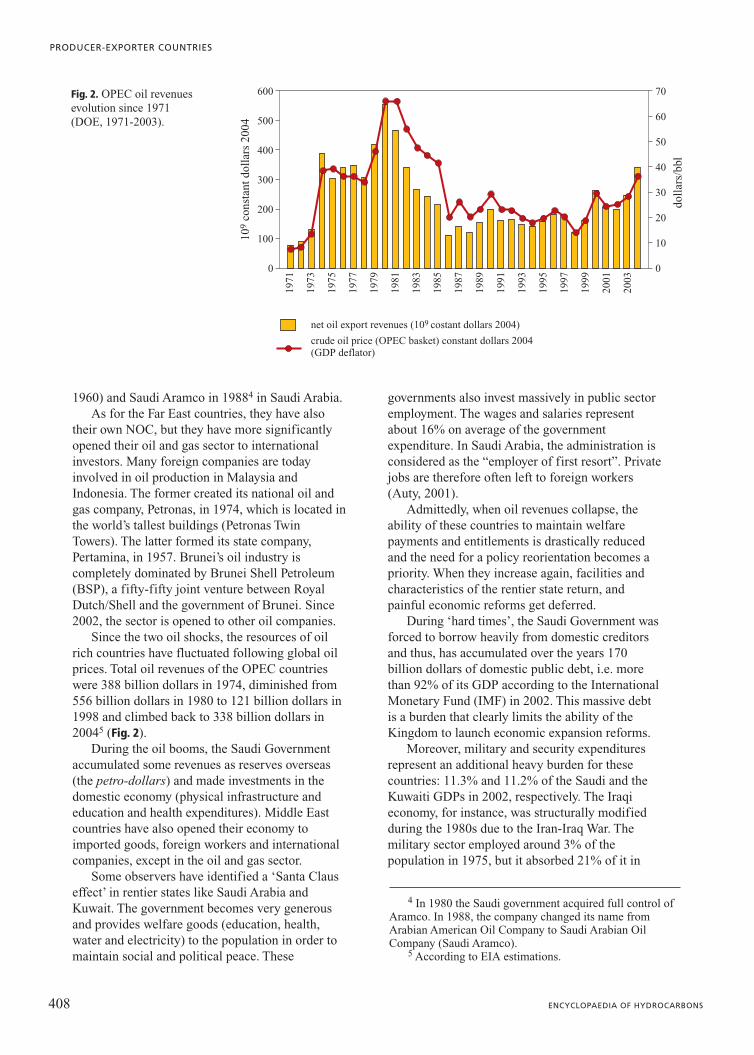
Since the two oil shocks, the resources of oilrich countries have fluctuated following global oilprices. Total oil revenues of the OPEC countrieswere 388 billion dollars in 1974, diminished from556 billion dollars in 1980 to 121 billion dollars in1998 and climbed back to 338 billion dollars in20045 (Fig. 2).
During the oil booms, the Saudi Governmentaccumulated some revenues as reserves overseas(the petro-dollars) and made investments in thedomestic economy (physical infrastructure andeducation and health expenditures). Middle Eastcountries have also opened their economy toimported goods, foreign workers and internationalcompanies, except in the oil and gas sector.
Some observers have identified a ‘Santa Clauseffect’ in rentier states like Saudi Arabia andKuwait. The government becomes very generousand provides welfare goods (education, health,water and electricity) to the population in order tomaintain social and political peace. These
governments also invest massively in public sectoremployment. The wages and salaries representabout 16% on average of the governmentexpenditure. In Saudi Arabia, the administration isconsidered as the “employer of first resort”. Privatejobs are therefore often left to foreign workers(Auty, 2001).
Admittedly, when oil revenues collapse, theability of these countries to maintain welfarepayments and entitlements is drastically reducedand the need for a policy reorientation becomes apriority. When they increase again, facilities andcharacteristics of the rentier state return, andpainful economic reforms get deferred.
During ‘hard times’, the Saudi Government wasforced to borrow heavily from domestic creditorsand thus, has accumulated over the years 170billion dollars of domestic public debt, i.e. morethan 92% of its GDP according to the InternationalMonetary Fund (IMF) in 2002. This massive debtis a burden that clearly limits the ability of theKingdom to launch economic expansion reforms.
Moreover, military and security expendituresrepresent an additional heavy burden for thesecountries: 11.3% and 11.2% of the Saudi and theKuwaiti GDPs in 2002, respectively. The Iraqieconomy, for instance, was structurally modifiedduring the 1980s due to the Iran-Iraq War. Themilitary sector employed around 3% of thepopulation in 1975, but it absorbed 21% of it in
408 ENCYCLOPAEDIA OF HYDROCARBONS
PRODUCER-EXPORTER COUNTRIES
109
cons
tant
dol
lars
200
4
crude oil price (OPEC basket) constant dollars 2004(GDP deflator)
doll
ars/
bbl
0
100
200
300
400
500
600
0
70
60
50
40
30
20
10
1971
1973
1975
1979
1977
1981
1985
1983
1987
1991
1989
1993
1997
1995
1999
2003
2001
net oil export revenues (109 costant dollars 2004)
Fig. 2. OPEC oil revenuesevolution since 1971 (DOE, 1971-2003).
4 In 1980 the Saudi government acquired full control ofAramco. In 1988, the company changed its name fromArabian American Oil Company to Saudi Arabian OilCompany (Saudi Aramco).
5 According to EIA estimations.

1988 at the end of the war. During 1981-1988,military spending totalled 120 billion dollars, i.e.256% of the same period’s oil revenue of 46.7billion dollars (Alnasrawi, 2002).
These expenditures clearly have a negativeimpact on economic growth. They reduce domesticinvestment potential and block the development ofthe productive economy. Furthermore, investmentneeds by the infrastructure of energy in this regionare huge, especially if one considers that energyconsumption per capita there is one of the highestin the world. For instance, the United ArabEmirates and Kuwait hold the highest energy use per capita: 9.6 and 9.5 toe (ton of oil equivalent)per capita respectively in 2002, compared to 8 inthe United States, 4 in Western Europe and 1 inChina (World Bank, 2004).
The growth potential of these countries isnonetheless tremendous considering the amount oftheir oil and gas rents. Unfortunately, only 3(Brunei, Kuwait and the United Arab Emirates) ofthe 8 surveyed countries (Middle East and FarEast) figure among the high human developmentgroup according to the classification of the UnitedNations (Table 3). In fact, the GDP per capita ofthe Middle East countries has been declining sincethe 1980s, a fact largely attributable to the oil curse(Fig. 3).
Several empirical studies confirm that thegrowth model of Middle East states do not meetnecessary conditions for sustainable long termgrowth.
The ratio of the gross foreign direct investmentrelative to GDP has been very low since 1980 andhas never really taken off (Gylfason, 2001).Furthermore, primary-exports dependence has anegative impact on long term growth, due to thehigh volatility of commodities prices. Few non-oiltradable activities are competitive. For instance, we
notice that agriculture was often neglected, exceptin Iran where it represents 11% of GDP. Kuwait,Qatar and Brunei do not hold resources other thanhydrocarbons: no agriculture, no water, and noindustry. They are also extremely dependent offoreign qualified and non-qualified workforce.Their only alternative is to invest oil rents inexternal assets in order to generate new types ofrevenue for future generations (Kuwait).
These states, Saudi Arabia in particular, alsodid not adopt a performing taxation system. Inmost cases, governments still rely on thehydrocarbons sector for more than 80% of itsrevenues.
In addition, even if Middle East countries holdhigh investment rates for international standards,they are characterized by low private-to-publicinvestment ratios. This ratio reflects an insufficienttransmission of savings to investment due to theweakness of Middle East countries’ financial andbusiness environments, and to the inefficiency oftheir investments, i.e. low productivity growth(Sala-i-Martin and Artadi, 2003). In fact, thepreponderant role of the public sector introducesdistortions in product and factor markets, andcontributes to economic inefficiencies andresource misallocation. Consequently, thedevelopment of the private sector has beensqueezed, and often directly limited by the publicsector.
Concerning social indicators, poverty levels aresubstantially lower than other countries withsimilar levels of income due to the cohesive systemadopted by governments. Nevertheless, all MiddleEast countries must now cope with high populationgrowth rates (one of the highest in the world). Theaverage population growth rates between 1960 and2003 are 8.5% for the United Arab Emirates and4.8% for Kuwait. The population growth of Saudi
409VOLUME IV / HYDROCARBONS: ECONOMICS, POLICIES AND LEGISLATION
GEOPOLITICS OF OIL AND GAS EXPORTING COUNTRIES
cons
tant
200
0 do
llar
s
0
1981
1983
1985
1987
1989
1991
1993
1995
1997
1999
2001
2003
10,000
Indonesia Iran Kuwait Malaysia United ArabEmirates
Saudi Arabia
5,000
15,000
20,000
25,000
30,000
35,000
40,000
45,000
50,000Fig. 3. GDP per capita since 1981 (World Bank, 2004).
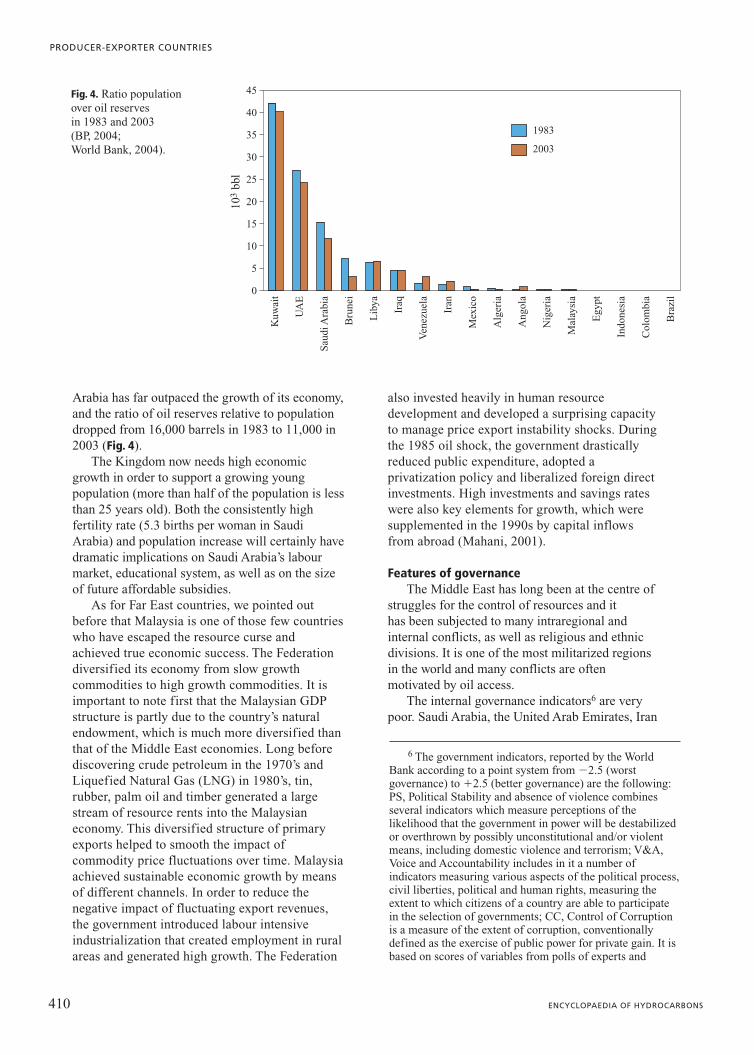
Arabia has far outpaced the growth of its economy,and the ratio of oil reserves relative to populationdropped from 16,000 barrels in 1983 to 11,000 in2003 (Fig. 4).
The Kingdom now needs high economicgrowth in order to support a growing youngpopulation (more than half of the population is lessthan 25 years old). Both the consistently highfertility rate (5.3 births per woman in SaudiArabia) and population increase will certainly havedramatic implications on Saudi Arabia’s labourmarket, educational system, as well as on the sizeof future affordable subsidies.
As for Far East countries, we pointed outbefore that Malaysia is one of those few countrieswho have escaped the resource curse andachieved true economic success. The Federationdiversified its economy from slow growthcommodities to high growth commodities. It isimportant to note first that the Malaysian GDPstructure is partly due to the country’s naturalendowment, which is much more diversified thanthat of the Middle East economies. Long beforediscovering crude petroleum in the 1970’s andLiquefied Natural Gas (LNG) in 1980’s, tin,rubber, palm oil and timber generated a largestream of resource rents into the Malaysianeconomy. This diversified structure of primaryexports helped to smooth the impact ofcommodity price fluctuations over time. Malaysiaachieved sustainable economic growth by meansof different channels. In order to reduce thenegative impact of fluctuating export revenues,the government introduced labour intensiveindustrialization that created employment in ruralareas and generated high growth. The Federation
also invested heavily in human resourcedevelopment and developed a surprising capacityto manage price export instability shocks. Duringthe 1985 oil shock, the government drasticallyreduced public expenditure, adopted aprivatization policy and liberalized foreign directinvestments. High investments and savings rateswere also key elements for growth, which weresupplemented in the 1990s by capital inflowsfrom abroad (Mahani, 2001).
Features of governanceThe Middle East has long been at the centre of
struggles for the control of resources and it has been subjected to many intraregional andinternal conflicts, as well as religious and ethnicdivisions. It is one of the most militarized regionsin the world and many conflicts are oftenmotivated by oil access.
The internal governance indicators6 are verypoor. Saudi Arabia, the United Arab Emirates, Iran
410 ENCYCLOPAEDIA OF HYDROCARBONS
PRODUCER-EXPORTER COUNTRIES
103
bbl
0
Kuw
ait
UA
E
Sau
di A
rabi
a
Bru
nei
Lib
ya
Iraq
Iran
Ven
ezue
la
Alg
eria
Mex
ico
Ang
ola
Nig
eria
Egy
pt
Col
ombi
a
Indo
nesi
a
Mal
aysi
a
Bra
zil
10
5
15
20
25
30
35
40
45
1983
2003
Fig. 4. Ratio population over oil reserves in 1983 and 2003 (BP, 2004; World Bank, 2004).
6 The government indicators, reported by the WorldBank according to a point system from �2.5 (worstgovernance) to �2.5 (better governance) are the following:PS, Political Stability and absence of violence combinesseveral indicators which measure perceptions of thelikelihood that the government in power will be destabilizedor overthrown by possibly unconstitutional and/or violentmeans, including domestic violence and terrorism; V&A,Voice and Accountability includes in it a number ofindicators measuring various aspects of the political process,civil liberties, political and human rights, measuring theextent to which citizens of a country are able to participatein the selection of governments; CC, Control of Corruptionis a measure of the extent of corruption, conventionallydefined as the exercise of public power for private gain. It isbased on scores of variables from polls of experts and
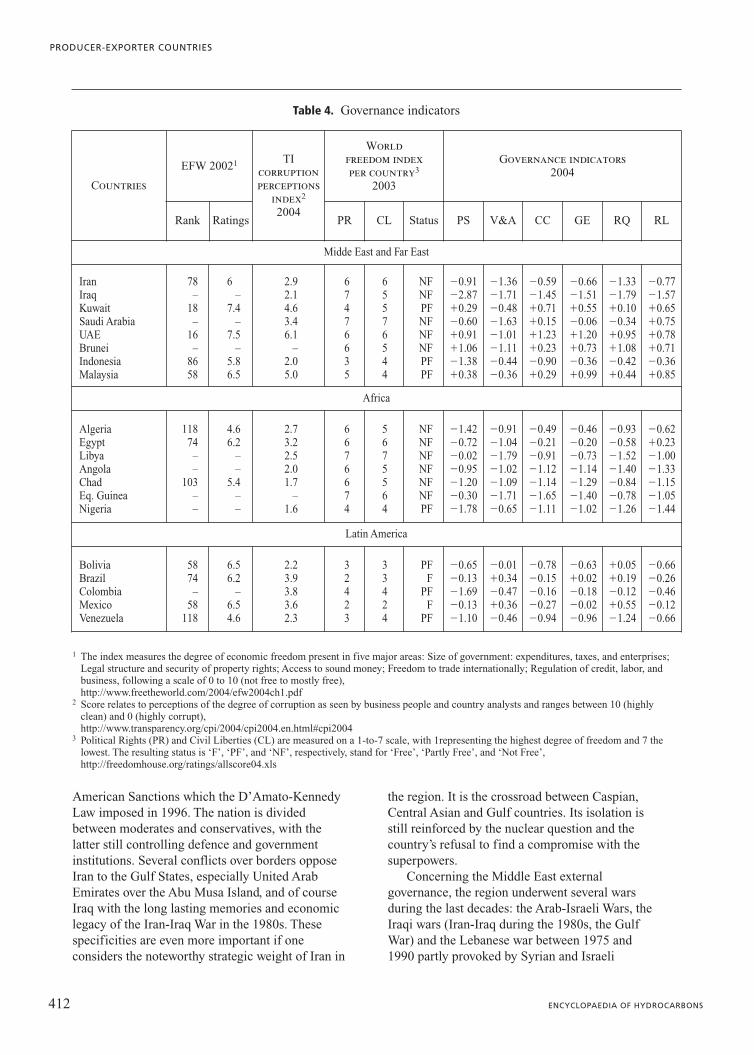
and Iraq are classified by the Freedom House asnon-politically free states (Table 4).
They have repressive regimes with a highdegree of authoritarianism. Many Middle Eastgovernments are considered as ‘paternalisticautocracies’ because they initially based theirlegitimacy on traditional and religious authority,and maintained it through rent distribution. Theyuse their oil wealth for financing social programsin order to appease pressures for democracy andprevent the formation of social groups independentfrom the state (Ross, 2001; IMF, 2004). Pluralist elections are almost non-existent in theregion and, in many cases, the presence of acommanding and powerful man has longdominated their political landscape. SaddamHussein governed Iraq since 1979. Basharal-Assad, the current Syrian President, succeededhis father in 2000 after 30 years of power; and theGulf monarchies have been hereditary since thesecountries gained their independence (al-Saudfamily in Saudi Arabia). Needless to say, womenstill do not enjoy the right to vote in several Gulfcountries.
These states also suffer from underdevelopedpolitical institutions. As the government is relievedfrom the fiscal pressure, it has no incentive topromote the protection of property rights as a wayto create oil wealth. As the oil rents areappropriated by the state and are not the result ofhuman effort, the need for developing effectivepolitical institutions is reduced (Birdsall andSubramanian, 2004). Instead, the economic life ofMiddle East countries is dominated by lengthybureaucratic procedures and unclear regulations.As the corruption perceptions index published online by Transparency International (TI) in 2004shows, oil wealth is a breeding ground forcorruption. It classifies Saudi Arabia in the 71st
position, Iran 87th, Iraq 129th, and Indonesia 133rd
on a survey that examined 146 countries (the 146th
being the most corrupt). However, the United ArabEmirates, Kuwait and Malaysia still benefit fromperforming indicators of institutional quality.
The Middle East region is an ethnical mosaicwith Sunnites who represent the majority; theShiites are present in Iran, Iraq, Bahrain andLebanon, the Wahabits in Saudi Arabia, theAlaouits in Syria, Druzes in Lebanon and Syria,and the Christians in Lebanon, Egypt, Syria,Palestinians and Iraq. This diversity poses majorcomplication to the governance of the region.Conflicts between groups and minorities arediffused throughout the region. In addition to thepermanent fight for power between Sunnites andShiites, Kurds and Palestinians representpopulations that have either been oppressed byseveral regimes (Kurds in Syria, Iraq, Turkey andIran), or confined in many refugee camps scatteredacross the Middle East, with no politicalrepresentation for many years (Charillon, 2003).
It is interesting to discuss here Malaysianethnic diversity and the way authorities have dealt with it. In fact, Malaysia has succeeded in dealing with ethnic conflicts. Afterindependence in 1957, the presence of multipleethnic groups reflected variable economicfunctions and revenues. The Bumiputeras (55% ofthe population) had a lower income level, lived in the rural areas and worked in agricultureand in the public sector. The Chinese (33%) livedin the urban areas and were in commerce and trade.The Indians (10%) were mainly in rubberplantations and were part of the lower incomegroup. Thus, these ethnic groups were separated byrace, culture, religion, social status, geographicallocation, and education. The proportion of the poorwas notably higher among Malays compared to theChinese. After racial riots in 1969, the governmentimplemented affirmative action policies in favourof the Malays and announced the New EconomicPolicy (NEP). Its aims were to eradicate povertyand to improve the social conditions of the Malaysby according them preferential treatment, within aperiod of twenty years. During this period,Malaysia achieved rapid economic growth,significantly reduced poverty and was able toinsert Malays into a dynamic public sector.
Some Middle East states are still isolated fromthe globalization trends. The Economic Freedom ofthe World index (EFW) measured by the FraserInstitute (Table 4) shows that Iran remainsextremely closed. Since the Revolution in 1979,the Islamic Republic of Iran has been detachedfrom globalization trends, partly because of the
411VOLUME IV / HYDROCARBONS: ECONOMICS, POLICIES AND LEGISLATION
GEOPOLITICS OF OIL AND GAS EXPORTING COUNTRIES
surveys; GE, Government Effectiveness combines responseson the quality of public service provision, the quality of thebureaucracy, the competence of civil servants, theindependence of the civil service from political pressures,and the credibility of the government’s commitment topolicies; RQ, Regulatory Quality instead focuses more onthe policies themselves, including measures of theincidences of market-unfriendly policies such as pricecontrols or inadequate bank supervision, as well asperceptions of the burdens imposed by excessive regulationin areas such as foreign trade and business development;RL, Rule of Law includes several indicators which measurethe extent to which agents have confidence in and abide by the rules of society. These include perceptions of theincidence of crime, the effectiveness and predictability ofthe judiciary, and the enforceability of contracts.
American Sanctions which the D’Amato-KennedyLaw imposed in 1996. The nation is dividedbetween moderates and conservatives, with thelatter still controlling defence and governmentinstitutions. Several conflicts over borders opposeIran to the Gulf States, especially United ArabEmirates over the Abu Musa Island, and of courseIraq with the long lasting memories and economiclegacy of the Iran-Iraq War in the 1980s. Thesespecificities are even more important if oneconsiders the noteworthy strategic weight of Iran in
the region. It is the crossroad between Caspian,Central Asian and Gulf countries. Its isolation isstill reinforced by the nuclear question and thecountry’s refusal to find a compromise with thesuperpowers.
Concerning the Middle East externalgovernance, the region underwent several warsduring the last decades: the Arab-Israeli Wars, theIraqi wars (Iran-Iraq during the 1980s, the GulfWar) and the Lebanese war between 1975 and1990 partly provoked by Syrian and Israeli
412 ENCYCLOPAEDIA OF HYDROCARBONS
PRODUCER-EXPORTER COUNTRIES
Table 4. Governance indicators
Countries
EFW 20021 TIcorruptionperceptions
index2
2004
Worldfreedom indexper country3
2003
Governance indicators2004
Rank Ratings PR CL Status PS V&A CC GE RQ RL
Midde East and Far East
Iran 78 6 2.9 6 6 NF �0.91 �1.36 �0.59 �0.66 �1.33 �0.77Iraq – – 2.1 7 5 NF �2.87 �1.71 �1.45 �1.51 �1.79 �1.57Kuwait 18 7.4 4.6 4 5 PF �0.29 �0.48 �0.71 �0.55 �0.10 �0.65Saudi Arabia – – 3.4 7 7 NF �0.60 �1.63 �0.15 �0.06 �0.34 �0.75UAE 16 7.5 6.1 6 6 NF �0.91 �1.01 �1.23 �1.20 �0.95 �0.78Brunei – – – 6 5 NF �1.06 �1.11 �0.23 �0.73 �1.08 �0.71Indonesia 86 5.8 2.0 3 4 PF �1.38 �0.44 �0.90 �0.36 �0.42 �0.36Malaysia 58 6.5 5.0 5 4 PF �0.38 �0.36 �0.29 �0.99 �0.44 �0.85
Africa
Algeria 118 4.6 2.7 6 5 NF �1.42 �0.91 �0.49 �0.46 �0.93 �0.62Egypt 74 6.2 3.2 6 6 NF �0.72 �1.04 �0.21 �0.20 �0.58 �0.23Libya – – 2.5 7 7 NF �0.02 �1.79 �0.91 �0.73 �1.52 �1.00Angola – – 2.0 6 5 NF �0.95 �1.02 �1.12 �1.14 �1.40 �1.33Chad 103 5.4 1.7 6 5 NF �1.20 �1.09 �1.14 �1.29 �0.84 �1.15Eq. Guinea – – – 7 6 NF �0.30 �1.71 �1.65 �1.40 �0.78 �1.05Nigeria – – 1.6 4 4 PF �1.78 �0.65 �1.11 �1.02 �1.26 �1.44
Latin America
Bolivia 58 6.5 2.2 3 3 PF �0.65 �0.01 �0.78 �0.63 �0.05 �0.66Brazil 74 6.2 3.9 2 3 F �0.13 �0.34 �0.15 �0.02 �0.19 �0.26Colombia – – 3.8 4 4 PF �1.69 �0.47 �0.16 �0.18 �0.12 �0.46Mexico 58 6.5 3.6 2 2 F �0.13 �0.36 �0.27 �0.02 �0.55 �0.12Venezuela 118 4.6 2.3 3 4 PF �1.10 �0.46 �0.94 �0.96 �1.24 �0.66
1 The index measures the degree of economic freedom present in five major areas: Size of government: expenditures, taxes, and enterprises;Legal structure and security of property rights; Access to sound money; Freedom to trade internationally; Regulation of credit, labor, andbusiness, following a scale of 0 to 10 (not free to mostly free),http://www.freetheworld.com/2004/efw2004ch1.pdf
2 Score relates to perceptions of the degree of corruption as seen by business people and country analysts and ranges between 10 (highlyclean) and 0 (highly corrupt),http://www.transparency.org/cpi/2004/cpi2004.en.html#cpi2004
3 Political Rights (PR) and Civil Liberties (CL) are measured on a 1-to-7 scale, with 1representing the highest degree of freedom and 7 thelowest. The resulting status is ‘F’, ‘PF’, and ‘NF’, respectively, stand for ‘Free’, ‘Partly Free’, and ‘Not Free’,http://freedomhouse.org/ratings/allscore04.xls
interventions. These wars, even if initially nottaking place in oil producing territories, have hadmajor influence on oil geopolitics of the regionbecause of energy transit.
For more than half of a century now, theIsraeli-Palestinian conflict has been a major sourceof destabilization in the area. Iran and Iraq (before2003) embody major threats to Israel. In fact, thisconflict has opposed several Arab countries againstIsrael. In 1973, the Organization of Arab PetroleumCountries (OAPEC) used its oil for political ends,by imposing an embargo on the United States andthe Netherlands for their explicit support to Israel.
The Middle East oil wealth and the energygrowing dependence of the United Statesprompted the American administration to play amajor role in the region, with an initial partnershipestablished by President Roosevelt and King IbnSaud after the Second World War. From that timeonwards, Saudi Arabia has been able to rely on theUnited States to assure its security and its defencefrom external threats, like the ones posed by Iran,Iraq and, to a lesser extent, Egypt (the three mainpolitical challengers for regional influence). TheGulf War with operation Desert storm in 1990-91,the sanctions imposed later on Iraq, and theAmerican intervention in 2003, showed theimportance and priority accorded by the UnitedStates to secure their oil supply in the region.Their access to oil is a matter of national securitysince the US economy and military forces dependheavily on its flow.
The attacks of September 11th, 2001 have,however, weakened Saudi-American relations, andthe United States military presence in Saudi Arabiais contested by the population; 15 of the 19hijackers were Saudis. The level of theanti-American resentment in the entire region isgrowing. However, Washington’s dream is toreshape the Middle East and to stimulatedemocratization in the region, starting with Iraq,which was suspected of holding weapons of massdestruction that were “ready for use within 45minutes”. The American intervention in Iraqreflects a new dimension of foreign policy duringthe Bush administration, which was consideredafter the 9/11 attacks. For America, democracyenforcement is the best antidote to extremism andIslamic terrorism.
However, despite some pacification elementswhich appeared in 2005, namely the unprecedenteddemocratic elections in Iraq of a Kurdish presidentand the Syrian withdrawal of Lebanon, the spreadof democracy to the whole region remains, for now,highly improbable.
8.1.3 Africa: oil curse with a ray of light
With 13.4 % of the world population, 836 millionpeople, Africa accounts for only 3% in the worldprimary energy consumption. Its contribution tothe world energy production is 11% for oil and 5%for natural gas. Beyond these figures Africa’s shareis increasing and its contribution to the world oilsupply is becoming highly strategic.
Regarding oil and gas, African countries aredivided into two broad categories: those who areoil and gas exporting countries and those whoimport their oil. In the first category are a few keycountries such as Nigeria (2.9 Mbbl/d), Algeria(2.1 Mbbl/d), Libya (1.9 Mbbl/d), which are threeimportant OPEC members. Angola is also in thiscategory (1.2 Mbbl/d), as well as Egypt, EquatorialGuinea, and emerging oil countries such as Sudan,Chad, São Tomé and Principe. In the secondcategory is South Africa, which has importantresources of coal but no significant production ofoil. A number of poor countries that are totallydependent on oil imports are also in the secondcategory. For the latter type of country, when oil isparticularly expensive, oil imports become afinancial burden that dramatically hurts itseconomic growth and activity.
As far as oil exporting countries are concerned,all of them illustrate the oil curse; in most cases,oil wealth is an obstacle to economic development.With no exception, oil discoveries haveexacerbated poverty, instigated wars and boostedcorruption. A recent international initiative todevelop oil in Chad, one of the poorest Africancountries, could have brought some hope for thepossibility of using oil money for economicdevelopment.
The value of oil and gas exportsJust a few African countries have been
producing oil for decades. Many others have onlyrecently taken part in this type of production,following an activity boom over African resourcesthat began in 1990. Several reasons explain therush to African oil. The United States arebecoming more and more dependent on oilimports, which represent now more than 50% oftheir domestic consumption. Therefore, they wantto diversify their supply in order to lessen theirdependence over the Middle East. African oil isalight low sulphur crude that corresponds well tothe American demand for gasoline and middledistillates. Another important reason for explainingthe boom is the remarkable progress made in deep
413VOLUME IV / HYDROCARBONS: ECONOMICS, POLICIES AND LEGISLATION
GEOPOLITICS OF OIL AND GAS EXPORTING COUNTRIES
offshore technology for exploration andproduction. Companies are now able to produceunder 2,000 meters of water. Offshore productionreduces country risk because there is no populationaround the fields and the exporting facilities.
Since 1990, oil companies have been active inobtaining licences for conducting oil explorationand developing new fields. The oil majors are incompetition with small independent firms and alsowith state-owned companies from emergingcountries. Indian and Chinese companies areaggressively looking for oil resources all over theworld. All these signposts reflect the growinginterest for African oil.
For African oil and gas exporting countries, the financial resources generated by exportsrepresent between 70% and 85% of total fiscal revenues, between 20% and 35% of theirGDP. In Chad, the start of oil production doubledthe state budget. It is, however, interesting toobserve that the governments’ percentage of profitsvaries from country to country. It goes from 28%(in the case of the very specific project of oildevelopment in Chad) to 80% in Nigeria.
The expected evolution of production andexports differs from one country to another. Somecountries are facing, for the moment, a decline inproduction and reserves: Gabon, Congo, Cameron.Gabon left OPEC in 1995. Most other countries arevery promising, especially for deep offshoreproduction in the Gulf of Guinea. Elsewhere thereare numerous areas that might be promising, but noexploration has been conducted. The African oilproduction could reach 15 Mbbl/d in 2010 ascompared to 10.5 in 2005. However, the evolution ofproduction primarily depends on the amount ofinvestments that will be decided and also on the newdiscoveries that improved technologies may enable.
In Africa, oil investments are generally made byinternational companies; their decisions dependson the fiscal regime, and also on the generalattitude of governments regarding foreign directinvestments. Most of sub-Saharan countrieswelcome foreign direct investments. North Africa,Libya, Algeria and Egypt have opened tointernational investors, although the investor’s roleremains under control. Algeria proposes jointventure, which are partnerships between the state-owned national company Sonatrach and one ormore international companies. Partners share theexploration and production costs proportional totheir equity stakes. If exploration is successful, theoil production is shared according to the sameproportions. These openings notwithstanding,relationships between foreign companies and
national oil companies are often thwarted bybureaucracy and delays.
Oil and gas income uses and their strategiesNowhere in Africa has oil money been used for
promoting economic development. Trade balancesshow that oil exporting countries are not capable ofexporting any good other than oil. Social indicatorsand development indicators are low everywhere(Table 3).
Nigeria provides one of the best examples ofthe oil curse. Several plans for economicdevelopment were launched in past decades butthey rapidly faded when the price of oil went down.The share of population living in poverty increasedfrom 28% in 1980 to 66% in 1996. During thesame period, the average income per headdecreased from 800 to 300 dollars. More than 91%of the population lives with less than 2 dollars/d.One in 5 children dies before the age of 5, morethan 4 million people are infected with HIV, and 11million children who should be at school are not.The uneven distribution of oil money is the majorreason for the social unrest in the Niger delta andthe development of crude oil and oil product thefts.By some estimates, the smugglers steal as much as10% of country’s annual output, a criminal activityvalued at 30 billion dollars in 2004. Oil is soldabroad and the profits have financed the creationof a well-armed private militia in the region.
In Algeria, just after obtaining independence in1962, oil production was still in the hands ofFrench companies. The Algerians createdSonatrach in 1963 and the oil industry wasnationalized in 1971. At that time, oil and gasindustries were seen as strategic. They wereexpected to trigger an actual process of economicdevelopment. Access to cheap domestic oil and gaswas expected to boost ‘industrializing industries’:steel, equipments, machinery, and petrochemicals(Destanne de Bernis, 1971).
The model failed entirely and large state-ownedindustrial companies performed badly. Oil moneyturned to subsidies, social expenditures, andinfrastructure. Part of the oil rent was increasinglysiphoned by the military ruling elites.
The uneven distribution of oil money is one ofthe core problems of oil rich countries. It is themajor political issue facing the ruling class. Socialexpenditures are the price one must pay in order tobuy social peace. Maintaining low prices onautomotive fuels, kerosene, butane, and electricityis an easy means for governments. In November2004, a litre of diesel oil was priced 8 cents ofdollar in Libya, 10 cents in Egypt, and 15 cents in
414 ENCYCLOPAEDIA OF HYDROCARBONS
PRODUCER-EXPORTER COUNTRIES
Algeria, while the international price was 37 cents.Sometimes the state-owned oil company has a roleto play in the distribution, especially for thesharing between government needs and statecompany needs.
In Algeria, the state-owned companySonatrach, who controls most of the oil and gasactivities either as operator or in partnership withinternational investors, uses part of the oil moneyfor its own investments. However, the recenthydrocarbons law (adopted in 2005) reduces theautonomy of Sonatrach vis à vis the government,illustrating a permanent fight between publicentities for control of oil money.
In Angola, the national oil company Sonangol,which is not an operator, has become a sort ofregulator of the oil sector albeit the political andmilitary turmoil. The company has set upcommercial entities to obtain a better valorizationof Angola’s oil. The company has also developed astrategy of diversification towardtelecommunication, shipping, air transport, andinsurance. Sonangol is trying to export its know-how in the organization of the oil sector toneighbouring countries.
As a matter of fact, in all oil exportingcountries, it is almost impossible to track thefinancial flows that are related to the oil business.A number of key elements are considered as ‘Statesecrets’. The whole picture is poisoned by poorgovernance, the lack of countervailing power, localwars, ethnic conflicts, and corruption.
The specific nature of governanceThere is a huge deficit in public governance in
Africa. Indicators for democracy, economicfreedom, political rights, and civil liberties arepoor. In addition, most African oil rich countrieshave created plethoric bureaucracies, and oilmoney is increasing geographical disparities andaggravating domestic conflicts. Political power isin the hands of small minorities, which either arefactional oligarchies, military elites, or acombination of both.
Domestic conflicts that are ethnic, geographicor religious are present in most oil exportingcountries, with the exception of Libya and Gabon.Sometimes, conflicts existed well before oildiscoveries (Angola, Chad, Sudan); but in mostcases, conflicts are exacerbated by oil money andthe struggle for its appropriation. Most of therecent African wars were, more or less, related tooil money (Copinschi, 2003).
Corruption is present in all African countries.The World Bank and a number of international
organizations such as Transparency Internationaltry to fight against corruption and some progresshas been made.
In this context, oil companies are facing adifficult situation. They are asked to give money to‘political players’. They have to protect theiremployees and their oil facilities. Sometimes, theyhave to deal with two opposing factions. Thissituation was the case of Gulf Oil (purchased in1984 by Chevron) in Angola, and Elf Aquitaine(now merged with Total) in Congo. An illustrativefact is the political role the state-owned Frenchcompany Elf Aquitaine played in Africa fordecades. Elf was considered as the FrenchGovernment’s arm in Africa. In 2002, court actionwas taken in France against a few former managersof the company. A long spectacular proceedingrevealed huge amounts of money that had beenseized from oil money for the purposes offinancing political parties in Africa and in Europe,and also for the personal enrichment of a few well-placed people (Joly, 2003).
Most of African oil is produced by internationaloil companies and state-owned companies, but oilresources are now attracting new comers. In Libya,when the international sanctions were lifted(2004), the country opened its rich oil fields toforeign investments. An international tender offerattracted a great number of companies. One blockwent to a major international company(ChevronTexaco) and the others to smaller playerswilling to invest in Africa. Among new comers aresmall independent and state-owned companies.Companies from China and India are particularlyaggressive. They desire access to oil resources inorder to secure their countries’ oil supply. Newcomers are frequently accused of ‘contractualdumping’ by international companies. They areless pressured by financial markets and, therefore,may be willing to accept lower financial targets. Inaddition, these companies worry less aboutpressure from environmental and human rightsactivists. When activists forced Canada’s TalismanEnergy from doing business with Sudan, a Chinesecompany was immediately happy to take its place.
Chad oil: miracle or mirage?Chad, one of the poorest countries in Africa,
provides an example where the development ofdomestic oil resources could be a catalyst for trueeconomic development. Oil was discovered inChad over 30 years ago, but years of civil warworsen the political and technical task ofdeveloping oil extraction and transporting it to anocean-based export facility. The ‘normal’
415VOLUME IV / HYDROCARBONS: ECONOMICS, POLICIES AND LEGISLATION
GEOPOLITICS OF OIL AND GAS EXPORTING COUNTRIES
development of this oil would have reinforced localconflicts, corruption, and further concentratedpower in the hands of a few. In 2000, the WorldBank, which usually does not deal with oilinvestments, decided to enter the project as acatalyst for the financing of a 4.2 billion dollarsChad-Cameroon Petroleum Development andPipeline Project. This project was designed to carryoil from over 250 wells drilled in the Doba basin ofsouthern Chad through a 1,050 km undergroundpipeline to the Altantic coast of Cameroon. Theestimated 1 billion barrels of oil in the Doba fieldswill be extracted over a period of 25 years with aplanned production of 225,000 bbl/d, earning Chadsome 3 billion dollars over project’s lifetime(depending on the price of oil). Chad GDP was 1.4million dollars. Chadian oil began to be exportedin July 2003. Production and exports are operatedby an ExxonMobil led consortium withChevronTexaco and Petronas, the Malaysian stateoil company, as part of the project.
The condition for World Bank participation inthe project was to set up an institutional systemaimed at reversing the oil curse and promotingeconomic development. The key innovative featureof the project was the establishment of a legalframework that earmarks money for povertyreduction expenditures, and the creation of acommittee (the Collège) to act as a ‘watchdog’ byapproving projects and monitoring the quality oftheir implementation. Money must be directedtoward strategic sectors, the region of Doba and theFunds for Future Generations. However, only a partof the oil money was supposed to go to thewatchdog. All ‘indirect revenues,’ includingincome tax on oil companies, are instead supposedto go directly into government coffers. It is tooearly to declare whether the Chad experiment is afailure or a success. A success implies a strongpolitical will from the government, a strongimplication of the Chadian civil society forwatching the flow of oil money and its utilization,and the actual ability of the judiciary to prosecutecases of misuse, fraud or corruption. The role ofexternal actors is also important to guarantee thesuccess: the World Bank, the InternationalMonetary Fund, the United States and FrenchGovernments can be important sources of pressurefor greater transparency and accountability. Thistype of setup could have represented the first steptowards a better way of thinking about therelationship between oil and economicdevelopment. It emphasizes the importance oftransparency for all financial flow related to oilbusiness.
This set up is in line with the ExtractiveIndustry Transparency Initiative, which is trying toobtain from public and private entities acommitment to promote more transparency infinancial flow. A number of governments andcompanies are now participating to this initiative.In Africa, Ghana, Nigeria, Congo and Gabon allparticipate in the initiative. It shows that progressescan be achieved towards more transparency. InNigeria, after a long succession of military leaderseager to tap the nation’s wealth for themselves, thenew president decided in 2003 to ‘clean house’. Hecreated a financial-crime investigation unit, whichis actively working.
8.1.4 Latin America: between stronggovernment control and a competitive market
With 8.5% of the world population, 530 millionpeople, Latin America accounts for 6% of worldprimary energy consumption. Its contribution tothe world energy production is 14% for oil and 6%for natural gas.
Regarding oil production and exports, the twomajor players are Mexico and Venezuela, the latterbeing an important and influential OPEC member.Other significant players are Colombia, Ecuador(who left OPEC in 1995) and Argentina. The caseof Brazil, the largest country of the area with 174million inhabitants is interesting; the countryproduces significant volumes of oil and gas, but itneeds to import. One of Brazil’s specifications wasthat biofuels made from sugar cane were to beincreasingly developed. These biofuels representroughly 50% of the automotive fuel used byautomobiles, trucks and buses in Brazil.
For natural gas, the major exporters are Trinidad and Tobago, Argentina and Bolivia.Trinidad and Tobago exports 4 billion m3 per yearof LNG, mainly to the United States market.Bolivia, with its huge natural gas resources thatcan be monetized, dramatically illustrates thegeopolitics of a gas rich country.
Latin America is a region of political tensionsfrom the North (Mexico) to the South (Argentina).The recent economic crisis and the difficultiesencountered by liberalization have exacerbatedpolitical struggles, weakened coalitions, andstrengthened populist movements and nationalistclaims. Presidents Lula da Silva in Brazil andChavez in Venezuela are the emblematic figures of
416 ENCYCLOPAEDIA OF HYDROCARBONS
PRODUCER-EXPORTER COUNTRIES
Nationalism-populism. Nationalism is frequentlyassociated with local willingness to lessen thepolitical, commercial and cultural influence of theUnited States. The region is facing real difficultiesfor attracting investments. Foreign directinvestments have decreased in most countriesbetween 2000 and 2004. Investment is the keyeconomic issue in all these countries andgovernments hesitate deciding the place to begiven to market mechanism versus governmentcontrol. The situation varies from almost completeopening (Argentina) to total closure (Mexico).Governments are also proposing solutions thatinvolve both public and private investmentparticipation in energy sector development. Asgovernments throughout Latin Americaincreasingly look toward public-privatepartnerships, many questions remain. What dothese partnerships offer to private investors? Whatis the benefit for the host government? Do thesepartnerships offer a stable environment for long-term investments? These are the central questionsfor the geopolitics of oil and gas in Latin America(CERA, 2004).
Wealth deriving from oil and gasAs compared to Africa and the Middle-East, oil
and gas exporting countries from Latin Americaare less dependant on oil and gas revenues. Theserevenues account between 9% and 53% of totalfiscal revenues (53% for Venezuela) and between2% and 14% of GDP. However, many of thesecountries do not escape the oil curse in terms ofeconomic development and social indicators.
Most Latin American oil and gas exportingcountries have significant potential for newdiscoveries, onshore and offshore. Many countrieshave been insufficiently explored. In term of oilproduction, one of the most spectacular increaseswill come from Brazil where substantialdiscoveries, mostly offshore, have already beenmade.
In other countries, the evolution of theproduction will depend on the quality of fieldmaintenance and, much more importantly, on theamount of money that will be invested inExploration and Production (E&P) activities.Boosting the investments necessarily impliesopening the country to international investors, apolitical attitude which directly hurts nationalismand populism. In Venezuela, field maintenance hasbeen severely damaged by the oil strike of 2003and the ‘reorganization’ of the oil sector. Venezuelahas a large potential for developing its extra-heavyoil resources, and also natural gas resources could
be exported in the form of LNG. However, theassociated investments are huge. The Mexican caseis similar in certain respects. Mexican potential foroil and gas seems promising, but not enoughinvestments are made in E&P activities. Also, thecountry remains closed to international investorsbecause, according to the Constitution, naturalresources belong to the Mexican people.
The case of Bolivia, one of the poorestcountries in the area is different. Bolivia has beenexporting gas (to Argentina) since 1972. Then in1994, the country’s energy sector opened to privateinvestment and attracted a number of internationalcompanies; exploration was successful. In 1997,gas reserves (proven, probable and possible) wereestimated to be 278 billion m3 and a gas line wasbuilt to export gas to Brazil (1999). In 2002, gasreserves were revaluated at 2,185 billion m3 andthey could be much larger. Gas production andexports became major national political issues.Bolivian gas production could be substantiallyincreased, but the domestic market is small(although gas is important for power generationand automotive fuel), and there have been gasproduction increases in Argentina and Brazil. Thesolution would be to export gas to the worldmarket in the form of LNG, but Bolivia has nodirect access to the Pacific; it has to be negotiatedwith Chile or Peru. Therefore, huge discoveries ofnatural gas in a small country (9 millioninhabitants) become a domestic and internationalpolitical problem. The country is divided on thisquestion, which could lead to a national ‘gas war’.
How oil and gas revenues are usedSocial expenditures are a priority for most
governments of Latin America. They also have tofinance the functioning of overstaffedadministrations. Governments’ financial needsmaintain a permanent fight to increase their takeon profits from oil and gas production. In Boliviaand Venezuela, fiscal conditions on foreigninvestors were changed unilaterally. Thedevelopment of Orinoco belt extra-heavy crudewas made possible by a provisional tax exemption;but at the end of the period, royalties on extra-heavy oil rose from 1% to 16.6%. The permanentsearch for oil money is also a constant fightbetween governments and national state-ownedcompanies: such as PDVSA in Venezuela, Pemexin Mexico, Petrobras in Brazil, YPFB in Bolivia,and Petroecuador in Ecuador.
National oil companies symbolize the oilexpertise and sovereignty that has been acquired inthese countries following long periods of
417VOLUME IV / HYDROCARBONS: ECONOMICS, POLICIES AND LEGISLATION
GEOPOLITICS OF OIL AND GAS EXPORTING COUNTRIES
domination by international oil companies; yet,these national oil companies are also governments’cash cows. Some of these companies havedeveloped great ambitions to undertake E&P, notonly in their own countries but also internationally.Petrobras and PDVSA are present in manycountries in Latin America and outside. In order tomeet their ambitions, the companies need money,but part of their financial resources is under thegovernments’ control. They can become verypowerful industrial and financial entities,independent from the political power, albeitstate-owned. The stake is oil money: the proportionsshared between the government and the company,and the amount of money that has to be left to thecompany for domestic and internationalinvestments. Along with the shared proportions ofoil money, and with urgent government need, apiece of the ‘pie’ must also be reserved for thefuture, which is directly dependent on theinvestments that are made (or not made) now.
This fight for oil money is illustrated by theVenezuelan strikes in 2002-03. President HugoChavez, a former army lieutenant and populistleader won the presidential elections in December1998 with over 56% of the votes. In February2002, Chavez’s opponents staged a coup d’étatthat failed. In December 2002, the country wascrippled by a ten-day strike in opposition toChavez. On the opposition side were themanagement and employees of PDVSA. A strikein the company paralyzed Venezuelan oilproduction for several months. Chavez broke thestrike, with popular support. He changed PDVSA’smanagement and fired 16,000 oil workers. Thestrike seriously damaged the human resources ofthe company and a number of oil fields. Behindthe case the question of domestic oil investmentremains.
Oil money has been used to finance socialexpenditures, but also to diversify the economy inMexico, Colombia, Bolivia and Brazil. In thesefour countries, oil and gas exports represent areasonable share of total exports. The Mexicaneconomy as a whole has significantly reduced itsdependence on oil revenue over the two pastdecades with oil exports falling from almost 70%of Mexico’s total exports in the early 1980s toroughly 15% in 2003. Mexico’s membership of theNorth American Free Trade Agreement (NAFTA)has been an important factor for the developmentof export-oriented industries (Giugale et al., 2001).On the contrary, Venezuela remains stronglydependent on oil resources and dramaticallyillustrates the oil curse.
Part of the oil money is also left to thepopulation under the form of subsidies.Automotive fuels, kerosene, butane and sometimeselectricity public prices are well belowinternational prices. In Venezuela in December2004, the prices of super gasoline and diesel wererespectively 4 and 2 cents of dollar/l, as comparedto an international price of 37 cents. In Mexico,during 2004-05, high oil and natural gas pricesbrought additional funds to the government, butthey also had negative effects. Mexico’s natural gasprice-setting mechanism, based on a US referencemarket since 1995, has generated significantdiscontent among Mexico’s consumers, followingthe dramatic surge in US natural gas prices. In2005, the Mexican government decided to increasesubsidies on gas and electricity tariffs a fewmonths before the presidential elections (CERA,2005).
Among large oil and gas exporting countriesfrom Latin America, Mexico has achievedincreased economic development, which is highlyrelated to its exports to the United States. Othercountries, such as Venezuela, Bolivia, Colombia,and Ecuador, are still at a low level of economicdevelopment and suffer from the oil curse.Bolivia’s external debt increased 17% in 2003,reaching 5 billion dollars, the highest figure in thepast 10 years.
Typologies of governanceInternal and external governance are key
elements for understanding the geopolitics of oiland gas exporting countries in Latin America.There are national political tensions, tensionsbetween neighboring countries, and tensions on theinternational scene because Latin America isviewed as a stake for the United States, China,Europe, and international oil companies (CERA,2004).
From Mexico to Argentina, Latin Americancountries have their own domestic conflicts.Military elites are still principle figures, butcurrent conflicts concern more the disputesbetween those who have been called “a factionaloligarchy” (Auty and Gelb, 2001) and the greatmass of the poor, who are sensitive to populistslogans. Both opposing factions share a strongnationalism, even if the factional oligarchy is muchmore positive concerning the country’s opening upto international investors. In Mexico, PresidentFox, from the pro-business National Action Party(PAN), did not obtain from Congress anysignificant opening of his country to foreigninvestments in the energy sector. The opposition
418 ENCYCLOPAEDIA OF HYDROCARBONS
PRODUCER-EXPORTER COUNTRIES
between left and right is often exacerbated in thewestern part of Latin America by regional claimsand the growing demands of the Andean Indians’communities.
The political situation of Bolivia provides adramatic example of these oppositions. Increasingpoverty and unemployment were responsible forgrowing social unrest, and brought down Sanchezde Lozada’s government. In October 2003, Sanchez de Lozada resigned and was replaced byVice President Carlo Mesa. In this context, themonetization of gas reserves became a criticalnational issue. The first change in the hydrocarbonlaw increased the government’s hold on the sector.This change was not enough for thesocialist-populist opposition led by Evo Morales,and a referendum on the future of the country’s gasreserves was organized in July 2004. Its positiveresults, which approved a reinforcement of statecontrol over gas resources, opened the path towardnew tax and royalty increases. In April 2005,Bolivia’s Senate authorized a new hydrocarbon lawthat established steeper taxes for foreign oil andgas operators. Gas money crystallizes all thepolitical factions: the populist movement, theIndian communities, the provinces where gas islocated, the unions, and also the army. Theinternational companies that operate gas fieldshave some difficulties regarding this new situation.Companies operating in Bolivia are BrazilianPetrobras (leading operator), French Total, BritishBG and BP, Spanish Repsol. The political situationis still aggravated by the fact that Brazil has notpaid its gas bill to Bolivia, with arrears of 250million dollars (2005).
Another form of a political fight revolvingaround oil and gas money is the question ofrelationships between governments and the state-oil companies. We have already mentioned the caseof Venezuela, in which President Chavez destroyedthe desire of autonomy of PDVSA. The situation isdifferent in Mexico, where Pemex’s expendituresare controlled by the Congress. Pemex hands over60% of its revenues to the government andCongress decides how much it can spend. Withoutside investments barred by the Constitution,neither Pemex, nor Comision Federal deElectricidad (CFE) are likely to have the abilityalone to meet Mexico’s long-term energyinvestments requirements for oil, natural gas andelectricity. In the end, someone must pay the risingenergy cost. Ultimately, Mexico’s taxpayers willbear this cost, as energy subsidies reduce theamount of money available for other worthyprograms.
The international indexes of public governanceare unevenly distributed. Brazil and Columbia arein a rather good position, but Venezuela appears tobe the most corrupted country with the lowestindex of economic freedom (Table 4).
As far as external governance is concerned, thefirst question concerns the relationships betweenneighboring countries. Relationships are not stable.There are some dreams of economic integrationbetween countries of the Southern Cone; but whenthe economic situation is poor, national egoismspredominate. There is also a sort of rivalry forLatin America leadership and zones of influencebetween Mexico and Brazil.
Once again, Bolivia illustrates the SouthAmerican patchwork. The only way to monetizerapidly its huge gas resources would be to build agas line to a Pacific port (in Chile or Peru) and aLNG plant to have access to the large andexpanding Pacific market, mainly Mexico and theUnited States. However, this project is politicallyvery sensitive. Bolivia’s relations with Chile havebeen tense since the end of the Nineteenth century.In 1884, Bolivia lost the Pacific War with Chileand, with it, its entire costal area, leaving Bolivia alandlocked nation. In 2001, the two governmentsstarted informal discussions about the LNGproject. This discussion has reawaken Bolivia’saspiration to regain access to the sea. In July 2002,protesters took the street in order to expressopposition to an LNG deal which could bebeneficial for Chile.
On the north-eastern side of the Southern Cone,the relationships between Colombia and Venezuelaare fluctuating. President Chavez was envisagingbuilding an oil pipeline through Colombia in orderto gain access to the Pacific Ocean for exportingoil to Asia. It would be deliberately detrimental forVenezuelan exports to the United States anddeliberately beneficial to China. Also, therelationships between the countries of the area aresensitive to the question of drug production andnarcotics trading. Drugs production has partlymigrated from Bolivia to Columbia, and now toVenezuela.
In 2005, populism and nationalism are the twobasic values shared by most Latin Americancountries. Presidents Lula da Silva and Chavez,although very different, are symbols of theconsensus. In 2005, President Chavez initiated anagreement on energy cooperation betweenVenezuela, Brazil and Argentina. He evenproposed an unrealistic merger between threecountries’ state-owned oil companies. Onecomponent of this consensus is to reduce the
419VOLUME IV / HYDROCARBONS: ECONOMICS, POLICIES AND LEGISLATION
GEOPOLITICS OF OIL AND GAS EXPORTING COUNTRIES
political, economic and commercial influence ofthe United States and to increase oil and gasprices. Washington accuses Caracas destabilizingthe area, and the US State Department worriesabout Venezuela militarization, following massivepurchases of weapons from Russia, Brazil andSpain. The Chinese are present in the area not onlyfor oil, but also for steel, copper, and iron ore.Latin America could symbolize the UnitedStates/China conflicting interests for the access tonatural resources.
For Latin America’s economic future, the keyquestion is, once more, the issue of investments.For the energy sector (oil, gas and electricity), it isneither feasible, nor desirable, to finance thesector’s necessary expansion of public funding.Attracting international investors is the majorchallenge, even though it deeply hurts nationalistbeliefs. For Latin American governments, thedifficulty is to find the right balance betweenattracting investors and retaining control of majorstrategic choices. Public-private partnerships are animportant step in this direction; for internationalinvestors, however, the overall political, fiscal andregulatory risks remain high in many cases. Thevicious cycle of reforms has to be broken in orderto avoid the politicians’ repetitive promise that‘after this next change, the rule will be stable’.Each Latin American country needs to set up anappropriate and stable legal, fiscal, and regulatoryframework, which attract investors whilesafeguarding public interest. It is not only an issuefor the appropriate energy supply of the future butalso for increasing the wealth of these countries.
Bibliography
Abadie A. (2004) Poverty, political freedom and the roots ofterrorism, National Bureau of Economic Research, WorkingPaper Series 10859.
Anaman K.A., Mahmod T.H. (2003) Determinants of supplyof non-oil exports in Brunei Darussalam, «ASEANEconomic Bulletin», 20, 144-157.
Askari H. et al. (1997) Economic development in the GCC.The blessing and the curse of oil, Greenwich (CT)-London,Jai Press.
CERA (Cambridge Energy Research Associates) (2004)Southern cone rebound caught between internal weaknessesand external uncertainties.
Chatelus M. (2001) La situation économique des paysproducteurs de pétrole de la peninsule arabique, «MondeArabe Maghreb Machrek», 174, 58-64.
Chevalier J.-M. (2004) Les grandes batailles de l’énergie,Petit traité d’une économie violente, Paris, Gallimard.
Chevalier J.-M. (2004) Énergie et environnement: des paradoxesexplosifs, in: Chevalier J.-M., Mistral J. (sous la direction
de) La raison du plus fort: les paradoxes de l’économieaméricaine, Paris, Laffont, 143-161.
Cordesman A.H. (1999) Geopolitics and energy in the MiddleEast, Washington (D.C.), Center for Strategic andInternational Studies.
DOE (US Department of Energy)/EIA (US Energy InformationAdministration) (2005) OPEC revenues fact sheet,Washington (D.C.), January.
Eifert B. et al. (2003) Managing oil wealth, «Finance &Development», 40, 40-44.
Evehart S., Duval-Hernandez R. (2001) Management ofoil windfalls in Mexico. Historical experience and policyoptions for the future, World Bank, Policy Research Paper2592.
Gary I., Reisch N. (2004) Chad’s oil: miracle or mirage?,Washington (D.C.), Catholic Relief Services and BankInformation Center.
Henry C.M., Springborg R. (2001) Globalization and thepolitics of development in the Middle East, Cambridge,Cambridge University Press.
IEA (International Energy Agency) (2003) South americangas: daring to tap the bounty, Paris, Organization forEconomic Cooperation and Development/IEA.
Kochhar K. et al. (2005) What hinders investment in the oilsector?, International Monetary Found Research Department.
Roslan A.H. (2001) Globalisation income inequality anddevelopment policy. The case of Malaysia, in: Poverty andsustainable development. Pauvreté et dévelopment durable.Colloque organisé par la Chaire UNESCO, Paris, 22-23Novembre.
Rosser A. (2004) Why did Indonesia overcome the resourcecurse?, Institute of Development Studies, Working Paper222.
Shachmurove Y. (2004) Economic development in the MiddleEast, Penn Institute for Economic Research, Working Paper04-022.
References
Alnasrawi A. (2002) Iraq’s burdens: oil, sanctions andunderdevelopment, London, Greenwood.
Auty R.M. (2001) A growth collapse with high rent pointresources: Saudi Arabia, in: Auty R.M. (edited by) Resourceabundance and economic development, Oxford, OxfordUniversity Press, 193-207.
Auty R.M., Gelb A.H. (2001) Political economy of resource-abundant states, in: Auty R.M. (edited by) Resourceabundance and economic development, Oxford, OxfordUniversity Press, 126-145.
Birdsall N., Subramanian A. (2004) Saving Iraq from itsoil, «Foreign Affairs», 83, 77-89.
BP (British Petroleum) (2004) Statistical review of world energy,16 June.
CERA (Cambridge Energy Research Associates) (2004) TheSouthern Cone’s uneven path toward recovery.
CERA (Cambridge Energy Research Associates) (2005) Mexicoon the rise: high energy prices fuel economic and politicaltensions.
Charillon F. (2003) Les dramatiques continuités du Moyen-Orient, «Questions Internationales», 1, 6-14.
420 ENCYCLOPAEDIA OF HYDROCARBONS
PRODUCER-EXPORTER COUNTRIES
Copinschi P. (2003) Rente pétrolière, géopolitique et conflits,«Questions Internationales», 2, 39-47.
Destanne de Bernis G. (1971) Les industries industrialisanteset les options algériennes, «Revue Tiers Monde», 47, 545-563.
DOE (US Department of Energy)/EIA (US Energy InformationAdministration) (1971-2003) OPEC revenues fact sheet,Washington (D.C.).
ESMAP (Energy Sector Management Assistance Programme)(2005) The impact of higher prices on low income countriesand on the poor, ESMAP Formal Report 299/05.
Giugale M.M. et al. (2001) Mexico: a comprehensivedevelopment agenda for the new era, Washington (D.C.),World Bank.
Gylfason T. (2001) Natural resources and economic growth:from dependence to diversification, in: Proceedings of theexpert group meeting on economic diversification in theArab World organized by the United Nations in cooperationwith the Arab Planning Institute, Beirut, 25-27 September.
IMF (International Monetary Fund) (2004) Draft guide onresource revenue transparency, 15 December.
Joly E., Beccaria L. (2003) Est-ce dans ce monde là que nousvoulons vivre?, Paris, Arènes.
Mahani Z.A. (2001) Competitive industrialization with naturalresource abundance: Malaysia, in: Auty R.M. (edited by)Resource abundance and economic development, Oxford,Oxford University Press, 147-164.
Mahdavy H. (1970) The patterns and problems of economicdevelopment in rentier states: the case of Iran, in: CookM.A. (edited by) Studies in economic history of the MiddleEast from the rise of Islam to the present, London, OxfordUniversity Press, 428-467.
Ross M.L. (2001) Does oil hinder democracy?, «World Politics»,53, 325-361.
Sachs J.D., Warner A.M. (2001) The curse of naturalresources, «European Economic Review», 45, 827-838.
Sala-i-Martin X., Artadi E.V. (2003) Economic growth andinvestment in the Arab World, in: Arab competitivenessreport 2002-2203, Génève, World Economic Forum, 22-33.
UNCTAD (United Nations Conference on Trade andDevelopment) (2003) UNCTAD handbook of statistics 2003,New York-Génève, UNCTAD.
UNDP (United Nations Development Programme) (2004)Human Development Report 2004: cultural liberty in today’sdiverse world, New York, UNDP.
World Bank (2004) World development indicators 2004.
Jean-Marie ChevalierMarie-Claire Aoun
Centre de Géopolitique de l’Énergieet des Matières Premières
Université Paris-DauphineParis, France
421VOLUME IV / HYDROCARBONS: ECONOMICS, POLICIES AND LEGISLATION
GEOPOLITICS OF OIL AND GAS EXPORTING COUNTRIES
