examining the enrollment and dropout rates of urms in...
TRANSCRIPT

1
Examining the Enrollment and Dropout Rates of URMs in STEM Courses at UC Berkeley
Jennifer Be
Hannah Broïdo
Pui Fung Lam
Jong Ha Lee
Research Question
Our research question centers around the topic of ‘weeder courses’ as a potential contributor to
the lack of diversity in STEM fields at the undergraduate level at UC Berkeley. We divided our
question into two parts. The first part centers around quantitatively analyzing the dropout and
enrollment rates within several ‘weeder courses’ (as well as several control courses), specifically
analyzing any disproportions that may exist between underrepresented minorities (URMs) and
other demographic groups. The second part focuses on qualitatively analyzing potential factors
that may contribute to the disproportion of dropout rates in introductory ‘weeder’ STEM courses,
both through literature reviews and through interviews with students and professors of ‘weeder’
courses.
Part 1
Weeder Courses
‘Weeder’ courses is a term commonly used by many UC Berkeley students to describe
introductory STEM courses in the College of Letters & Sciences. For the purpose of our
research, we have defined a ‘weeder course’ as a College of Letters & Sciences lower division
major prerequisites possessing the following characteristics:
1. Possesses a large class size which includes many students interested, but not declared, in
pursuing a major that specifically requires completing the weeder course successfully
2
2. Are adequately difficult to determine whether one can successfully continue the major
3. And overall, results in many student that not only drop out from the prerequisite course,
but more importantly, “drops out” from declaring a certain major itself
Based on this definition and student interviews, we identified the following ‘weeder’ courses,
along with the course progression, to analyze:
1. Biology 1A
2. Chemistry 1A Chemistry 3A Chemistry 3B
3. Computer Science 61A Computer Science 61B Computer Science 61C
4. Physics 8A Physics 8B
(See Data Appendix at end of paper for more information on each course)
The control ‘nonweeder courses’ that we identified are:
1. Engineering 7
2. Engineering 25
3. International & Area Studies 45
(See Data Appendix at end of paper for more information on each course)
We purposefully chose to exclude Engineering courses from ‘weeder courses’ (and include it as
a control course) as we did not believe that it fit with our ‘weeder courses’ definition. Students at
UC Berkeley are accepted into a specific college (e.g. College of Engineering or College of
Letters and Sciences) and it is very hard to switch between colleges. We made the assumption
that the College of Engineering was much more likely to have already ‘weeded’ out many high

3
school seniors from underrepresented minorities. Furthermore, the College of Engineering does
not need to ‘weed’ students out it accepts only the number of that it has the resources.
Method
We obtained data from the Berkeley Institute for Data Science (BIDS) for enrollment rates of
various demographic groups in the courses listed above from Week 0 Week 17. The
demographic groups listed in our data were: African American, Asian, Chicano / Latino, Decline
to State, International, Native American / Alaska Native, Pacific Islander and White.
Furthermore, the data was disaggregated between Female, Male and Decline to State. We
combined the enrollment numbers into five categories (selected out based on literature reviews
and feedback from graduate student mentors):
1. Male nonURMs
2. URMs
3. Female
4. Overall
5. Female URMs
URMs were defined as belonging to the following demographic groups: African American,
Chicano / Latino, Native American / Alaska Native and Pacific Islander. In order to analyze and
compare the dropout rates within these different demographic groups, we normalized the
enrollment numbers in Week 0 to 1, and then divided the enrollment numbers in each group in
Weeks 117 by the enrollment number in Week 0. This enabled us to clearly see the dropout
rates in each demographic group, and to compare these dropout rates.

4
Results
Discussion
In our definition of a “weeder course”, we managed to find consistent trends in our data. In our
selected weeder courses, the high dropout rates for underrepresented minorities and female
underrepresented minorities are consistent throughout our graphs (see data appendix). This
common theme in our data further proves that weeder courses results in the lack of diversity in
STEM fields. In addition to being in a competitive and difficult course, URMs could face
societal and psychological factors that other students that might not apply to them. Some of these
factors are further discussed in part 2, the qualitative part of our research.
Results

5
From our graphs (see data appendix), we found a correlation between higher dropout rates in
weeder courses and underrepresented minorities. The gradients in dropout rate for weeder
courses are much steeper than in our control courses. In contrast to our weeder courses, in which
male nonURMs consistently rank high on the normalized scale, they drop the most in E 7 and
IAS 45. From the data given, we made analysis on dropout rates and now have substantial
evidence to support our thesis.
Part 2
The second part of our research project was primarily focused on finding qualitative reasoning
for the trends that we observed through our data analyses. As mentioned in Part 1’s discussion,
our results highlight a big disproportionately in dropout rates for URMs, specifically for female
URMs. We therefore wanted to understand some of the potential factors that may have been
contributing to this.
Method
We decided to use the snowball interviewing methodology, whereby we started out interviewing
primarily URM but also nonURM students who had enrolled in identified weeder courses, and
then asked them for referrals to other students they may know. A total of 6 students and a
professor teaching a ‘weeder course’ were interviewed. The students identified themselves in the
following ways:
1. AfricanAmerican Male, enrolled and completed Chem 1A and Physics 8A
2. Chicano Female, dropped out of Chem 1A
3. AfricanAmerican Male, dropped out of Physics 8A

6
4. AfricanAmerican Female, dropped out of Bio 1A
5. NonURM Male, enrolled and completed Chem 1A
6. NonURM Female, dropped out of CS 61A
The interviews were all carried out in person. There were guideline questions for interviewers to
follow, but all interviews were done in a fluid format based on the interviewee’s answers.
Results
These common themes came out from our student interviews:
1. The innate difference in background and resources
a. Welloff background of majority groups vs. underprivileged background of
minority groups, and the lack of support for the latter especially in STEM courses
2. Lack of representation for minorities
a. Includes both being unaware of the other fellow minority groups present in the
class, and simply not having enough minorities in STEM courses
b. According to a recent Daily Californian article, “UC Berkeley’s faculty diversity
falls well behind the relative diversity of California’s population, and recent
campus reports show that it also lags behind diversity in the academic job
market.”
3. Sheer difficulty of the course
a. Dropouts not only due to midterm scores, but also the speed and quantity of
content covered in introductory STEM courses
b. Traditional lecture courses are typically packed in content and are not intended to actively engage students
From the results, it appears that the adverse effects of chemistry courses experienced by many of

7
the URM students leads directly to these students questioning their own ability to continue to
pursue a medical career, and as a consequence dropping medicine as a possible career trajectory
(The Turning Point) .
We also noticed that male URMs versus female URMs opinions differed greatly. Female URMs
were more likely to talk about lack of “empowerment” and “representation” in the weeder
courses they took, while male URMs and nonURMs focused primarily on time management and
exploring different options, not necessarily experiencing difficulty in terms of support groups or
representation.
The professor teaching a “weeder course” made the following observations:
1. Weeder courses must have the intent of weeding out students, otherwise they should just
be considered hard classes with challenging course material.
2. URM students do not utilize resources such as office hours and student learning center
a. The professor hypothesized that this may primarily be due to high school
experiences URMs may have attended high schools with little resources and
may therefore not have the experience and confidence to utilize resources
available to them in college.
3. Students are used to getting As in high school and may therefore be dropping out as they
consider Bs and Cs to be bad grades, when in fact they should be considered very
respectable grades at Berkeley.
4. Although the gender of course GSIs is representative of students, they are very rarely
URM GSIs.
Discussion

8
Several possible bandaid solutions emerged from our interviews:
1. Miniintroductory STEM courses
a. Especially for those coming from an undereducated background who have had
little or no exposure to the difficulty of introductory STEM courses at Berkeley
b. Example: Chemistry P offered by the Student Learning Center (SLC)
2. A welldeveloped resource on finding fellow URMs in STEM courses
a. Mentors who have already took the course, fellow students in the course, etc
3. Ability test in weeder courses to assign discussion sections
4. Increased diversity amongst GSIs / course TAs
The combination of these solutions led us to ask ourselves the following questions:
Are these resources / solutions already available? Are they publicized and made aware of
to URMs? Why do we constantly see this problem of “lack of resources”?
Are the problems minorities face with STEM courses attributed to their predisposed
backgrounds, lack of support from the University, or both?
There are a few programs targeted toward minority students, but to what extent are they
effective? How can we scale them?
Conclusion
In conclusion, our data analysis demonstrated the disproportion of retention rates in individual
STEM courses and STEM major course progressions. Female URMs suffered the greatest
dropout rates, while Male nonURMs had the lowest dropout rates. This trend was consistent
throughout the biggest “weeder courses” at UC Berkeley Biology 1A, Chemistry 1A, Computer
Science 61A and Physics 8A. We led inperson snowball interviews with students from a variety

9
of demographic groups and a professor of a “weeder course” in order to gain a qualitative
understanding of the reasons or factors behind this trend. Next steps may entail experimenting
potential solutions provided in this paper and delving further into where exactly lies the problem:
awareness, support or initiative?
10
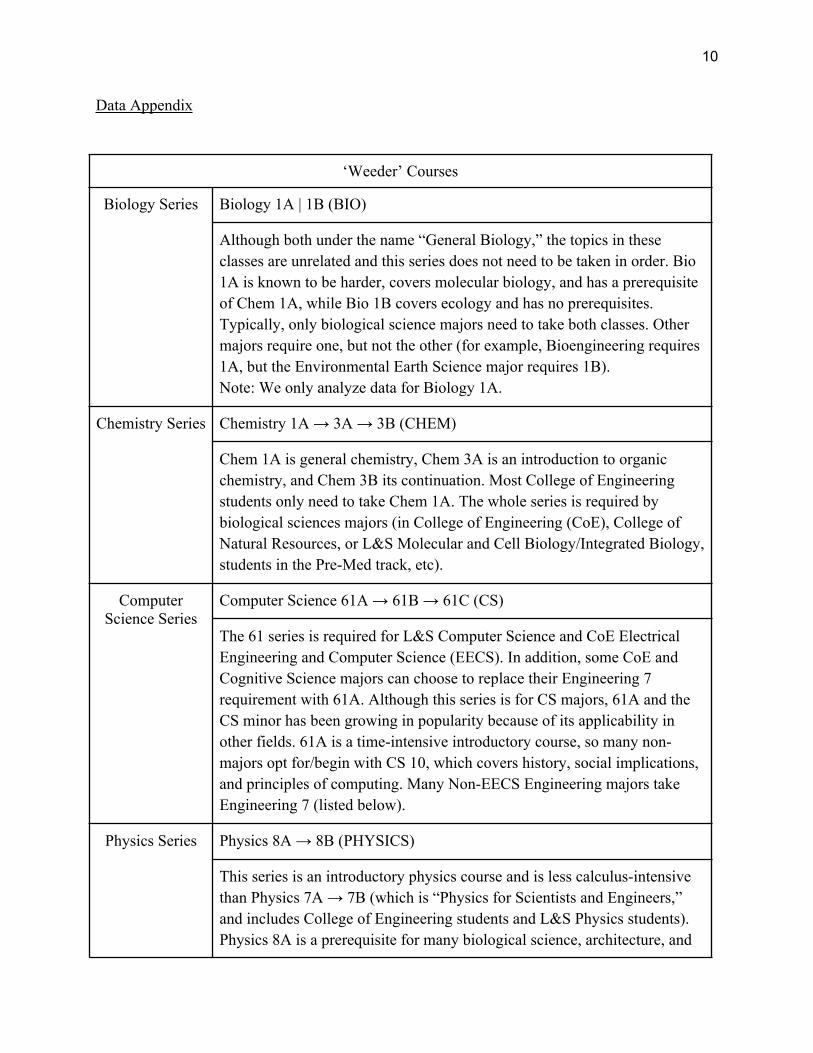
Data Appendix
‘Weeder’ Courses
Biology Series Biology 1A | 1B (BIO)
Although both under the name “General Biology,” the topics in these classes are unrelated and this series does not need to be taken in order. Bio 1A is known to be harder, covers molecular biology, and has a prerequisite of Chem 1A, while Bio 1B covers ecology and has no prerequisites. Typically, only biological science majors need to take both classes. Other majors require one, but not the other (for example, Bioengineering requires 1A, but the Environmental Earth Science major requires 1B).Note: We only analyze data for Biology 1A.
Chemistry Series Chemistry 1A → 3A → 3B (CHEM)
Chem 1A is general chemistry, Chem 3A is an introduction to organic chemistry, and Chem 3B its continuation. Most College of Engineering students only need to take Chem 1A. The whole series is required by biological sciences majors (in College of Engineering (CoE), College of Natural Resources, or L&S Molecular and Cell Biology/Integrated Biology, students in the PreMed track, etc).
Computer Science Series
Computer Science 61A → 61B → 61C (CS)
The 61 series is required for L&S Computer Science and CoE Electrical Engineering and Computer Science (EECS). In addition, some CoE and Cognitive Science majors can choose to replace their Engineering 7 requirement with 61A. Although this series is for CS majors, 61A and the CS minor has been growing in popularity because of its applicability in other fields. 61A is a timeintensive introductory course, so many nonmajors opt for/begin with CS 10, which covers history, social implications, and principles of computing. Many NonEECS Engineering majors take Engineering 7 (listed below).
Physics Series Physics 8A → 8B (PHYSICS)
This series is an introductory physics course and is less calculusintensive than Physics 7A → 7B (which is “Physics for Scientists and Engineers,” and includes College of Engineering students and L&S Physics students). Physics 8A is a prerequisite for many biological science, architecture, and

11
physical science majors.
‘NonWeeder’ Courses
Engineering Classes
Engineering 7 (E)
Except for EECS majors, E7 is required for all College of Engineering majors. It can be taken instead of CS 61A for Cognitive Science and some CoE majors. It covers the elements of programming using MATLAB, a programming language intended for numerical computing.
Engineering 25 (E)
Engineering 25, or Visualization for Design, is part one of a threepart series required for Mechanical Engineering majors. This threepart series is fairly new (Fall 2014) and is intended to replace the twopart series consisting of E10 and E28.
Other Control Classes
International & Area Studies 45 (IAS)
IAS 45, or Survey of World History, is readingintensive class that fulfills the L&S International and Area Studies requirement; however, it is typically taken by prospective Political Economy and Development Studies majors. For the Political Economy major, must be completed with a B or higher on the 1st attempt.
Chemistry Series

12

13
Computer Science Series

14

15
Physics Series

16

17
Bio 1A
Control: Non Weeder Courses Engineering 7 & IAS 45

18

19

20
Citations
Barr, Don, and John Matsui. "The" Turning Point" for Minority PreMeds: The Effect of Early
Undergraduate Experience in the Sciences on Aspirations to Enter Medical School of
Minority Students at UC Berkeley and Stanford University." (2008).
Chang, M. J., Sharkness, J., Hurtado, S., & Newman, C. B. (2014). What matters in college for
retaining aspiring scientists and engineers from underrepresented racial groups. Journal
Of Research In Science Teaching, 51(5), 555580. doi:10.1002/tea.21146
Olson, S., Riordan, D. G., & Executive Office of the, P. (2012). Engage to Excel: Producing One
Million Additional College Graduates with Degrees in Science, Technology,
Engineering, and Mathematics. Report to the President.Executive Office Of The
President,
Pauker, Madeleine. "UC Berkeley’s persistent lack of faculty diversity prompts efforts to address
issue." The Daily Californian. The Independent Berkeley Student Publishing Co., 12 Jul.
2015. Web. 28 Nov. 2015.