examination of the global warming potential of refrigeration...
TRANSCRIPT
Examination of the Global Warming Potential of Refrigeration in the Food Chain
EVIDENCE REVIEW FINDINGS
0.3
24 January 2011
The SKM logo trade mark is a registered trade mark of Sinclair Knight Merz Pty Ltd.
Examination of the Global Warming Potential of Refrigeration in the Food Chain
EVIDENCE REVIEW FINDINGS
0.3
24 January 2011
Sinclair Knight Merz Alberton House St Mary's Parsonage Manchester M3 2WJ United Kingdom Tel: +44 161 833 4883 Fax: +44 161 833 4761 Web: www.skmconsulting.com
COPYRIGHT: The concepts and information contained in this document are the property of Sinclair Knight Merz (Europe) Limited. Use or copying of this document in whole or in part without the
written permission of Sinclair Knight Merz constitutes an infringement of copyright.
LIMITATION: This report has been prepared on behalf of and for the exclusive use of Sinclair Knight Merz (Europe) Limited’s Client, and is subject to and issued in connection with the provisions
of the agreement between Sinclair Knight Merz and its Client. Sinclair Knight Merz accepts no liability or responsibility whatsoever for or in respect of any use of or reliance upon this report by any third party.

Evidence Review Findings
SINCLAIR KNIGHT MERZ
D:\Documents and Settings\jgalloway\My Documents\Work\DEFRA\Evidence Review\Evidence Review Findings v0 3.docx PAGE i
Contents
1. Introduction 1
2. Source Details 2
3. Summary of Findings 5
3.1. Direct Emissions Data 8
3.2. Indirect Emissions Data 9
3.3. Direct Emissions Reduction Opportunities 9
3.4. Indirect Emissions Reduction Opportunities 10
3.5. Direct Emissions Strategic Information 11
3.6. Indirect Emissions Strategic Information 11
3.7. Summary 12
4. Appendix – Sources Reviews 13
Evidence Review Findings
SINCLAIR KNIGHT MERZ
D:\Documents and Settings\jgalloway\My Documents\Work\DEFRA\Evidence Review\Evidence Review Findings v0 3.docx PAGE ii
Document history and status
Revision Date issued Reviewed by Approved by Date approved Revision type
0.1 Ray Gluckman Internal draft
0.2 Ray Gluckman Ray Gluckman 24/1/2011 Internal draft
0.3 24/1/2011 Ray Gluckman Ray Gluckman 24/1/2011 Draft
Distribution of copies
Revision Copy no Quantity Issued to
Printed: 24 January 2011
Last saved: 24 January 2011 11:57 AM
File name: D:\Documents and Settings\jgalloway\My Documents\Work\DEFRA\Evidence
Review\Evidence Review Findings v0.1.docx Author: Jane Galloway
Project manager: Jane Galloway
Name of organisation: Defra
Name of project: Examination of the Global Warming Potential of Refrigeration in the Food Chain
Name of document: Evidence Review Findings
Document version: 0.3
Project number: JC30160
Evidence Review Findings
SINCLAIR KNIGHT MERZ
D:\Documents and Settings\jgalloway\My Documents\Work\DEFRA\Evidence Review\Evidence Review Findings v0 3.docx PAGE 1
1. Introduction
This document provides a review of evidence related to the Defra research project “Examination of
the Global Warming Potential of Refrigeration in the Food Chain “. The evidence review was
carried out by SKM Enviros in the period November 2010 to January 2011.
The broad aim of the overall research project is to identify and quantify opportunities to reduce
greenhouse gas (GHG) emissions from refrigeration systems in the food chain. The research will
also examine drivers and barriers to the uptake of best practice and new technologies, and
recommend steps that can be taken to encourage GHG emission reductions by refrigeration users in
the food chain.
A key objective of the overall project is to provide Defra with an update of new evidence and
actions that have occurred since the FISS and Food 2030 reports were published. Therefore, the
first step of the project was to review existing evidence related to refrigeration in the food chain, in
particular energy use, resource efficiency, refrigerant leakage and uptake of new technologies to
give an overview of the environmental impact.
A review of the available literature has been carried out to establish the important sources of
evidence created in the last few years. A starting point was the FISS reports themselves and other
important Defra publications such as Food 2030. A review was then carried out of outputs from
relevant projects such as the FDF Refrigeration Efficiency Initiative, the Carbon Trust Retail
Refrigeration Roadmap and the IoR‟s Real Zero project. Discussions have been held with the
Steering Group, which includes representatives from FDF, FSDF, Dairy UK, IoR and the retail
sector, along with key academic institutions such as Brunel University, LSBU, FRPERC, to ensure
that all relevant evidence has been considered. Public statements made by large companies (e.g.
initiatives such as M&S “Plan A” or Cadbury‟s “Purple goes Green”) and by Trade bodies (e.g. the
FDF “5-Fold Plan” and BRC “A Better Retailing Climate”) have also been reviewed to provide
evidence of current activities.
This report summarises the findings of the evidence review carried out.
Evidence Review Findings
SINCLAIR KNIGHT MERZ
D:\Documents and Settings\jgalloway\My Documents\Work\DEFRA\Evidence Review\Evidence Review Findings v0 3.docx PAGE 2
2. Source Details
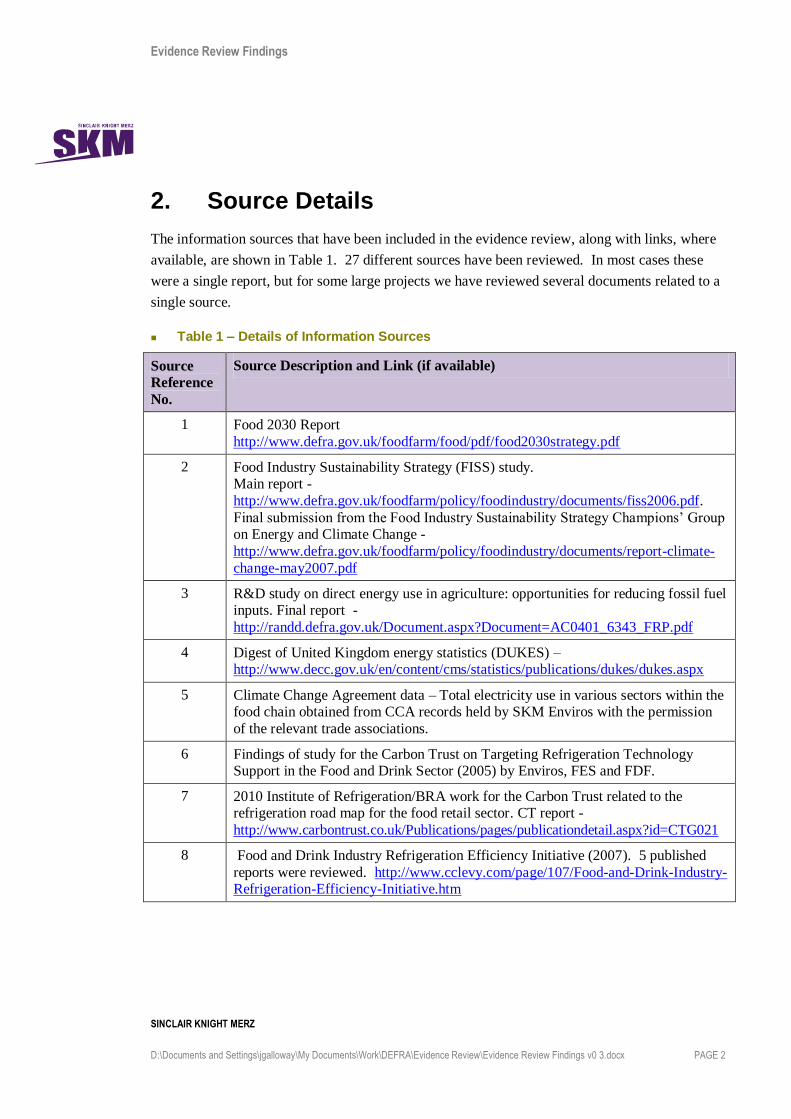
The information sources that have been included in the evidence review, along with links, where
available, are shown in Table 1. 27 different sources have been reviewed. In most cases these
were a single report, but for some large projects we have reviewed several documents related to a
single source.
Table 1 – Details of Information Sources
Source
Reference
No.
Source Description and Link (if available)
1 Food 2030 Report
http://www.defra.gov.uk/foodfarm/food/pdf/food2030strategy.pdf
2 Food Industry Sustainability Strategy (FISS) study. Main report -
http://www.defra.gov.uk/foodfarm/policy/foodindustry/documents/fiss2006.pdf.
Final submission from the Food Industry Sustainability Strategy Champions‟ Group on Energy and Climate Change -
http://www.defra.gov.uk/foodfarm/policy/foodindustry/documents/report-climate-
change-may2007.pdf
3 R&D study on direct energy use in agriculture: opportunities for reducing fossil fuel inputs. Final report -
http://randd.defra.gov.uk/Document.aspx?Document=AC0401_6343_FRP.pdf
4 Digest of United Kingdom energy statistics (DUKES) – http://www.decc.gov.uk/en/content/cms/statistics/publications/dukes/dukes.aspx
5 Climate Change Agreement data – Total electricity use in various sectors within the food chain obtained from CCA records held by SKM Enviros with the permission
of the relevant trade associations.
6 Findings of study for the Carbon Trust on Targeting Refrigeration Technology Support in the Food and Drink Sector (2005) by Enviros, FES and FDF.
7 2010 Institute of Refrigeration/BRA work for the Carbon Trust related to the refrigeration road map for the food retail sector. CT report -
http://www.carbontrust.co.uk/Publications/pages/publicationdetail.aspx?id=CTG021
8 Food and Drink Industry Refrigeration Efficiency Initiative (2007). 5 published
reports were reviewed. http://www.cclevy.com/page/107/Food-and-Drink-Industry-Refrigeration-Efficiency-Initiative.htm
Evidence Review Findings
SINCLAIR KNIGHT MERZ
D:\Documents and Settings\jgalloway\My Documents\Work\DEFRA\Evidence Review\Evidence Review Findings v0 3.docx PAGE 3
Source
Reference
No.
Source Description and Link (if available)
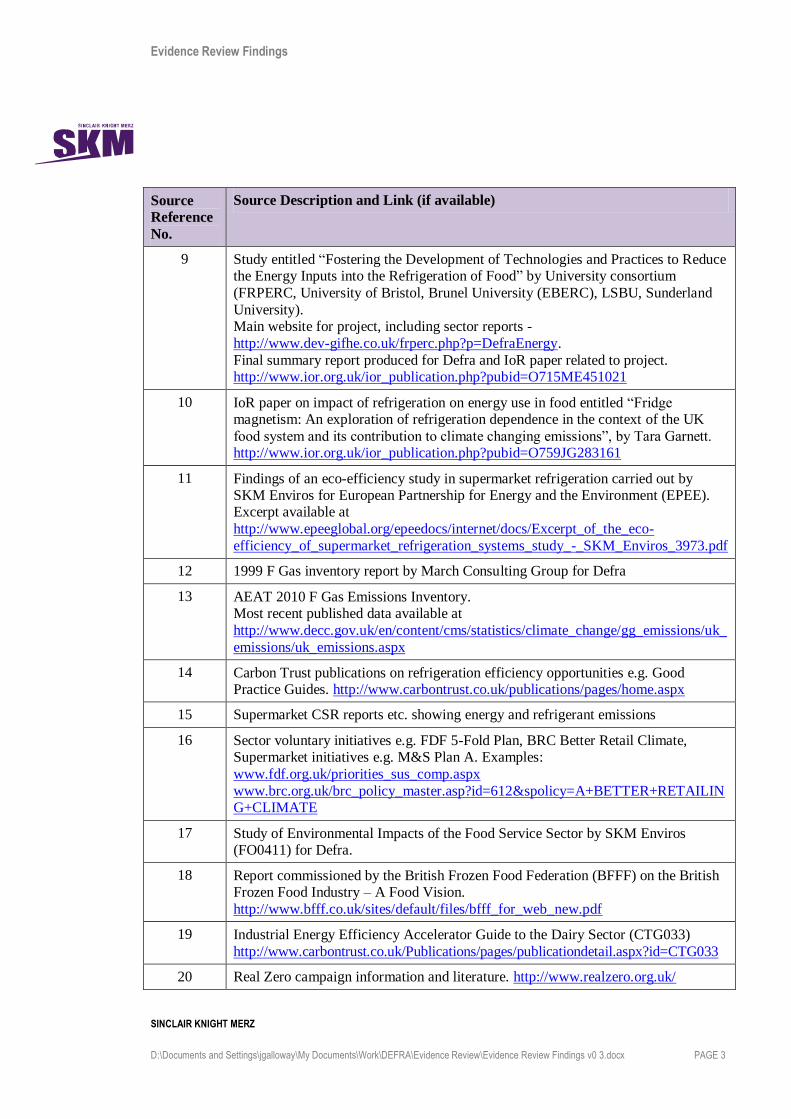
9 Study entitled “Fostering the Development of Technologies and Practices to Reduce the Energy Inputs into the Refrigeration of Food” by University consortium
(FRPERC, University of Bristol, Brunel University (EBERC), LSBU, Sunderland
University). Main website for project, including sector reports -
http://www.dev-gifhe.co.uk/frperc.php?p=DefraEnergy.
Final summary report produced for Defra and IoR paper related to project. http://www.ior.org.uk/ior_publication.php?pubid=O715ME451021
10 IoR paper on impact of refrigeration on energy use in food entitled “Fridge magnetism: An exploration of refrigeration dependence in the context of the UK
food system and its contribution to climate changing emissions”, by Tara Garnett. http://www.ior.org.uk/ior_publication.php?pubid=O759JG283161
11 Findings of an eco-efficiency study in supermarket refrigeration carried out by SKM Enviros for European Partnership for Energy and the Environment (EPEE). Excerpt available at
http://www.epeeglobal.org/epeedocs/internet/docs/Excerpt_of_the_eco-
efficiency_of_supermarket_refrigeration_systems_study_-_SKM_Enviros_3973.pdf
12 1999 F Gas inventory report by March Consulting Group for Defra
13 AEAT 2010 F Gas Emissions Inventory. Most recent published data available at
http://www.decc.gov.uk/en/content/cms/statistics/climate_change/gg_emissions/uk_
emissions/uk_emissions.aspx
14 Carbon Trust publications on refrigeration efficiency opportunities e.g. Good Practice Guides. http://www.carbontrust.co.uk/publications/pages/home.aspx
15 Supermarket CSR reports etc. showing energy and refrigerant emissions
16 Sector voluntary initiatives e.g. FDF 5-Fold Plan, BRC Better Retail Climate, Supermarket initiatives e.g. M&S Plan A. Examples:
www.fdf.org.uk/priorities_sus_comp.aspx
www.brc.org.uk/brc_policy_master.asp?id=612&spolicy=A+BETTER+RETAILING+CLIMATE
17 Study of Environmental Impacts of the Food Service Sector by SKM Enviros (FO0411) for Defra.
18 Report commissioned by the British Frozen Food Federation (BFFF) on the British Frozen Food Industry – A Food Vision.
http://www.bfff.co.uk/sites/default/files/bfff_for_web_new.pdf
19 Industrial Energy Efficiency Accelerator Guide to the Dairy Sector (CTG033)
http://www.carbontrust.co.uk/Publications/pages/publicationdetail.aspx?id=CTG033
20 Real Zero campaign information and literature. http://www.realzero.org.uk/
Evidence Review Findings
SINCLAIR KNIGHT MERZ
D:\Documents and Settings\jgalloway\My Documents\Work\DEFRA\Evidence Review\Evidence Review Findings v0 3.docx PAGE 4
Source
Reference
No.
Source Description and Link (if available)
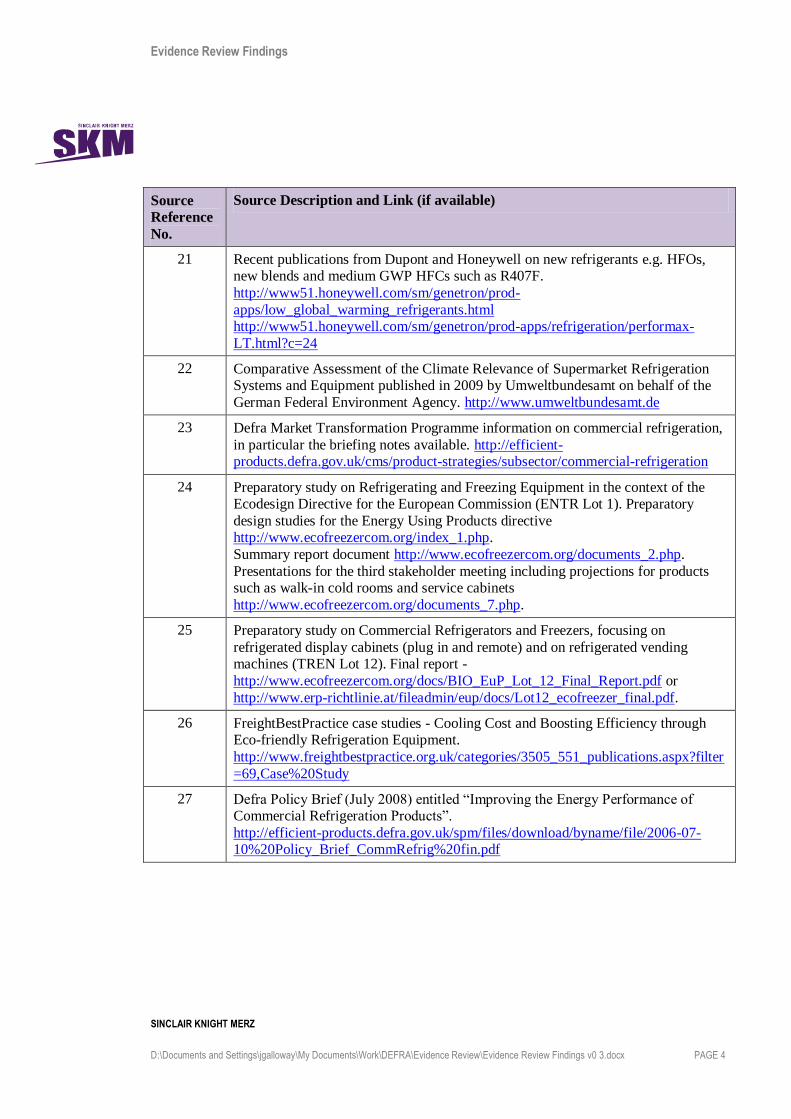
21 Recent publications from Dupont and Honeywell on new refrigerants e.g. HFOs, new blends and medium GWP HFCs such as R407F.
http://www51.honeywell.com/sm/genetron/prod-
apps/low_global_warming_refrigerants.html http://www51.honeywell.com/sm/genetron/prod-apps/refrigeration/performax-
LT.html?c=24
22 Comparative Assessment of the Climate Relevance of Supermarket Refrigeration Systems and Equipment published in 2009 by Umweltbundesamt on behalf of the
German Federal Environment Agency. http://www.umweltbundesamt.de
23 Defra Market Transformation Programme information on commercial refrigeration,
in particular the briefing notes available. http://efficient-products.defra.gov.uk/cms/product-strategies/subsector/commercial-refrigeration
24 Preparatory study on Refrigerating and Freezing Equipment in the context of the Ecodesign Directive for the European Commission (ENTR Lot 1). Preparatory
design studies for the Energy Using Products directive http://www.ecofreezercom.org/index_1.php.
Summary report document http://www.ecofreezercom.org/documents_2.php.
Presentations for the third stakeholder meeting including projections for products such as walk-in cold rooms and service cabinets
http://www.ecofreezercom.org/documents_7.php.
25 Preparatory study on Commercial Refrigerators and Freezers, focusing on
refrigerated display cabinets (plug in and remote) and on refrigerated vending machines (TREN Lot 12). Final report -
http://www.ecofreezercom.org/docs/BIO_EuP_Lot_12_Final_Report.pdf or
http://www.erp-richtlinie.at/fileadmin/eup/docs/Lot12_ecofreezer_final.pdf.
26 FreightBestPractice case studies - Cooling Cost and Boosting Efficiency through Eco-friendly Refrigeration Equipment.
http://www.freightbestpractice.org.uk/categories/3505_551_publications.aspx?filter
=69,Case%20Study
27 Defra Policy Brief (July 2008) entitled “Improving the Energy Performance of Commercial Refrigeration Products”.
http://efficient-products.defra.gov.uk/spm/files/download/byname/file/2006-07-10%20Policy_Brief_CommRefrig%20fin.pdf
Evidence Review Findings
SINCLAIR KNIGHT MERZ
D:\Documents and Settings\jgalloway\My Documents\Work\DEFRA\Evidence Review\Evidence Review Findings v0 3.docx PAGE 5
3. Summary of Findings
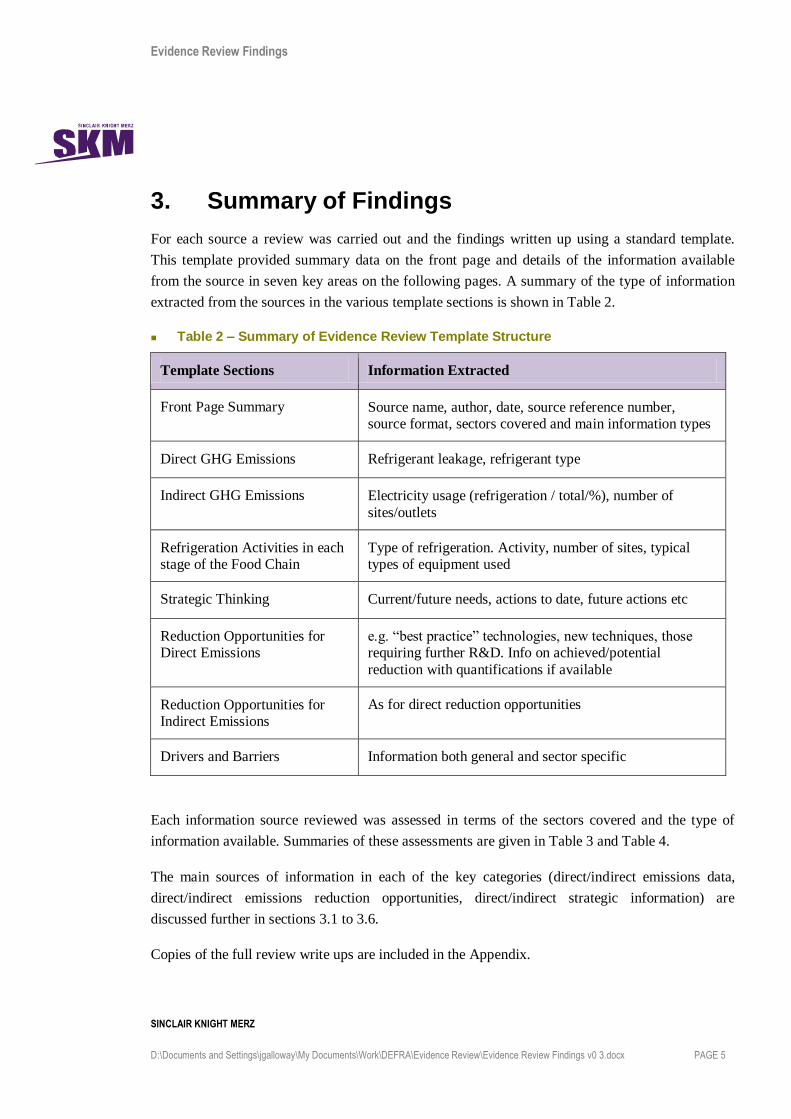
For each source a review was carried out and the findings written up using a standard template.
This template provided summary data on the front page and details of the information available
from the source in seven key areas on the following pages. A summary of the type of information
extracted from the sources in the various template sections is shown in Table 2.
Table 2 – Summary of Evidence Review Template Structure
Template Sections Information Extracted
Front Page Summary Source name, author, date, source reference number, source format, sectors covered and main information types
Direct GHG Emissions Refrigerant leakage, refrigerant type
Indirect GHG Emissions Electricity usage (refrigeration / total/%), number of
sites/outlets
Refrigeration Activities in each stage of the Food Chain
Type of refrigeration. Activity, number of sites, typical types of equipment used
Strategic Thinking Current/future needs, actions to date, future actions etc
Reduction Opportunities for Direct Emissions
e.g. “best practice” technologies, new techniques, those requiring further R&D. Info on achieved/potential
reduction with quantifications if available
Reduction Opportunities for Indirect Emissions
As for direct reduction opportunities
Drivers and Barriers Information both general and sector specific
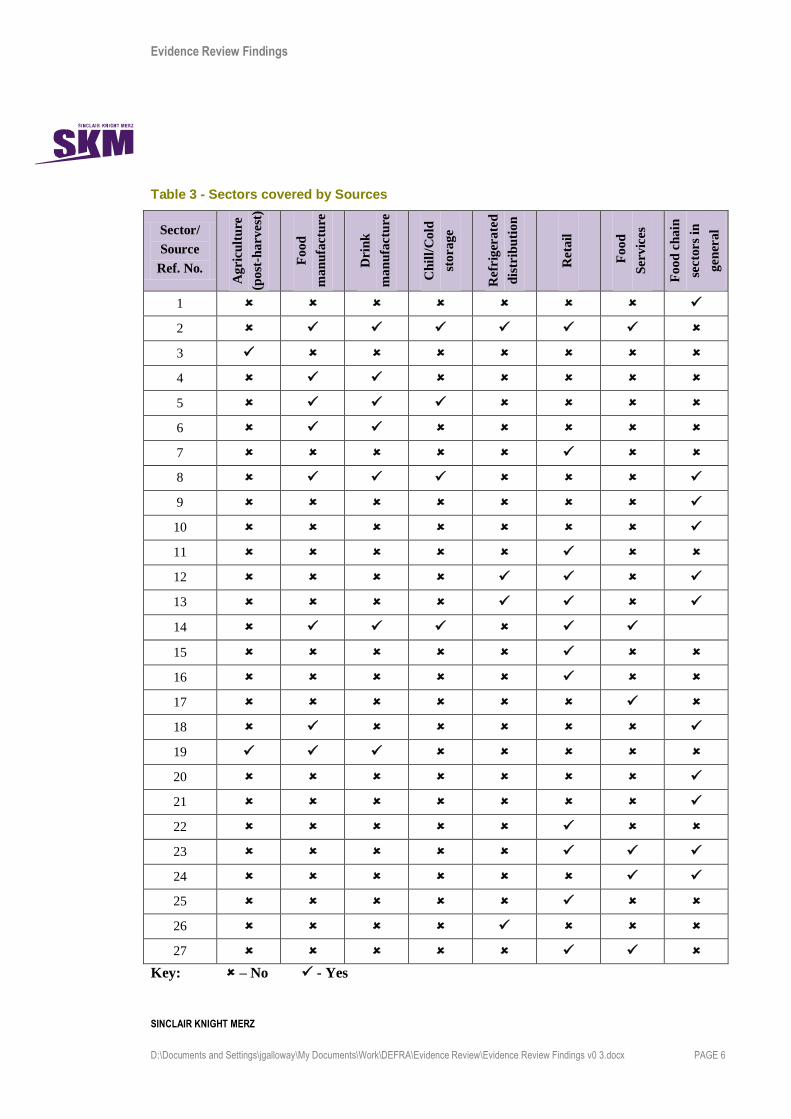
Each information source reviewed was assessed in terms of the sectors covered and the type of
information available. Summaries of these assessments are given in Table 3 and Table 4.
The main sources of information in each of the key categories (direct/indirect emissions data,
direct/indirect emissions reduction opportunities, direct/indirect strategic information) are
discussed further in sections 3.1 to 3.6.
Copies of the full review write ups are included in the Appendix.
Evidence Review Findings
SINCLAIR KNIGHT MERZ
D:\Documents and Settings\jgalloway\My Documents\Work\DEFRA\Evidence Review\Evidence Review Findings v0 3.docx PAGE 6
Table 3 - Sectors covered by Sources
Sector/
Source
Ref. No.
Agric
ult
ure
(post
-harvest
)
Food
man
ufa
ctu
re
Drin
k
man
ufa
ctu
re
Ch
ill/
Cold
storage
Refr
iger
ate
d
dis
trib
uti
on
Reta
il
Food
Servic
es
Food
ch
ain
secto
rs
in
gen
eral
1
2
3
4
5
6
7
8
9
10
11
12
13
14
15
16
17
18
19
20
21
22
23
24
25
26
27
Key: – No - Yes

Evidence Review Findings
SINCLAIR KNIGHT MERZ
D:\Documents and Settings\jgalloway\My Documents\Work\DEFRA\Evidence Review\Evidence Review Findings v0 3.docx PAGE 7
Table 4 - Information in Sources
Information/
Source Ref.
No. E
mis
sion
s d
ata
- d
irect
Em
issi
on
s d
ata
- in
dir
ect
Red
ucti
on
Op
portu
nit
ies
- d
irect
Red
ucti
on
Op
portu
nit
ies
- in
dir
ect
Str
ate
gic
-
dir
ect
Str
ate
gic
-
ind
irect
1
2
3
4
5
6
7
8
9
10
11
12
13
14
15
16
17
18
19
20
21
22
23
24
25
26
27
Key: – no information - some information - detailed information
Evidence Review Findings
SINCLAIR KNIGHT MERZ
D:\Documents and Settings\jgalloway\My Documents\Work\DEFRA\Evidence Review\Evidence Review Findings v0 3.docx PAGE 8
3.1. Direct Emissions Data
The key source for direct emissions data was the 2010 F Gas Inventory (Source 13), which
provided information on the emissions due to HFC refrigerants. The data from this source maps
HFC emissions into 8 categories of refrigeration and air-conditioning equipment:
R1 Domestic Refrigeration
R2 Other small hermetic refrigeration units
R3 Small commercial distributed systems
R4 Supermarket systems
R5 Industrial systems
R6 Building air conditioning systems (DX)
R7 Building air conditioning chillers
R8 Refrigerated Transport
There is little data in this or other sources about how these HFC emissions map into the 6 food
chain sectors being assessed in this project. In the emissions estimates provided in this project we
have made estimates of the proportion of each of the above sectors that relate to food chain
categories.
The UK GHG inventory does not include emissions of HCFCs as these are not covered by the UN
FCCC or the Kyoto Protocol, even though they are powerful GHGs. Sales data for HCFCs, which
are dominated by R22, have been used to estimate total UK emissions of HCFCs. Again there is
little data in the evidence reviews that maps these emissions into the food chain.
The following comments regarding emissions in the 6 food chain sectors are of relevance:
1) Agriculture. The main applications of refrigeration are on dairy farms and for on-farm
vegetable cooling and storage post harvest. Many older systems use HCFCs. The majority
of newer HFC equipment is in the R3 category (small commercial distributed systems).
2) Food and drink manufacture. All relevant HFC emissions are from the R5 category
(industrial systems). Food and drink manufacturing represents a significant proportion of
this sector, although other sectors, especially chemicals and pharmaceuticals are also
significant. HCFCs are still of importance in many food factories. Ammonia is widely
used in large food factories.
3) Cold storage. Large cold stores use industrial equipment that is part of R5 emissions.
Ammonia is the dominant refrigerant in this sector. A number of older stores still use
HCFCs.
4) Refrigerated transport. There is a good mapping between category R8 (refrigerated
transport) and emissions from food and drink transportation. Only a small proportion of
this category is for non-food chain transport. A small amount of HCFCs are still in use.

Evidence Review Findings
SINCLAIR KNIGHT MERZ
D:\Documents and Settings\jgalloway\My Documents\Work\DEFRA\Evidence Review\Evidence Review Findings v0 3.docx PAGE 9
5) Food retail. The supermarket category (R4) in Source 13 maps directly into the food retail
sector, although this does not include the emissions from small food and drink retail outlets
which are included in the categories R2 and R3. Food retail outlets make use of some air-
conditioning, mainly in category R6. A small proportion of older systems use HCFCs,
although supermarket companies have phased out HCFCs faster than many other parts of
the food chain.
6) Food service. Most food service refrigeration equipment is in categories R2 and R3. Food
service outlets make use of some air-conditioning, mainly in category R6. Some older
systems use HCFCs.
3.2. Indirect Emissions Data
The key sources for indirect emissions data were CCA data (Source 5), DUKES (Source 4), study
of energy use in agriculture sector (Source 3), study of food refrigeration energy usage by a
University consortium (Source 9), report by British frozen food industry (Source 18) and study of
the Food Services sector (Source 17). The results of a survey of food and drink manufacturers
(Source 6) provided useful data on energy used for refrigeration systems in different categories of
food manufacture.
The energy data found in the evidence review was far more detailed than that available for direct
emissions. Sources such as DUKES and CCA data give fairly accurate estimates of the total
electricity consumption of the 6 sectors in the food chain. The other sources listed above enable
estimates to be made of the proportion of the electricity use that can be attributed to refrigeration
and air-conditioning systems. These have provided a reasonable basis for making estimates of
indirect emissions from each sector of the food chain.
3.3. Direct Emissions Reduction Opportunities
The most important sources for information on the reduction opportunities in direct emissions are
the 2010 F Gas Inventory (Source 13), the Retail sector Refrigeration Road Map (Source 7) , the
IoR Real Zero project (Source 20) and recent publications on the new low GWP refrigerants
(Source 21).
The 2010 F Gas Inventory (Source 13) contains projections up to 2050 for CO2 emissions from
HFCs for „business as usual‟ and 'low HFC emissions' scenarios in the eight different categories
described in Section 3.1 above.
The Retail sector Refrigeration Road Map (Source 7) is a very valuable source of detailed up-to-
date information on the direct emission reduction opportunities for supermarkets. It is considered

Evidence Review Findings
SINCLAIR KNIGHT MERZ
D:\Documents and Settings\jgalloway\My Documents\Work\DEFRA\Evidence Review\Evidence Review Findings v0 3.docx PAGE 10
that this should provide all the necessary data for supermarkets and also most of that needed for
smaller retail outlets. Some of the information in this source can be extrapolated to other sectors.
The IoR Real Zero Project (Source 20) is a major programme that has investigated the causes of
refrigerant leakage (and hence direct emissions) in various sectors of RAC use and provides
practical guidance on how leakage can be reduced.
Further information on the reduction opportunities through the use of new low GWP refrigerants is
available from recent publications on the subject (Source 21).
3.4. Indirect Emissions Reduction Opportunities
The most important sources of information on the reduction opportunities in indirect emissions are
shown in Table 5 for each of the sectors in the food chain.
Table 5 - Main Sources for Indirect Emissions Reduction Opportunities
Sector Main Data Sources
Agriculture Study of energy use in agriculture sector (Source 3)
Food & Drink Manufacture Refrigeration Efficiency Initiative (Source 8), Carbon Trust
publications (Source 14)
Cold Storage Refrigeration Efficiency Initiative (Source 8), Carbon Trust publications (Source 14)
Transport Transport Sector Focus report produced for Defra by University
consortium (Source 9), FreightBestPractice case studies (Source 26)
Retail – supermarket Retail sector Refrigeration Road Map (Source 7)
Retail – convenience and
small outlets
Retail sector Refrigeration Road Map (Source 7), Market
Transformation Programme (Source 23)
Food Service Study of the Food Services sector (Source 17), Market Transformation Programme (Source 23)
The study of energy use in the agriculture sector (Source 3) contains information on the potential
energy savings through various measures in different agriculture subsector along with the barriers
to uptake. However, only a broad range is given for the associated payback periods.
The five guides produced as part of the Refrigeration Efficiency Initiative (Source 8) provide useful
information on the various saving opportunities associated with refrigeration in the Food & Drink
Manufacturing and Cold Storage sectors; both for improving existing systems and new plant.
However, in general, the saving potential is not quantified for the various opportunities discussed,
although many case studies are given, which include quantified savings. Further valuable
Evidence Review Findings
SINCLAIR KNIGHT MERZ
D:\Documents and Settings\jgalloway\My Documents\Work\DEFRA\Evidence Review\Evidence Review Findings v0 3.docx PAGE 11
information for these sectors, and refrigeration systems in general, is also available in the various
Carbon Trust publications (Source 14)
The Transport Sector Focus report produced by a University consortium for Defra (Source 9)
included savings figures for the use of vacuum insulated panels for refrigerated road transport.
Further information on the savings opportunities in the Transport sector are available in the case
study document produced by FreightBestPractice (Source 26).
The Retail sector Refrigeration Road Map (Source 7) is a very valuable source of detailed up-to-
date information on the energy saving opportunities for supermarkets. It is considered that this
should provide all the necessary data on the indirect emission reduction opportunities for
supermarkets. Many of the opportunities would also apply to smaller retail outlets.
Very detailed information is available for a range of commercial refrigeration equipment that
would be found in the Food Service and Retail sectors is available from the Market Transformation
Programme (Source 23). This includes reference, policy and BAT scenarios with projections for
2020 and 2030 for each of the equipment types included. It is considered that this should provide
all the necessary data on the indirect emission reduction opportunities for the small commercial
refrigeration equipment found in the Food Service and Retail sectors. Information on the house-
keeping saving opportunities in the Food Service sector is available in the 2010 study carried out
for Defra (Source 17).
3.5. Direct Emissions Strategic Information
Important sources for strategic information on direct emissions in the Retail sector are the
Refrigeration Road Map (Source 7), supermarket CSR reports (Source 15) and the EU preparatory
study on Commercial Refrigerators and Freezers (Source 25). Information for other sectors is
available in the 2005 CT report on Targeting Refrigeration Technology Support in the Food and
Drink Sector (Source 6) and the sector voluntary initiatives (Source 16).
3.6. Indirect Emissions Strategic Information
The most important sources for strategic information on indirect emissions are as follows:
Food 2030 report (Source 1),
CT study of refrigeration in the F&D manufacturing sector (Source 6)
Retail sector Refrigeration Road Map (Source 7)
Sector voluntary initiatives (Source 16)
Defra study of the Food Services sector (Source 17)
IEEA guide to the Dairy sector (Source 19)
Evidence Review Findings
SINCLAIR KNIGHT MERZ
D:\Documents and Settings\jgalloway\My Documents\Work\DEFRA\Evidence Review\Evidence Review Findings v0 3.docx PAGE 12
EU preparatory study on Commercial Refrigerators and Freezers (Source 25) and
2008 Defra Policy Brief (Source 27)
3.7. Summary
The core source for direct emissions data is the 2010 UK F Gas Inventory. This is based on some
assumptions which will inevitably lead to a level of inaccuracy, and contains little data about how
these HFC emissions map into the 6 food chain sectors being assessed in this project. The only
source of data on HCFC emissions is from sales figures. Again there is little data in the evidence
reviews that maps these emissions into the food chain.
Better data is available for indirect emissions. Estimates are available in various sources for the
Agriculture, Transport, Retail and Food Service sectors. A reasonable estimate of indirect
emissions from the Food and Drink Manufacturing and Cold Storage sectors has been obtained by
using CCA data on electricity usage along with estimates of the % electricity due to refrigeration.
The Retail sector Refrigeration Road Map (Source 7) is an excellent source of emission reduction
opportunities, both direct and indirect, for the Retail sector. For the other sectors of the food chain
the evidence review has shown that although many sources contain data on emission reduction
opportunities, often only figures on the savings potential are given but not costs, or the savings
potential is only described but not quantified.
It is considered that good strategic information is available for the majority of the food chain in the
various sources reviewed.
In conclusion, it is considered that although there are gaps to the evidence available, it should be
possible to compensate by making reasonable assumptions which will allow the emissions and
reduction opportunities, for both direct and indirect CO2 emissions, to be quantified as part of this
project.
Evidence Review Findings
SINCLAIR KNIGHT MERZ
D:\Documents and Settings\jgalloway\My Documents\Work\DEFRA\Evidence Review\Evidence Review Findings v0 3.docx PAGE 13
4. Appendix – Sources Reviews
Evidence Review
GHG Emissions due to Refrigeration in the Food Chain
SINCLAIR KNIGHT MERZ
The SKM logo trade mark is a registered trade mark of Sinclair Knight Merz Pty Ltd.
D:\Documents and Settings\jgalloway\My Documents\Work\DEFRA\Evidence Review\Evidence Reviews Draft 0.2\Evidence Review - Source 1 -
Food 2030 Strategy v0.2.docx PAGE 1
Source Name UK Government’s Food Strategy for 2030
Author HM Government publication
Date January 2010
Source No. 1
Source Format Final report
Sectors covered by source
– No - Yes
Sector Covered?
Agriculture (post harvest)
Food manufacturing
Drink manufacturing
Chill/Cold storage
Refrigerated distribution
Retail
Food Services
Food chain sectors in general
Information in Source
– no information - some information - detailed information
Area Information?
Emissions data - direct
Emissions data - indirect
Reduction Opportunities - direct
Reduction Opportunities - indirect
Strategic - direct
Strategic - indirect
Following table completed with any information contained in the source under the relevant
headings, include reference details e.g. page no., section no., table no. etc.
Evidence Review - GHG Emissions associated with Refrigeration in the Food Chain
26 October 2010
SINCLAIR KNIGHT MERZ The SKM logo trade mark is a registered trade mark of Sinclair Knight Merz Pty Ltd.
D:\Documents and Settings\jgalloway\My Documents\Work\DEFRA\Evidence Review\Evidence Reviews Draft 0.2\Evidence Review - Source 1 -
Food 2030 Strategy v0.2.docx PAGE 2
Direct GHG Emissions
No Information
Indirect GHG Emissions
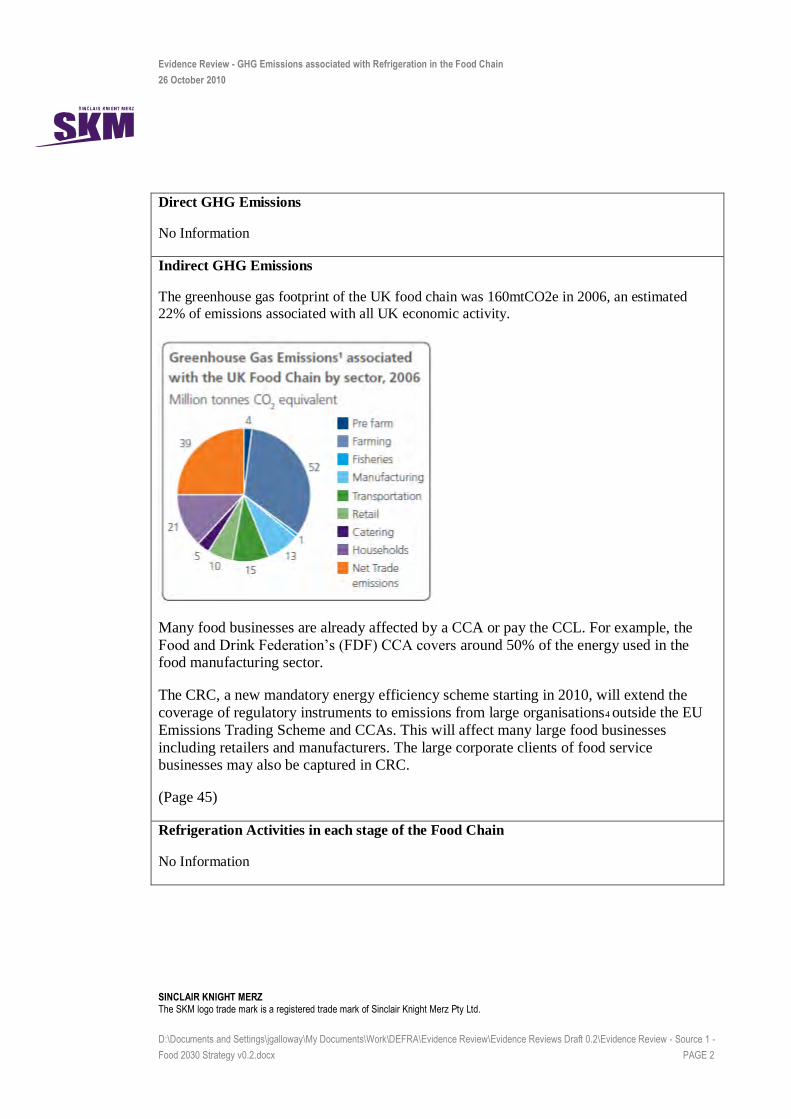
The greenhouse gas footprint of the UK food chain was 160mtCO2e in 2006, an estimated
22% of emissions associated with all UK economic activity.
Many food businesses are already affected by a CCA or pay the CCL. For example, the
Food and Drink Federation‟s (FDF) CCA covers around 50% of the energy used in the food manufacturing sector.
The CRC, a new mandatory energy efficiency scheme starting in 2010, will extend the
coverage of regulatory instruments to emissions from large organisations4 outside the EU
Emissions Trading Scheme and CCAs. This will affect many large food businesses
including retailers and manufacturers. The large corporate clients of food service businesses may also be captured in CRC.
(Page 45)
Refrigeration Activities in each stage of the Food Chain
No Information
Evidence Review - GHG Emissions associated with Refrigeration in the Food Chain
26 October 2010
SINCLAIR KNIGHT MERZ The SKM logo trade mark is a registered trade mark of Sinclair Knight Merz Pty Ltd.
D:\Documents and Settings\jgalloway\My Documents\Work\DEFRA\Evidence Review\Evidence Reviews Draft 0.2\Evidence Review - Source 1 -
Food 2030 Strategy v0.2.docx PAGE 3
Strategic Thinking
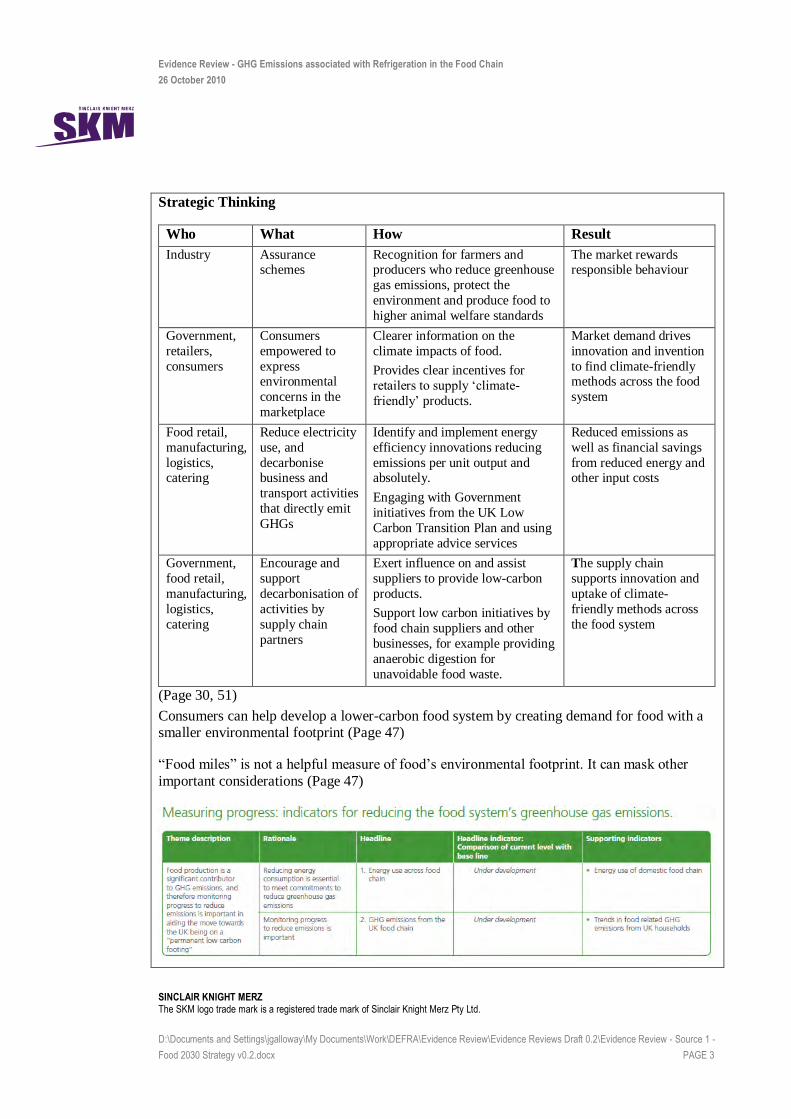
Who What How Result
Industry Assurance schemes
Recognition for farmers and producers who reduce greenhouse
gas emissions, protect the
environment and produce food to
higher animal welfare standards
The market rewards responsible behaviour
Government,
retailers,
consumers
Consumers
empowered to
express environmental
concerns in the
marketplace
Clearer information on the
climate impacts of food.
Provides clear incentives for
retailers to supply „climate-
friendly‟ products.
Market demand drives
innovation and invention
to find climate-friendly methods across the food
system
Food retail,
manufacturing,
logistics, catering
Reduce electricity
use, and
decarbonise business and
transport activities
that directly emit
GHGs
Identify and implement energy
efficiency innovations reducing
emissions per unit output and absolutely.
Engaging with Government
initiatives from the UK Low
Carbon Transition Plan and using
appropriate advice services
Reduced emissions as
well as financial savings
from reduced energy and other input costs
Government,
food retail,
manufacturing,
logistics,
catering
Encourage and
support
decarbonisation of
activities by
supply chain
partners
Exert influence on and assist
suppliers to provide low-carbon
products.
Support low carbon initiatives by
food chain suppliers and other
businesses, for example providing
anaerobic digestion for
unavoidable food waste.
The supply chain
supports innovation and
uptake of climate-
friendly methods across
the food system
(Page 30, 51)
Consumers can help develop a lower-carbon food system by creating demand for food with a smaller environmental footprint (Page 47)
“Food miles” is not a helpful measure of food‟s environmental footprint. It can mask other
important considerations (Page 47)

Evidence Review - GHG Emissions associated with Refrigeration in the Food Chain
26 October 2010
SINCLAIR KNIGHT MERZ The SKM logo trade mark is a registered trade mark of Sinclair Knight Merz Pty Ltd.
D:\Documents and Settings\jgalloway\My Documents\Work\DEFRA\Evidence Review\Evidence Reviews Draft 0.2\Evidence Review - Source 1 -
Food 2030 Strategy v0.2.docx PAGE 4
(Page 77)
Reduction Opportunities for Direct Emissions
No Information
Reduction Opportunities for Indirect Emissions
No Information
Drivers and Barriers
No Information
Evidence Review
GHG Emissions due to Refrigeration in the Food Chain
SINCLAIR KNIGHT MERZ
The SKM logo trade mark is a registered trade mark of Sinclair Knight Merz Pty Ltd.
D:\Documents and Settings\jgalloway\My Documents\Work\DEFRA\Evidence Review\Evidence Reviews Draft 0.2\Evidence Review - Source 2 -
FISS v0.2.docx PAGE 1
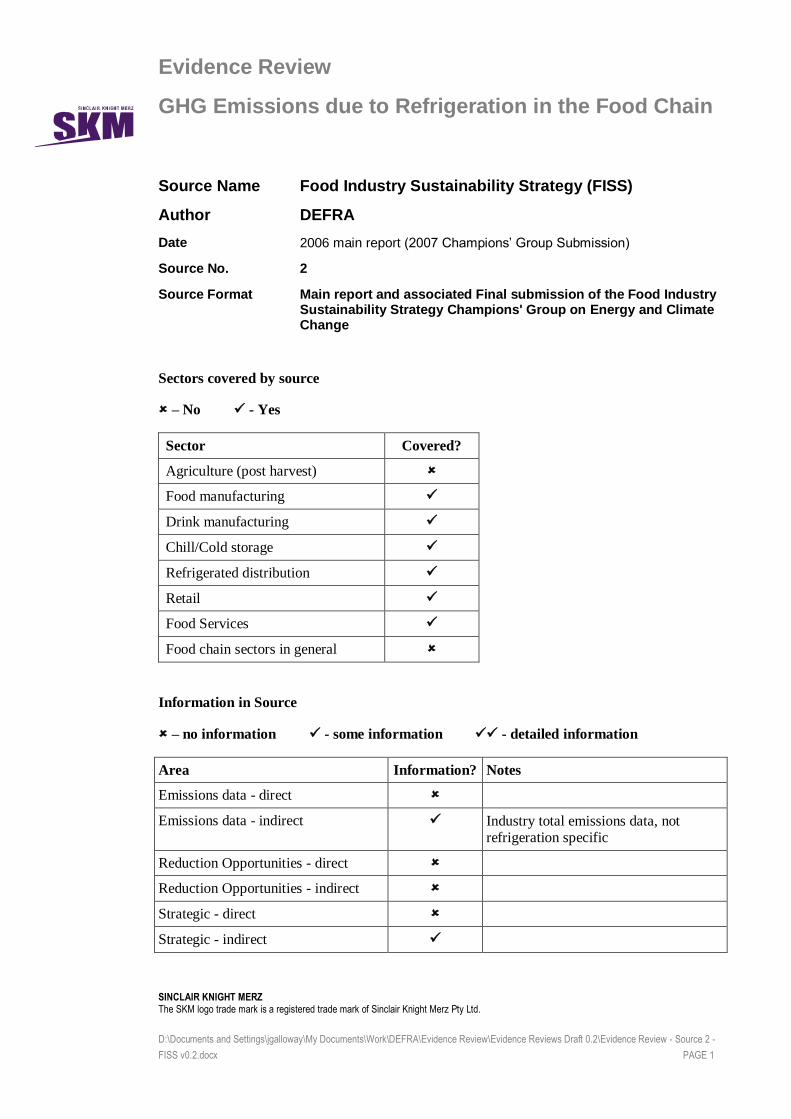
Source Name Food Industry Sustainability Strategy (FISS)
Author DEFRA
Date 2006 main report (2007 Champions’ Group Submission)
Source No. 2
Source Format Main report and associated Final submission of the Food Industry Sustainability Strategy Champions' Group on Energy and Climate Change
Sectors covered by source
– No - Yes
Sector Covered?
Agriculture (post harvest)
Food manufacturing
Drink manufacturing
Chill/Cold storage
Refrigerated distribution
Retail
Food Services
Food chain sectors in general
Information in Source
– no information - some information - detailed information
Area Information? Notes
Emissions data - direct
Emissions data - indirect Industry total emissions data, not refrigeration specific
Reduction Opportunities - direct
Reduction Opportunities - indirect
Strategic - direct
Strategic - indirect
Evidence Review - GHG Emissions associated with Refrigeration in the Food Chain
26 October 2010
SINCLAIR KNIGHT MERZ The SKM logo trade mark is a registered trade mark of Sinclair Knight Merz Pty Ltd.
D:\Documents and Settings\jgalloway\My Documents\Work\DEFRA\Evidence Review\Evidence Reviews Draft 0.2\Evidence Review - Source 2 -
FISS v0.2.docx PAGE 2
Following table completed with any information contained in the source under the relevant headings, include reference details e.g. page no., section no., table no. etc.
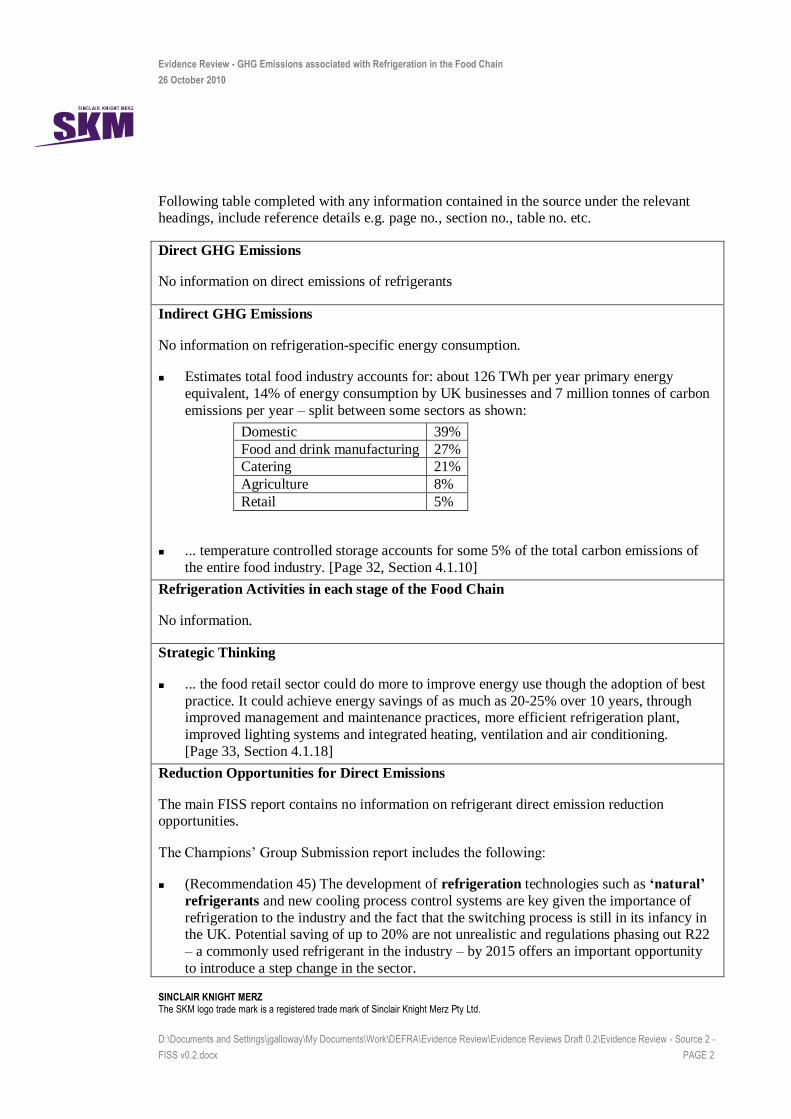
Direct GHG Emissions
No information on direct emissions of refrigerants
Indirect GHG Emissions
No information on refrigeration-specific energy consumption.
Estimates total food industry accounts for: about 126 TWh per year primary energy
equivalent, 14% of energy consumption by UK businesses and 7 million tonnes of carbon
emissions per year – split between some sectors as shown:
Domestic 39%
Food and drink manufacturing 27%
Catering 21%
Agriculture 8%
Retail 5%
... temperature controlled storage accounts for some 5% of the total carbon emissions of
the entire food industry. [Page 32, Section 4.1.10]
Refrigeration Activities in each stage of the Food Chain
No information.
Strategic Thinking
... the food retail sector could do more to improve energy use though the adoption of best
practice. It could achieve energy savings of as much as 20-25% over 10 years, through improved management and maintenance practices, more efficient refrigeration plant,
improved lighting systems and integrated heating, ventilation and air conditioning.
[Page 33, Section 4.1.18]
Reduction Opportunities for Direct Emissions
The main FISS report contains no information on refrigerant direct emission reduction opportunities.
The Champions’ Group Submission report includes the following:
(Recommendation 45) The development of refrigeration technologies such as ‘natural’
refrigerants and new cooling process control systems are key given the importance of
refrigeration to the industry and the fact that the switching process is still in its infancy in the UK. Potential saving of up to 20% are not unrealistic and regulations phasing out R22
– a commonly used refrigerant in the industry – by 2015 offers an important opportunity
to introduce a step change in the sector.
Evidence Review - GHG Emissions associated with Refrigeration in the Food Chain
26 October 2010
SINCLAIR KNIGHT MERZ The SKM logo trade mark is a registered trade mark of Sinclair Knight Merz Pty Ltd.
D:\Documents and Settings\jgalloway\My Documents\Work\DEFRA\Evidence Review\Evidence Reviews Draft 0.2\Evidence Review - Source 2 -
FISS v0.2.docx PAGE 3
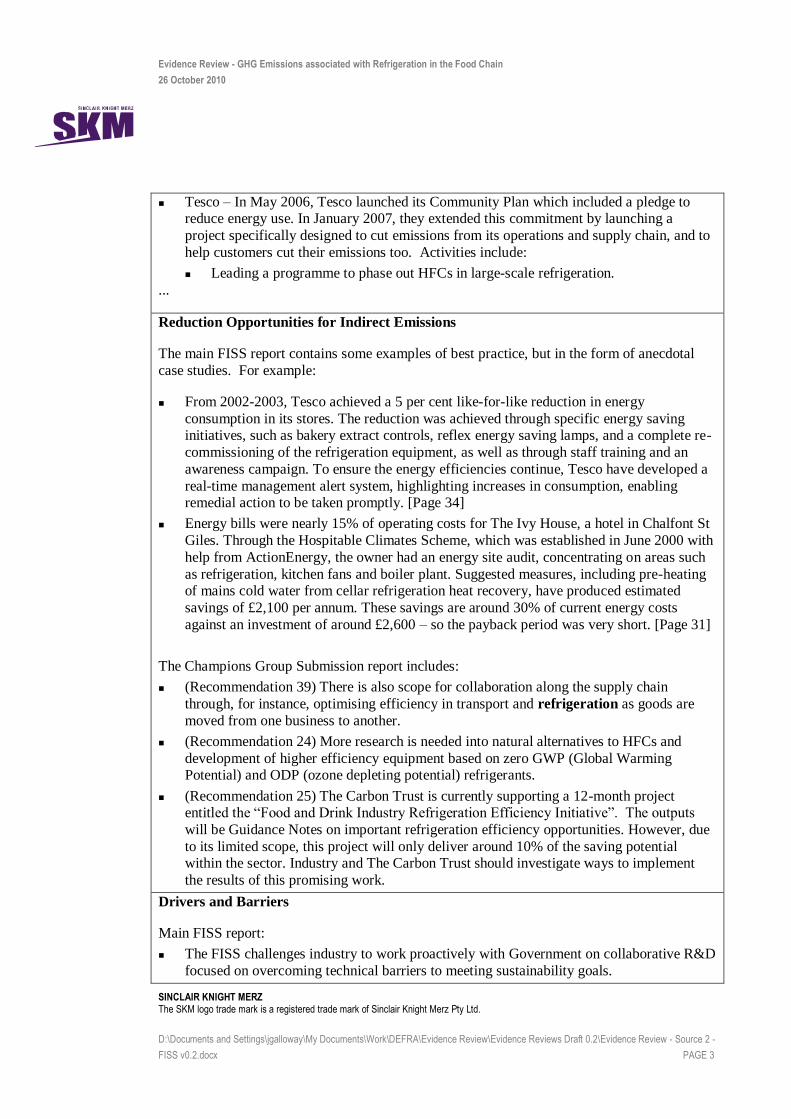
Tesco – In May 2006, Tesco launched its Community Plan which included a pledge to reduce energy use. In January 2007, they extended this commitment by launching a
project specifically designed to cut emissions from its operations and supply chain, and to
help customers cut their emissions too. Activities include:
Leading a programme to phase out HFCs in large-scale refrigeration.
...
Reduction Opportunities for Indirect Emissions
The main FISS report contains some examples of best practice, but in the form of anecdotal
case studies. For example:
From 2002-2003, Tesco achieved a 5 per cent like-for-like reduction in energy
consumption in its stores. The reduction was achieved through specific energy saving initiatives, such as bakery extract controls, reflex energy saving lamps, and a complete re-
commissioning of the refrigeration equipment, as well as through staff training and an
awareness campaign. To ensure the energy efficiencies continue, Tesco have developed a
real-time management alert system, highlighting increases in consumption, enabling remedial action to be taken promptly. [Page 34]
Energy bills were nearly 15% of operating costs for The Ivy House, a hotel in Chalfont St
Giles. Through the Hospitable Climates Scheme, which was established in June 2000 with
help from ActionEnergy, the owner had an energy site audit, concentrating on areas such
as refrigeration, kitchen fans and boiler plant. Suggested measures, including pre-heating of mains cold water from cellar refrigeration heat recovery, have produced estimated
savings of £2,100 per annum. These savings are around 30% of current energy costs
against an investment of around £2,600 – so the payback period was very short. [Page 31]
The Champions Group Submission report includes:
(Recommendation 39) There is also scope for collaboration along the supply chain
through, for instance, optimising efficiency in transport and refrigeration as goods are
moved from one business to another.
(Recommendation 24) More research is needed into natural alternatives to HFCs and
development of higher efficiency equipment based on zero GWP (Global Warming Potential) and ODP (ozone depleting potential) refrigerants.
(Recommendation 25) The Carbon Trust is currently supporting a 12-month project entitled the “Food and Drink Industry Refrigeration Efficiency Initiative”. The outputs
will be Guidance Notes on important refrigeration efficiency opportunities. However, due
to its limited scope, this project will only deliver around 10% of the saving potential within the sector. Industry and The Carbon Trust should investigate ways to implement
the results of this promising work.
Drivers and Barriers
Main FISS report:
The FISS challenges industry to work proactively with Government on collaborative R&D
focused on overcoming technical barriers to meeting sustainability goals.
Evidence Review - GHG Emissions associated with Refrigeration in the Food Chain
26 October 2010
SINCLAIR KNIGHT MERZ The SKM logo trade mark is a registered trade mark of Sinclair Knight Merz Pty Ltd.
D:\Documents and Settings\jgalloway\My Documents\Work\DEFRA\Evidence Review\Evidence Reviews Draft 0.2\Evidence Review - Source 2 -
FISS v0.2.docx PAGE 4
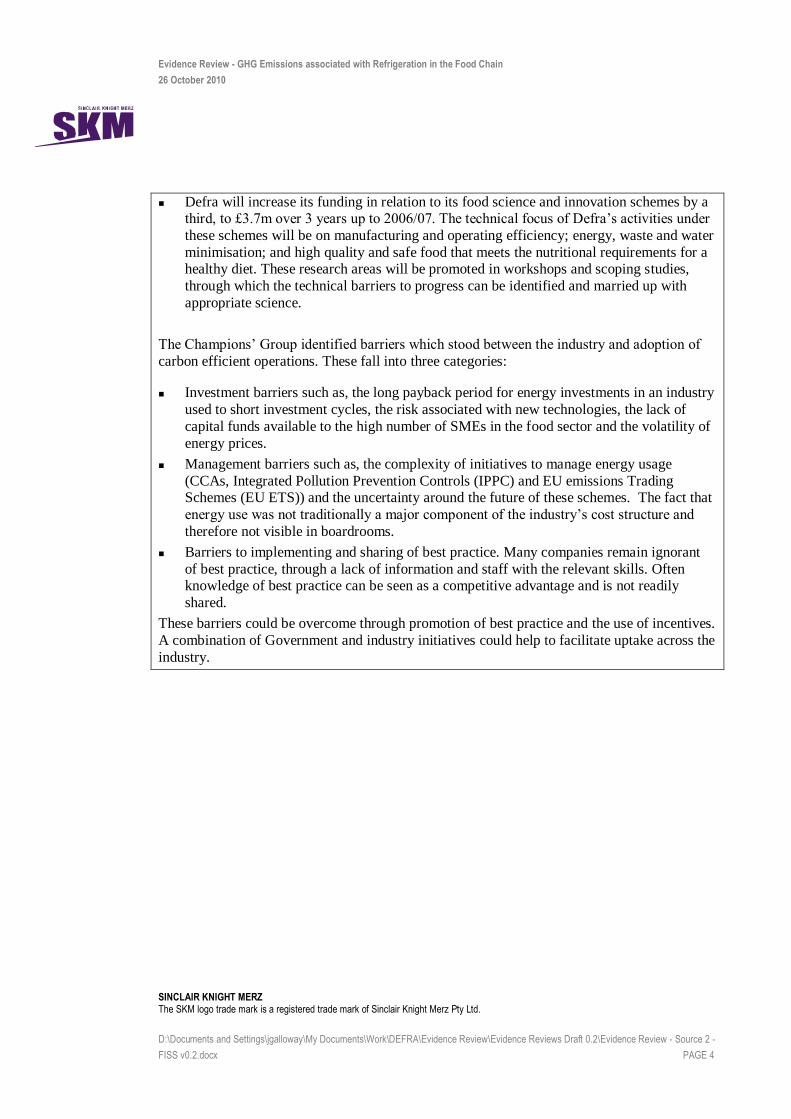
Defra will increase its funding in relation to its food science and innovation schemes by a third, to £3.7m over 3 years up to 2006/07. The technical focus of Defra’s activities under
these schemes will be on manufacturing and operating efficiency; energy, waste and water
minimisation; and high quality and safe food that meets the nutritional requirements for a healthy diet. These research areas will be promoted in workshops and scoping studies,
through which the technical barriers to progress can be identified and married up with
appropriate science.
The Champions’ Group identified barriers which stood between the industry and adoption of
carbon efficient operations. These fall into three categories:
Investment barriers such as, the long payback period for energy investments in an industry
used to short investment cycles, the risk associated with new technologies, the lack of
capital funds available to the high number of SMEs in the food sector and the volatility of
energy prices.
Management barriers such as, the complexity of initiatives to manage energy usage
(CCAs, Integrated Pollution Prevention Controls (IPPC) and EU emissions Trading Schemes (EU ETS)) and the uncertainty around the future of these schemes. The fact that
energy use was not traditionally a major component of the industry’s cost structure and
therefore not visible in boardrooms.
Barriers to implementing and sharing of best practice. Many companies remain ignorant
of best practice, through a lack of information and staff with the relevant skills. Often knowledge of best practice can be seen as a competitive advantage and is not readily
shared.
These barriers could be overcome through promotion of best practice and the use of incentives.
A combination of Government and industry initiatives could help to facilitate uptake across the
industry.
Evidence Review
GHG Emissions due to Refrigeration in the Food Chain
SINCLAIR KNIGHT MERZ
The SKM logo trade mark is a registered trade mark of Sinclair Knight Merz Pty Ltd.
D:\Documents and Settings\jgalloway\My Documents\Work\DEFRA\Evidence Review\Evidence Reviews Draft 0.2\Evidence Review - Source 3 -
AC0401Agriculture v0.2.docx PAGE 1
Source Name AC0401: Direct energy use in agriculture: opportunities for reducing fossil fuel inputs
Author Warwick HRI
Date May 2007
Source No. 3
Source Format Report
Sectors covered by source
– No - Yes
Sector Covered?
Agriculture (post harvest)
Food manufacturing
Drink manufacturing
Chill/Cold storage
Refrigerated distribution
Retail
Food Services
Food chain sectors in general
Information in Source
– no information - some information - detailed information
Area Information?
Emissions data - direct
Emissions data - indirect
Reduction Opportunities - direct
Reduction Opportunities - indirect
Strategic - direct
Strategic - indirect
Following table completed with any information contained in the source under the relevant
headings, include reference details e.g. page no., section no., table no. etc.
Evidence Review - GHG Emissions associated with Refrigeration in the Food Chain
26 October 2010
SINCLAIR KNIGHT MERZ The SKM logo trade mark is a registered trade mark of Sinclair Knight Merz Pty Ltd.
D:\Documents and Settings\jgalloway\My Documents\Work\DEFRA\Evidence Review\Evidence Reviews Draft 0.2\Evidence Review - Source 3 -
AC0401Agriculture v0.2.docx PAGE 2
Direct GHG Emissions
No information on direct GHG emissions
Indirect GHG Emissions
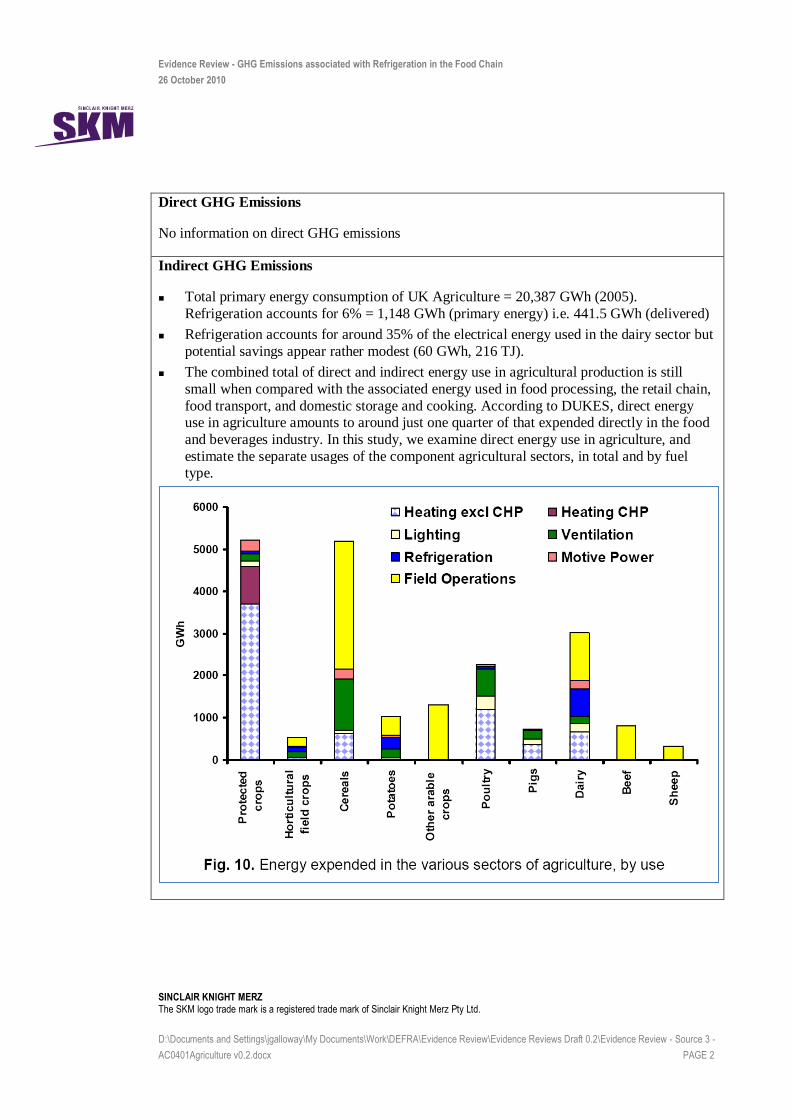
Total primary energy consumption of UK Agriculture = 20,387 GWh (2005).
Refrigeration accounts for 6% = 1,148 GWh (primary energy) i.e. 441.5 GWh (delivered)
Refrigeration accounts for around 35% of the electrical energy used in the dairy sector but
potential savings appear rather modest (60 GWh, 216 TJ).
The combined total of direct and indirect energy use in agricultural production is still
small when compared with the associated energy used in food processing, the retail chain,
food transport, and domestic storage and cooking. According to DUKES, direct energy use in agriculture amounts to around just one quarter of that expended directly in the food
and beverages industry. In this study, we examine direct energy use in agriculture, and
estimate the separate usages of the component agricultural sectors, in total and by fuel type.
Evidence Review - GHG Emissions associated with Refrigeration in the Food Chain
26 October 2010
SINCLAIR KNIGHT MERZ The SKM logo trade mark is a registered trade mark of Sinclair Knight Merz Pty Ltd.
D:\Documents and Settings\jgalloway\My Documents\Work\DEFRA\Evidence Review\Evidence Reviews Draft 0.2\Evidence Review - Source 3 -
AC0401Agriculture v0.2.docx PAGE 3
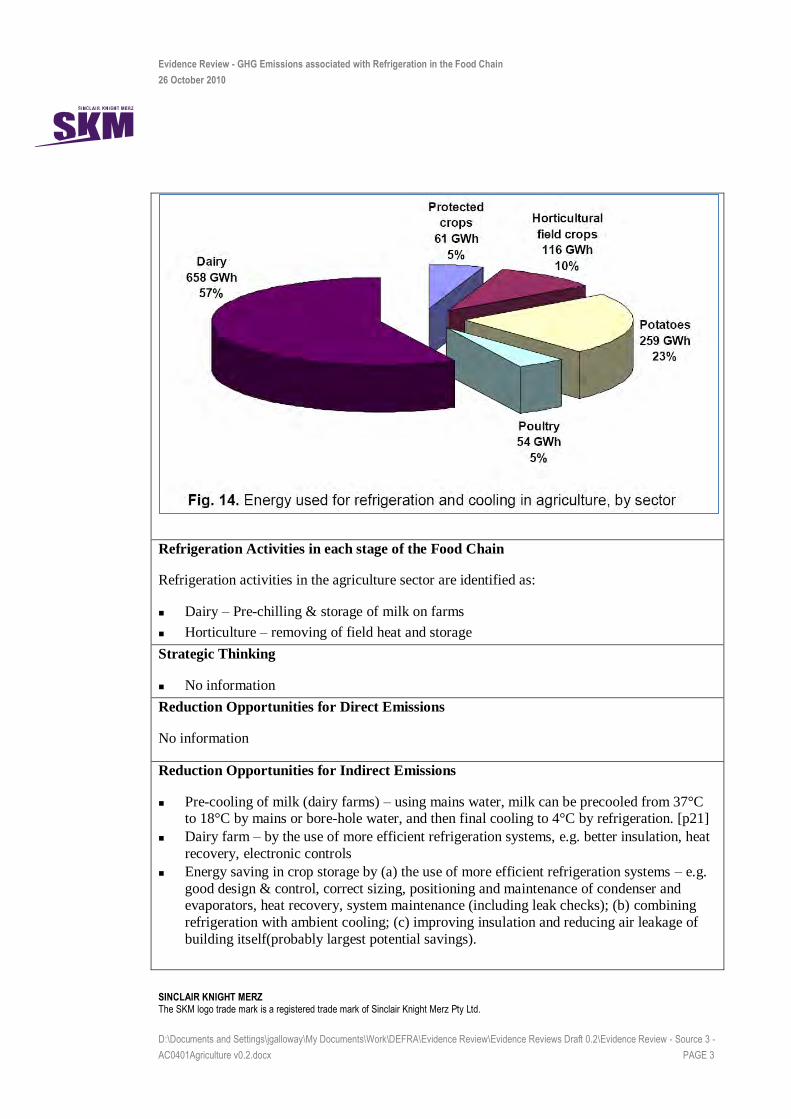
Refrigeration Activities in each stage of the Food Chain
Refrigeration activities in the agriculture sector are identified as:
Dairy – Pre-chilling & storage of milk on farms
Horticulture – removing of field heat and storage
Strategic Thinking
No information
Reduction Opportunities for Direct Emissions
No information
Reduction Opportunities for Indirect Emissions
Pre-cooling of milk (dairy farms) – using mains water, milk can be precooled from 37°C to 18°C by mains or bore-hole water, and then final cooling to 4°C by refrigeration. [p21]
Dairy farm – by the use of more efficient refrigeration systems, e.g. better insulation, heat
recovery, electronic controls
Energy saving in crop storage by (a) the use of more efficient refrigeration systems – e.g.
good design & control, correct sizing, positioning and maintenance of condenser and evaporators, heat recovery, system maintenance (including leak checks); (b) combining
refrigeration with ambient cooling; (c) improving insulation and reducing air leakage of
building itself(probably largest potential savings).

Evidence Review - GHG Emissions associated with Refrigeration in the Food Chain
26 October 2010
SINCLAIR KNIGHT MERZ The SKM logo trade mark is a registered trade mark of Sinclair Knight Merz Pty Ltd.
D:\Documents and Settings\jgalloway\My Documents\Work\DEFRA\Evidence Review\Evidence Reviews Draft 0.2\Evidence Review - Source 3 -
AC0401Agriculture v0.2.docx PAGE 4
Sector Energy-saving measure
Potential energy savings
C savings
(1,000
tonnes)
Payback
period
(years)
Barriers to take-up
Horticultural field crops
Store insulation, optimised storage
9 GWh 0.5 2-5 Technology transfer needed
Horticultural field crops
Improved field heat removal
15 GWh 0.7 2-5
Potatoes and Arable crops sectors, excluding cereals
Optimised ventilation and cooling in store
190 GWh 11 2-5 Technical evaluation and technology transfer needed.
Potatoes and Arable crops sectors, excluding cereals
Improved store insulation
90 GWh 5 2-5 Economics information needed
Dairy Efficient refrigeration
60 GWh 3 2-5 Technology transfer needed
Research gaps.
Drivers and Barriers
No refrigeration specific barriers or drivers were identified.
Evidence Review
GHG Emissions due to Refrigeration in the Food Chain
SINCLAIR KNIGHT MERZ
The SKM logo trade mark is a registered trade mark of Sinclair Knight Merz Pty Ltd.
D:\Documents and Settings\jgalloway\My Documents\Work\DEFRA\Evidence Review\Evidence Reviews Draft 0.2\Evidence Review - Source 4 -
DUKES v0.2.docx PAGE 1
Source Name Digest of United Kingdom energy statistics (DUKES)
Author
Date 2010
Source No. 4
Source Format Report
Sectors covered by source
– No - Yes
Sector Covered?
Agriculture (post harvest)
Food manufacturing
Drink manufacturing
Chill/Cold storage
Refrigerated distribution
Retail
Food Services
Food chain sectors in general
Information in Source
– no information - some information - detailed information
Area Information?
Emissions data - direct
Emissions data - indirect
Reduction Opportunities - direct
Reduction Opportunities - indirect
Strategic - direct
Strategic - indirect
Following table completed with any information contained in the source under the relevant
headings, include reference details e.g. page no., section no., table no. etc.
Evidence Review - GHG Emissions associated with Refrigeration in the Food Chain
26 October 2010
SINCLAIR KNIGHT MERZ The SKM logo trade mark is a registered trade mark of Sinclair Knight Merz Pty Ltd.
D:\Documents and Settings\jgalloway\My Documents\Work\DEFRA\Evidence Review\Evidence Reviews Draft 0.2\Evidence Review - Source 4 -
DUKES v0.2.docx PAGE 2
Direct GHG Emissions
No Information
Indirect GHG Emissions
Information on electricity usage in UK F&D industry and commercial sector
Refrigeration Activities in each stage of the Food Chain
No Information
Strategic Thinking
No Information
Reduction Opportunities for Direct Emissions
No Information
Reduction Opportunities for Indirect Emissions
No Information
Drivers and Barriers
No Information
Evidence Review
GHG Emissions due to Refrigeration in the Food Chain
SINCLAIR KNIGHT MERZ
The SKM logo trade mark is a registered trade mark of Sinclair Knight Merz Pty Ltd.
D:\Documents and Settings\jgalloway\My Documents\Work\DEFRA\Evidence Review\Evidence Reviews Draft 0.2\Evidence Review - Source 5 -
CCA Data v0.2.docx PAGE 1
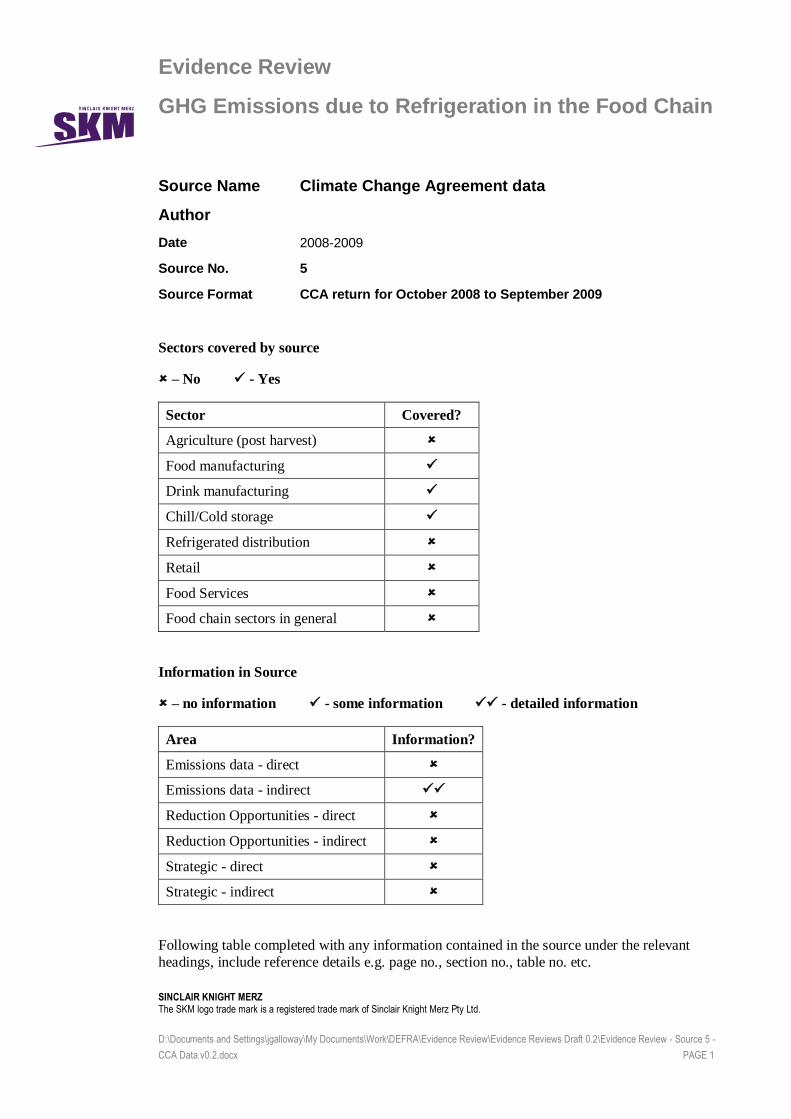
Source Name Climate Change Agreement data
Author
Date 2008-2009
Source No. 5
Source Format CCA return for October 2008 to September 2009
Sectors covered by source
– No - Yes
Sector Covered?
Agriculture (post harvest)
Food manufacturing
Drink manufacturing
Chill/Cold storage
Refrigerated distribution
Retail
Food Services
Food chain sectors in general
Information in Source
– no information - some information - detailed information
Area Information?
Emissions data - direct
Emissions data - indirect
Reduction Opportunities - direct
Reduction Opportunities - indirect
Strategic - direct
Strategic - indirect
Following table completed with any information contained in the source under the relevant
headings, include reference details e.g. page no., section no., table no. etc.
Evidence Review - GHG Emissions associated with Refrigeration in the Food Chain
26 October 2010
SINCLAIR KNIGHT MERZ The SKM logo trade mark is a registered trade mark of Sinclair Knight Merz Pty Ltd.
D:\Documents and Settings\jgalloway\My Documents\Work\DEFRA\Evidence Review\Evidence Reviews Draft 0.2\Evidence Review - Source 5 -
CCA Data v0.2.docx PAGE 2
Direct GHG Emissions
No Information
Indirect GHG Emissions
Total electricity consumption of all organisations with a CCA as part of the following food
sector Trade Associations: Food and Drink Federation, British Meat Processors Association,
British Poultry Council and the Food Storage and Distribution Federation.
Refrigeration Activities in each stage of the Food Chain
No Information
Strategic Thinking
No Information
Reduction Opportunities for Direct Emissions
No Information
Reduction Opportunities for Indirect Emissions
No Information
Drivers and Barriers
No Information
Evidence Review
GHG Emissions due to Refrigeration in the Food Chain
SINCLAIR KNIGHT MERZ
The SKM logo trade mark is a registered trade mark of Sinclair Knight Merz Pty Ltd.
D:\Documents and Settings\jgalloway\My Documents\Work\DEFRA\Evidence Review\Evidence Reviews Draft 0.2\Evidence Review - Source 6 -
F&D Manufacturing Refrigeration Strategy Study v0.2.docx PAGE 1
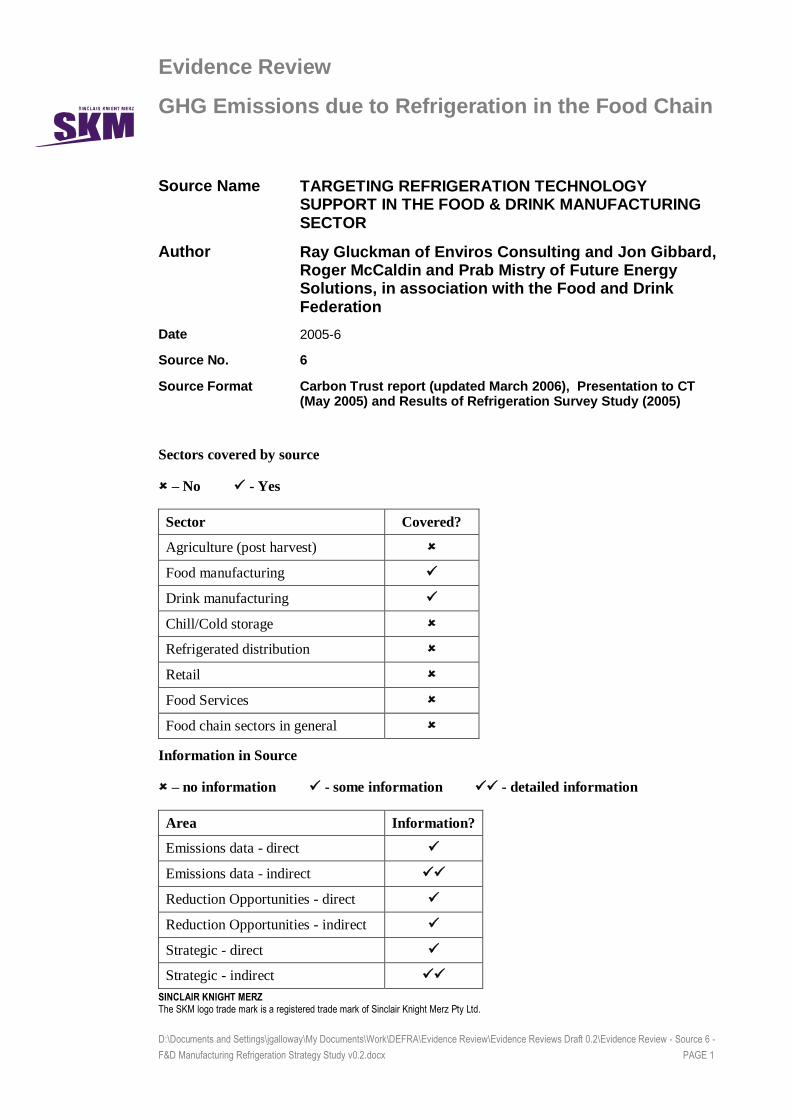
Source Name TARGETING REFRIGERATION TECHNOLOGY SUPPORT IN THE FOOD & DRINK MANUFACTURING SECTOR
Author Ray Gluckman of Enviros Consulting and Jon Gibbard, Roger McCaldin and Prab Mistry of Future Energy Solutions, in association with the Food and Drink Federation
Date 2005-6
Source No. 6
Source Format Carbon Trust report (updated March 2006), Presentation to CT (May 2005) and Results of Refrigeration Survey Study (2005)
Sectors covered by source
– No - Yes
Sector Covered?
Agriculture (post harvest)
Food manufacturing
Drink manufacturing
Chill/Cold storage
Refrigerated distribution
Retail
Food Services
Food chain sectors in general
Information in Source
– no information - some information - detailed information
Area Information?
Emissions data - direct
Emissions data - indirect
Reduction Opportunities - direct
Reduction Opportunities - indirect
Strategic - direct
Strategic - indirect
Evidence Review - GHG Emissions associated with Refrigeration in the Food Chain
26 October 2010
SINCLAIR KNIGHT MERZ The SKM logo trade mark is a registered trade mark of Sinclair Knight Merz Pty Ltd.
D:\Documents and Settings\jgalloway\My Documents\Work\DEFRA\Evidence Review\Evidence Reviews Draft 0.2\Evidence Review - Source 6 -
F&D Manufacturing Refrigeration Strategy Study v0.2.docx PAGE 2
Following table completed with any information contained in the source under the relevant headings, include reference details e.g. page no., section no., table no. etc.
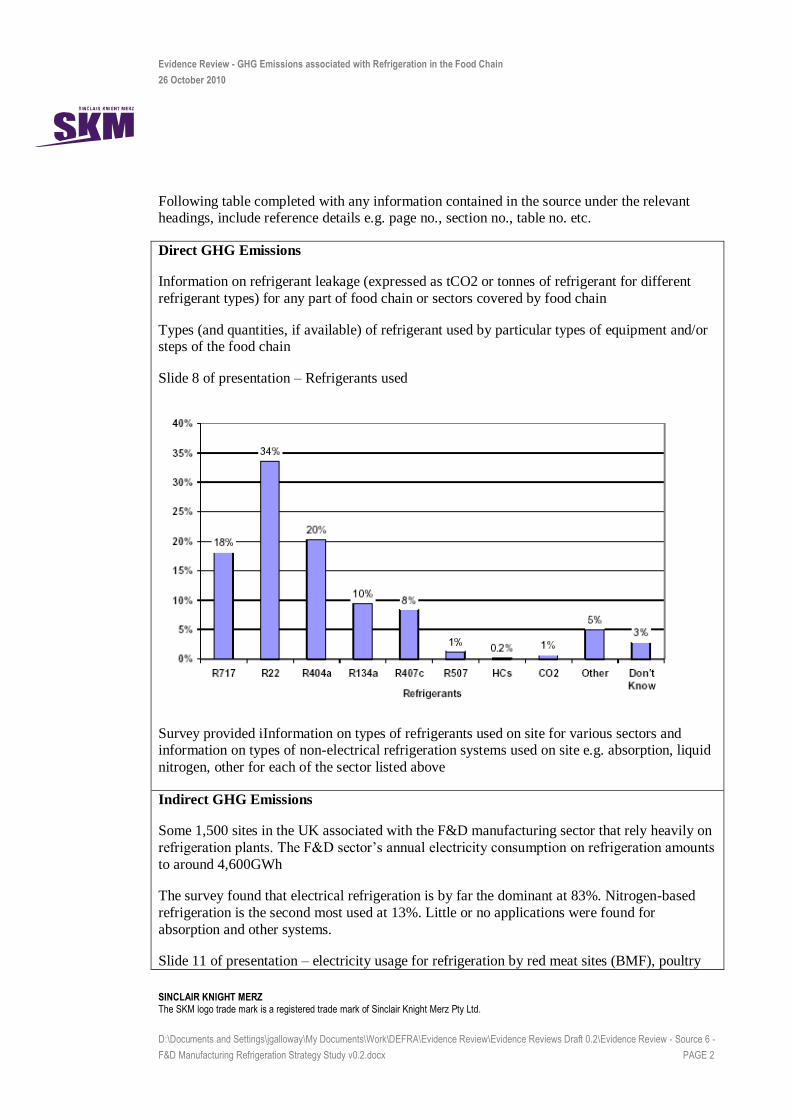
Direct GHG Emissions
Information on refrigerant leakage (expressed as tCO2 or tonnes of refrigerant for different
refrigerant types) for any part of food chain or sectors covered by food chain
Types (and quantities, if available) of refrigerant used by particular types of equipment and/or steps of the food chain
Slide 8 of presentation – Refrigerants used
Survey provided iInformation on types of refrigerants used on site for various sectors and information on types of non-electrical refrigeration systems used on site e.g. absorption, liquid
nitrogen, other for each of the sector listed above
Indirect GHG Emissions
Some 1,500 sites in the UK associated with the F&D manufacturing sector that rely heavily on
refrigeration plants. The F&D sector’s annual electricity consumption on refrigeration amounts
to around 4,600GWh
The survey found that electrical refrigeration is by far the dominant at 83%. Nitrogen-based
refrigeration is the second most used at 13%. Little or no applications were found for
absorption and other systems.
Slide 11 of presentation – electricity usage for refrigeration by red meat sites (BMF), poultry

Evidence Review - GHG Emissions associated with Refrigeration in the Food Chain
26 October 2010
SINCLAIR KNIGHT MERZ The SKM logo trade mark is a registered trade mark of Sinclair Knight Merz Pty Ltd.
D:\Documents and Settings\jgalloway\My Documents\Work\DEFRA\Evidence Review\Evidence Reviews Draft 0.2\Evidence Review - Source 6 -
F&D Manufacturing Refrigeration Strategy Study v0.2.docx PAGE 3
processing sites (BPC) and food and drink manufacturing sites (FDF)
Survey provided information on % electricity used for refrigeration according to site (<20%,
20-40%, 40-60%, >60%) for various sectors
Refrigeration Activities in each stage of the Food Chain
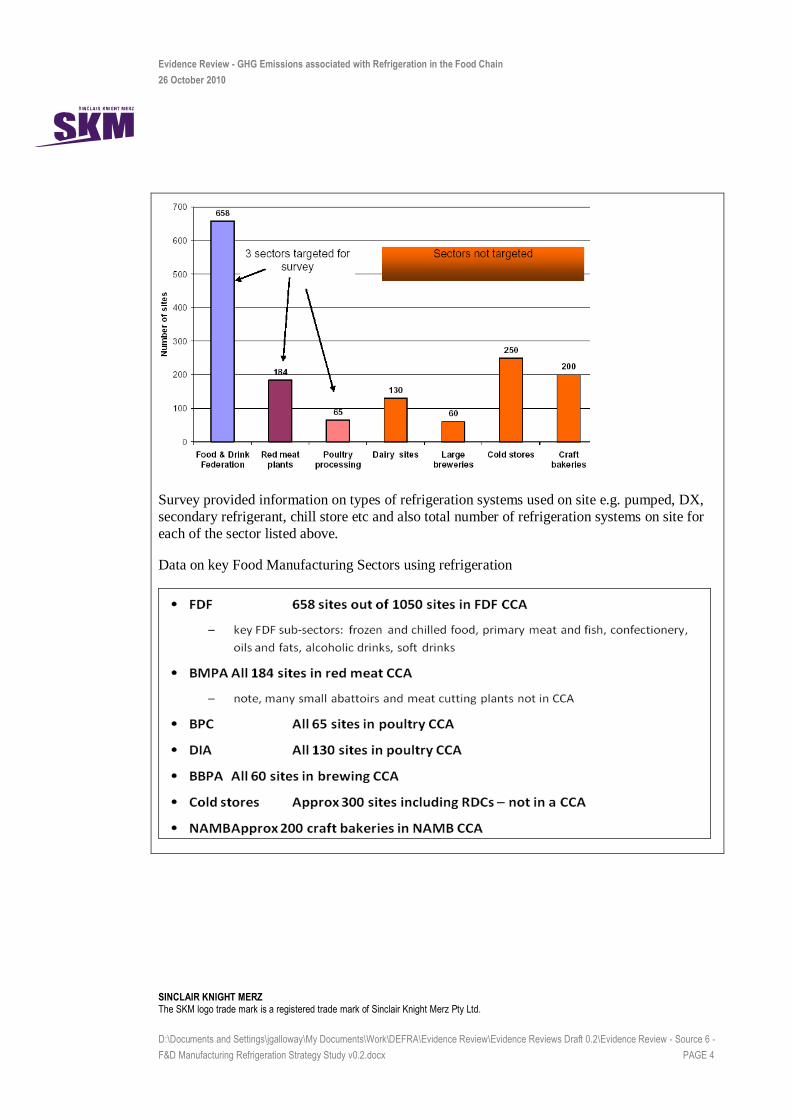
Subsectors within the FDF which require significant refrigeration were identified as follows, number in brackets is number of sites in FDF CCA:
Alcoholic drinks (17)
Confectionery (65)
Frozen and chilled food (412)
Oils and fats (22)
Pet foods (31)
Primary meat and fish (58)
Soft drinks (38)
On average, a site has 10 refrigeration plants carrying out various duties.
Slide 4 of presentation - Number of sites in various food and drink subsectors
Evidence Review - GHG Emissions associated with Refrigeration in the Food Chain
26 October 2010
SINCLAIR KNIGHT MERZ The SKM logo trade mark is a registered trade mark of Sinclair Knight Merz Pty Ltd.
D:\Documents and Settings\jgalloway\My Documents\Work\DEFRA\Evidence Review\Evidence Reviews Draft 0.2\Evidence Review - Source 6 -
F&D Manufacturing Refrigeration Strategy Study v0.2.docx PAGE 4
Survey provided information on types of refrigeration systems used on site e.g. pumped, DX,
secondary refrigerant, chill store etc and also total number of refrigeration systems on site for
each of the sector listed above.
Data on key Food Manufacturing Sectors using refrigeration
Evidence Review - GHG Emissions associated with Refrigeration in the Food Chain
26 October 2010
SINCLAIR KNIGHT MERZ The SKM logo trade mark is a registered trade mark of Sinclair Knight Merz Pty Ltd.
D:\Documents and Settings\jgalloway\My Documents\Work\DEFRA\Evidence Review\Evidence Reviews Draft 0.2\Evidence Review - Source 6 -
F&D Manufacturing Refrigeration Strategy Study v0.2.docx PAGE 5
Strategic Thinking
Report provides an action plan for energy and carbon savings based on refrigeration in the
food and drink (F&D) industry.
The survey indicated that there was a need for more specific assistance with the whole life-
cycle of refrigeration systems – from design and procurement to operation and maintenance
The report proposed that the CO2 emission reduction opportunities and challenges are met by actions based on the following five areas of support:
Understanding the sector’s needs
Increasing the number and improving the expertise of refrigeration consultants
Undertaking a campaign of refrigeration surveys
Developing Design Advice to help operators with procurement of new plant
Undertaking networking activities to engage end-users more effectively.
The industry survey suggested that there was a need for more specific assistance with the
whole life-cycle of refrigeration systems – from design and procurement to operation and
maintenance. This need was seen as urgent as:
Companies have relatively little ‘in-house’ expertise on the efficient operation of
refrigeration systems
Existing systems are not monitored well from an energy efficiency perspective
Most sites are part of CCAs and have an urgent need to meet more stringent targets
Investment in new refrigeration plant is currently influenced much more by capital cost rather than lifetime cost. This is detrimental to a new plant’s energy efficiency and carbon
saving
Many sites will need to replace their R22 refrigeration systems by 2010 (R22 is an HCFC
which is due to be phased out under EU regulations on ozone-depleting substances). The
survey shows that 70% of sites currently use R22. Experience with the replacement of CFCs shows that industry will need to move faster than the phase-out deadline indicates,
as refrigerant supply will become restricted much earlier. A major opportunity for energy
and carbon savings will be missed if the replacement plants are not designed efficiently.
Recommendations were:
A number of coordinated surveys (e.g. 20) are undertaken using the new Survey
Methodology. These would be targeted at companies with large refrigeration loads and including at least 10 of the survey respondents who have stated that they intend to buy a
new plant in the near future.
An additional 80 surveys were suggested, again with emphasis on selecting sites that have
responded to the refrigeration questionnaire and sites that are likely to invest in new plant
Evidence Review - GHG Emissions associated with Refrigeration in the Food Chain
26 October 2010
SINCLAIR KNIGHT MERZ The SKM logo trade mark is a registered trade mark of Sinclair Knight Merz Pty Ltd.
D:\Documents and Settings\jgalloway\My Documents\Work\DEFRA\Evidence Review\Evidence Reviews Draft 0.2\Evidence Review - Source 6 -
F&D Manufacturing Refrigeration Strategy Study v0.2.docx PAGE 6
Provide targeted training to some existing members of the Carbon Trust panel of consultants and to those newly recruited as refrigeration specialists. This will help to
ensure the successful delivery of the refrigeration-related services on which this action
plan is based.
Various networking activities will be useful to improve the implementation rate of certain
technologies and activities
Reduction Opportunities for Direct Emissions
Report estimates that by addressing leakage of refrigerants such as HFCs and HCFCs, a further
equivalent saving of about 0.1 million tonnes CO2 is possible, equivalent to reducing leakage by 25%.
Reduction Opportunities for Indirect Emissions
Report estimates that from electricity consumption, the overall saving potential is nearly 0.5
million tonnes CO2. This assumes an energy savings potential of about 20% for existing plants
and 30% for new developments.
Drivers and Barriers
Knowledge of refrigeration technology within industry is considered poor; 75% of the
respondents considered their design knowledge to be limited and 70% rely solely on
contractors when purchasing a refrigeration system. However, their knowledge on
maintenance and servicing is better, with about 50% having moderate to full in-house
capability
Advice on refrigeration found to be very poor in general energy surveys. Many surveys
provided no recommendations at all and some made incorrect recommendations. Relatively
few consultants available with a genuine knowledge of efficient design / operation of industrial refrigeration systems.
Evidence Review
GHG Emissions due to Refrigeration in the Food Chain
SINCLAIR KNIGHT MERZ
The SKM logo trade mark is a registered trade mark of Sinclair Knight Merz Pty Ltd.
D:\Documents and Settings\jgalloway\My Documents\Work\DEFRA\Evidence Review\Evidence Reviews Draft 0.2\Evidence Review - Source 7 -
Refrigeration Road Map - Retail v0.2.docx PAGE 1
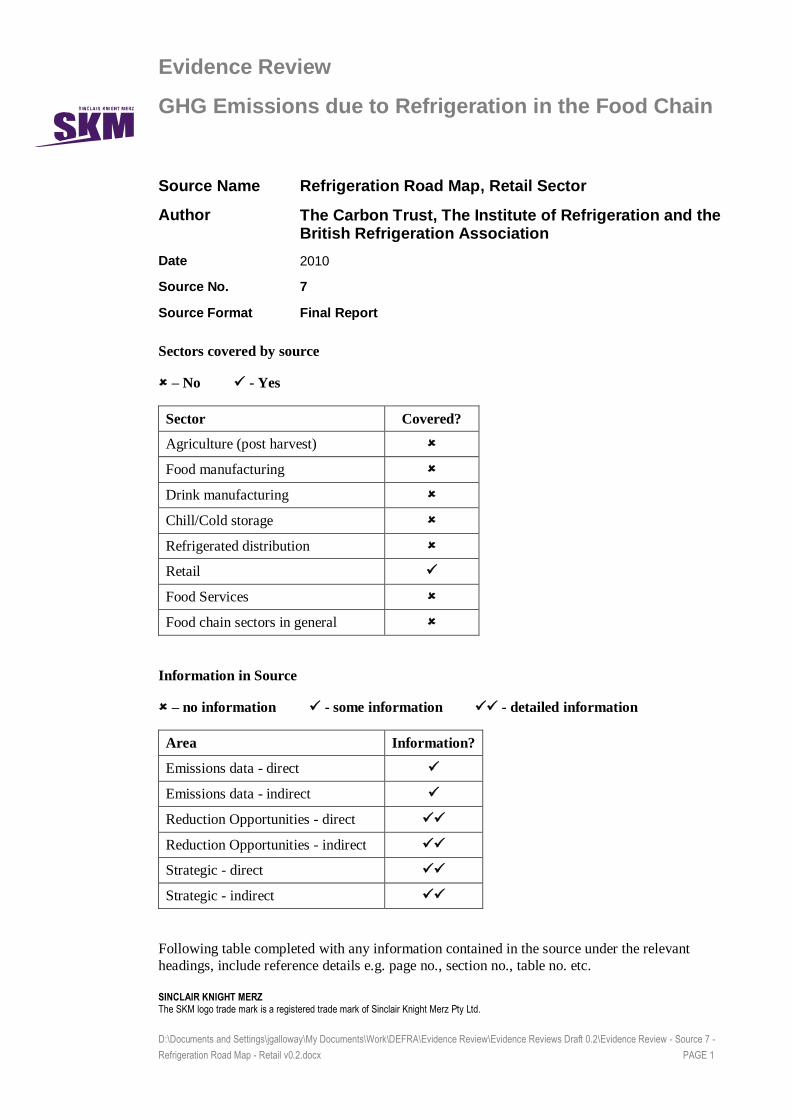
Source Name Refrigeration Road Map, Retail Sector
Author The Carbon Trust, The Institute of Refrigeration and the British Refrigeration Association
Date 2010
Source No. 7
Source Format Final Report
Sectors covered by source
– No - Yes
Sector Covered?
Agriculture (post harvest)
Food manufacturing
Drink manufacturing
Chill/Cold storage
Refrigerated distribution
Retail
Food Services
Food chain sectors in general
Information in Source
– no information - some information - detailed information
Area Information?
Emissions data - direct
Emissions data - indirect
Reduction Opportunities - direct
Reduction Opportunities - indirect
Strategic - direct
Strategic - indirect
Following table completed with any information contained in the source under the relevant
headings, include reference details e.g. page no., section no., table no. etc.
Evidence Review - GHG Emissions associated with Refrigeration in the Food Chain
26 October 2010
SINCLAIR KNIGHT MERZ The SKM logo trade mark is a registered trade mark of Sinclair Knight Merz Pty Ltd.
D:\Documents and Settings\jgalloway\My Documents\Work\DEFRA\Evidence Review\Evidence Reviews Draft 0.2\Evidence Review - Source 7 -
Refrigeration Road Map - Retail v0.2.docx PAGE 2
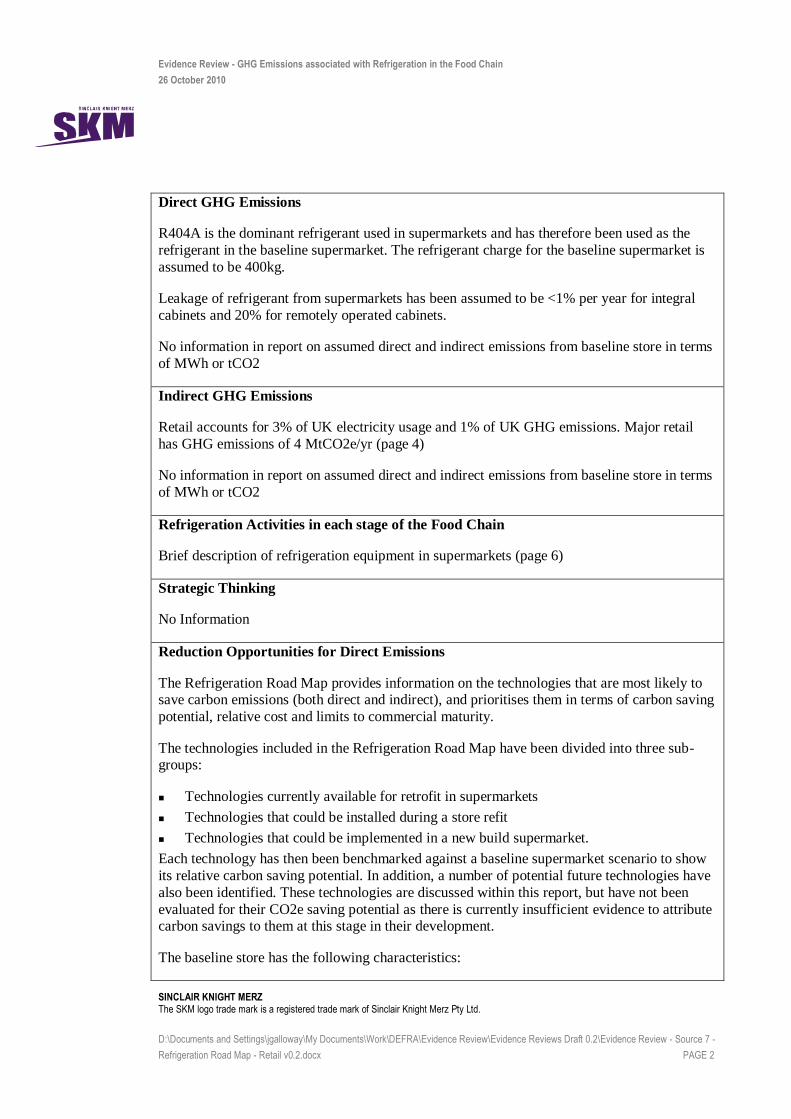
Direct GHG Emissions
R404A is the dominant refrigerant used in supermarkets and has therefore been used as the
refrigerant in the baseline supermarket. The refrigerant charge for the baseline supermarket is
assumed to be 400kg.
Leakage of refrigerant from supermarkets has been assumed to be <1% per year for integral
cabinets and 20% for remotely operated cabinets.
No information in report on assumed direct and indirect emissions from baseline store in terms
of MWh or tCO2
Indirect GHG Emissions
Retail accounts for 3% of UK electricity usage and 1% of UK GHG emissions. Major retail
has GHG emissions of 4 MtCO2e/yr (page 4)
No information in report on assumed direct and indirect emissions from baseline store in terms
of MWh or tCO2
Refrigeration Activities in each stage of the Food Chain
Brief description of refrigeration equipment in supermarkets (page 6)
Strategic Thinking
No Information
Reduction Opportunities for Direct Emissions
The Refrigeration Road Map provides information on the technologies that are most likely to save carbon emissions (both direct and indirect), and prioritises them in terms of carbon saving
potential, relative cost and limits to commercial maturity.
The technologies included in the Refrigeration Road Map have been divided into three sub-groups:
Technologies currently available for retrofit in supermarkets
Technologies that could be installed during a store refit
Technologies that could be implemented in a new build supermarket.
Each technology has then been benchmarked against a baseline supermarket scenario to show
its relative carbon saving potential. In addition, a number of potential future technologies have
also been identified. These technologies are discussed within this report, but have not been
evaluated for their CO2e saving potential as there is currently insufficient evidence to attribute carbon savings to them at this stage in their development.
The baseline store has the following characteristics:
Evidence Review - GHG Emissions associated with Refrigeration in the Food Chain
26 October 2010
SINCLAIR KNIGHT MERZ The SKM logo trade mark is a registered trade mark of Sinclair Knight Merz Pty Ltd.
D:\Documents and Settings\jgalloway\My Documents\Work\DEFRA\Evidence Review\Evidence Reviews Draft 0.2\Evidence Review - Source 7 -
Refrigeration Road Map - Retail v0.2.docx PAGE 3
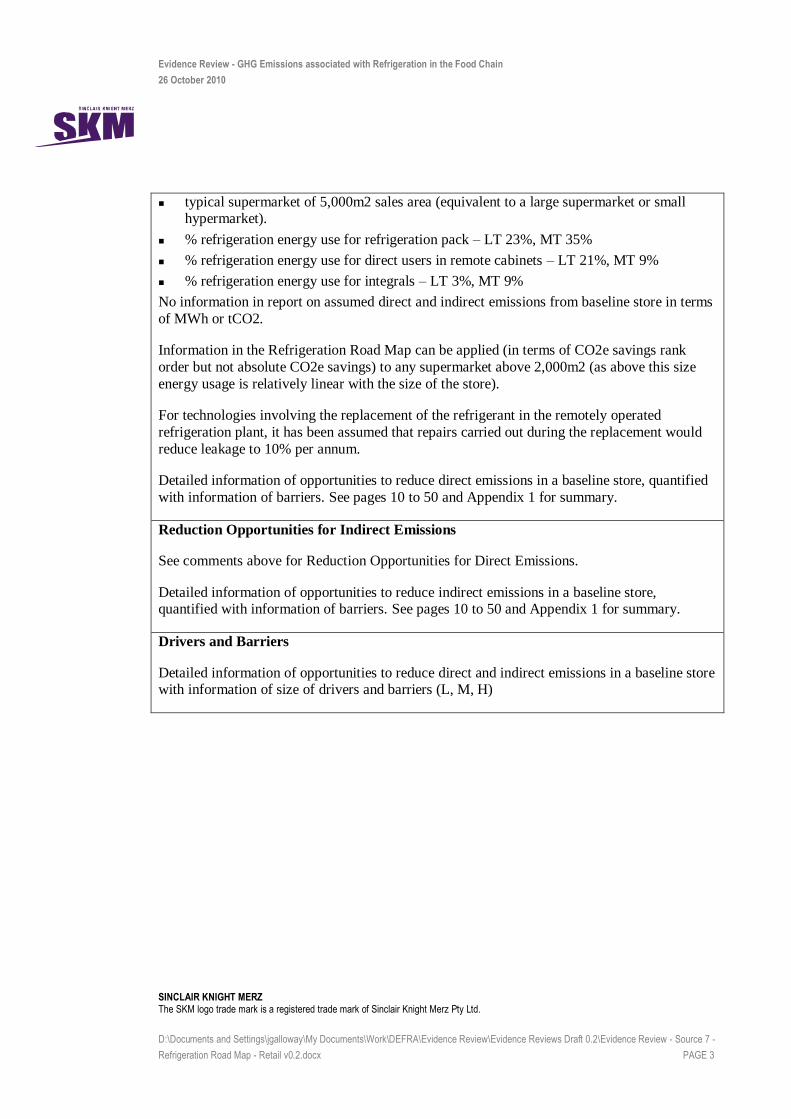
typical supermarket of 5,000m2 sales area (equivalent to a large supermarket or small hypermarket).
% refrigeration energy use for refrigeration pack – LT 23%, MT 35%
% refrigeration energy use for direct users in remote cabinets – LT 21%, MT 9%
% refrigeration energy use for integrals – LT 3%, MT 9%
No information in report on assumed direct and indirect emissions from baseline store in terms
of MWh or tCO2.
Information in the Refrigeration Road Map can be applied (in terms of CO2e savings rank
order but not absolute CO2e savings) to any supermarket above 2,000m2 (as above this size
energy usage is relatively linear with the size of the store).
For technologies involving the replacement of the refrigerant in the remotely operated
refrigeration plant, it has been assumed that repairs carried out during the replacement would
reduce leakage to 10% per annum.
Detailed information of opportunities to reduce direct emissions in a baseline store, quantified
with information of barriers. See pages 10 to 50 and Appendix 1 for summary.
Reduction Opportunities for Indirect Emissions
See comments above for Reduction Opportunities for Direct Emissions.
Detailed information of opportunities to reduce indirect emissions in a baseline store, quantified with information of barriers. See pages 10 to 50 and Appendix 1 for summary.
Drivers and Barriers
Detailed information of opportunities to reduce direct and indirect emissions in a baseline store with information of size of drivers and barriers (L, M, H)
Evidence Review
GHG Emissions due to Refrigeration in the Food Chain
SINCLAIR KNIGHT MERZ
The SKM logo trade mark is a registered trade mark of Sinclair Knight Merz Pty Ltd.
D:\Documents and Settings\jgalloway\My Documents\Work\DEFRA\Evidence Review\Evidence Reviews Draft 0.2\Evidence Review - Source 8 -
REI reports v0.2.docx PAGE 1
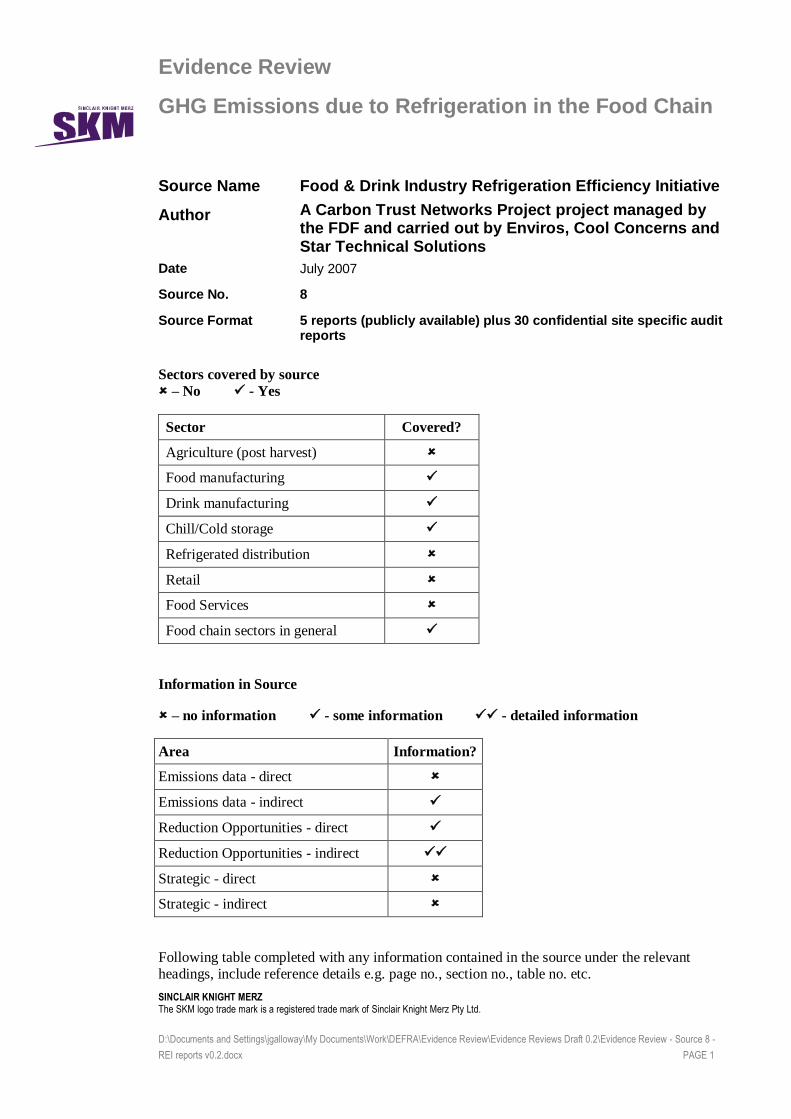
Source Name Food & Drink Industry Refrigeration Efficiency Initiative
Author A Carbon Trust Networks Project project managed by the FDF and carried out by Enviros, Cool Concerns and Star Technical Solutions
Date July 2007
Source No. 8
Source Format 5 reports (publicly available) plus 30 confidential site specific audit reports
Sectors covered by source
– No - Yes
Sector Covered?
Agriculture (post harvest)
Food manufacturing
Drink manufacturing
Chill/Cold storage
Refrigerated distribution
Retail
Food Services
Food chain sectors in general
Information in Source
– no information - some information - detailed information
Area Information?
Emissions data - direct
Emissions data - indirect
Reduction Opportunities - direct
Reduction Opportunities - indirect
Strategic - direct
Strategic - indirect
Following table completed with any information contained in the source under the relevant headings, include reference details e.g. page no., section no., table no. etc.
Evidence Review - GHG Emissions associated with Refrigeration in the Food Chain
26 October 2010
SINCLAIR KNIGHT MERZ The SKM logo trade mark is a registered trade mark of Sinclair Knight Merz Pty Ltd.
D:\Documents and Settings\jgalloway\My Documents\Work\DEFRA\Evidence Review\Evidence Reviews Draft 0.2\Evidence Review - Source 8 -
REI reports v0.2.docx PAGE 2
Direct GHG Emissions
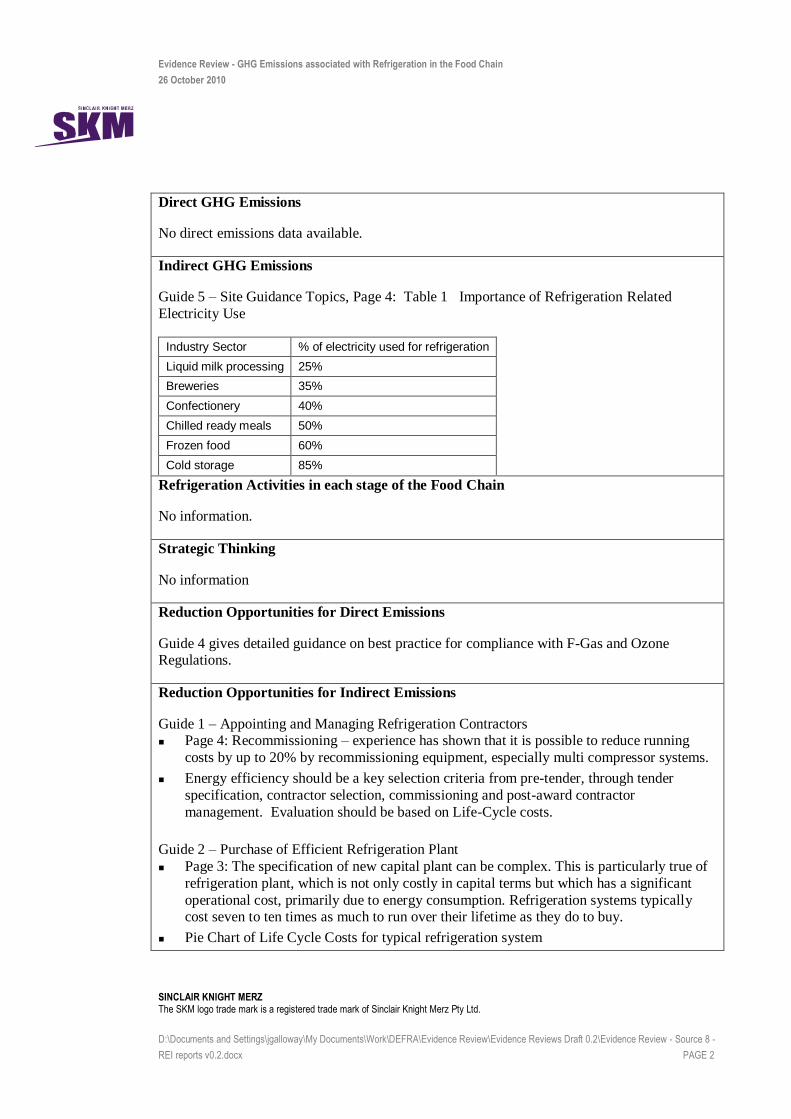
No direct emissions data available.
Indirect GHG Emissions
Guide 5 – Site Guidance Topics, Page 4: Table 1 Importance of Refrigeration Related
Electricity Use
Industry Sector % of electricity used for refrigeration
Liquid milk processing 25%
Breweries 35%
Confectionery 40%
Chilled ready meals 50%
Frozen food 60%
Cold storage 85%
Refrigeration Activities in each stage of the Food Chain
No information.
Strategic Thinking
No information
Reduction Opportunities for Direct Emissions
Guide 4 gives detailed guidance on best practice for compliance with F-Gas and Ozone Regulations.
Reduction Opportunities for Indirect Emissions
Guide 1 – Appointing and Managing Refrigeration Contractors Page 4: Recommissioning – experience has shown that it is possible to reduce running
costs by up to 20% by recommissioning equipment, especially multi compressor systems.
Energy efficiency should be a key selection criteria from pre-tender, through tender
specification, contractor selection, commissioning and post-award contractor
management. Evaluation should be based on Life-Cycle costs.
Guide 2 – Purchase of Efficient Refrigeration Plant
Page 3: The specification of new capital plant can be complex. This is particularly true of
refrigeration plant, which is not only costly in capital terms but which has a significant
operational cost, primarily due to energy consumption. Refrigeration systems typically cost seven to ten times as much to run over their lifetime as they do to buy.
Pie Chart of Life Cycle Costs for typical refrigeration system

Evidence Review - GHG Emissions associated with Refrigeration in the Food Chain
26 October 2010
SINCLAIR KNIGHT MERZ The SKM logo trade mark is a registered trade mark of Sinclair Knight Merz Pty Ltd.
D:\Documents and Settings\jgalloway\My Documents\Work\DEFRA\Evidence Review\Evidence Reviews Draft 0.2\Evidence Review - Source 8 -
REI reports v0.2.docx PAGE 3
Page 7: Key elements of an efficient plant :
– Minimising cooling loads.
– Maximising system efficiency at the prevalent load and ambient.
– Optimising running conditions.
– Selecting and matching refrigeration system components for efficient operation. This
includes the refrigerant.
– Providing sufficient control and monitoring equipment.
– Installing and commissioning the refrigeration plant properly.
– Using heat recovery, free cooling and thermal storage opportunities where appropriate.
Page 11: REMEMBER - The greatest and easiest opportunity for maximising refrigeration
plant operational efficiency is at the specification and purchase phase of its life
Guide 3 – Operational Efficiency Improvements for Refrigeration Systems
Page 7: Probably the most common faults are those linked to condensers
Page 12: Minimise “Temperature Lift” to Maximise Performance
Guide 5 – Site Guidance Topics
Reducing heat loads and Temperature Lift (e.g. dairy pasteuriser “coolth” recovery)
Reducing head pressure
Improving part load performance
Reducing power consumed by pumps and fans
Drivers and Barriers
No information
Equipment and installation
Service and maintenance
Energy
Evidence Review
GHG Emissions due to Refrigeration in the Food Chain
SINCLAIR KNIGHT MERZ
The SKM logo trade mark is a registered trade mark of Sinclair Knight Merz Pty Ltd.
D:\Documents and Settings\jgalloway\My Documents\Work\DEFRA\Evidence Review\Evidence Reviews Draft 0.2\Evidence Review - Source 9 -
Study of Food Refrigeration Operations by University Consortium v0.2.docx PAGE 1
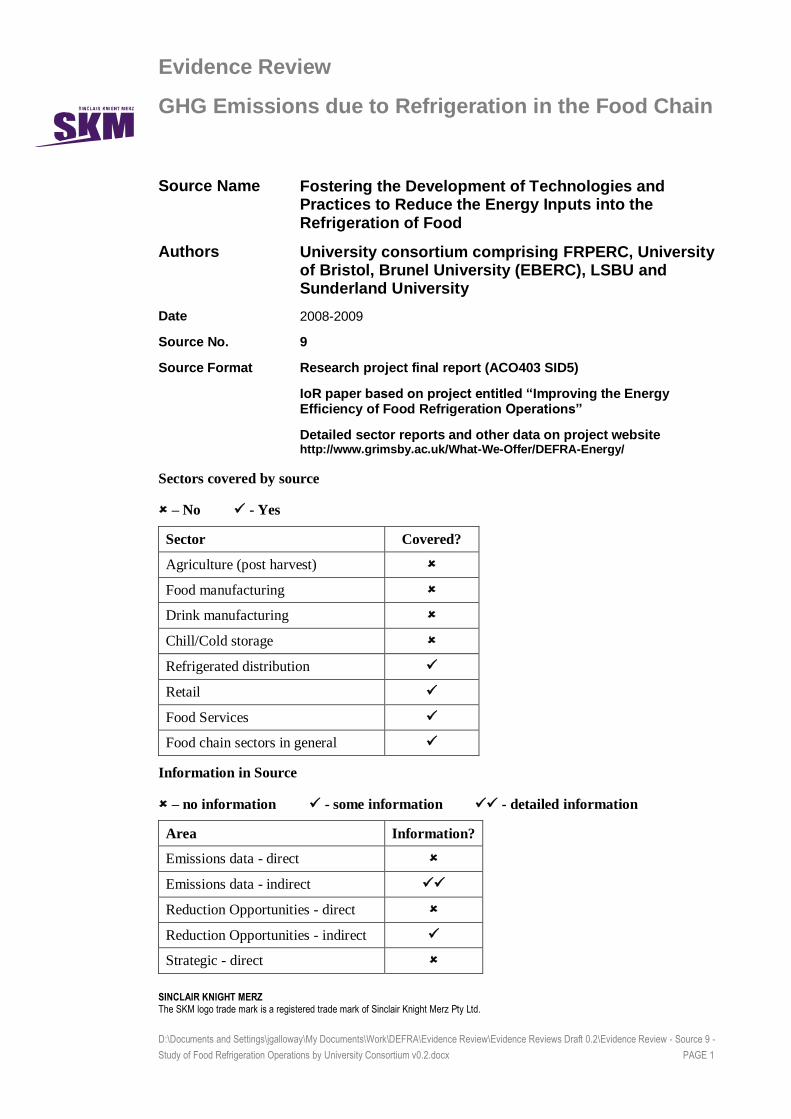
Source Name Fostering the Development of Technologies and Practices to Reduce the Energy Inputs into the Refrigeration of Food
Authors University consortium comprising FRPERC, University of Bristol, Brunel University (EBERC), LSBU and Sunderland University
Date 2008-2009
Source No. 9
Source Format Research project final report (ACO403 SID5)
IoR paper based on project entitled “Improving the Energy Efficiency of Food Refrigeration Operations”
Detailed sector reports and other data on project website http://www.grimsby.ac.uk/What-We-Offer/DEFRA-Energy/
Sectors covered by source
– No - Yes
Sector Covered?
Agriculture (post harvest)
Food manufacturing
Drink manufacturing
Chill/Cold storage
Refrigerated distribution
Retail
Food Services
Food chain sectors in general
Information in Source
– no information - some information - detailed information
Area Information?
Emissions data - direct
Emissions data - indirect
Reduction Opportunities - direct
Reduction Opportunities - indirect
Strategic - direct
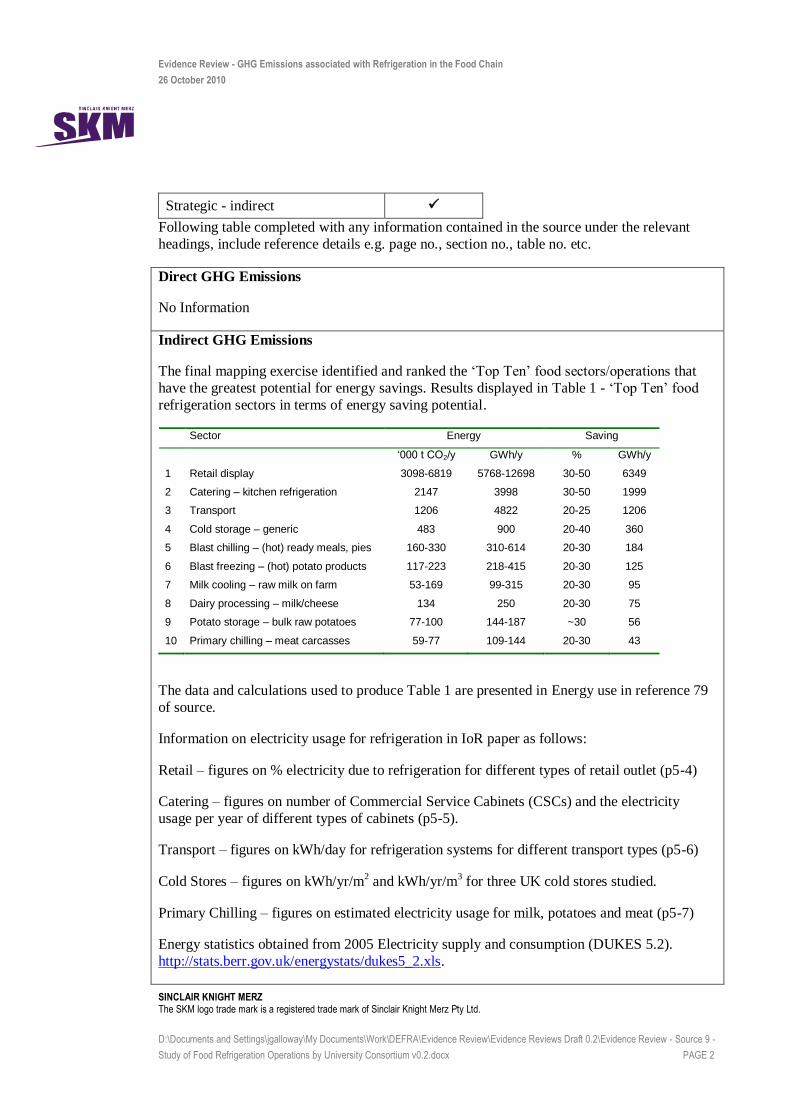
Evidence Review - GHG Emissions associated with Refrigeration in the Food Chain
26 October 2010
SINCLAIR KNIGHT MERZ The SKM logo trade mark is a registered trade mark of Sinclair Knight Merz Pty Ltd.
D:\Documents and Settings\jgalloway\My Documents\Work\DEFRA\Evidence Review\Evidence Reviews Draft 0.2\Evidence Review - Source 9 -
Study of Food Refrigeration Operations by University Consortium v0.2.docx PAGE 2
Strategic - indirect
Following table completed with any information contained in the source under the relevant
headings, include reference details e.g. page no., section no., table no. etc.
Direct GHG Emissions
No Information
Indirect GHG Emissions
The final mapping exercise identified and ranked the ‘Top Ten’ food sectors/operations that
have the greatest potential for energy savings. Results displayed in Table 1 - ‘Top Ten’ food
refrigeration sectors in terms of energy saving potential.
Sector Energy Saving
‘000 t CO2/y GWh/y % GWh/y
1 Retail display 3098-6819 5768-12698 30-50 6349
2 Catering – kitchen refrigeration 2147 3998 30-50 1999
3 Transport 1206 4822 20-25 1206
4 Cold storage – generic 483 900 20-40 360
5 Blast chilling – (hot) ready meals, pies 160-330 310-614 20-30 184
6 Blast freezing – (hot) potato products 117-223 218-415 20-30 125
7 Milk cooling – raw milk on farm 53-169 99-315 20-30 95
8 Dairy processing – milk/cheese 134 250 20-30 75
9 Potato storage – bulk raw potatoes 77-100 144-187 ~30 56
10 Primary chilling – meat carcasses 59-77 109-144 20-30 43
The data and calculations used to produce Table 1 are presented in Energy use in reference 79
of source.
Information on electricity usage for refrigeration in IoR paper as follows:
Retail – figures on % electricity due to refrigeration for different types of retail outlet (p5-4)
Catering – figures on number of Commercial Service Cabinets (CSCs) and the electricity
usage per year of different types of cabinets (p5-5).
Transport – figures on kWh/day for refrigeration systems for different transport types (p5-6)
Cold Stores – figures on kWh/yr/m2 and kWh/yr/m
3 for three UK cold stores studied.
Primary Chilling – figures on estimated electricity usage for milk, potatoes and meat (p5-7)
Energy statistics obtained from 2005 Electricity supply and consumption (DUKES 5.2).
http://stats.berr.gov.uk/energystats/dukes5_2.xls.
Evidence Review - GHG Emissions associated with Refrigeration in the Food Chain
26 October 2010
SINCLAIR KNIGHT MERZ The SKM logo trade mark is a registered trade mark of Sinclair Knight Merz Pty Ltd.
D:\Documents and Settings\jgalloway\My Documents\Work\DEFRA\Evidence Review\Evidence Reviews Draft 0.2\Evidence Review - Source 9 -
Study of Food Refrigeration Operations by University Consortium v0.2.docx PAGE 3
Refrigeration Activities in each stage of the Food Chain
Types of refrigeration systems used for road transport in Transport Sector Focus report.
Strategic Thinking
Following a workshop run at FRPERC, Bristol in June 2007, a proposal was put forward to
produce a prototype retail cabinet that would incorporate significant energy saving measures and meet the carbon emission savings demanded by modern supermarket chains. This was
submitted to LINK but was not funded.
Reduction Opportunities for Direct Emissions
The report concludes that overall, across the whole operating range in a retail food store, CO2
systems are thought to be efficiency neutral compared to R404A systems. (Page 7)
Reduction Opportunities for Indirect Emissions
The report identified and ranked the ‘Top Ten’ food sectors/operations that have the greatest
potential for energy savings. See table above.
The savings identified have been backed up by a set of individual actions that could be taken in
each application area, and the expected savings from each. These actions do not factor in new
technology and thus represent what could be done now.
What comes out very clearly is that maintenance is an area of weakness across the board.
There is also a lack of optimisation of the operation of existing plant and a lack of installation
of relatively simple augmentations such as curtains and other devices to reduce infiltration through doors. Another recurring theme is the lack of good design of systems, including
controls.
A number of specific approaches to energy reduction have been discussed and the expected saving quantified through examples. This includes Ambient cooling, Liquid Pressure
Amplification; Vacuum panel insulation in transport; and Head pressure control.
The potential for new or emerging technologies to make major contributions to energy reduction was examined. It was concluded that such technologies are likely to be for niche
applications only and are not likely to contribute to any step change in energy use. Vapour
compression systems seem set to continue to be used, although CO2 is likely to replace F-gases due to the environmental benefits of the former.
The project developed new and more advanced tools for modelling individual components and
system performance under dynamic conditions of use. The aim was that these tools would help with component and system design, including control.
Further detail can be found in the body of the report.
Evidence Review - GHG Emissions associated with Refrigeration in the Food Chain
26 October 2010
SINCLAIR KNIGHT MERZ The SKM logo trade mark is a registered trade mark of Sinclair Knight Merz Pty Ltd.
D:\Documents and Settings\jgalloway\My Documents\Work\DEFRA\Evidence Review\Evidence Reviews Draft 0.2\Evidence Review - Source 9 -
Study of Food Refrigeration Operations by University Consortium v0.2.docx PAGE 4
Objective 2.1 – Develop generic technologies and business practices that have the potential to reduce refrigeration energy consumption. Objective 2.1.1 deals with new and emerging
technologies and Objective 2.1.2 assesses energy savings potential from efficiency
improvements of current technologies. Details on savings potential through improved maintenance are also given on Page 10 of the report (Objective 2.1.4)
Objective 2.2 - Identify the features of the most efficient current systems and make them and
their energy saving potential widely known to the industry.
Also see Objective 3, page 16 which discusses most attractive technologies that have the
potential to achieve substantial energy saving in food refrigeration
Information on opportunities to reduce electricity usage for refrigeration in IoR paper as
follows:
Retail – broad brush savings estimate for smaller size food stores (page 5-4)
Catering – broad brush savings estimates for replacing CSCs with best available and also
example savings for frozen cabinet through optimising operation (page 5-5)
Cold Stores - % savings for three UK cold stores studied and type of saving opportunity
Primary Chilling – broad brush savings estimate for technology transfer (page 5-7)
New Technologies and Management Systems – information on page 5-7 & 5-8
Saving opportunities for refrigerated road transport given in Transport Sector Focus report.
Drivers and Barriers
Report identified lack of understanding and skills as barrier for maintenance, optimisation and
design of systems. (Exec Summary and Objective 2.3)
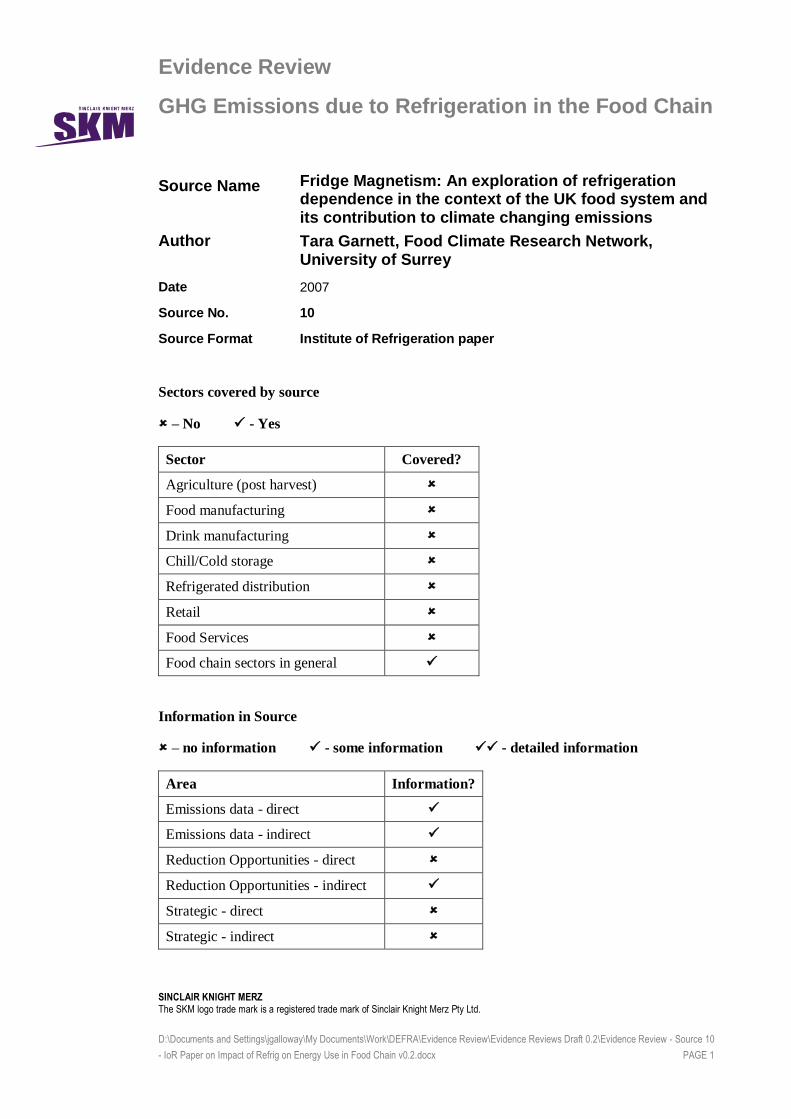
Evidence Review
GHG Emissions due to Refrigeration in the Food Chain
SINCLAIR KNIGHT MERZ
The SKM logo trade mark is a registered trade mark of Sinclair Knight Merz Pty Ltd.
D:\Documents and Settings\jgalloway\My Documents\Work\DEFRA\Evidence Review\Evidence Reviews Draft 0.2\Evidence Review - Source 10
- IoR Paper on Impact of Refrig on Energy Use in Food Chain v0.2.docx PAGE 1
Source Name Fridge Magnetism: An exploration of refrigeration dependence in the context of the UK food system and its contribution to climate changing emissions
Author Tara Garnett, Food Climate Research Network, University of Surrey
Date 2007
Source No. 10
Source Format Institute of Refrigeration paper
Sectors covered by source
– No - Yes
Sector Covered?
Agriculture (post harvest)
Food manufacturing
Drink manufacturing
Chill/Cold storage
Refrigerated distribution
Retail
Food Services
Food chain sectors in general
Information in Source
– no information - some information - detailed information
Area Information?
Emissions data - direct
Emissions data - indirect
Reduction Opportunities - direct
Reduction Opportunities - indirect
Strategic - direct
Strategic - indirect
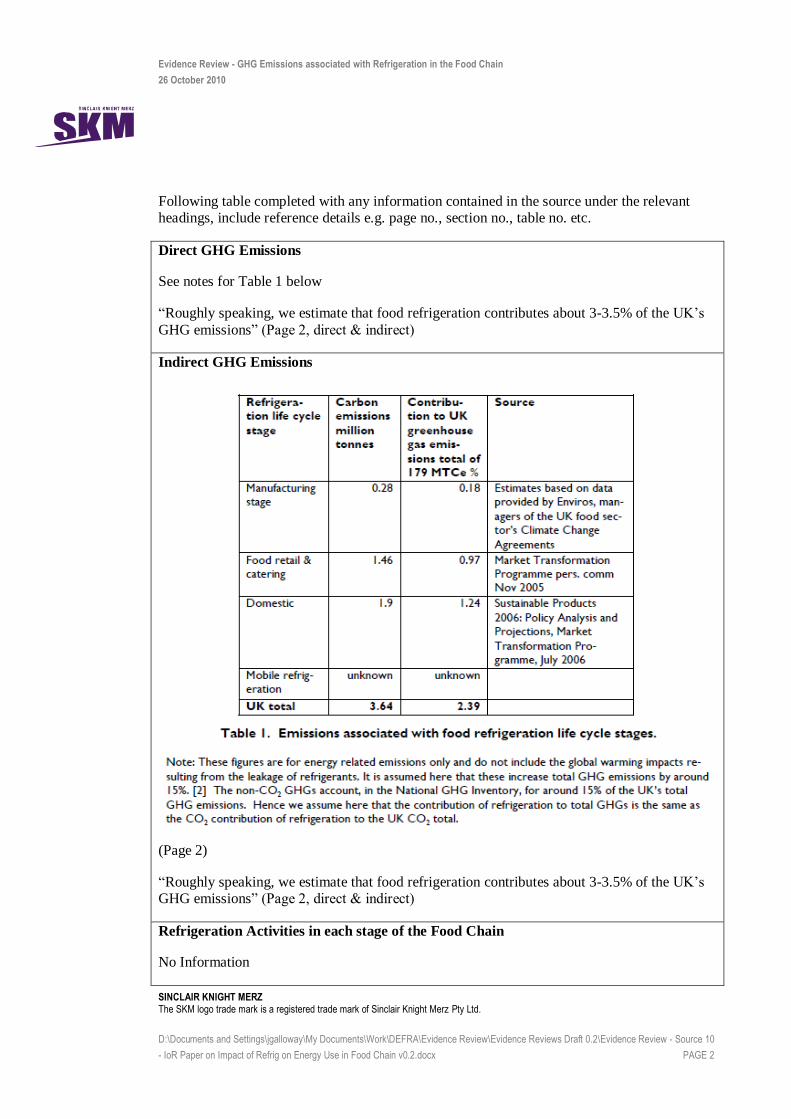
Evidence Review - GHG Emissions associated with Refrigeration in the Food Chain
26 October 2010
SINCLAIR KNIGHT MERZ The SKM logo trade mark is a registered trade mark of Sinclair Knight Merz Pty Ltd.
D:\Documents and Settings\jgalloway\My Documents\Work\DEFRA\Evidence Review\Evidence Reviews Draft 0.2\Evidence Review - Source 10
- IoR Paper on Impact of Refrig on Energy Use in Food Chain v0.2.docx PAGE 2
Following table completed with any information contained in the source under the relevant headings, include reference details e.g. page no., section no., table no. etc.
Direct GHG Emissions
See notes for Table 1 below
“Roughly speaking, we estimate that food refrigeration contributes about 3-3.5% of the UK’s
GHG emissions” (Page 2, direct & indirect)
Indirect GHG Emissions
(Page 2)
“Roughly speaking, we estimate that food refrigeration contributes about 3-3.5% of the UK’s GHG emissions” (Page 2, direct & indirect)
Refrigeration Activities in each stage of the Food Chain
No Information
Evidence Review - GHG Emissions associated with Refrigeration in the Food Chain
26 October 2010
SINCLAIR KNIGHT MERZ The SKM logo trade mark is a registered trade mark of Sinclair Knight Merz Pty Ltd.
D:\Documents and Settings\jgalloway\My Documents\Work\DEFRA\Evidence Review\Evidence Reviews Draft 0.2\Evidence Review - Source 10
- IoR Paper on Impact of Refrig on Energy Use in Food Chain v0.2.docx PAGE 3
Strategic Thinking
No Information
Reduction Opportunities for Direct Emissions
No Information
Reduction Opportunities for Indirect Emissions
“Energy savings of between 20% [4] [5] and 50% [6] are considered possible through the
proper specification, use and maintenance of equipment. Further gains can be achieved with
the use of newer technologies such as trigeneration” (Page 3) No further discussion of options.
“Projections by the Government-funded Market Transformation Programme (MTP), [7]
suggest that overall energy use by commercial refrigeration could rise by 6% or fall by 8%
(from a 2000 baseline) depending on the policy context.” “Importantly however, the MTP
projections do not take into account refrigeration energy used by goods in transport” “Crucially the MTP projections do not consider cultural trends in marketing, lifestyle, food
innovation and the environment that could substantially alter their conclusions” (Page 3)
Drivers and Barriers
No Information
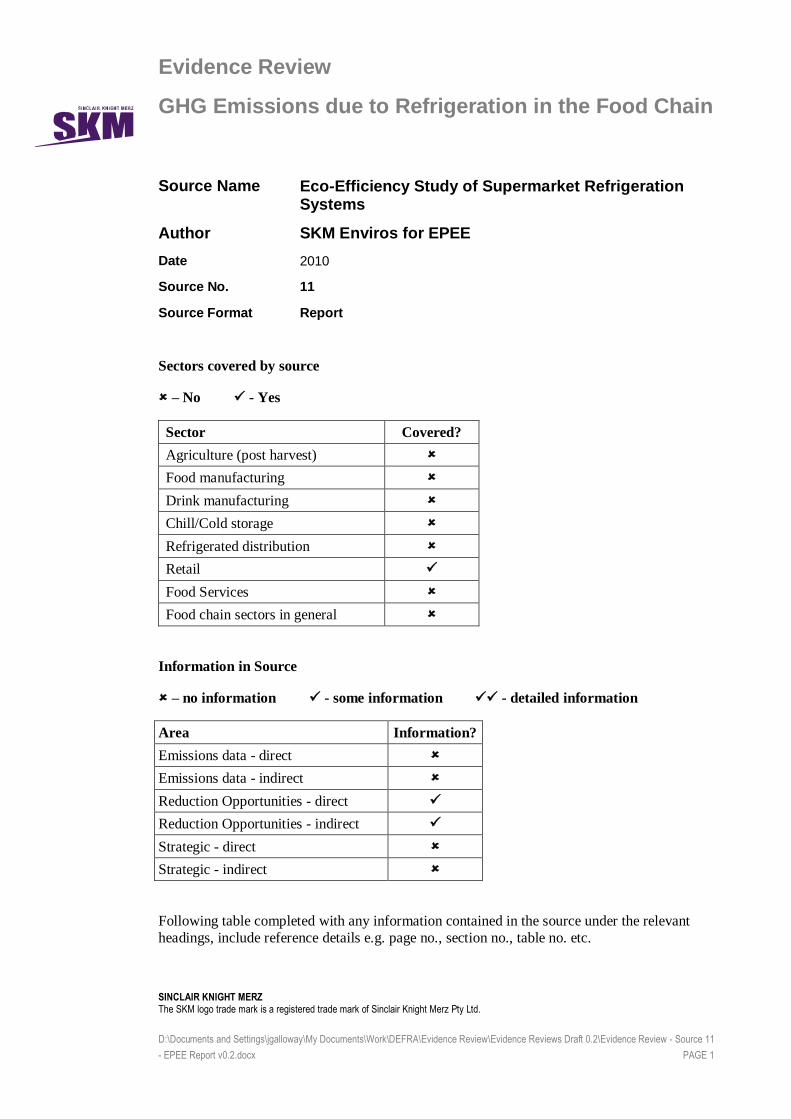
Evidence Review
GHG Emissions due to Refrigeration in the Food Chain
SINCLAIR KNIGHT MERZ
The SKM logo trade mark is a registered trade mark of Sinclair Knight Merz Pty Ltd.
D:\Documents and Settings\jgalloway\My Documents\Work\DEFRA\Evidence Review\Evidence Reviews Draft 0.2\Evidence Review - Source 11
- EPEE Report v0.2.docx PAGE 1
Source Name Eco-Efficiency Study of Supermarket Refrigeration Systems
Author SKM Enviros for EPEE
Date 2010
Source No. 11
Source Format Report
Sectors covered by source
– No - Yes
Sector Covered?
Agriculture (post harvest)
Food manufacturing
Drink manufacturing
Chill/Cold storage
Refrigerated distribution
Retail
Food Services
Food chain sectors in general
Information in Source
– no information - some information - detailed information
Area Information?
Emissions data - direct
Emissions data - indirect
Reduction Opportunities - direct
Reduction Opportunities - indirect
Strategic - direct
Strategic - indirect
Following table completed with any information contained in the source under the relevant
headings, include reference details e.g. page no., section no., table no. etc.
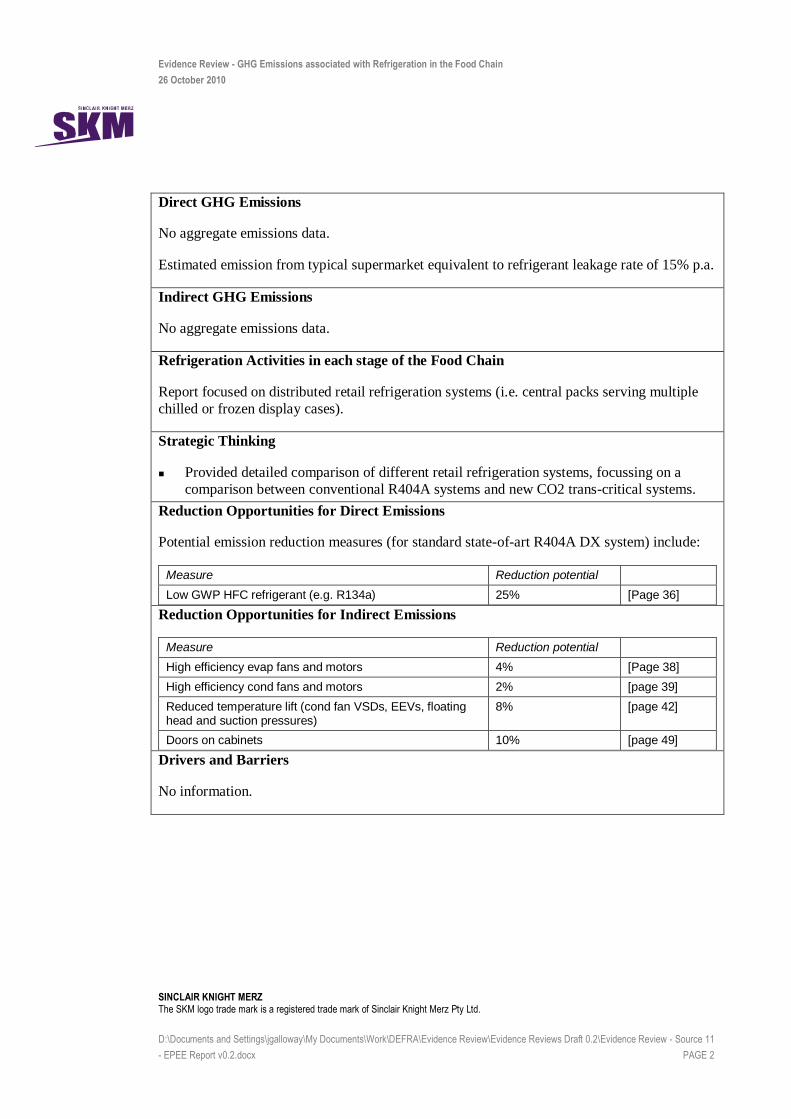
Evidence Review - GHG Emissions associated with Refrigeration in the Food Chain
26 October 2010
SINCLAIR KNIGHT MERZ The SKM logo trade mark is a registered trade mark of Sinclair Knight Merz Pty Ltd.
D:\Documents and Settings\jgalloway\My Documents\Work\DEFRA\Evidence Review\Evidence Reviews Draft 0.2\Evidence Review - Source 11
- EPEE Report v0.2.docx PAGE 2
Direct GHG Emissions
No aggregate emissions data.
Estimated emission from typical supermarket equivalent to refrigerant leakage rate of 15% p.a.
Indirect GHG Emissions
No aggregate emissions data.
Refrigeration Activities in each stage of the Food Chain
Report focused on distributed retail refrigeration systems (i.e. central packs serving multiple
chilled or frozen display cases).
Strategic Thinking
Provided detailed comparison of different retail refrigeration systems, focussing on a
comparison between conventional R404A systems and new CO2 trans-critical systems.
Reduction Opportunities for Direct Emissions
Potential emission reduction measures (for standard state-of-art R404A DX system) include:
Measure Reduction potential
Low GWP HFC refrigerant (e.g. R134a) 25% [Page 36]
Reduction Opportunities for Indirect Emissions
Measure Reduction potential
High efficiency evap fans and motors 4% [Page 38]
High efficiency cond fans and motors 2% [page 39]
Reduced temperature lift (cond fan VSDs, EEVs, floating head and suction pressures)
8% [page 42]
Doors on cabinets 10% [page 49]
Drivers and Barriers
No information.
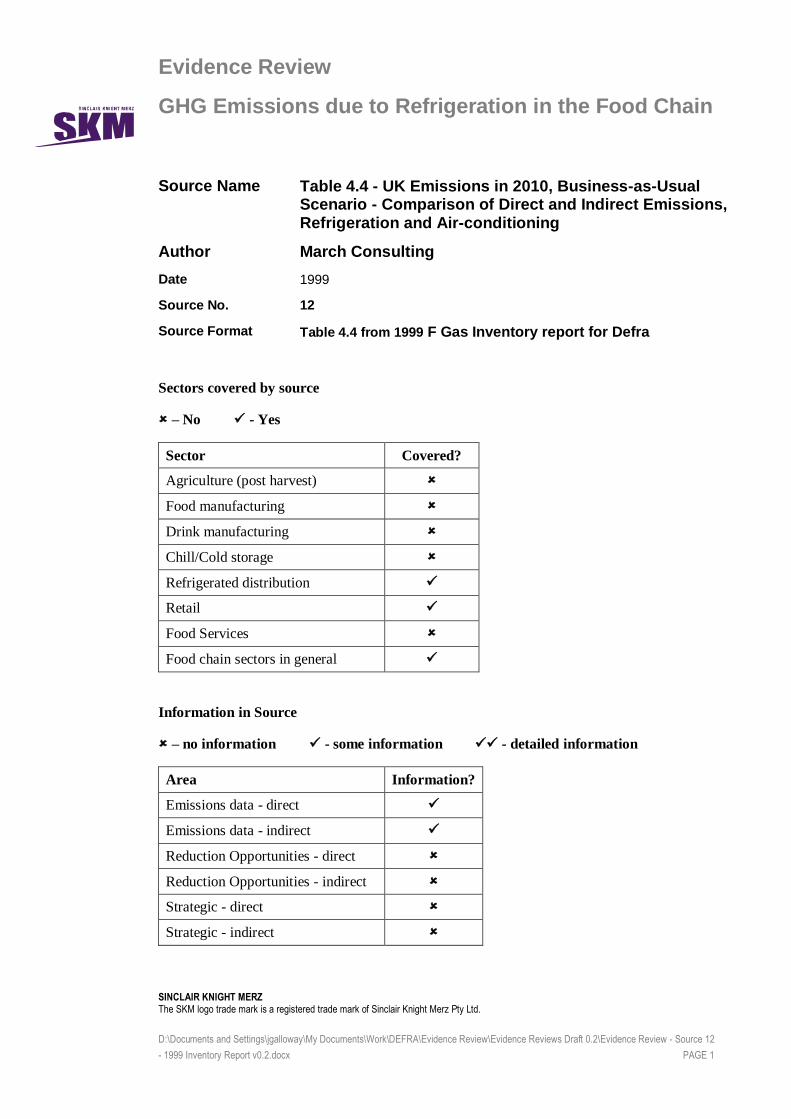
Evidence Review
GHG Emissions due to Refrigeration in the Food Chain
SINCLAIR KNIGHT MERZ
The SKM logo trade mark is a registered trade mark of Sinclair Knight Merz Pty Ltd.
D:\Documents and Settings\jgalloway\My Documents\Work\DEFRA\Evidence Review\Evidence Reviews Draft 0.2\Evidence Review - Source 12
- 1999 Inventory Report v0.2.docx PAGE 1
Source Name Table 4.4 - UK Emissions in 2010, Business-as-Usual Scenario - Comparison of Direct and Indirect Emissions, Refrigeration and Air-conditioning
Author March Consulting
Date 1999
Source No. 12
Source Format Table 4.4 from 1999 F Gas Inventory report for Defra
Sectors covered by source
– No - Yes
Sector Covered?
Agriculture (post harvest)
Food manufacturing
Drink manufacturing
Chill/Cold storage
Refrigerated distribution
Retail
Food Services
Food chain sectors in general
Information in Source
– no information - some information - detailed information
Area Information?
Emissions data - direct
Emissions data - indirect
Reduction Opportunities - direct
Reduction Opportunities - indirect
Strategic - direct
Strategic - indirect
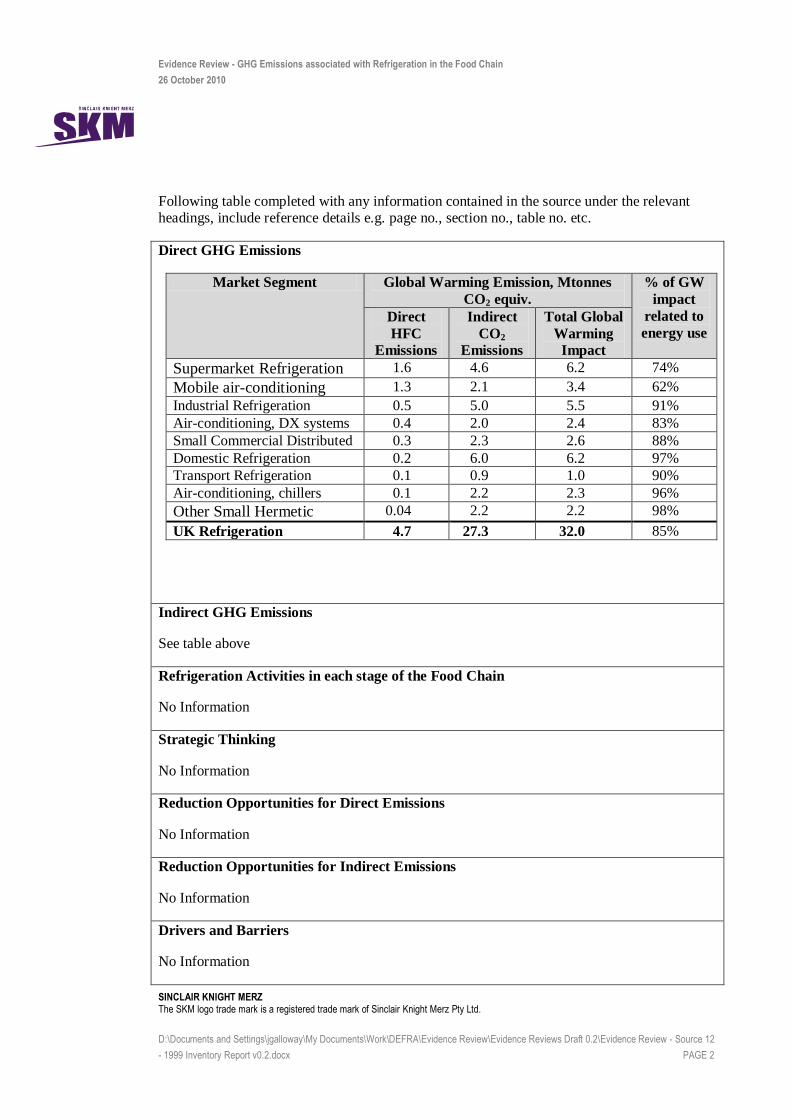
Evidence Review - GHG Emissions associated with Refrigeration in the Food Chain
26 October 2010
SINCLAIR KNIGHT MERZ The SKM logo trade mark is a registered trade mark of Sinclair Knight Merz Pty Ltd.
D:\Documents and Settings\jgalloway\My Documents\Work\DEFRA\Evidence Review\Evidence Reviews Draft 0.2\Evidence Review - Source 12
- 1999 Inventory Report v0.2.docx PAGE 2
Following table completed with any information contained in the source under the relevant headings, include reference details e.g. page no., section no., table no. etc.
Direct GHG Emissions
Market Segment Global Warming Emission, Mtonnes
CO2 equiv.
% of GW
impact
related to
energy use Direct
HFC
Emissions
Indirect
CO2
Emissions
Total Global
Warming
Impact
Supermarket Refrigeration 1.6 4.6 6.2 74%
Mobile air-conditioning 1.3 2.1 3.4 62%
Industrial Refrigeration 0.5 5.0 5.5 91%
Air-conditioning, DX systems 0.4 2.0 2.4 83%
Small Commercial Distributed 0.3 2.3 2.6 88%
Domestic Refrigeration 0.2 6.0 6.2 97%
Transport Refrigeration 0.1 0.9 1.0 90%
Air-conditioning, chillers 0.1 2.2 2.3 96%
Other Small Hermetic 0.04 2.2 2.2 98%
UK Refrigeration 4.7 27.3 32.0 85%
Indirect GHG Emissions
See table above
Refrigeration Activities in each stage of the Food Chain
No Information
Strategic Thinking
No Information
Reduction Opportunities for Direct Emissions
No Information
Reduction Opportunities for Indirect Emissions
No Information
Drivers and Barriers
No Information
Evidence Review - GHG Emissions associated with Refrigeration in the Food Chain
26 October 2010
SINCLAIR KNIGHT MERZ The SKM logo trade mark is a registered trade mark of Sinclair Knight Merz Pty Ltd.
D:\Documents and Settings\jgalloway\My Documents\Work\DEFRA\Evidence Review\Evidence Reviews Draft 0.2\Evidence Review - Source 12
- 1999 Inventory Report v0.2.docx PAGE 3
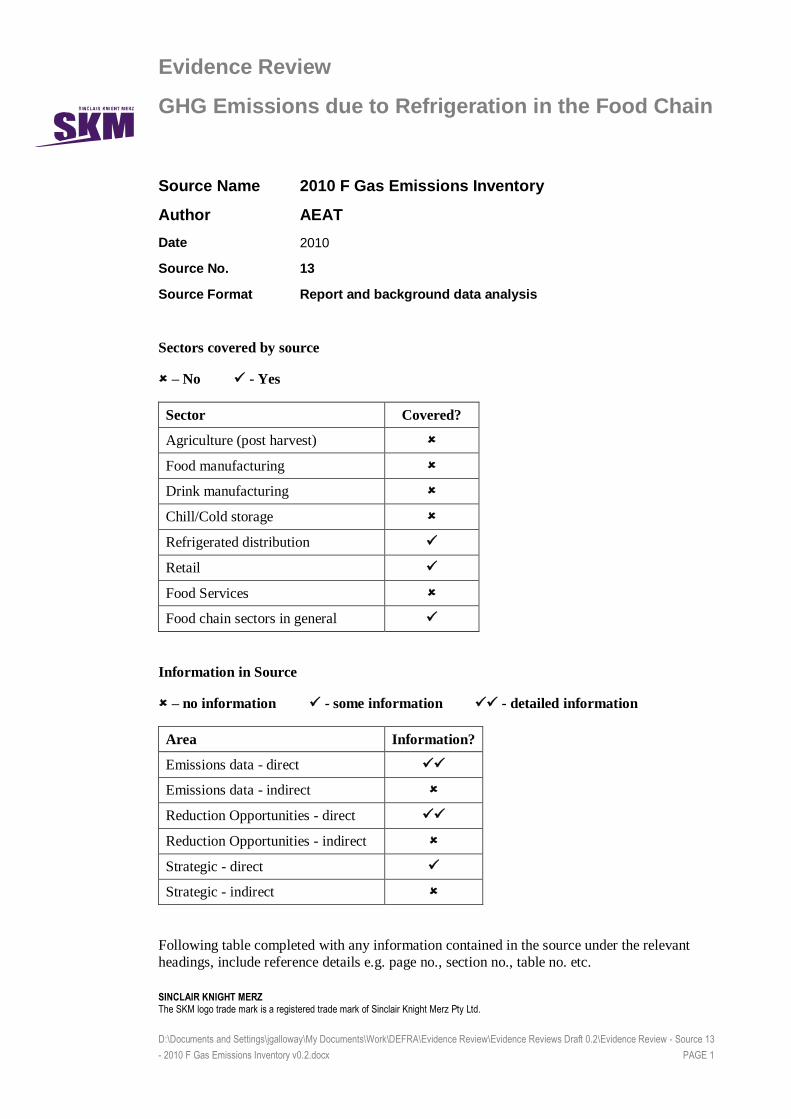
Evidence Review
GHG Emissions due to Refrigeration in the Food Chain
SINCLAIR KNIGHT MERZ
The SKM logo trade mark is a registered trade mark of Sinclair Knight Merz Pty Ltd.
D:\Documents and Settings\jgalloway\My Documents\Work\DEFRA\Evidence Review\Evidence Reviews Draft 0.2\Evidence Review - Source 13
- 2010 F Gas Emissions Inventory v0.2.docx PAGE 1
Source Name 2010 F Gas Emissions Inventory
Author AEAT
Date 2010
Source No. 13
Source Format Report and background data analysis
Sectors covered by source
– No - Yes
Sector Covered?
Agriculture (post harvest)
Food manufacturing
Drink manufacturing
Chill/Cold storage
Refrigerated distribution
Retail
Food Services
Food chain sectors in general
Information in Source
– no information - some information - detailed information
Area Information?
Emissions data - direct
Emissions data - indirect
Reduction Opportunities - direct
Reduction Opportunities - indirect
Strategic - direct
Strategic - indirect
Following table completed with any information contained in the source under the relevant
headings, include reference details e.g. page no., section no., table no. etc.
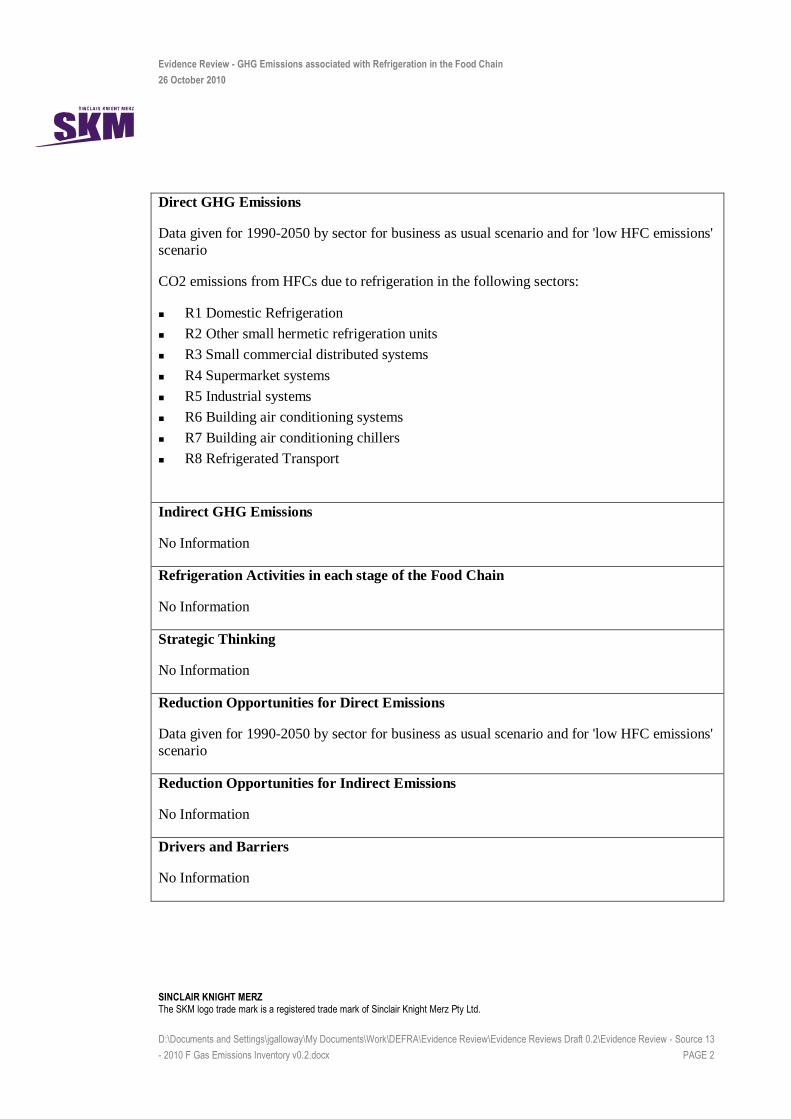
Evidence Review - GHG Emissions associated with Refrigeration in the Food Chain
26 October 2010
SINCLAIR KNIGHT MERZ The SKM logo trade mark is a registered trade mark of Sinclair Knight Merz Pty Ltd.
D:\Documents and Settings\jgalloway\My Documents\Work\DEFRA\Evidence Review\Evidence Reviews Draft 0.2\Evidence Review - Source 13
- 2010 F Gas Emissions Inventory v0.2.docx PAGE 2
Direct GHG Emissions
Data given for 1990-2050 by sector for business as usual scenario and for 'low HFC emissions'
scenario
CO2 emissions from HFCs due to refrigeration in the following sectors:
R1 Domestic Refrigeration
R2 Other small hermetic refrigeration units
R3 Small commercial distributed systems
R4 Supermarket systems
R5 Industrial systems
R6 Building air conditioning systems
R7 Building air conditioning chillers
R8 Refrigerated Transport
Indirect GHG Emissions
No Information
Refrigeration Activities in each stage of the Food Chain
No Information
Strategic Thinking
No Information
Reduction Opportunities for Direct Emissions
Data given for 1990-2050 by sector for business as usual scenario and for 'low HFC emissions'
scenario
Reduction Opportunities for Indirect Emissions
No Information
Drivers and Barriers
No Information
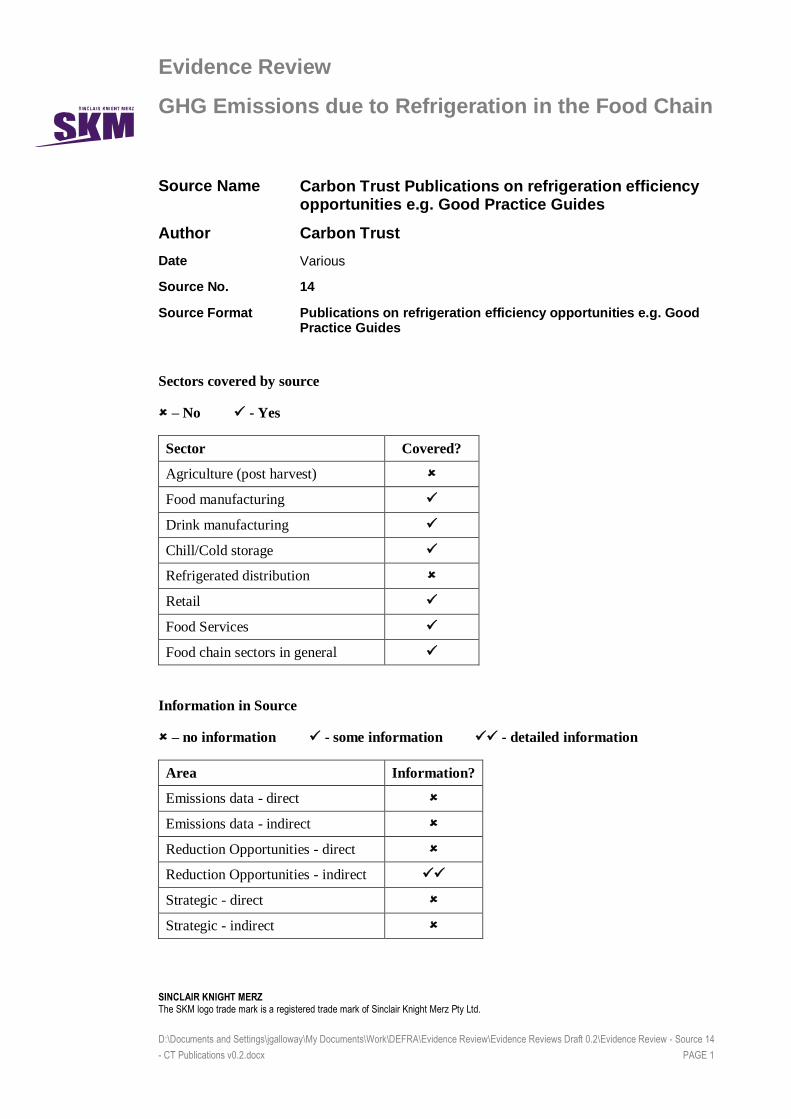
Evidence Review
GHG Emissions due to Refrigeration in the Food Chain
SINCLAIR KNIGHT MERZ
The SKM logo trade mark is a registered trade mark of Sinclair Knight Merz Pty Ltd.
D:\Documents and Settings\jgalloway\My Documents\Work\DEFRA\Evidence Review\Evidence Reviews Draft 0.2\Evidence Review - Source 14
- CT Publications v0.2.docx PAGE 1
Source Name Carbon Trust Publications on refrigeration efficiency opportunities e.g. Good Practice Guides
Author Carbon Trust
Date Various
Source No. 14
Source Format Publications on refrigeration efficiency opportunities e.g. Good Practice Guides
Sectors covered by source
– No - Yes
Sector Covered?
Agriculture (post harvest)
Food manufacturing
Drink manufacturing
Chill/Cold storage
Refrigerated distribution
Retail
Food Services
Food chain sectors in general
Information in Source
– no information - some information - detailed information
Area Information?
Emissions data - direct
Emissions data - indirect
Reduction Opportunities - direct
Reduction Opportunities - indirect
Strategic - direct
Strategic - indirect
Evidence Review - GHG Emissions associated with Refrigeration in the Food Chain
26 October 2010
SINCLAIR KNIGHT MERZ The SKM logo trade mark is a registered trade mark of Sinclair Knight Merz Pty Ltd.
D:\Documents and Settings\jgalloway\My Documents\Work\DEFRA\Evidence Review\Evidence Reviews Draft 0.2\Evidence Review - Source 14
- CT Publications v0.2.docx PAGE 2
Following table completed with any information contained in the source under the relevant headings, include reference details e.g. page no., section no., table no. etc.
Direct GHG Emissions
No Information
Indirect GHG Emissions
No Information
Refrigeration Activities in each stage of the Food Chain
No Information
Strategic Thinking
No Information
Reduction Opportunities for Direct Emissions
No Information
Reduction Opportunities for Indirect Emissions
Information on energy saving opportunities associated with refrigeration in general and
refrigeration in specific sectors of the food chain in various CT publications including Good
Practice Guides, Good Practice Case Studies, Energy Consumption Guides etc. In particular, useful information was found in the following: GPG279, GPG280, GPG283, GPG249,
GPCS092, GPCS301, GPCS302
Drivers and Barriers
No Information
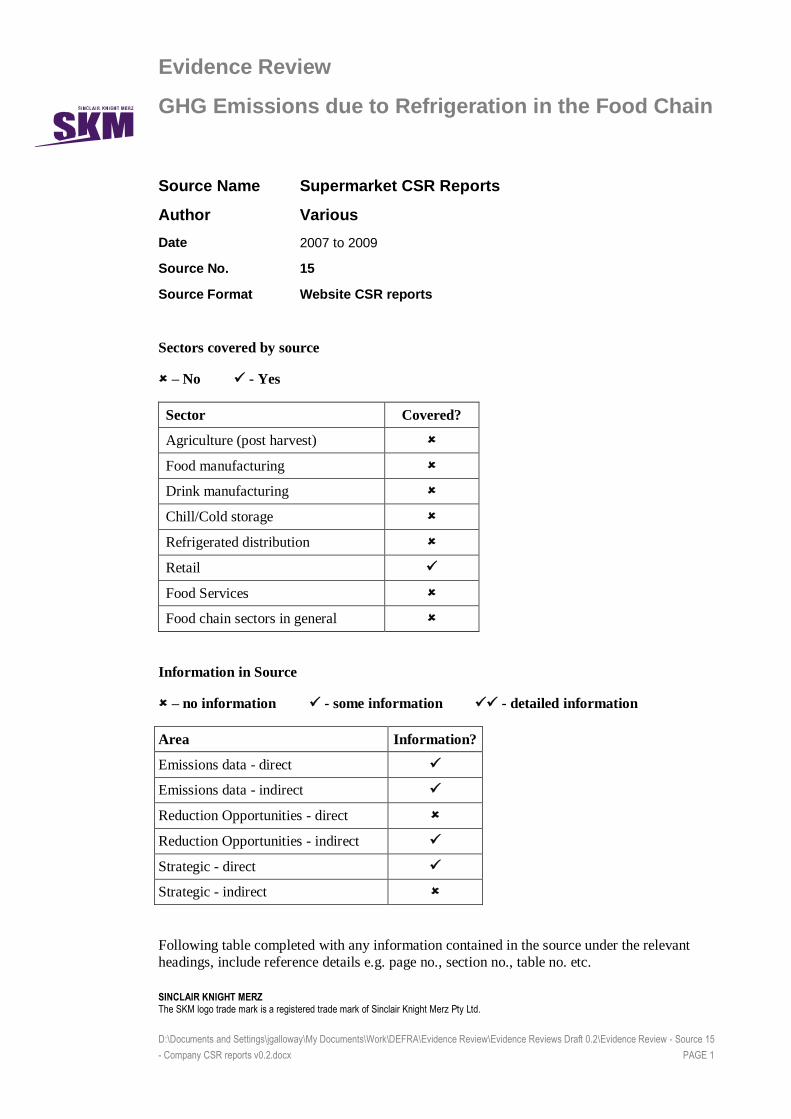
Evidence Review
GHG Emissions due to Refrigeration in the Food Chain
SINCLAIR KNIGHT MERZ
The SKM logo trade mark is a registered trade mark of Sinclair Knight Merz Pty Ltd.
D:\Documents and Settings\jgalloway\My Documents\Work\DEFRA\Evidence Review\Evidence Reviews Draft 0.2\Evidence Review - Source 15
- Company CSR reports v0.2.docx PAGE 1
Source Name Supermarket CSR Reports
Author Various
Date 2007 to 2009
Source No. 15
Source Format Website CSR reports
Sectors covered by source
– No - Yes
Sector Covered?
Agriculture (post harvest)
Food manufacturing
Drink manufacturing
Chill/Cold storage
Refrigerated distribution
Retail
Food Services
Food chain sectors in general
Information in Source
– no information - some information - detailed information
Area Information?
Emissions data - direct
Emissions data - indirect
Reduction Opportunities - direct
Reduction Opportunities - indirect
Strategic - direct
Strategic - indirect
Following table completed with any information contained in the source under the relevant
headings, include reference details e.g. page no., section no., table no. etc.
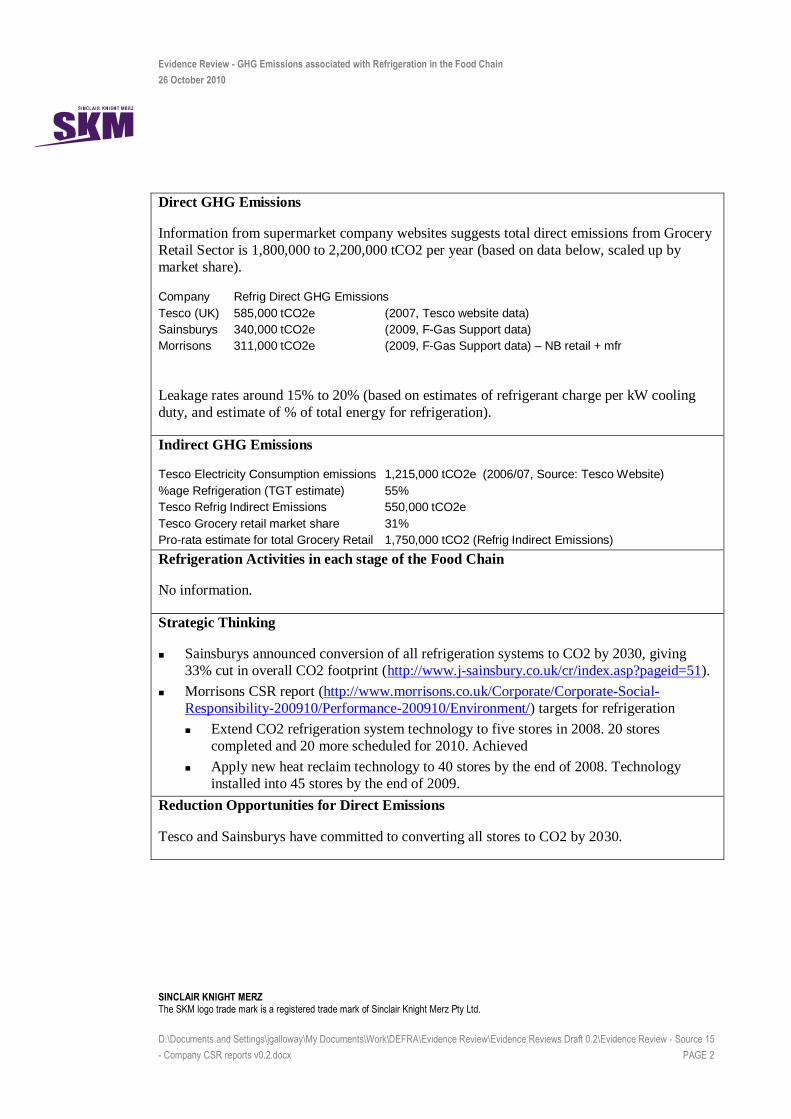
Evidence Review - GHG Emissions associated with Refrigeration in the Food Chain
26 October 2010
SINCLAIR KNIGHT MERZ The SKM logo trade mark is a registered trade mark of Sinclair Knight Merz Pty Ltd.
D:\Documents and Settings\jgalloway\My Documents\Work\DEFRA\Evidence Review\Evidence Reviews Draft 0.2\Evidence Review - Source 15
- Company CSR reports v0.2.docx PAGE 2
Direct GHG Emissions
Information from supermarket company websites suggests total direct emissions from Grocery
Retail Sector is 1,800,000 to 2,200,000 tCO2 per year (based on data below, scaled up by
market share).
Company Refrig Direct GHG Emissions
Tesco (UK) 585,000 tCO2e (2007, Tesco website data)
Sainsburys 340,000 tCO2e (2009, F-Gas Support data)
Morrisons 311,000 tCO2e (2009, F-Gas Support data) – NB retail + mfr
Leakage rates around 15% to 20% (based on estimates of refrigerant charge per kW cooling
duty, and estimate of % of total energy for refrigeration).
Indirect GHG Emissions
Tesco Electricity Consumption emissions 1,215,000 tCO2e (2006/07, Source: Tesco Website)
%age Refrigeration (TGT estimate) 55%
Tesco Refrig Indirect Emissions 550,000 tCO2e
Tesco Grocery retail market share 31%
Pro-rata estimate for total Grocery Retail 1,750,000 tCO2 (Refrig Indirect Emissions)
Refrigeration Activities in each stage of the Food Chain
No information.
Strategic Thinking
Sainsburys announced conversion of all refrigeration systems to CO2 by 2030, giving
33% cut in overall CO2 footprint (http://www.j-sainsbury.co.uk/cr/index.asp?pageid=51).
Morrisons CSR report (http://www.morrisons.co.uk/Corporate/Corporate-Social-
Responsibility-200910/Performance-200910/Environment/) targets for refrigeration
Extend CO2 refrigeration system technology to five stores in 2008. 20 stores
completed and 20 more scheduled for 2010. Achieved
Apply new heat reclaim technology to 40 stores by the end of 2008. Technology
installed into 45 stores by the end of 2009.
Reduction Opportunities for Direct Emissions
Tesco and Sainsburys have committed to converting all stores to CO2 by 2030.
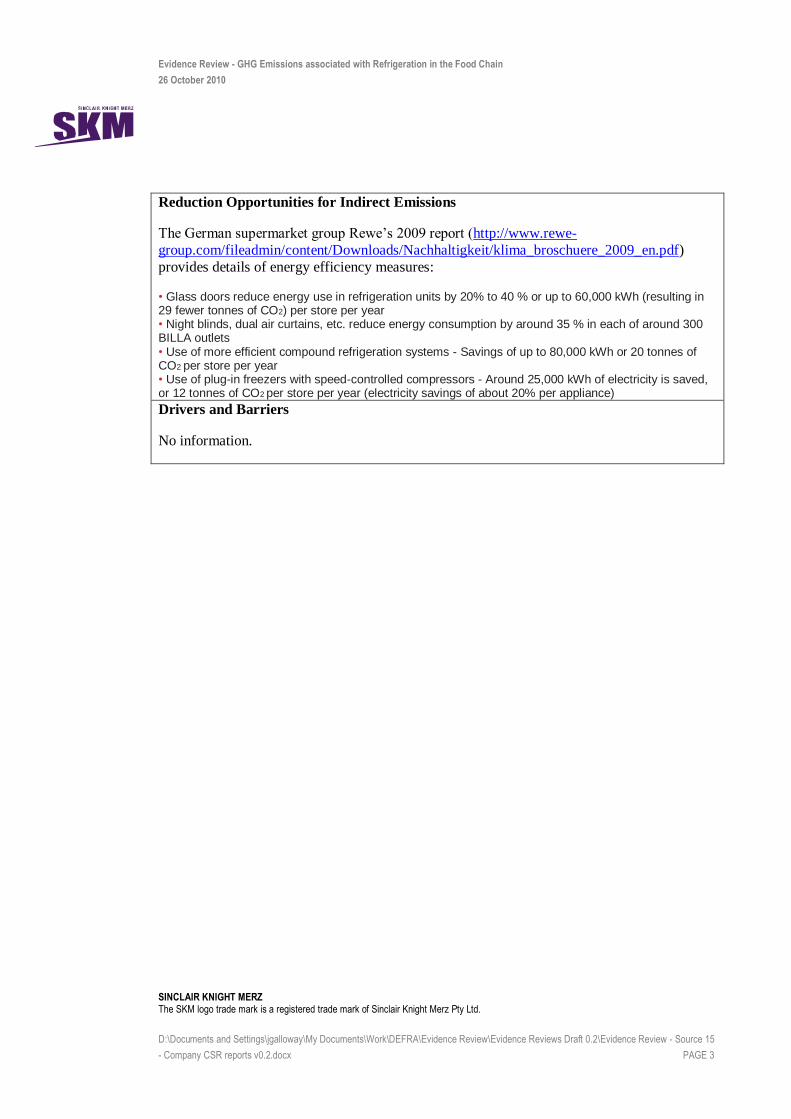
Evidence Review - GHG Emissions associated with Refrigeration in the Food Chain
26 October 2010
SINCLAIR KNIGHT MERZ The SKM logo trade mark is a registered trade mark of Sinclair Knight Merz Pty Ltd.
D:\Documents and Settings\jgalloway\My Documents\Work\DEFRA\Evidence Review\Evidence Reviews Draft 0.2\Evidence Review - Source 15
- Company CSR reports v0.2.docx PAGE 3
Reduction Opportunities for Indirect Emissions
The German supermarket group Rewe’s 2009 report (http://www.rewe-
group.com/fileadmin/content/Downloads/Nachhaltigkeit/klima_broschuere_2009_en.pdf)
provides details of energy efficiency measures:
• Glass doors reduce energy use in refrigeration units by 20% to 40 % or up to 60,000 kWh (resulting in 29 fewer tonnes of CO2) per store per year • Night blinds, dual air curtains, etc. reduce energy consumption by around 35 % in each of around 300 BILLA outlets • Use of more efficient compound refrigeration systems - Savings of up to 80,000 kWh or 20 tonnes of CO2 per store per year • Use of plug-in freezers with speed-controlled compressors - Around 25,000 kWh of electricity is saved, or 12 tonnes of CO2 per store per year (electricity savings of about 20% per appliance)
Drivers and Barriers
No information.
Evidence Review
GHG Emissions due to Refrigeration in the Food Chain
SINCLAIR KNIGHT MERZ
The SKM logo trade mark is a registered trade mark of Sinclair Knight Merz Pty Ltd.
D:\Documents and Settings\jgalloway\My Documents\Work\DEFRA\Evidence Review\Evidence Reviews Draft 0.2\Evidence Review - Source 16
- Voluntary Initiatives v0.2.docx PAGE 1
Source Name Review of voluntary initiatives by industry
Author FDF and BRC respectively
Date 2010
Source No. 16
Source Format Websites, reports, publicity campaigns e.g.
“FDF Five Fold Plan” – Progress Report 2010 and website
“Better Retail Climate” – Progress Report 2010 and website
Sectors covered by source
– No - Yes
Sector Covered?
Agriculture (post harvest)
Food manufacturing
Drink manufacturing
Chill/Cold storage
Refrigerated distribution
Retail
Food Services
Food chain sectors in general
Information in Source
– no information - some information - detailed information
Area Information?
Emissions data - direct
Emissions data - indirect
Reduction Opportunities - direct
Reduction Opportunities - indirect
Strategic - direct
Strategic - indirect
Following table completed with any information contained in the source under the relevant
headings, include reference details e.g. page no., section no., table no. etc.

Evidence Review - GHG Emissions associated with Refrigeration in the Food Chain
26 October 2010
SINCLAIR KNIGHT MERZ The SKM logo trade mark is a registered trade mark of Sinclair Knight Merz Pty Ltd.
D:\Documents and Settings\jgalloway\My Documents\Work\DEFRA\Evidence Review\Evidence Reviews Draft 0.2\Evidence Review - Source 16
- Voluntary Initiatives v0.2.docx PAGE 2
Direct GHG Emissions
No information
Indirect GHG Emissions
1) FDF Five Fold Plan - Greenhouse Gas Emissions from the Food Chain (total, not
refrigeration specific)
Food and Drink Manufacturing: The largest emissions of GHGs related to food production and consumption do not come from food manufacturing plants, which only
represent about 10% of emissions from the food chain.
Agriculture: About 50% of GHG emissions come from agriculture. Most of this is not
energy related. Key emissions include methane from livestock and N2O which is
emitted from fertilisers in the soil. The animal feed and fertiliser also factories that supply the agricultural sector are also big energy users.
Retail: The retail and catering sectors are also significant representing about 15% of emissions. Most of these emissions relate to energy use, including a significant
refrigeration requirement. Refrigeration systems using HFC refrigerants often have a
large GHG emission because of refrigerant leakage
Domestic: Storage and cooking of food in domestic dwellings is also significant,
representing about 15% of emissions.
Transport: The energy use in transport between different stages of the food chain
represents a further 10% of emissions. There is increasing concern about 'food miles' especially if these involve food transported by air.
However, long distance transport is not necessarily bad in terms of CO2 emissions –
for example the extra transport energy importing vegetables from Africa might be less
than the glass house heating required to grow the same crop in the UK.
Waste: Any waste food put into land fill will create emissions of methane. This can
represent a significant proportion of food chain emissions. It has been estimated that
between 20% and 30% of food sold in the UK is wasted.
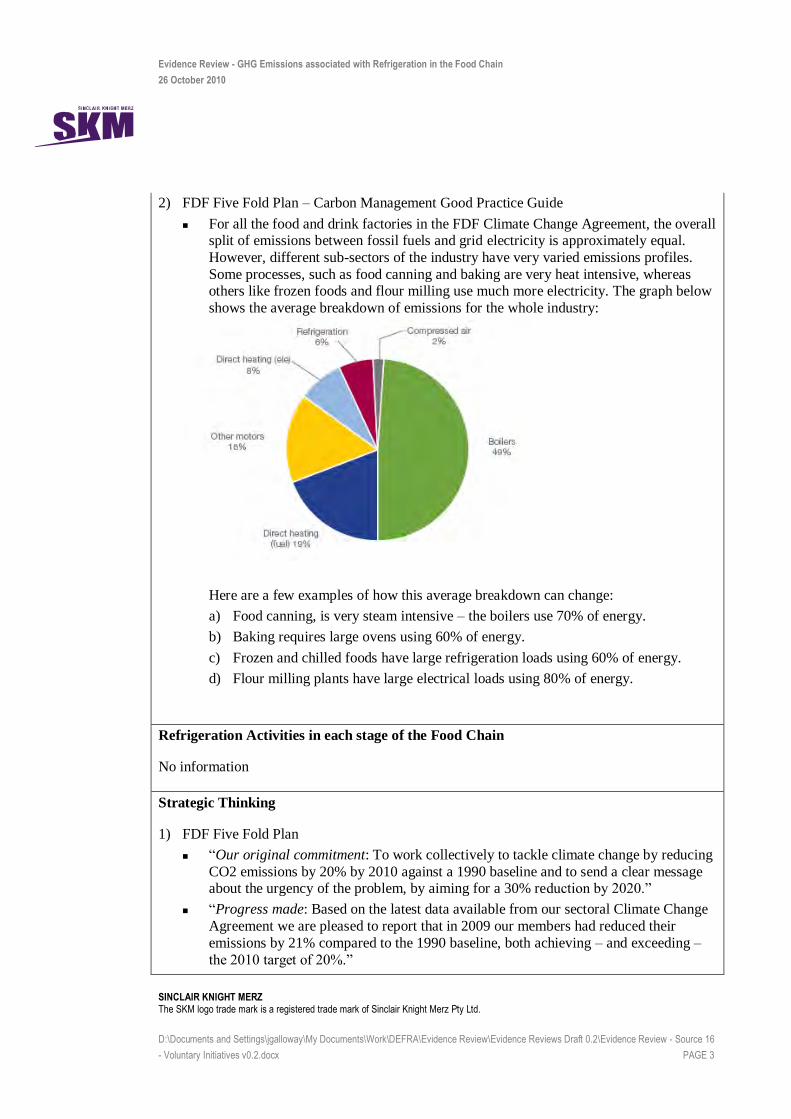
Evidence Review - GHG Emissions associated with Refrigeration in the Food Chain
26 October 2010
SINCLAIR KNIGHT MERZ The SKM logo trade mark is a registered trade mark of Sinclair Knight Merz Pty Ltd.
D:\Documents and Settings\jgalloway\My Documents\Work\DEFRA\Evidence Review\Evidence Reviews Draft 0.2\Evidence Review - Source 16
- Voluntary Initiatives v0.2.docx PAGE 3
2) FDF Five Fold Plan – Carbon Management Good Practice Guide
For all the food and drink factories in the FDF Climate Change Agreement, the overall split of emissions between fossil fuels and grid electricity is approximately equal.
However, different sub-sectors of the industry have very varied emissions profiles.
Some processes, such as food canning and baking are very heat intensive, whereas others like frozen foods and flour milling use much more electricity. The graph below
shows the average breakdown of emissions for the whole industry:
Here are a few examples of how this average breakdown can change:
a) Food canning, is very steam intensive – the boilers use 70% of energy.
b) Baking requires large ovens using 60% of energy.
c) Frozen and chilled foods have large refrigeration loads using 60% of energy.
d) Flour milling plants have large electrical loads using 80% of energy.
Refrigeration Activities in each stage of the Food Chain
No information
Strategic Thinking
1) FDF Five Fold Plan
“Our original commitment: To work collectively to tackle climate change by reducing
CO2 emissions by 20% by 2010 against a 1990 baseline and to send a clear message about the urgency of the problem, by aiming for a 30% reduction by 2020.”
“Progress made: Based on the latest data available from our sectoral Climate Change
Agreement we are pleased to report that in 2009 our members had reduced their
emissions by 21% compared to the 1990 baseline, both achieving – and exceeding –
the 2010 target of 20%.”
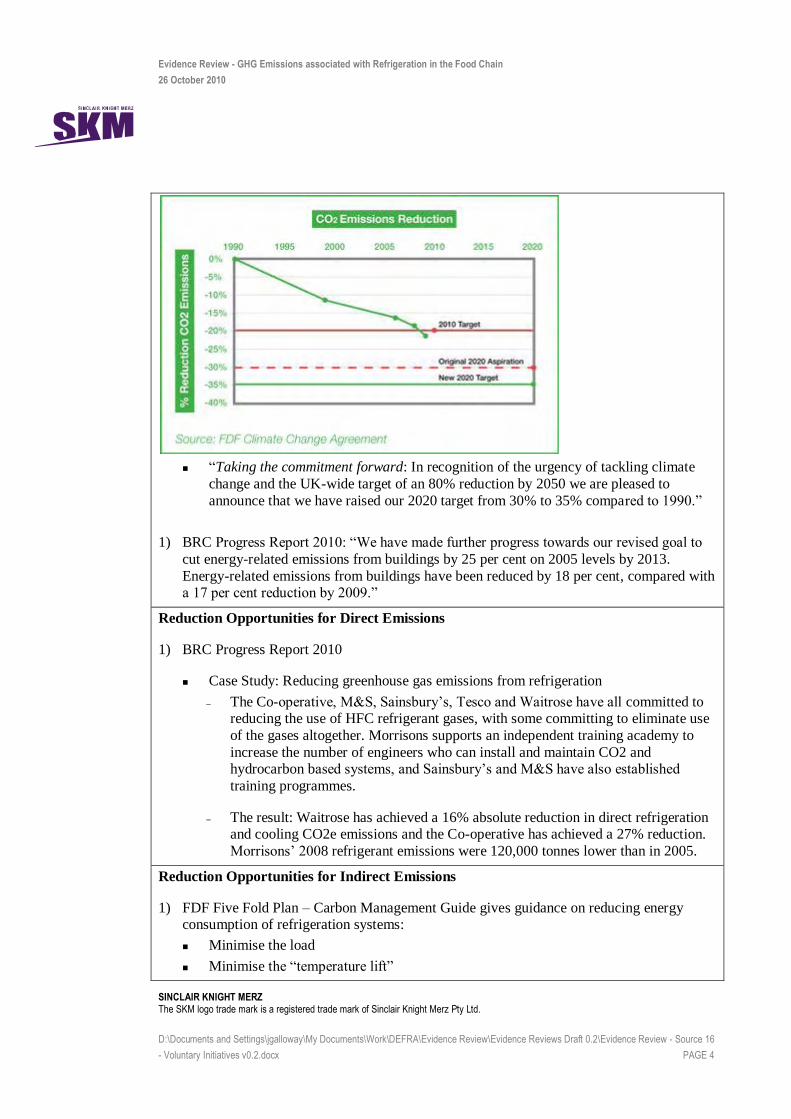
Evidence Review - GHG Emissions associated with Refrigeration in the Food Chain
26 October 2010
SINCLAIR KNIGHT MERZ The SKM logo trade mark is a registered trade mark of Sinclair Knight Merz Pty Ltd.
D:\Documents and Settings\jgalloway\My Documents\Work\DEFRA\Evidence Review\Evidence Reviews Draft 0.2\Evidence Review - Source 16
- Voluntary Initiatives v0.2.docx PAGE 4
“Taking the commitment forward: In recognition of the urgency of tackling climate
change and the UK-wide target of an 80% reduction by 2050 we are pleased to
announce that we have raised our 2020 target from 30% to 35% compared to 1990.”
1) BRC Progress Report 2010: “We have made further progress towards our revised goal to
cut energy-related emissions from buildings by 25 per cent on 2005 levels by 2013.
Energy-related emissions from buildings have been reduced by 18 per cent, compared with a 17 per cent reduction by 2009.”
Reduction Opportunities for Direct Emissions
1) BRC Progress Report 2010
Case Study: Reducing greenhouse gas emissions from refrigeration
– The Co-operative, M&S, Sainsbury’s, Tesco and Waitrose have all committed to reducing the use of HFC refrigerant gases, with some committing to eliminate use
of the gases altogether. Morrisons supports an independent training academy to
increase the number of engineers who can install and maintain CO2 and hydrocarbon based systems, and Sainsbury’s and M&S have also established
training programmes.
– The result: Waitrose has achieved a 16% absolute reduction in direct refrigeration and cooling CO2e emissions and the Co-operative has achieved a 27% reduction.
Morrisons’ 2008 refrigerant emissions were 120,000 tonnes lower than in 2005.
Reduction Opportunities for Indirect Emissions
1) FDF Five Fold Plan – Carbon Management Guide gives guidance on reducing energy consumption of refrigeration systems:
Minimise the load
Minimise the “temperature lift”
Evidence Review - GHG Emissions associated with Refrigeration in the Food Chain
26 October 2010
SINCLAIR KNIGHT MERZ The SKM logo trade mark is a registered trade mark of Sinclair Knight Merz Pty Ltd.
D:\Documents and Settings\jgalloway\My Documents\Work\DEFRA\Evidence Review\Evidence Reviews Draft 0.2\Evidence Review - Source 16
- Voluntary Initiatives v0.2.docx PAGE 5
Avoid putting loads of different temperatures on the same plant
Minimise head pressure control settings
Minimise use of pumps and fans
Drivers and Barriers
1) FDF Five Fold Plan - Drivers:
There are a number of compelling drivers to carry out Carbon Management:
– Cost savings: the high price of energy makes reduction of energy use a win-win measure for the environment and your bottom line.
– Regulations: there is increasing regulatory pressure to ensure reductions in CO2
emissions e.g. Climate Change
– Agreements, EU Emissions Trading Scheme, Carbon Reduction Commitment, F
Gas Regulation etc.
– Stakeholder pressure: your customers and your shareholders are showing
increasing interest in the efforts you are making to reduce emissions.
2) BRC Progress Report 2010
Vital improvements in commercial refrigeration GHG emissions cannot be achieved
by retailers acting alone. Substantial barriers to progress include (a) shortages of technicians and engineers skilled in producing or maintaining alternative technologies,
(b) little UK manufacture of novel refrigeration technologies, (c) lack of financial
drivers to switch to expensive new technologies.
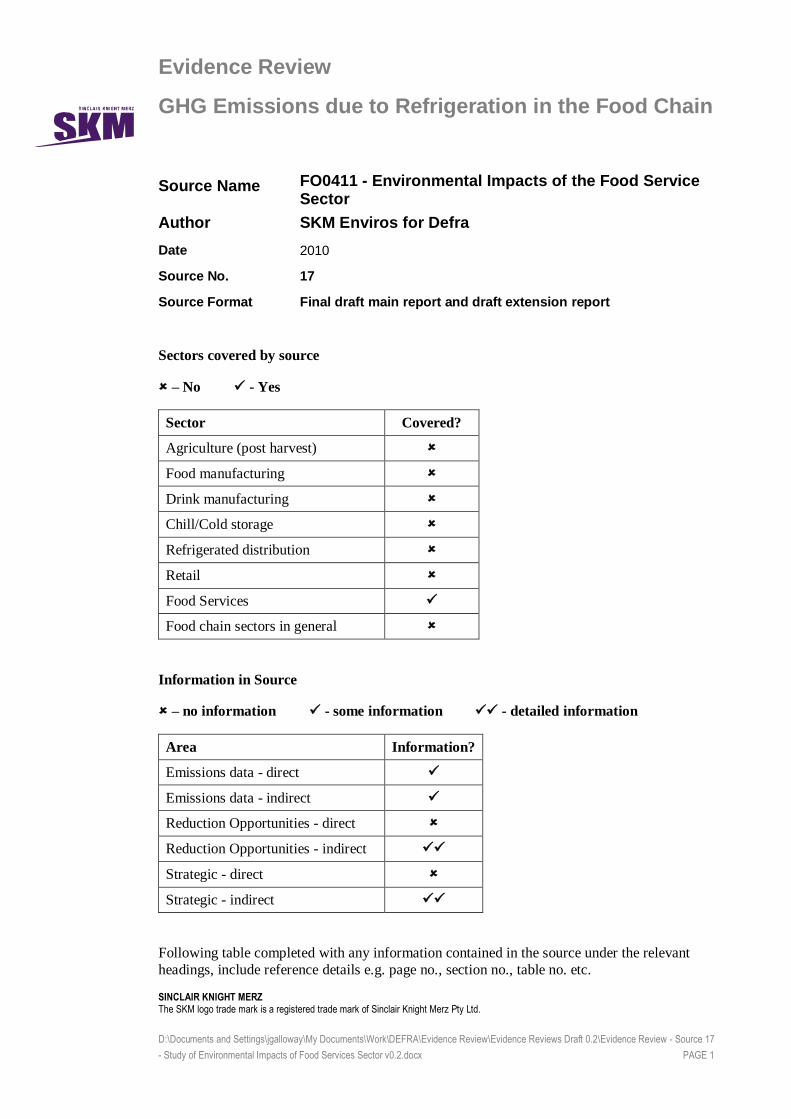
Evidence Review
GHG Emissions due to Refrigeration in the Food Chain
SINCLAIR KNIGHT MERZ
The SKM logo trade mark is a registered trade mark of Sinclair Knight Merz Pty Ltd.
D:\Documents and Settings\jgalloway\My Documents\Work\DEFRA\Evidence Review\Evidence Reviews Draft 0.2\Evidence Review - Source 17
- Study of Environmental Impacts of Food Services Sector v0.2.docx PAGE 1
Source Name FO0411 - Environmental Impacts of the Food Service Sector
Author SKM Enviros for Defra
Date 2010
Source No. 17
Source Format Final draft main report and draft extension report
Sectors covered by source
– No - Yes
Sector Covered?
Agriculture (post harvest)
Food manufacturing
Drink manufacturing
Chill/Cold storage
Refrigerated distribution
Retail
Food Services
Food chain sectors in general
Information in Source
– no information - some information - detailed information
Area Information?
Emissions data - direct
Emissions data - indirect
Reduction Opportunities - direct
Reduction Opportunities - indirect
Strategic - direct
Strategic - indirect
Following table completed with any information contained in the source under the relevant
headings, include reference details e.g. page no., section no., table no. etc.

Evidence Review - GHG Emissions associated with Refrigeration in the Food Chain
26 October 2010
SINCLAIR KNIGHT MERZ The SKM logo trade mark is a registered trade mark of Sinclair Knight Merz Pty Ltd.
D:\Documents and Settings\jgalloway\My Documents\Work\DEFRA\Evidence Review\Evidence Reviews Draft 0.2\Evidence Review - Source 17
- Study of Environmental Impacts of Food Services Sector v0.2.docx PAGE 2
Direct GHG Emissions
Split of direct and indirect emissions in the food chain given in Table 2 of Extension Report.
Figures given for Agriculture, Transport, Manufacturing, Retail and Food Service sectors.
Indirect emissions for Food Service sector quoted at 5 MtCO2/yr.
Indirect GHG Emissions
Average indirect emissions due to ALL energy given per business (page 2) and MWh energy usage (page 28)
Breakdown of CO2 by subsector and area of energy usage also given.
Further information on number of meals served in various sub-sectors (page 17) and CO2/meal
Evidence Review - GHG Emissions associated with Refrigeration in the Food Chain
26 October 2010
SINCLAIR KNIGHT MERZ The SKM logo trade mark is a registered trade mark of Sinclair Knight Merz Pty Ltd.
D:\Documents and Settings\jgalloway\My Documents\Work\DEFRA\Evidence Review\Evidence Reviews Draft 0.2\Evidence Review - Source 17
- Study of Environmental Impacts of Food Services Sector v0.2.docx PAGE 3
(page 28) would allow CO2 for refrigeration in whole sector to be estimated.
No information on no. of business in various sub-sectors – only figure given is that 250,000
establishments in total.
Refrigeration Activities in each stage of the Food Chain
Six sub-sectors were examined, these were:
Business and Industry – typically staff canteens in business and industrial locations;
Schools - primary and secondary schools as well as colleges;
Healthcare - focussing on hospitals and a wide range of meal delivery models;
Pubs – public houses with a range of meal delivery models;
Quick Service Restaurants (QSR) – various types of fast food provision; and
Restaurants – ethnic, chain restaurants and fine dining.
Strategic Thinking
Following information on Strategic Thinking in Extension Report.
The largest 10 supermarket companies are all very powerful, and have the potential for a
strong influence on UK agriculture and manufacture. They also have a strong influence on the
proportion of manufactured food sourced from overseas.
The big food manufacturers are also powerful, especially the largest 100. However, they are
strongly influenced by supermarket requirements.
The food service share of the nation’s food consumption is estimated at roughly 1 in 6 of all meals consumed (around 15%).
The concept of “meal carbon footprints” could be developed to encourage changes of practice
in all parts of the food chain. Menus could be developed to deliver a lower carbon footprint by sourcing materials that avoid high GHG “hotspots”. The use of footprint data for “upstream
influence” could be done on a confidential basis between food service companies and their
supply chain. Food service companies could “choice edit” their menus to deliver a lower
average footprint. (page 13)
Reduction Opportunities for Direct Emissions
No Information
Reduction Opportunities for Indirect Emissions
Key hot spots and opportunities for reducing environmental impact are identified and
summarised for No/Low Cost and Capital Investment Opportunities for the 6 sub-sectors. Tables show the no. of sites for which the opportunity existed (pages 4-5), details on p48-49.
In-house energy efficiency initiatives can be built from some of the information gathered in the
main part of this project. Development of guidance customised for specific sub-sectors of the
Evidence Review - GHG Emissions associated with Refrigeration in the Food Chain
26 October 2010
SINCLAIR KNIGHT MERZ The SKM logo trade mark is a registered trade mark of Sinclair Knight Merz Pty Ltd.
D:\Documents and Settings\jgalloway\My Documents\Work\DEFRA\Evidence Review\Evidence Reviews Draft 0.2\Evidence Review - Source 17
- Study of Environmental Impacts of Food Services Sector v0.2.docx PAGE 4
food service market (e.g. pubs, fish and chip shops, hospitals etc.) would be very valuable and could be used to encourage small companies to take part. (page 13, Extension Report)
Drivers and Barriers
The sector is constrained by lack of funds for investment, often a result of issues such as:
separate owners and operator, a demand for short payback periods, and a high rate of business
failure in the profit sector. New build and refurbishment represent the best opportunities for
specifying the correct equipment with low environmental impact. (page 5)
Extension Report has following information on Drivers and Barriers.
Not surprisingly, cost and quality were the most frequently mentioned drivers that affect menu choice and food procurement. Environmental issues in general and carbon footprints in
particular are less important secondary drivers, albeit that several organisations interviewed
stressed that they recognised that such drivers should also be taken into account. (page 11)
Good description of M&S Plan A programme - Programmes such as Marks and Spencer’s
“Plan A” are highly visible and they seem to represent genuine attempts to reduce GHG
emissions and achieve other environmental benefits. Plan A includes 180 different
commitments built on 5 main “pillars”: climate change, waste, natural resources, fair partnership and health and wellbeing. This is an ambitious programme with Board level
support and management. The programme was started with ambitious in-house targets such as
those for energy efficiency and refrigerant leak reduction. Much of the programme relates to work “up the supply chain” with farms, food manufacturers and transport companies to ensure
that the M&S supply chain meets their environmental objectives. Another aspect of the
programme is to work “down the supply chain” with customers to encourage them to change
their buying habits to meet key objectives in Plan A. Other supermarkets such as Sainsbury’s and Tesco also have major environmental programmes with challenging objectives related to
climate change. (page 11)
Supermarket companies have indicated that their CO2 reduction initiatives are “win-win” i.e. that they are making profit improvements as well as helping the environment and improving
their corporate image. This is an important message to try and promote with food service
companies. (page 12)
There is no trade body that represents a significant proportion of the food service sector. This
barrier must be overcome if food service companies are to become involved in a coordinated
programme to reduce CO2 emissions or make other environmental improvements. (page 12)
The product carbon footprinting technique may be readily applicable to produce “meal carbon footprints” that could be used to assist menu development and, perhaps, to put CO2e labels on
menus.
The main difficulty of proceeding with ideas such as those described above is the fragmented nature of the food service sector. Defra has a crucial role to try and encourage action. (page 13)
The CRC provides a stimulus for action and a route to reach key organisations. If the support
Evidence Review - GHG Emissions associated with Refrigeration in the Food Chain
26 October 2010
SINCLAIR KNIGHT MERZ The SKM logo trade mark is a registered trade mark of Sinclair Knight Merz Pty Ltd.
D:\Documents and Settings\jgalloway\My Documents\Work\DEFRA\Evidence Review\Evidence Reviews Draft 0.2\Evidence Review - Source 17
- Study of Environmental Impacts of Food Services Sector v0.2.docx PAGE 5
provided in this way is successful, the initiative could be extended to smaller food service companies that are below the CRC size threshold, (page 17)

Evidence Review
GHG Emissions due to Refrigeration in the Food Chain
SINCLAIR KNIGHT MERZ
The SKM logo trade mark is a registered trade mark of Sinclair Knight Merz Pty Ltd.
D:\Documents and Settings\jgalloway\My Documents\Work\DEFRA\Evidence Review\Evidence Reviews Draft 0.2\Evidence Review - Source 18
- Report on British Frozen Food Industry v0.2.docx PAGE 1
Source Name The British Frozen Food Industry – A Food Vision
Authors Brian Young, BFFF (British Frozen Food Federation), Judith Evans, RD&T (Refrigeration Developments and Testing Ltd), Dr Wayne Martindale & Charlotte Harden, Centre for Food Innovation, Sheffield Hallam University.
Date 2010
Source No. 18
Source Format Final report
Sectors covered by source
– No - Yes
Sector Covered?
Agriculture (post harvest)
Food manufacturing
Drink manufacturing
Chill/Cold storage
Refrigerated distribution
Retail
Food Services
Food chain sectors in general
Information in Source
– no information - some information - detailed information
Area Information?
Emissions data - direct
Emissions data - indirect
Reduction Opportunities - direct
Reduction Opportunities - indirect
Strategic - direct
Strategic - indirect
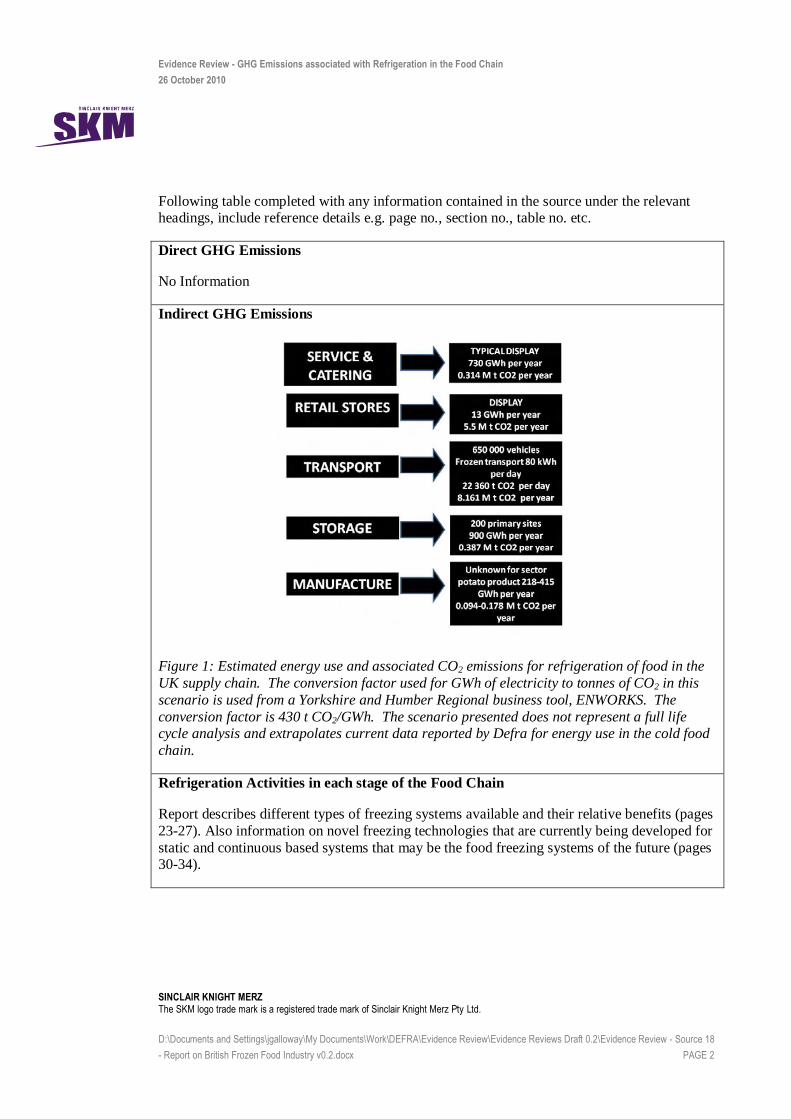
Evidence Review - GHG Emissions associated with Refrigeration in the Food Chain
26 October 2010
SINCLAIR KNIGHT MERZ The SKM logo trade mark is a registered trade mark of Sinclair Knight Merz Pty Ltd.
D:\Documents and Settings\jgalloway\My Documents\Work\DEFRA\Evidence Review\Evidence Reviews Draft 0.2\Evidence Review - Source 18
- Report on British Frozen Food Industry v0.2.docx PAGE 2
Following table completed with any information contained in the source under the relevant headings, include reference details e.g. page no., section no., table no. etc.
Direct GHG Emissions
No Information
Indirect GHG Emissions
Figure 1: Estimated energy use and associated CO2 emissions for refrigeration of food in the
UK supply chain. The conversion factor used for GWh of electricity to tonnes of CO2 in this
scenario is used from a Yorkshire and Humber Regional business tool, ENWORKS. The
conversion factor is 430 t CO2/GWh. The scenario presented does not represent a full life cycle analysis and extrapolates current data reported by Defra for energy use in the cold food
chain.
Refrigeration Activities in each stage of the Food Chain
Report describes different types of freezing systems available and their relative benefits (pages
23-27). Also information on novel freezing technologies that are currently being developed for
static and continuous based systems that may be the food freezing systems of the future (pages 30-34).
Evidence Review - GHG Emissions associated with Refrigeration in the Food Chain
26 October 2010
SINCLAIR KNIGHT MERZ The SKM logo trade mark is a registered trade mark of Sinclair Knight Merz Pty Ltd.
D:\Documents and Settings\jgalloway\My Documents\Work\DEFRA\Evidence Review\Evidence Reviews Draft 0.2\Evidence Review - Source 18
- Report on British Frozen Food Industry v0.2.docx PAGE 3
Strategic Thinking
Reports increase in retail frozen food market in last 5 years or so.
“The British frozen food industry has aligned many of its resource efficiency actions with the sustainability indicators reported by Defra through the Food 2030 vision and we can achieve
even greater resource efficiency through knowledge transfer.” (page 38)
“Current analysis of supply chains using Life Cycle Analysis (LCA) shows that the embodied energy and GHG emissions as global warming potentials (GWP) for frozen food can equal or
be lower than chilled or unprocessed foods. The frozen food industry has improved the
efficiency of energy use and identified large variability of energy use in manufacture, storage and transport operations suggesting further sector improvements are achievable. This has been
achieved by identifying changes in design of freezing infrastructure and operational practices
that improve energy efficiency. In this analysis of sustainability it is identified that the frozen
food sector can go further in achieving sustainability targets in line with government indicators if innovation within the sector is continued to be stimulated and supported using initiatives that
support resource efficiency measures for small and large companies in the UK food supply
chain. A significant benefit of using frozen food identified here is the potential reductions in domestic food waste.” (page 38)
76% of cold storage in the UK is controlled by third party logistics companies, 14% by
retailers and 10% by manufacturers.
References include Audsley, E., Brander, M., Chatterton, J., Murphy-Bokern, D., Webster, C.,
and Williams, A. 2009. How low can we go? An assessment of greenhouse gas emissions from
the UK food system and the scope to reduce them by 2050. FCRN-WWF-UK (page 42)
Large amount of data on the frozen food market, both retail and food service, mainly expressed
in terms of monetary value. Total retail frozen food market valued at £5.1 billion and total
food service sector frozen food market (covering Restaurants, Pubs, Hotels, Leisure, Contract Catering and Institutions) valued at £2.3 billion (£4.4 billion on chilled/fresh).
Data on number of units sold and market value for different types of frozen food in retail sector (pages 5-6). Data on market value of frozen and chilled food and different types of
outlets in food service sector (pages 11-12).
Reduction Opportunities for Direct Emissions
Report contains following info on refrigerants (page 28)
“A number of initiatives are tackling moving to more environmentally sound refrigerants. CO2
with a GWP of 1 is becoming a more commonly used refrigerant and has been used in freezing facilities, cold stores and supermarkets. Alternative technologies using hydrocarbons are also
being trialled in supermarkets in applications where the flammability risks can be minimised.
Some new low GWP refrigerants such as HFO (Hydro-Fluoro-Olefins) are coming onto the market but as yet are not fully tested in a wide range of applications. Ammonia is already a
sound option for larger refrigerant plant and there are considerable opportunities to reduce the
Evidence Review - GHG Emissions associated with Refrigeration in the Food Chain
26 October 2010
SINCLAIR KNIGHT MERZ The SKM logo trade mark is a registered trade mark of Sinclair Knight Merz Pty Ltd.
D:\Documents and Settings\jgalloway\My Documents\Work\DEFRA\Evidence Review\Evidence Reviews Draft 0.2\Evidence Review - Source 18
- Report on British Frozen Food Industry v0.2.docx PAGE 4
refrigerant charge through using compact heat exchangers and to reclaim heat for space or hot water heating. Heat reclaim or reuse is also an opportunity to utilise absorption or adsorption
technologies, although to date these have had limited use in food freezing. Due to greater
interest in reducing direct and indirect emissions from refrigeration plant many of these technologies are now being evaluated and are becoming more feasible propositions.”
Reduction Opportunities for Indirect Emissions
Variances in freezing energy efficiency in the manufacturing, transport and retail sectors reported by James et al. 2009 show improvements in energy consumption of at least 20% are
possible across the frozen food supply chain. (page 41)
References include Defra sponsored Sector Focus reports for blast freezing, storage, transport, retail and catering. These reports summarise relevant research and good practice for the frozen
food sector. Project coordinated by the Food Refrigeration and Process Engineering Research
Centre (page 42/page 21 in pdf)
Drivers and Barriers
No Information
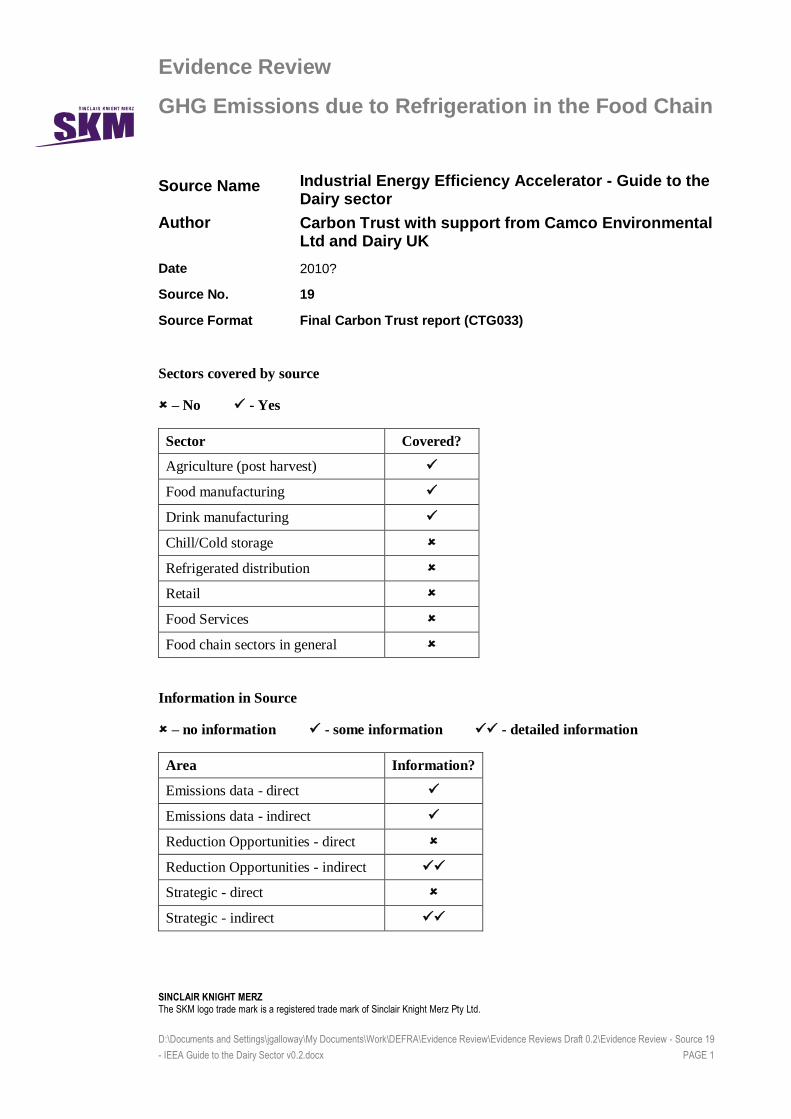
Evidence Review
GHG Emissions due to Refrigeration in the Food Chain
SINCLAIR KNIGHT MERZ
The SKM logo trade mark is a registered trade mark of Sinclair Knight Merz Pty Ltd.
D:\Documents and Settings\jgalloway\My Documents\Work\DEFRA\Evidence Review\Evidence Reviews Draft 0.2\Evidence Review - Source 19
- IEEA Guide to the Dairy Sector v0.2.docx PAGE 1
Source Name Industrial Energy Efficiency Accelerator - Guide to the Dairy sector
Author Carbon Trust with support from Camco Environmental Ltd and Dairy UK
Date 2010?
Source No. 19
Source Format Final Carbon Trust report (CTG033)
Sectors covered by source
– No - Yes
Sector Covered?
Agriculture (post harvest)
Food manufacturing
Drink manufacturing
Chill/Cold storage
Refrigerated distribution
Retail
Food Services
Food chain sectors in general
Information in Source
– no information - some information - detailed information
Area Information?
Emissions data - direct
Emissions data - indirect
Reduction Opportunities - direct
Reduction Opportunities - indirect
Strategic - direct
Strategic - indirect
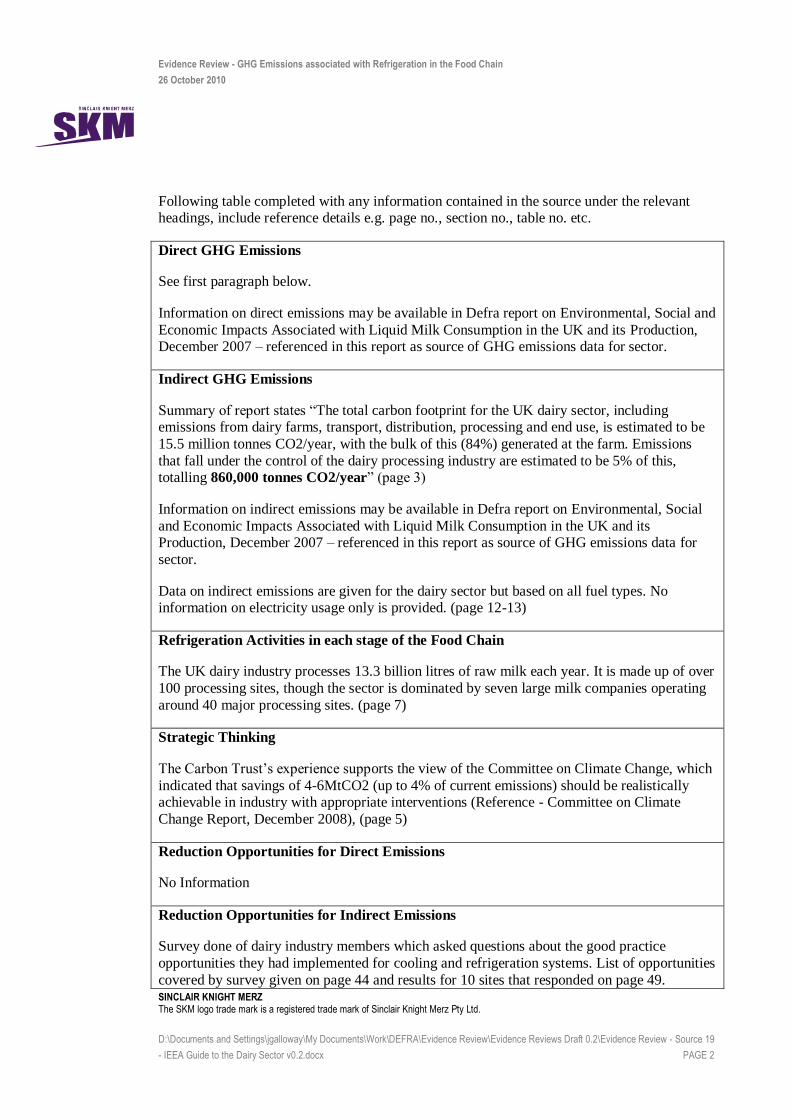
Evidence Review - GHG Emissions associated with Refrigeration in the Food Chain
26 October 2010
SINCLAIR KNIGHT MERZ The SKM logo trade mark is a registered trade mark of Sinclair Knight Merz Pty Ltd.
D:\Documents and Settings\jgalloway\My Documents\Work\DEFRA\Evidence Review\Evidence Reviews Draft 0.2\Evidence Review - Source 19
- IEEA Guide to the Dairy Sector v0.2.docx PAGE 2
Following table completed with any information contained in the source under the relevant headings, include reference details e.g. page no., section no., table no. etc.
Direct GHG Emissions
See first paragraph below.
Information on direct emissions may be available in Defra report on Environmental, Social and
Economic Impacts Associated with Liquid Milk Consumption in the UK and its Production, December 2007 – referenced in this report as source of GHG emissions data for sector.
Indirect GHG Emissions
Summary of report states “The total carbon footprint for the UK dairy sector, including emissions from dairy farms, transport, distribution, processing and end use, is estimated to be
15.5 million tonnes CO2/year, with the bulk of this (84%) generated at the farm. Emissions
that fall under the control of the dairy processing industry are estimated to be 5% of this, totalling 860,000 tonnes CO2/year” (page 3)
Information on indirect emissions may be available in Defra report on Environmental, Social
and Economic Impacts Associated with Liquid Milk Consumption in the UK and its Production, December 2007 – referenced in this report as source of GHG emissions data for
sector.
Data on indirect emissions are given for the dairy sector but based on all fuel types. No information on electricity usage only is provided. (page 12-13)
Refrigeration Activities in each stage of the Food Chain
The UK dairy industry processes 13.3 billion litres of raw milk each year. It is made up of over
100 processing sites, though the sector is dominated by seven large milk companies operating
around 40 major processing sites. (page 7)
Strategic Thinking
The Carbon Trust‟s experience supports the view of the Committee on Climate Change, which
indicated that savings of 4-6MtCO2 (up to 4% of current emissions) should be realistically achievable in industry with appropriate interventions (Reference - Committee on Climate
Change Report, December 2008), (page 5)
Reduction Opportunities for Direct Emissions
No Information
Reduction Opportunities for Indirect Emissions
Survey done of dairy industry members which asked questions about the good practice
opportunities they had implemented for cooling and refrigeration systems. List of opportunities
covered by survey given on page 44 and results for 10 sites that responded on page 49.
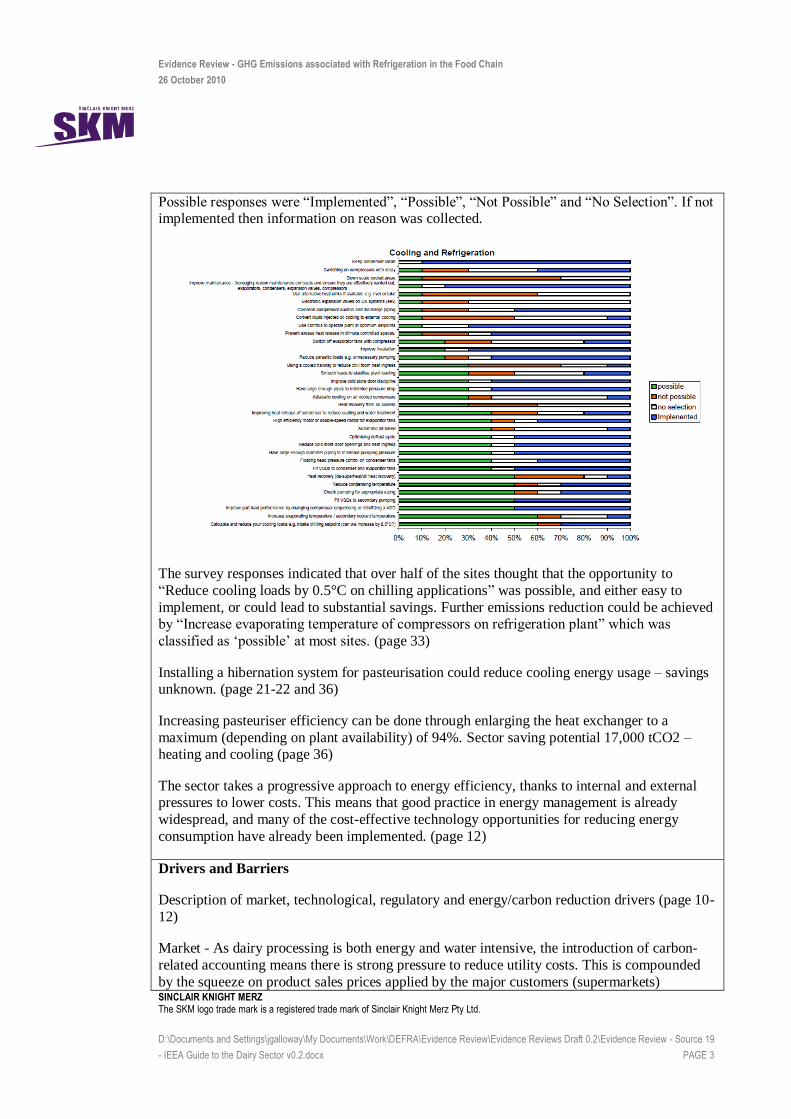
Evidence Review - GHG Emissions associated with Refrigeration in the Food Chain
26 October 2010
SINCLAIR KNIGHT MERZ The SKM logo trade mark is a registered trade mark of Sinclair Knight Merz Pty Ltd.
D:\Documents and Settings\jgalloway\My Documents\Work\DEFRA\Evidence Review\Evidence Reviews Draft 0.2\Evidence Review - Source 19
- IEEA Guide to the Dairy Sector v0.2.docx PAGE 3
Possible responses were “Implemented”, “Possible”, “Not Possible” and “No Selection”. If not implemented then information on reason was collected.
The survey responses indicated that over half of the sites thought that the opportunity to
“Reduce cooling loads by 0.5°C on chilling applications” was possible, and either easy to
implement, or could lead to substantial savings. Further emissions reduction could be achieved by “Increase evaporating temperature of compressors on refrigeration plant” which was
classified as „possible‟ at most sites. (page 33)
Installing a hibernation system for pasteurisation could reduce cooling energy usage – savings unknown. (page 21-22 and 36)
Increasing pasteuriser efficiency can be done through enlarging the heat exchanger to a
maximum (depending on plant availability) of 94%. Sector saving potential 17,000 tCO2 – heating and cooling (page 36)
The sector takes a progressive approach to energy efficiency, thanks to internal and external pressures to lower costs. This means that good practice in energy management is already
widespread, and many of the cost-effective technology opportunities for reducing energy
consumption have already been implemented. (page 12)
Drivers and Barriers
Description of market, technological, regulatory and energy/carbon reduction drivers (page 10-
12)
Market - As dairy processing is both energy and water intensive, the introduction of carbon-
related accounting means there is strong pressure to reduce utility costs. This is compounded
by the squeeze on product sales prices applied by the major customers (supermarkets)

Evidence Review - GHG Emissions associated with Refrigeration in the Food Chain
26 October 2010
SINCLAIR KNIGHT MERZ The SKM logo trade mark is a registered trade mark of Sinclair Knight Merz Pty Ltd.
D:\Documents and Settings\jgalloway\My Documents\Work\DEFRA\Evidence Review\Evidence Reviews Draft 0.2\Evidence Review - Source 19
- IEEA Guide to the Dairy Sector v0.2.docx PAGE 4
dominating the supply chain. Demand by retailers for products such as regional and organic milk may also complicate the manufacturing processes. In addition to meeting any regulatory
requirements, a dairy company may wish to show investors, the local community and the
wider public its commitment to being proactive on climate change.
Regulatory – CCA, EU ETS, IPPC, food safety. If an alternative method for pasteurisation
could be found to bring about the same level of microbial destruction, but at lower
temperatures, then the Food Standards Agency would need to revise its definition of pasteurisation in its regulatory requirements before any such method could be deployed
commercially. This is a key barrier to change.
Energy/Carbon Reduction - the three main drivers for energy reduction are cost, regulation and the environment.

Evidence Review
GHG Emissions due to Refrigeration in the Food Chain
SINCLAIR KNIGHT MERZ
The SKM logo trade mark is a registered trade mark of Sinclair Knight Merz Pty Ltd.
D:\Documents and Settings\jgalloway\My Documents\Work\DEFRA\Evidence Review\Evidence Reviews Draft 0.2\Evidence Review - Source 20
- Real Zero.docx PAGE 1
Source Name Real Zero
Author David Cowan, Jane Gartshore, Issa Chaer, Christina Francis and Graeme Maidment for the Institute of Refrigeration
Date April 2010
Source No. 20
Source Format Technical Paper for the IOR, web site, good practice guides, case studies, training courses
Sectors covered by source
– No - Yes
Sector Covered?
Agriculture (post harvest)
Food manufacturing
Drink manufacturing
Chill/Cold storage
Refrigerated distribution
Retail
Food Services
Food chain sectors in general
Information in Source
– no information - some information - detailed information
Area Information?
Emissions data - direct
Emissions data - indirect
Reduction Opportunities - direct
Reduction Opportunities - indirect
Strategic - direct
Strategic - indirect
Following table completed with any information contained in the source under the relevant
headings, include reference details e.g. page no., section no., table no. etc.

Evidence Review - GHG Emissions associated with Refrigeration in the Food Chain
26 October 2010
SINCLAIR KNIGHT MERZ The SKM logo trade mark is a registered trade mark of Sinclair Knight Merz Pty Ltd.
D:\Documents and Settings\jgalloway\My Documents\Work\DEFRA\Evidence Review\Evidence Reviews Draft 0.2\Evidence Review - Source 20
- Real Zero.docx PAGE 2
Direct GHG Emissions
RealZero Case Study 1 – Refrigeration Systems in the Retail Sector – gives:
“In the UK, leakage of HFC refrigerants from supermarket refrigeration systems is estimated to have been 769,000 kg in 2005”
Also, Case Study 2 – Industrial Refrigeration and Air Conditioning Systems – gives:
“In the UK, leakage of HFC refrigerants from industrial refrigeration and air conditioning
(RAC) systems is estimated to have been 359,000 kg in 2005”
[Both the above sourced from AEAT (2004), Emissions and Projections of HFCs, PFCs and SF6 for the UK and Constituent Countries, Report No. AEAT/ED50090/R02].
Indirect GHG Emissions
See “Table 1” below.
Refrigeration Activities in each stage of the Food Chain
No information.
Strategic Thinking
The RealZero programme calls for compliance with existing F-Gas and Ozone Regulations on minimizing refrigerant leakage
It encourages best practice and provides training for technicians in leak testing and prevention
Reduction Opportunities for Direct Emissions
IOR April 2010 paper gives (Fig 3) 2008 breakdown of UK GHG emissions (source: DECC)
And (from HEAP 2001) a breakdown of direct and indirect emissions from different types of
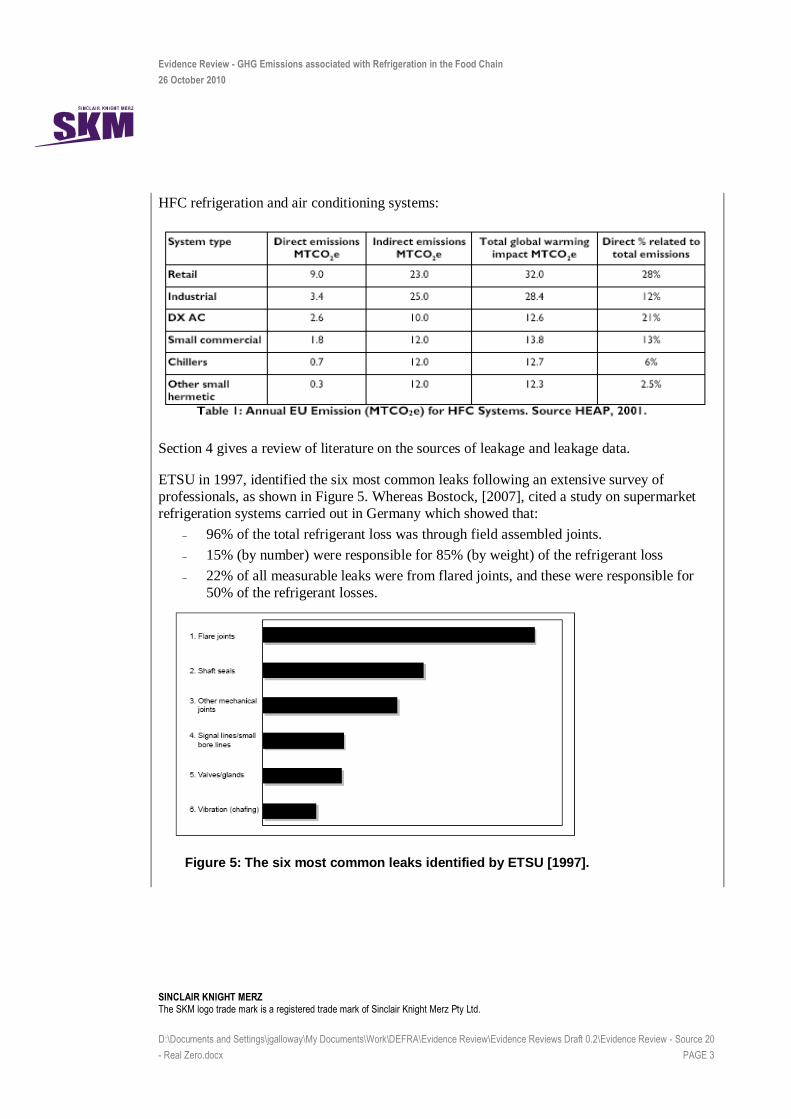
Evidence Review - GHG Emissions associated with Refrigeration in the Food Chain
26 October 2010
SINCLAIR KNIGHT MERZ The SKM logo trade mark is a registered trade mark of Sinclair Knight Merz Pty Ltd.
D:\Documents and Settings\jgalloway\My Documents\Work\DEFRA\Evidence Review\Evidence Reviews Draft 0.2\Evidence Review - Source 20
- Real Zero.docx PAGE 3
HFC refrigeration and air conditioning systems:
Section 4 gives a review of literature on the sources of leakage and leakage data.
ETSU in 1997, identified the six most common leaks following an extensive survey of
professionals, as shown in Figure 5. Whereas Bostock, [2007], cited a study on supermarket
refrigeration systems carried out in Germany which showed that:
– 96% of the total refrigerant loss was through field assembled joints.
– 15% (by number) were responsible for 85% (by weight) of the refrigerant loss
– 22% of all measurable leaks were from flared joints, and these were responsible for
50% of the refrigerant losses.
Figure 5: The six most common leaks identified by ETSU [1997].
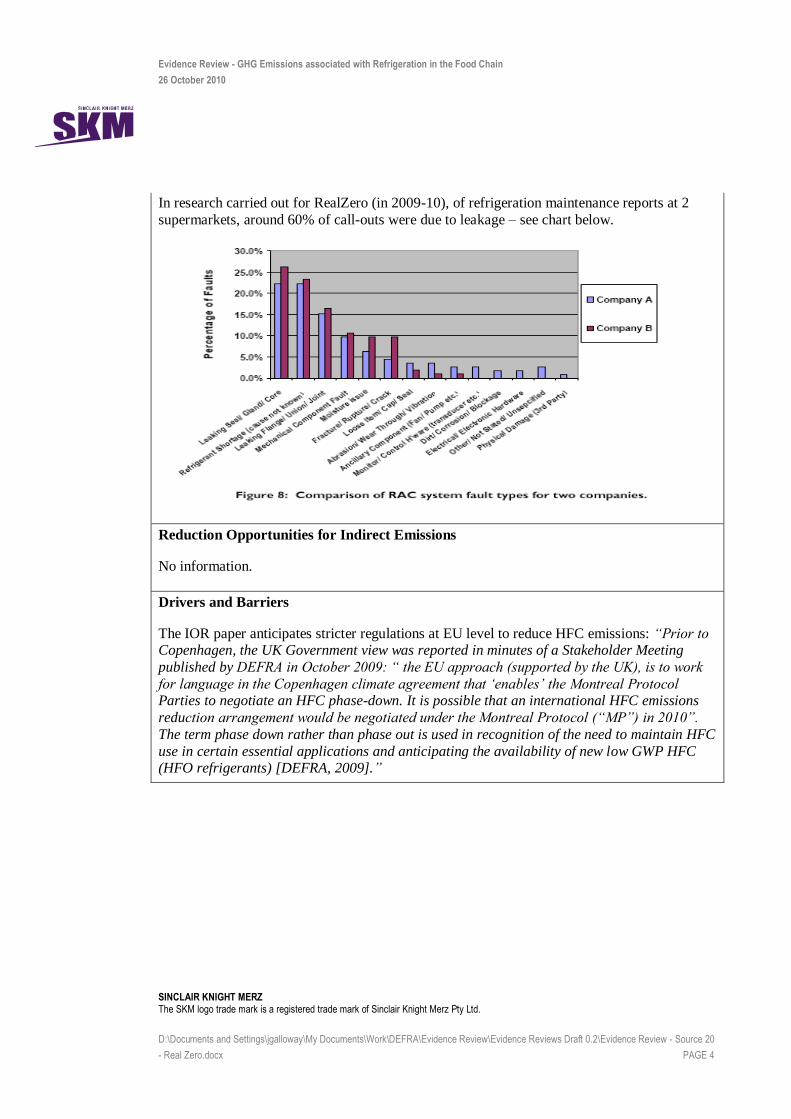
Evidence Review - GHG Emissions associated with Refrigeration in the Food Chain
26 October 2010
SINCLAIR KNIGHT MERZ The SKM logo trade mark is a registered trade mark of Sinclair Knight Merz Pty Ltd.
D:\Documents and Settings\jgalloway\My Documents\Work\DEFRA\Evidence Review\Evidence Reviews Draft 0.2\Evidence Review - Source 20
- Real Zero.docx PAGE 4
In research carried out for RealZero (in 2009-10), of refrigeration maintenance reports at 2
supermarkets, around 60% of call-outs were due to leakage – see chart below.
Reduction Opportunities for Indirect Emissions
No information.
Drivers and Barriers
The IOR paper anticipates stricter regulations at EU level to reduce HFC emissions: “Prior to Copenhagen, the UK Government view was reported in minutes of a Stakeholder Meeting
published by DEFRA in October 2009: “ the EU approach (supported by the UK), is to work
for language in the Copenhagen climate agreement that „enables‟ the Montreal Protocol Parties to negotiate an HFC phase-down. It is possible that an international HFC emissions
reduction arrangement would be negotiated under the Montreal Protocol (“MP”) in 2010”.
The term phase down rather than phase out is used in recognition of the need to maintain HFC
use in certain essential applications and anticipating the availability of new low GWP HFC (HFO refrigerants) [DEFRA, 2009].”

Evidence Review
GHG Emissions due to Refrigeration in the Food Chain
SINCLAIR KNIGHT MERZ
The SKM logo trade mark is a registered trade mark of Sinclair Knight Merz Pty Ltd.
D:\Documents and Settings\jgalloway\My Documents\Work\DEFRA\Evidence Review\Evidence Reviews Draft 0.2\Evidence Review - Source 21
- Honeywell low GWP Refrigerant literature v0.2.docx PAGE 1
Source Name Sales literature for new HFO refrigerants and R407F (Genetron Performax) HFC refrigerant
Author Honeywell
Date 2010
Source No. 21
Source Format Sales literature
Sectors covered by source
– No - Yes
Sector Covered?
Agriculture (post harvest)
Food manufacturing
Drink manufacturing
Chill/Cold storage
Refrigerated distribution
Retail
Food Services
Food chain sectors in general
Information in Source
– no information - some information - detailed information
Area Information?
Emissions data - direct
Emissions data - indirect
Reduction Opportunities - direct
Reduction Opportunities - indirect
Strategic - direct
Strategic - indirect
Following table completed with any information contained in the source under the relevant
headings, include reference details e.g. page no., section no., table no. etc.

Evidence Review - GHG Emissions associated with Refrigeration in the Food Chain
26 October 2010
SINCLAIR KNIGHT MERZ The SKM logo trade mark is a registered trade mark of Sinclair Knight Merz Pty Ltd.
D:\Documents and Settings\jgalloway\My Documents\Work\DEFRA\Evidence Review\Evidence Reviews Draft 0.2\Evidence Review - Source 21
- Honeywell low GWP Refrigerant literature v0.2.docx PAGE 2
Direct GHG Emissions
No information.
Indirect GHG Emissions
No information.
Refrigeration Activities in each stage of the Food Chain
No information.
Strategic Thinking
No information
Reduction Opportunities for Direct Emissions
Honeywell Genetron® Performax™ LT (a ternary blend of HFC-32/HFC-125/HFC-134a) (R407F), GWP around 1800 – designed as R22 replacement (requires POE oil)
Presentation from Tim Vink (Honeywell)
HFO1234yf HFO1234ze(E)
ODP 0 0
Atmospheric Life 11 days 18
GWP100 4 6
COP index (R134a = 100%) 96% 100%
Capacity index (R134a = 100%) 94% 73%
Application Solution GWP Benefit Performance
Aerosol HFO-1234ze 1430 ►6 Same
MAC HFO-123yf 1430 ►4 Same/Better
Insulation Foam HBA-2 1030 ►7 Better
Solvent HBA-2 ~2000 ►7 Same or Better
Stationary AC LGWP Blends ~2000 ►<500 Same
Refrigeration LGWP Blends ~4000 ►<1000 Same
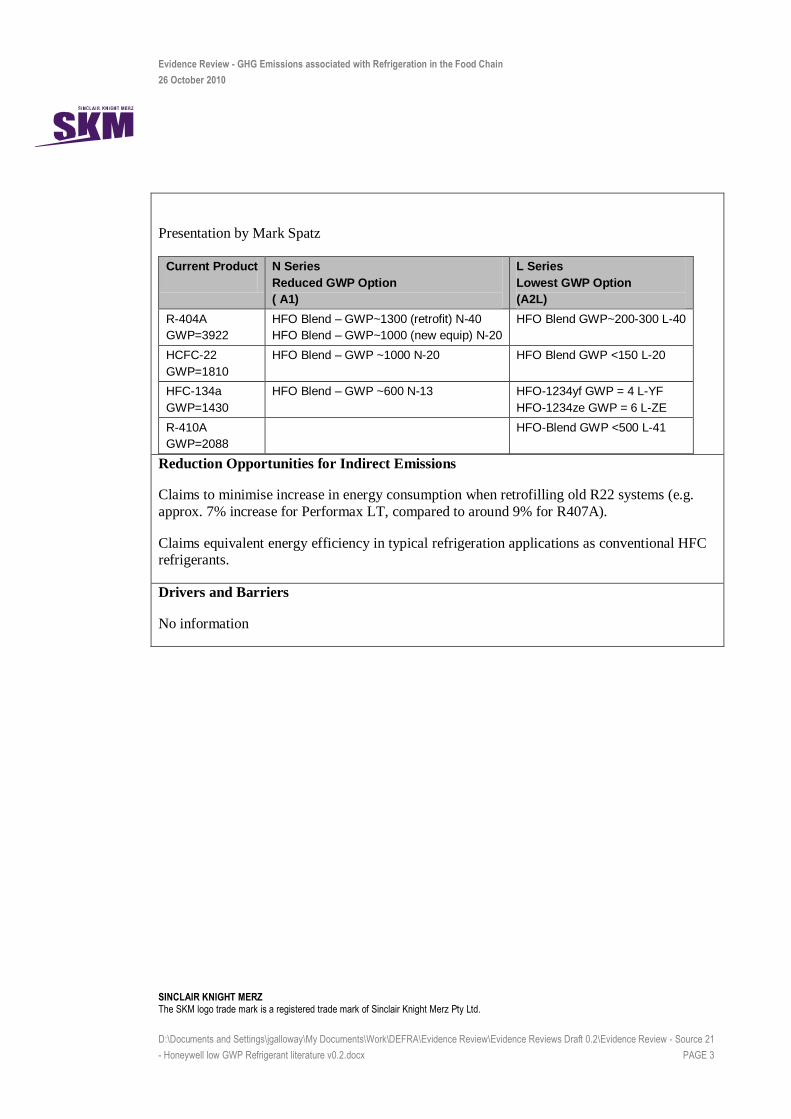
Evidence Review - GHG Emissions associated with Refrigeration in the Food Chain
26 October 2010
SINCLAIR KNIGHT MERZ The SKM logo trade mark is a registered trade mark of Sinclair Knight Merz Pty Ltd.
D:\Documents and Settings\jgalloway\My Documents\Work\DEFRA\Evidence Review\Evidence Reviews Draft 0.2\Evidence Review - Source 21
- Honeywell low GWP Refrigerant literature v0.2.docx PAGE 3
Presentation by Mark Spatz
Current Product
N Series
Reduced GWP Option
( A1)
L Series
Lowest GWP Option
(A2L)
R-404A
GWP=3922
HFO Blend – GWP~1300 (retrofit) N-40
HFO Blend – GWP~1000 (new equip) N-20
HFO Blend GWP~200-300 L-40
HCFC-22
GWP=1810
HFO Blend – GWP ~1000 N-20 HFO Blend GWP <150 L-20
HFC-134a
GWP=1430
HFO Blend – GWP ~600 N-13 HFO-1234yf GWP = 4 L-YF
HFO-1234ze GWP = 6 L-ZE
R-410A
GWP=2088
HFO-Blend GWP <500 L-41
Reduction Opportunities for Indirect Emissions
Claims to minimise increase in energy consumption when retrofilling old R22 systems (e.g.
approx. 7% increase for Performax LT, compared to around 9% for R407A).
Claims equivalent energy efficiency in typical refrigeration applications as conventional HFC refrigerants.
Drivers and Barriers
No information
Evidence Review
GHG Emissions due to Refrigeration in the Food Chain
SINCLAIR KNIGHT MERZ
The SKM logo trade mark is a registered trade mark of Sinclair Knight Merz Pty Ltd.
D:\Documents and Settings\jgalloway\My Documents\Work\DEFRA\Evidence Review\Evidence Reviews Draft 0.2\Evidence Review - Source 22
- Comparative Assessment of Supermarket Refrig - Umwelt BundesAmt v0.2.docx PAGE 1
Source Name Comparative Assessment of the Climate relevance of Supermarket Refrigeration Systems and Equipment
Author Harnisch et al, for German Federal Environment Agency
Date March 2009
Source No. 22
Source Format Report
Sectors covered by source
– No - Yes
Sector Covered?
Agriculture (post harvest)
Food manufacturing
Drink manufacturing
Chill/Cold storage
Refrigerated distribution
Retail
Food Services
Food chain sectors in general
Information in Source
– no information - some information - detailed information
Area Information?
Emissions data - direct
Emissions data - indirect
Reduction Opportunities - direct
Reduction Opportunities - indirect
Strategic - direct
Strategic - indirect
Following table completed with any information contained in the source under the relevant
headings, include reference details e.g. page no., section no., table no. etc.
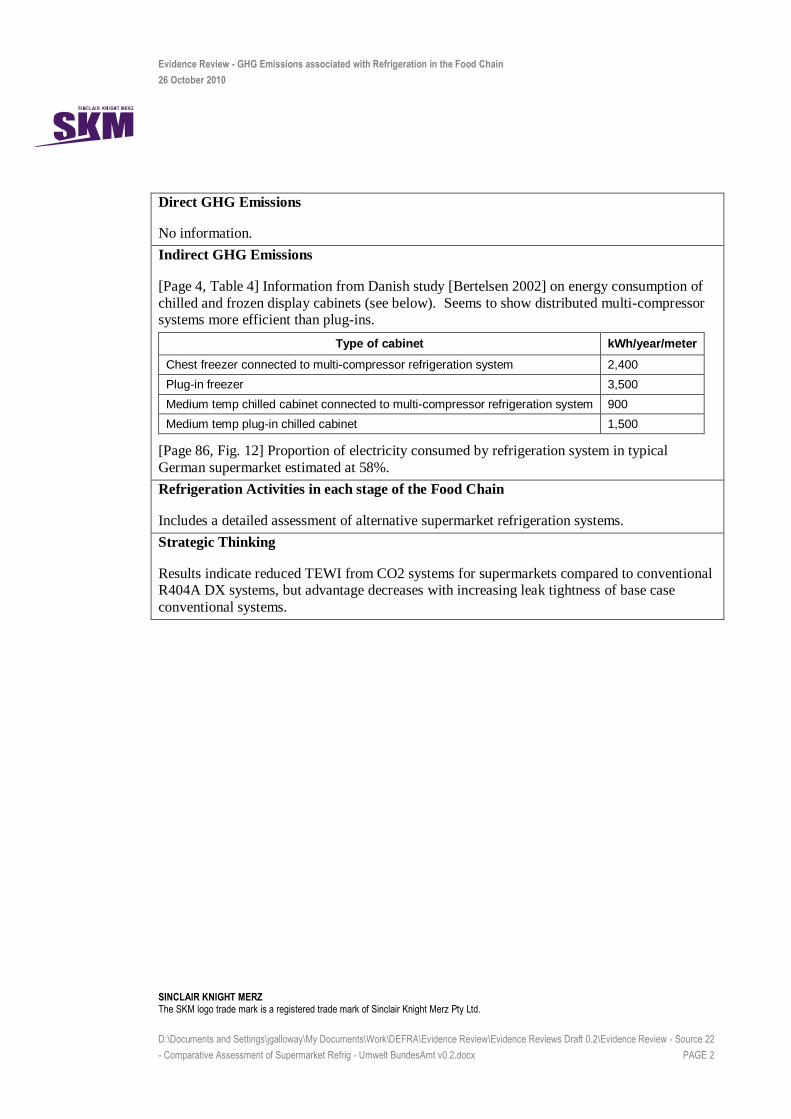
Evidence Review - GHG Emissions associated with Refrigeration in the Food Chain
26 October 2010
SINCLAIR KNIGHT MERZ The SKM logo trade mark is a registered trade mark of Sinclair Knight Merz Pty Ltd.
D:\Documents and Settings\jgalloway\My Documents\Work\DEFRA\Evidence Review\Evidence Reviews Draft 0.2\Evidence Review - Source 22
- Comparative Assessment of Supermarket Refrig - Umwelt BundesAmt v0.2.docx PAGE 2
Direct GHG Emissions
No information.
Indirect GHG Emissions
[Page 4, Table 4] Information from Danish study [Bertelsen 2002] on energy consumption of
chilled and frozen display cabinets (see below). Seems to show distributed multi-compressor systems more efficient than plug-ins.
Type of cabinet kWh/year/meter
Chest freezer connected to multi-compressor refrigeration system 2,400
Plug-in freezer 3,500
Medium temp chilled cabinet connected to multi-compressor refrigeration system 900
Medium temp plug-in chilled cabinet 1,500
[Page 86, Fig. 12] Proportion of electricity consumed by refrigeration system in typical
German supermarket estimated at 58%.
Refrigeration Activities in each stage of the Food Chain
Includes a detailed assessment of alternative supermarket refrigeration systems.
Strategic Thinking
Results indicate reduced TEWI from CO2 systems for supermarkets compared to conventional R404A DX systems, but advantage decreases with increasing leak tightness of base case
conventional systems.
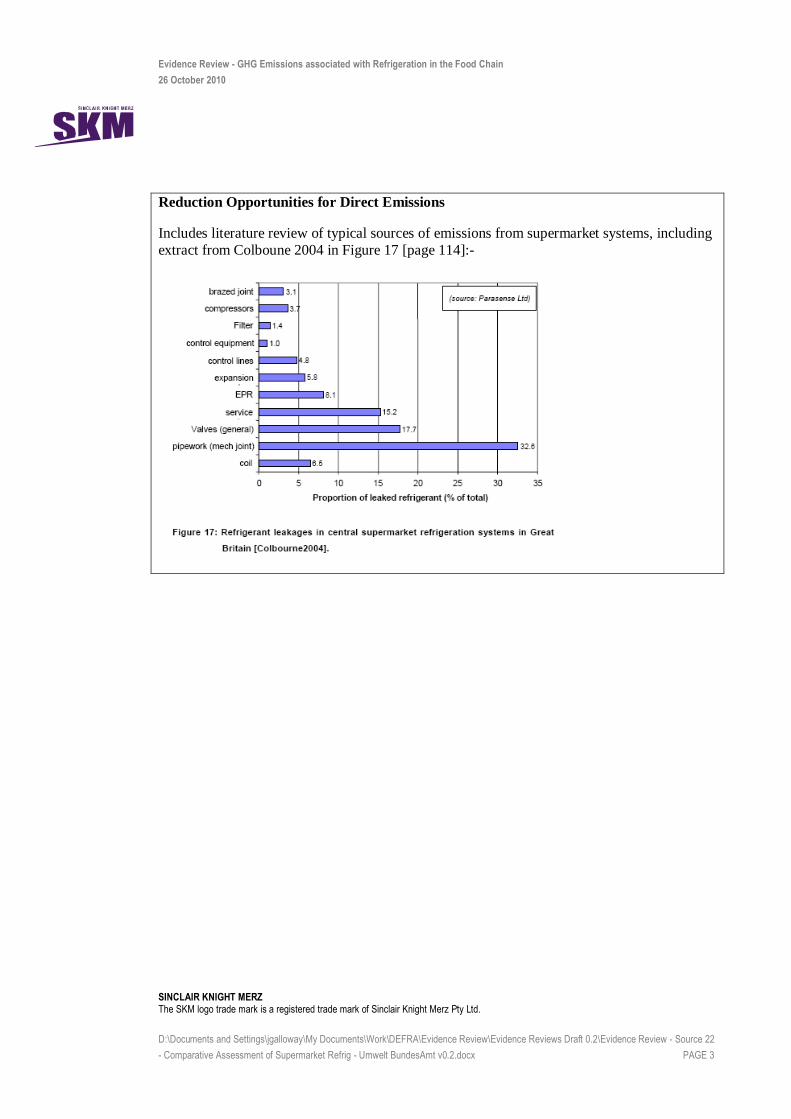
Evidence Review - GHG Emissions associated with Refrigeration in the Food Chain
26 October 2010
SINCLAIR KNIGHT MERZ The SKM logo trade mark is a registered trade mark of Sinclair Knight Merz Pty Ltd.
D:\Documents and Settings\jgalloway\My Documents\Work\DEFRA\Evidence Review\Evidence Reviews Draft 0.2\Evidence Review - Source 22
- Comparative Assessment of Supermarket Refrig - Umwelt BundesAmt v0.2.docx PAGE 3
Reduction Opportunities for Direct Emissions
Includes literature review of typical sources of emissions from supermarket systems, including
extract from Colboune 2004 in Figure 17 [page 114]:-
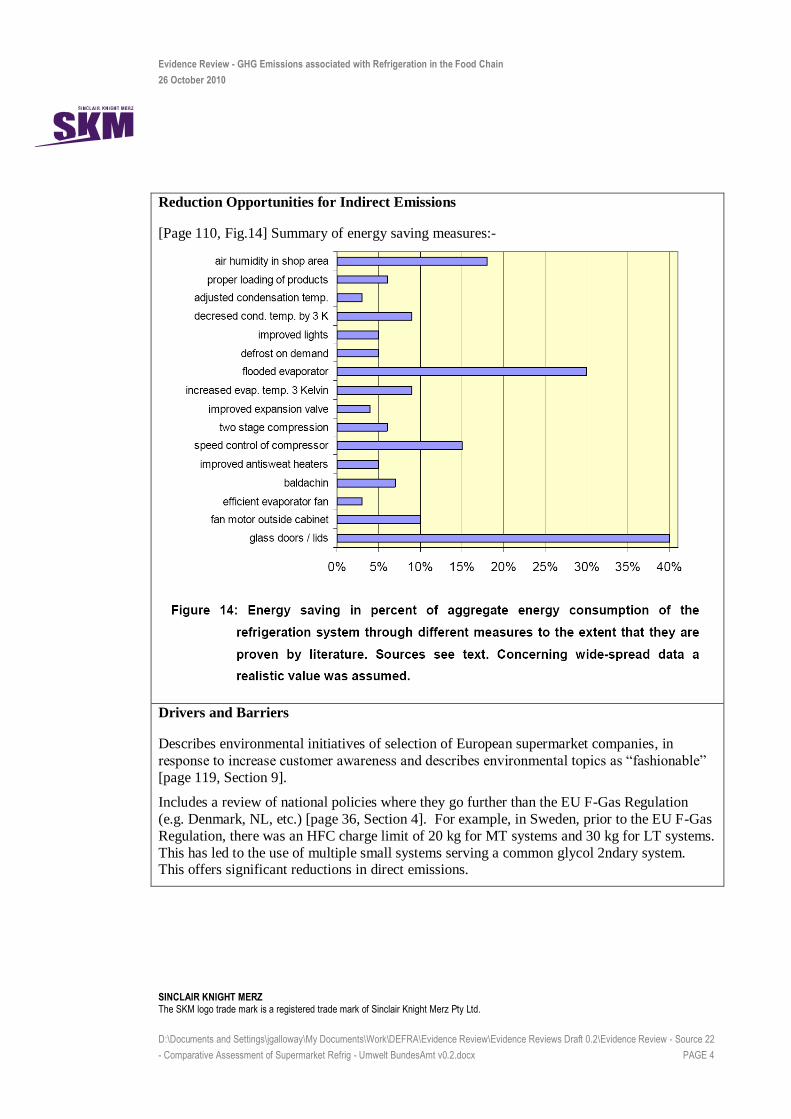
Evidence Review - GHG Emissions associated with Refrigeration in the Food Chain
26 October 2010
SINCLAIR KNIGHT MERZ The SKM logo trade mark is a registered trade mark of Sinclair Knight Merz Pty Ltd.
D:\Documents and Settings\jgalloway\My Documents\Work\DEFRA\Evidence Review\Evidence Reviews Draft 0.2\Evidence Review - Source 22
- Comparative Assessment of Supermarket Refrig - Umwelt BundesAmt v0.2.docx PAGE 4
Reduction Opportunities for Indirect Emissions
[Page 110, Fig.14] Summary of energy saving measures:-
Drivers and Barriers
Describes environmental initiatives of selection of European supermarket companies, in
response to increase customer awareness and describes environmental topics as “fashionable”
[page 119, Section 9].
Includes a review of national policies where they go further than the EU F-Gas Regulation
(e.g. Denmark, NL, etc.) [page 36, Section 4]. For example, in Sweden, prior to the EU F-Gas
Regulation, there was an HFC charge limit of 20 kg for MT systems and 30 kg for LT systems.
This has led to the use of multiple small systems serving a common glycol 2ndary system. This offers significant reductions in direct emissions.

Evidence Review
GHG Emissions due to Refrigeration in the Food Chain
SINCLAIR KNIGHT MERZ
The SKM logo trade mark is a registered trade mark of Sinclair Knight Merz Pty Ltd.
D:\Documents and Settings\jgalloway\My Documents\Work\DEFRA\Evidence Review\Evidence Reviews Draft 0.2\Evidence Review - Source 23
- Market Transformation Programme v0.2 v2.docx PAGE 1
Source Name Defra Market Transformation Programme
Author Various
Date 2010
Source No. 23
Source Format Information available on commercial refrigeration, especially the Briefing Notes on the MTP website. http://efficient-products.defra.gov.uk/cms/product-strategies/subsector/commercial-refrigeration.
Sectors covered by source
– No - Yes
Sector Covered?
Agriculture (post harvest)
Food manufacturing
Drink manufacturing
Chill/Cold storage
Refrigerated distribution
Retail
Food Services
Food chain sectors in general
Information in Source
– no information - some information - detailed information
Area Information?
Emissions data - direct
Emissions data - indirect
Reduction Opportunities - direct
Reduction Opportunities - indirect
Strategic - direct
Strategic - indirect

Evidence Review - GHG Emissions associated with Refrigeration in the Food Chain
26 October 2010
SINCLAIR KNIGHT MERZ The SKM logo trade mark is a registered trade mark of Sinclair Knight Merz Pty Ltd.
D:\Documents and Settings\jgalloway\My Documents\Work\DEFRA\Evidence Review\Evidence Reviews Draft 0.2\Evidence Review - Source 23
- Market Transformation Programme v0.2 v2.docx PAGE 2
Following table completed with any information contained in the source under the relevant headings, include reference details e.g. page no., section no., table no. etc.
Direct GHG Emissions
No Information
Indirect GHG Emissions
Cellar Cooling
2009 2020 2030
Energy Consumption (GWh) 400 390 400
CO2 Emissions (MtCO2) 0.17 0.17 0.17
Walk-in Cold Rooms (<400 m3)
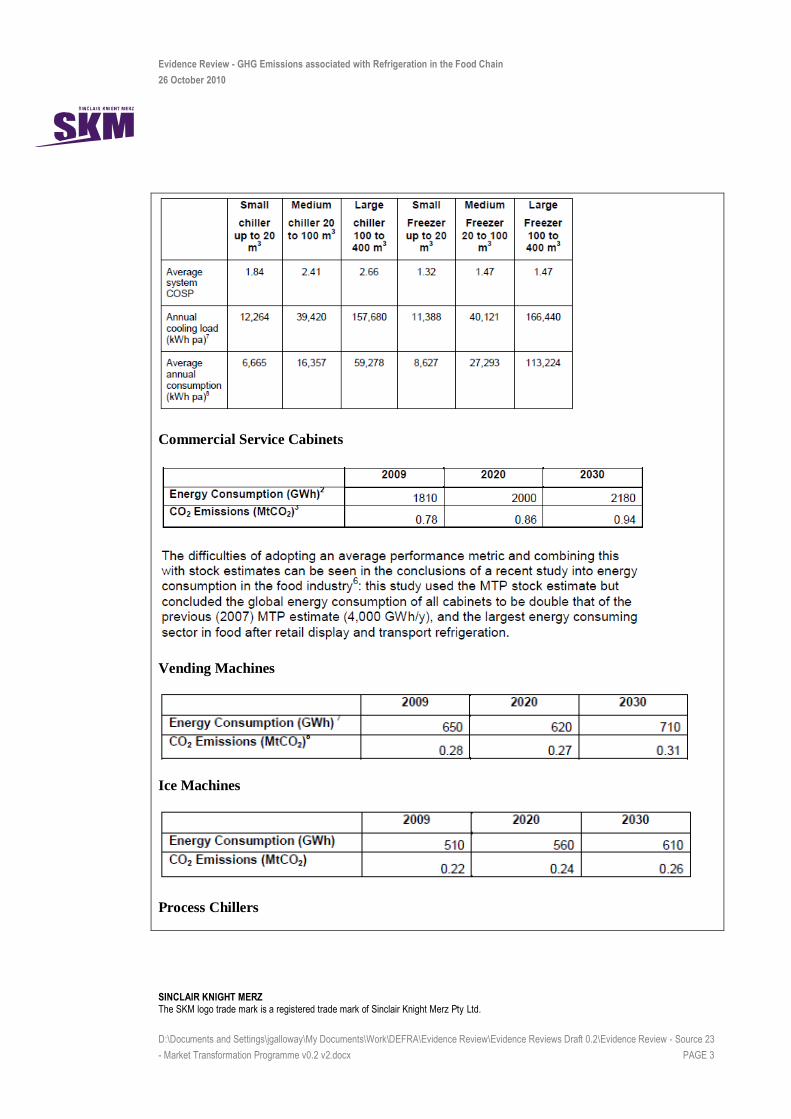
Evidence Review - GHG Emissions associated with Refrigeration in the Food Chain
26 October 2010
SINCLAIR KNIGHT MERZ The SKM logo trade mark is a registered trade mark of Sinclair Knight Merz Pty Ltd.
D:\Documents and Settings\jgalloway\My Documents\Work\DEFRA\Evidence Review\Evidence Reviews Draft 0.2\Evidence Review - Source 23
- Market Transformation Programme v0.2 v2.docx PAGE 3
Commercial Service Cabinets
Vending Machines
Ice Machines
Process Chillers

Evidence Review - GHG Emissions associated with Refrigeration in the Food Chain
26 October 2010
SINCLAIR KNIGHT MERZ The SKM logo trade mark is a registered trade mark of Sinclair Knight Merz Pty Ltd.
D:\Documents and Settings\jgalloway\My Documents\Work\DEFRA\Evidence Review\Evidence Reviews Draft 0.2\Evidence Review - Source 23
- Market Transformation Programme v0.2 v2.docx PAGE 4
Refrigerated Display Cases
Refrigeration Activities in each stage of the Food Chain
Cellar Cooling – all in Food Service sector
No. of units (2010) = 82,000, lifetime = 12.5 years
Walk-in Cool Rooms – in Food Service sector, supermarkets and distribution centres. Also used for pharmaceuticals.
No. of units (2010) = 164,000, lifetime = 10.5 years
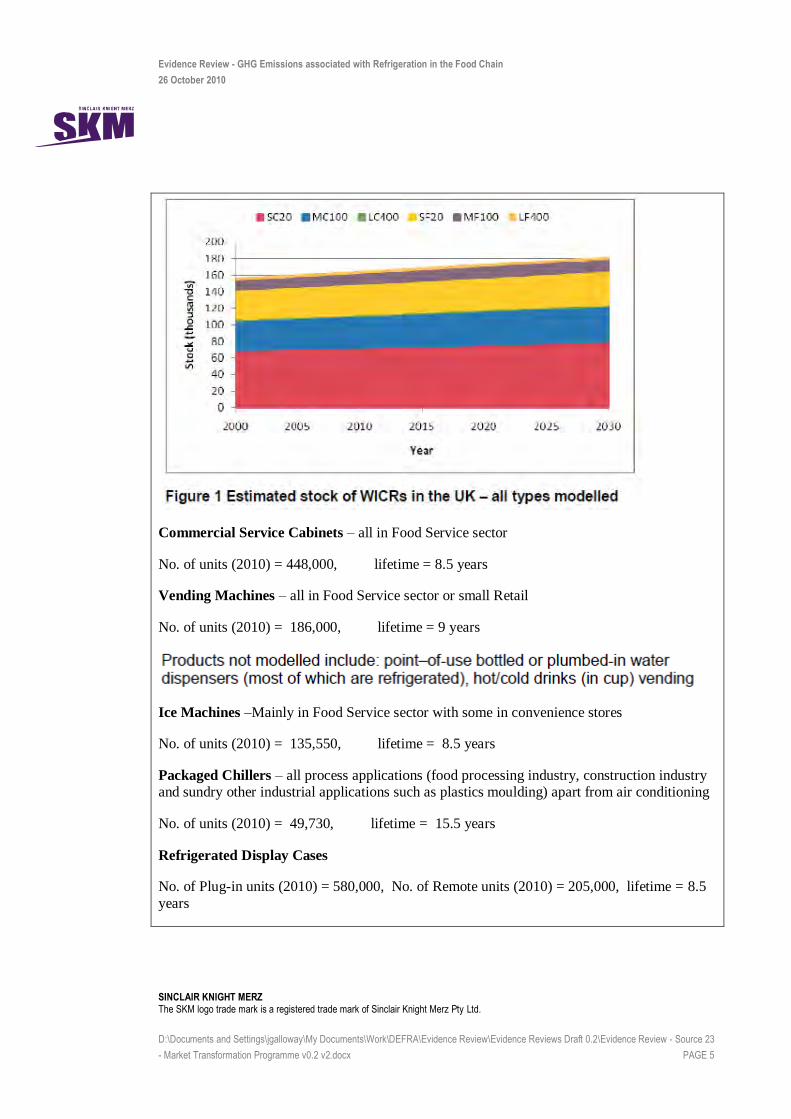
Evidence Review - GHG Emissions associated with Refrigeration in the Food Chain
26 October 2010
SINCLAIR KNIGHT MERZ The SKM logo trade mark is a registered trade mark of Sinclair Knight Merz Pty Ltd.
D:\Documents and Settings\jgalloway\My Documents\Work\DEFRA\Evidence Review\Evidence Reviews Draft 0.2\Evidence Review - Source 23
- Market Transformation Programme v0.2 v2.docx PAGE 5
Commercial Service Cabinets – all in Food Service sector
No. of units (2010) = 448,000, lifetime = 8.5 years
Vending Machines – all in Food Service sector or small Retail
No. of units (2010) = 186,000, lifetime = 9 years
Ice Machines –Mainly in Food Service sector with some in convenience stores
No. of units (2010) = 135,550, lifetime = 8.5 years
Packaged Chillers – all process applications (food processing industry, construction industry and sundry other industrial applications such as plastics moulding) apart from air conditioning
No. of units (2010) = 49,730, lifetime = 15.5 years
Refrigerated Display Cases
No. of Plug-in units (2010) = 580,000, No. of Remote units (2010) = 205,000, lifetime = 8.5
years
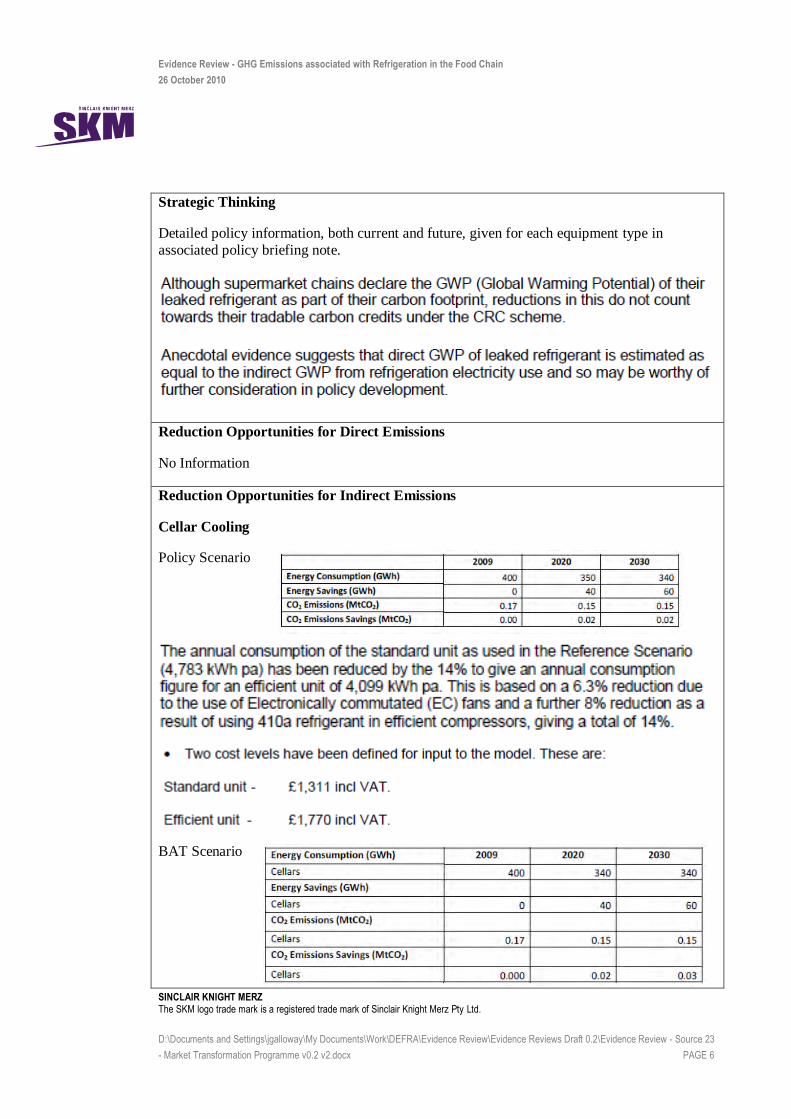
Evidence Review - GHG Emissions associated with Refrigeration in the Food Chain
26 October 2010
SINCLAIR KNIGHT MERZ The SKM logo trade mark is a registered trade mark of Sinclair Knight Merz Pty Ltd.
D:\Documents and Settings\jgalloway\My Documents\Work\DEFRA\Evidence Review\Evidence Reviews Draft 0.2\Evidence Review - Source 23
- Market Transformation Programme v0.2 v2.docx PAGE 6
Strategic Thinking
Detailed policy information, both current and future, given for each equipment type in
associated policy briefing note.
Reduction Opportunities for Direct Emissions
No Information
Reduction Opportunities for Indirect Emissions
Cellar Cooling
Policy Scenario
BAT Scenario
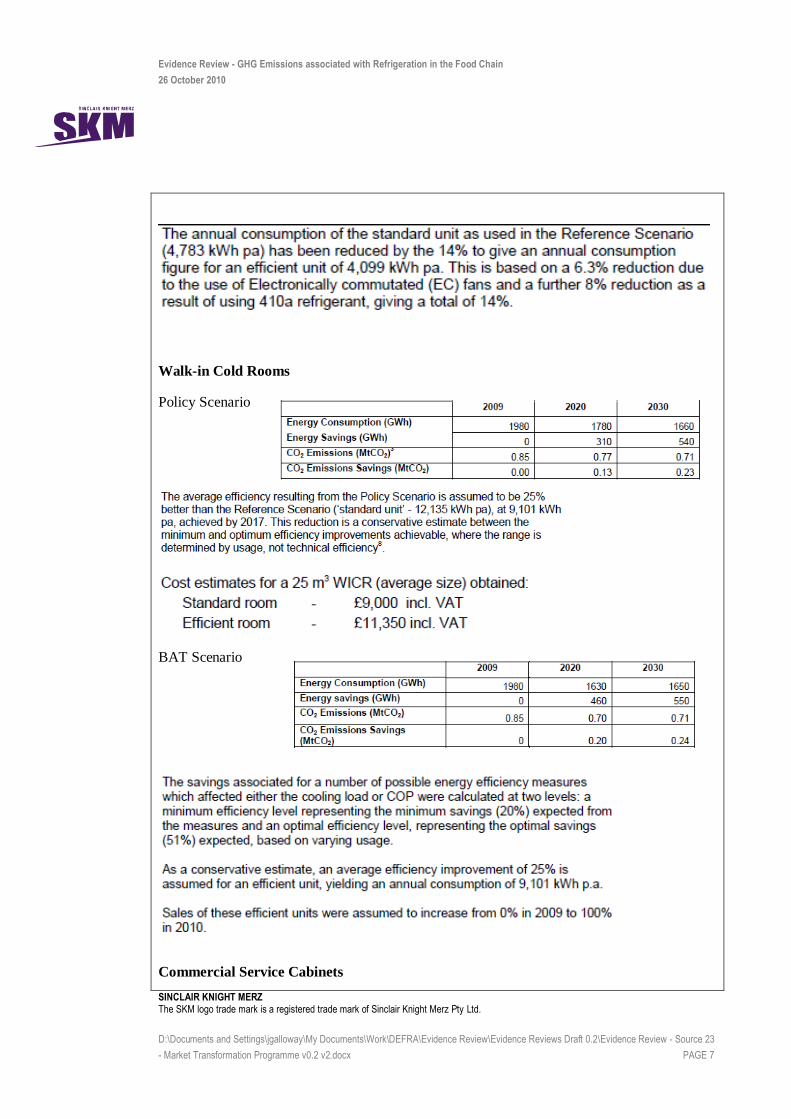
Evidence Review - GHG Emissions associated with Refrigeration in the Food Chain
26 October 2010
SINCLAIR KNIGHT MERZ The SKM logo trade mark is a registered trade mark of Sinclair Knight Merz Pty Ltd.
D:\Documents and Settings\jgalloway\My Documents\Work\DEFRA\Evidence Review\Evidence Reviews Draft 0.2\Evidence Review - Source 23
- Market Transformation Programme v0.2 v2.docx PAGE 7
Walk-in Cold Rooms
Policy Scenario
BAT Scenario
Commercial Service Cabinets
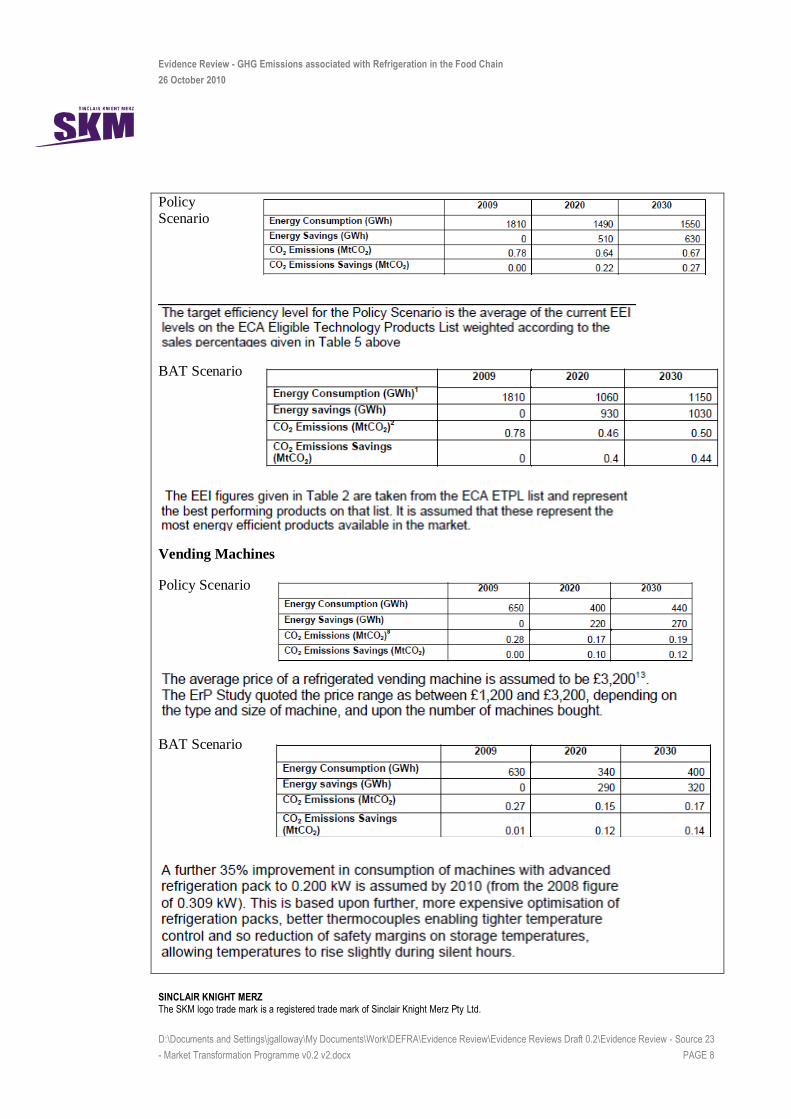
Evidence Review - GHG Emissions associated with Refrigeration in the Food Chain
26 October 2010
SINCLAIR KNIGHT MERZ The SKM logo trade mark is a registered trade mark of Sinclair Knight Merz Pty Ltd.
D:\Documents and Settings\jgalloway\My Documents\Work\DEFRA\Evidence Review\Evidence Reviews Draft 0.2\Evidence Review - Source 23
- Market Transformation Programme v0.2 v2.docx PAGE 8
Policy Scenario
BAT Scenario
Vending Machines
Policy Scenario
BAT Scenario
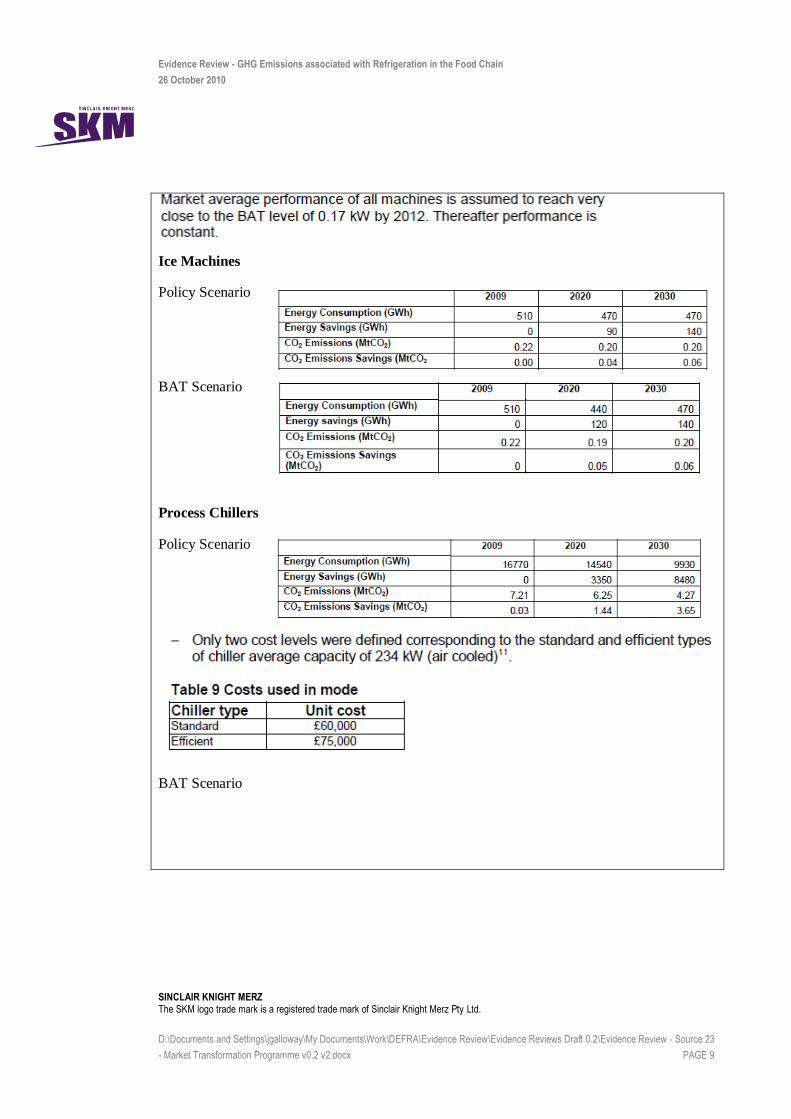
Evidence Review - GHG Emissions associated with Refrigeration in the Food Chain
26 October 2010
SINCLAIR KNIGHT MERZ The SKM logo trade mark is a registered trade mark of Sinclair Knight Merz Pty Ltd.
D:\Documents and Settings\jgalloway\My Documents\Work\DEFRA\Evidence Review\Evidence Reviews Draft 0.2\Evidence Review - Source 23
- Market Transformation Programme v0.2 v2.docx PAGE 9
Ice Machines
Policy Scenario
BAT Scenario
Process Chillers
Policy Scenario
BAT Scenario

Evidence Review - GHG Emissions associated with Refrigeration in the Food Chain
26 October 2010
SINCLAIR KNIGHT MERZ The SKM logo trade mark is a registered trade mark of Sinclair Knight Merz Pty Ltd.
D:\Documents and Settings\jgalloway\My Documents\Work\DEFRA\Evidence Review\Evidence Reviews Draft 0.2\Evidence Review - Source 23
- Market Transformation Programme v0.2 v2.docx PAGE 10
Refrigerated Display Cases
Policy Scenario
BAT Scenario
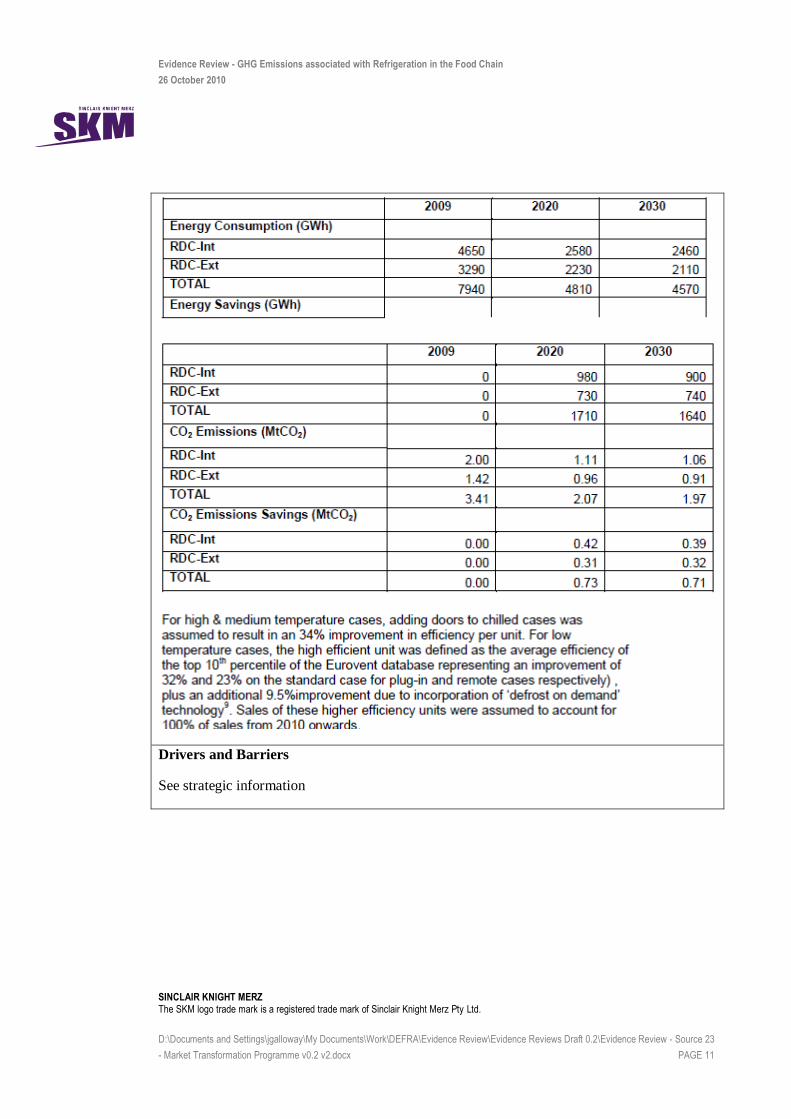
Evidence Review - GHG Emissions associated with Refrigeration in the Food Chain
26 October 2010
SINCLAIR KNIGHT MERZ The SKM logo trade mark is a registered trade mark of Sinclair Knight Merz Pty Ltd.
D:\Documents and Settings\jgalloway\My Documents\Work\DEFRA\Evidence Review\Evidence Reviews Draft 0.2\Evidence Review - Source 23
- Market Transformation Programme v0.2 v2.docx PAGE 11
Drivers and Barriers
See strategic information
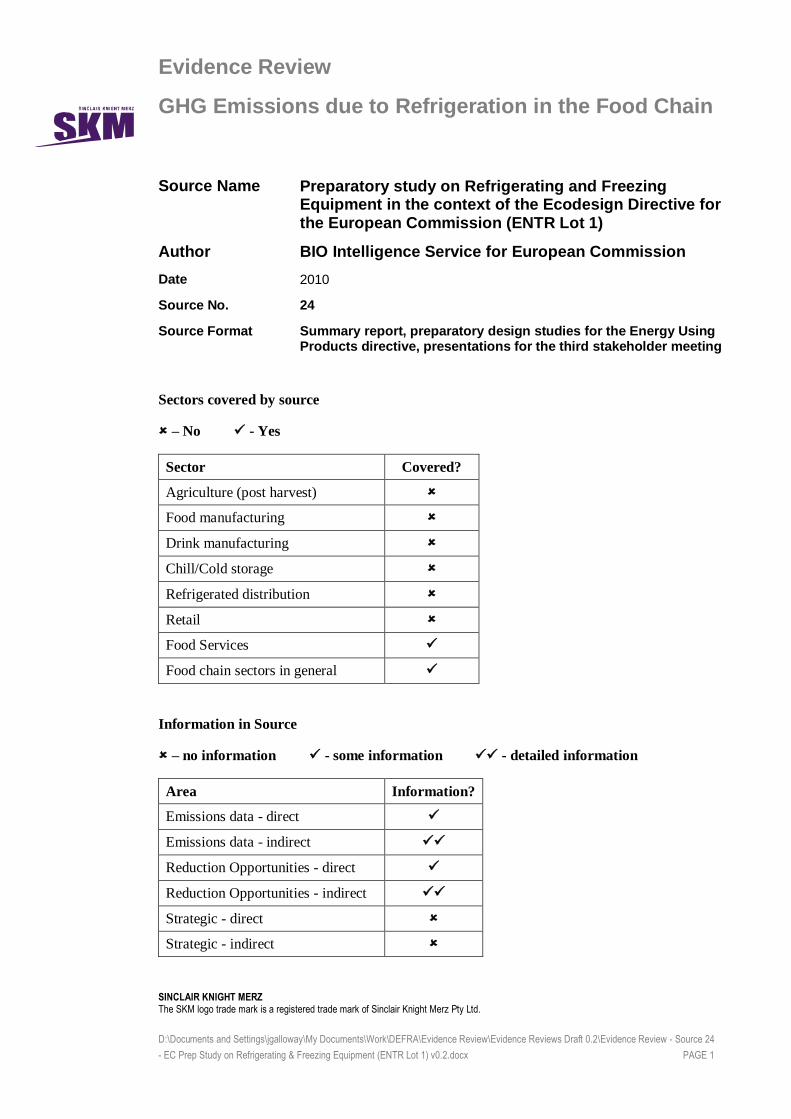
Evidence Review
GHG Emissions due to Refrigeration in the Food Chain
SINCLAIR KNIGHT MERZ
The SKM logo trade mark is a registered trade mark of Sinclair Knight Merz Pty Ltd.
D:\Documents and Settings\jgalloway\My Documents\Work\DEFRA\Evidence Review\Evidence Reviews Draft 0.2\Evidence Review - Source 24
- EC Prep Study on Refrigerating & Freezing Equipment (ENTR Lot 1) v0.2.docx PAGE 1
Source Name Preparatory study on Refrigerating and Freezing Equipment in the context of the Ecodesign Directive for the European Commission (ENTR Lot 1)
Author BIO Intelligence Service for European Commission
Date 2010
Source No. 24
Source Format Summary report, preparatory design studies for the Energy Using Products directive, presentations for the third stakeholder meeting
Sectors covered by source
– No - Yes
Sector Covered?
Agriculture (post harvest)
Food manufacturing
Drink manufacturing
Chill/Cold storage
Refrigerated distribution
Retail
Food Services
Food chain sectors in general
Information in Source
– no information - some information - detailed information
Area Information?
Emissions data - direct
Emissions data - indirect
Reduction Opportunities - direct
Reduction Opportunities - indirect
Strategic - direct
Strategic - indirect
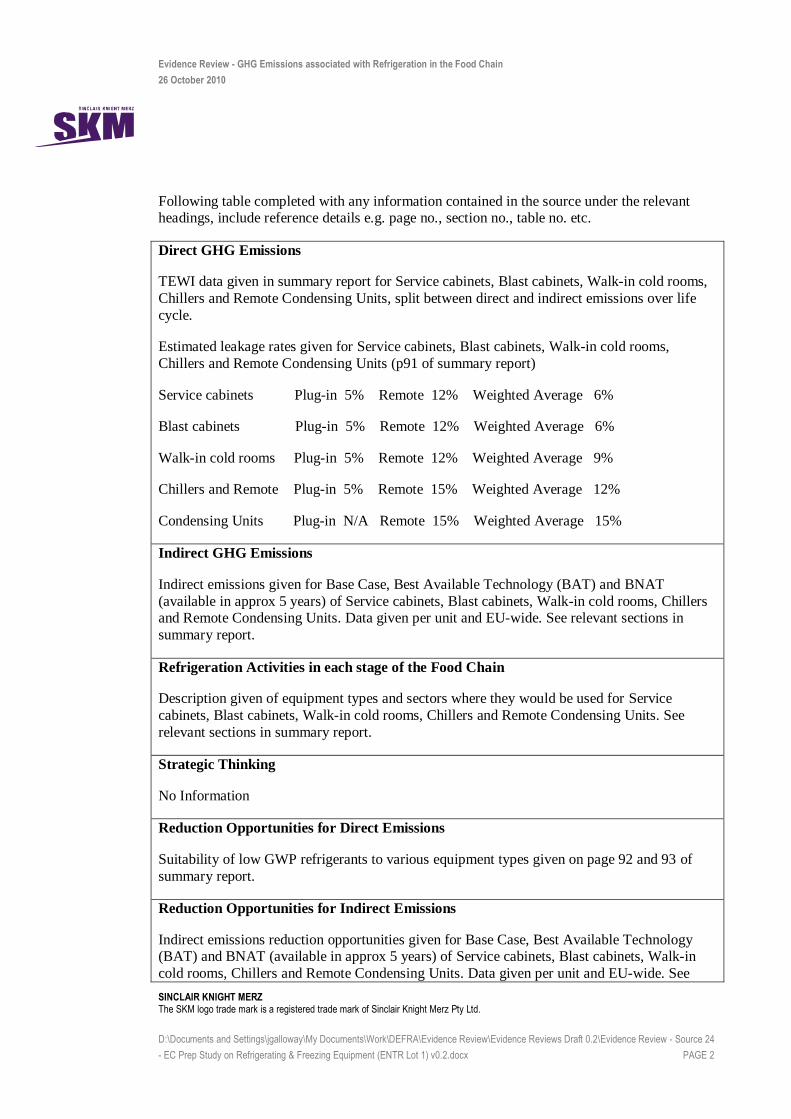
Evidence Review - GHG Emissions associated with Refrigeration in the Food Chain
26 October 2010
SINCLAIR KNIGHT MERZ The SKM logo trade mark is a registered trade mark of Sinclair Knight Merz Pty Ltd.
D:\Documents and Settings\jgalloway\My Documents\Work\DEFRA\Evidence Review\Evidence Reviews Draft 0.2\Evidence Review - Source 24
- EC Prep Study on Refrigerating & Freezing Equipment (ENTR Lot 1) v0.2.docx PAGE 2
Following table completed with any information contained in the source under the relevant headings, include reference details e.g. page no., section no., table no. etc.
Direct GHG Emissions
TEWI data given in summary report for Service cabinets, Blast cabinets, Walk-in cold rooms,
Chillers and Remote Condensing Units, split between direct and indirect emissions over life
cycle.
Estimated leakage rates given for Service cabinets, Blast cabinets, Walk-in cold rooms,
Chillers and Remote Condensing Units (p91 of summary report)
Service cabinets Plug-in 5% Remote 12% Weighted Average 6%
Blast cabinets Plug-in 5% Remote 12% Weighted Average 6%
Walk-in cold rooms Plug-in 5% Remote 12% Weighted Average 9%
Chillers and Remote Plug-in 5% Remote 15% Weighted Average 12%
Condensing Units Plug-in N/A Remote 15% Weighted Average 15%
Indirect GHG Emissions
Indirect emissions given for Base Case, Best Available Technology (BAT) and BNAT
(available in approx 5 years) of Service cabinets, Blast cabinets, Walk-in cold rooms, Chillers and Remote Condensing Units. Data given per unit and EU-wide. See relevant sections in
summary report.
Refrigeration Activities in each stage of the Food Chain
Description given of equipment types and sectors where they would be used for Service
cabinets, Blast cabinets, Walk-in cold rooms, Chillers and Remote Condensing Units. See
relevant sections in summary report.
Strategic Thinking
No Information
Reduction Opportunities for Direct Emissions
Suitability of low GWP refrigerants to various equipment types given on page 92 and 93 of
summary report.
Reduction Opportunities for Indirect Emissions
Indirect emissions reduction opportunities given for Base Case, Best Available Technology (BAT) and BNAT (available in approx 5 years) of Service cabinets, Blast cabinets, Walk-in
cold rooms, Chillers and Remote Condensing Units. Data given per unit and EU-wide. See
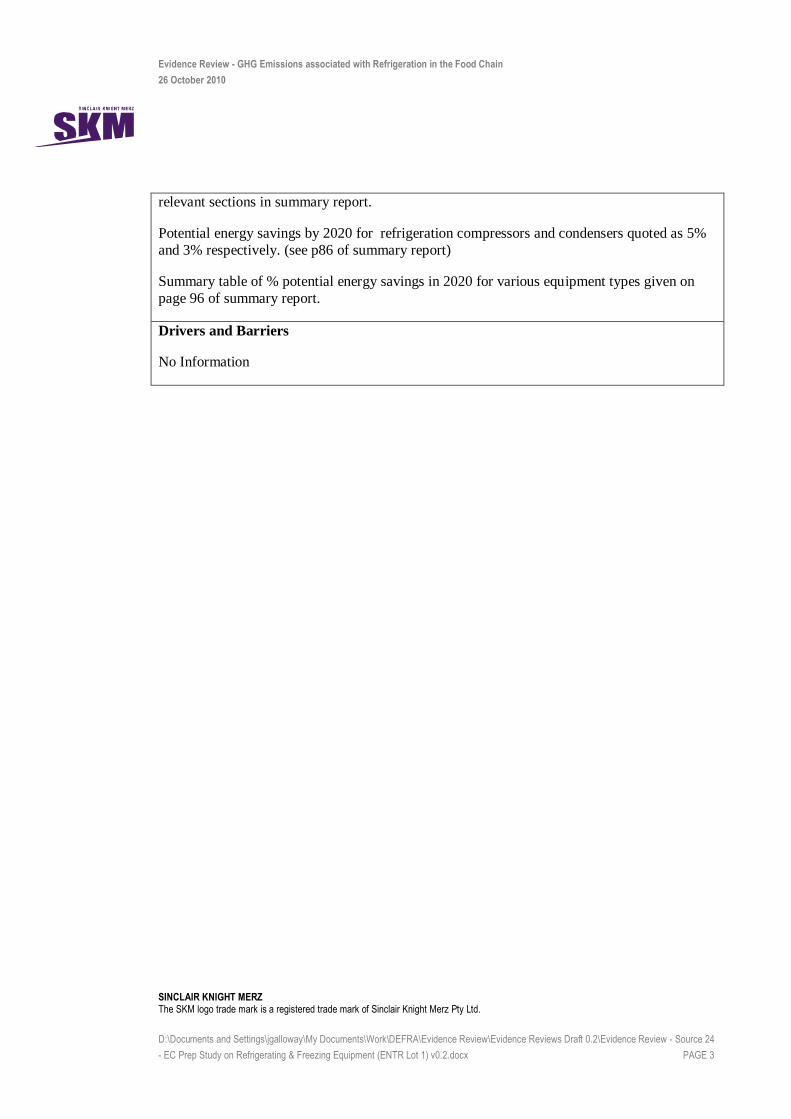
Evidence Review - GHG Emissions associated with Refrigeration in the Food Chain
26 October 2010
SINCLAIR KNIGHT MERZ The SKM logo trade mark is a registered trade mark of Sinclair Knight Merz Pty Ltd.
D:\Documents and Settings\jgalloway\My Documents\Work\DEFRA\Evidence Review\Evidence Reviews Draft 0.2\Evidence Review - Source 24
- EC Prep Study on Refrigerating & Freezing Equipment (ENTR Lot 1) v0.2.docx PAGE 3
relevant sections in summary report.
Potential energy savings by 2020 for refrigeration compressors and condensers quoted as 5%
and 3% respectively. (see p86 of summary report)
Summary table of % potential energy savings in 2020 for various equipment types given on
page 96 of summary report.
Drivers and Barriers
No Information
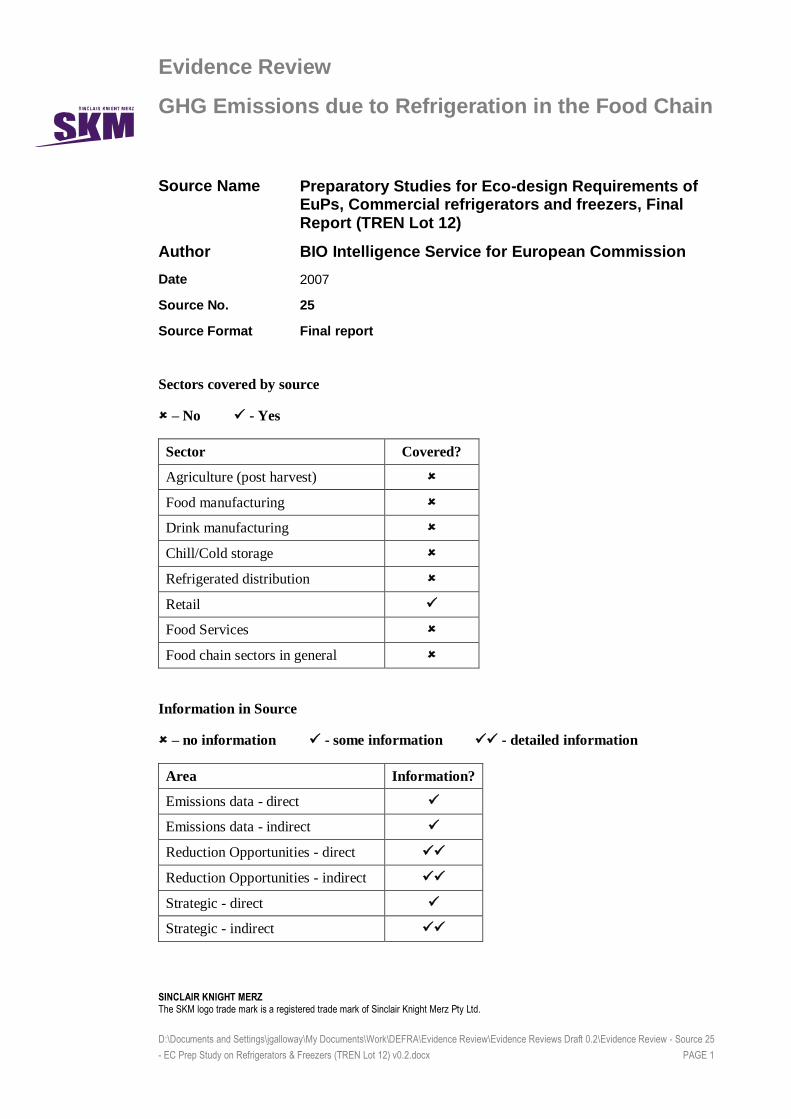
Evidence Review
GHG Emissions due to Refrigeration in the Food Chain
SINCLAIR KNIGHT MERZ
The SKM logo trade mark is a registered trade mark of Sinclair Knight Merz Pty Ltd.
D:\Documents and Settings\jgalloway\My Documents\Work\DEFRA\Evidence Review\Evidence Reviews Draft 0.2\Evidence Review - Source 25
- EC Prep Study on Refrigerators & Freezers (TREN Lot 12) v0.2.docx PAGE 1
Source Name Preparatory Studies for Eco-design Requirements of EuPs, Commercial refrigerators and freezers, Final Report (TREN Lot 12)
Author BIO Intelligence Service for European Commission
Date 2007
Source No. 25
Source Format Final report
Sectors covered by source
– No - Yes
Sector Covered?
Agriculture (post harvest)
Food manufacturing
Drink manufacturing
Chill/Cold storage
Refrigerated distribution
Retail
Food Services
Food chain sectors in general
Information in Source
– no information - some information - detailed information
Area Information?
Emissions data - direct
Emissions data - indirect
Reduction Opportunities - direct
Reduction Opportunities - indirect
Strategic - direct
Strategic - indirect

Evidence Review - GHG Emissions associated with Refrigeration in the Food Chain
26 October 2010
SINCLAIR KNIGHT MERZ The SKM logo trade mark is a registered trade mark of Sinclair Knight Merz Pty Ltd.
D:\Documents and Settings\jgalloway\My Documents\Work\DEFRA\Evidence Review\Evidence Reviews Draft 0.2\Evidence Review - Source 25
- EC Prep Study on Refrigerators & Freezers (TREN Lot 12) v0.2.docx PAGE 2
Following table completed with any information contained in the source under the relevant headings, include reference details e.g. page no., section no., table no. etc.
Direct GHG Emissions
During the use phase of plug in cabinets and vending machines, and according to literature the
annual leakage rates are low (≤ 1 % of the refrigerant charge) (page IV-82)
Leakage rates for different types of remote display cabinets given.
Information on split between direct and indirect emissions over life cycle for different product
types.
Indirect GHG Emissions
Energy usage given per unit in Section 4.3.3 and Section 5.1 e.g. Table 5-26
EU-wide base case energy usage data given in Section 8.
Refrigeration Activities in each stage of the Food Chain
This study covers only:
Refrigerated display cabinet (remote and plug in)
Vending machines
Strategic Thinking
In Section 8.2 a policy analysis provides an overview of the existing voluntary and mandatory
programs existing in Europe and overseas that have been developed to promote the energy
efficiency of commercial refrigeration equipment.
Reduction Opportunities for Direct Emissions
Alternative refrigerant are discussed in Section 6.5.
Various improvement options are analysed in Section 7.3
Reduction Opportunities for Indirect Emissions
The end-user behaviour has a significant impact on the electricity consumption of remote and plug in refrigerated display cabinets and cold vending machines. Improving simple operational
and maintenance practices can reduce energy consumption of 15 % or more (page III-17)
In conclusion, it has been estimated that 20 % plus saving in energy consumption can be achieved by good maintenance – remote refrigerated display cases (page IV-90)
Opportunities to reduce energy consumption at the product and component level are described in Sections 6.1 and 6.2. These opportunities appear to be similar to those considered by the
Evidence Review - GHG Emissions associated with Refrigeration in the Food Chain
26 October 2010
SINCLAIR KNIGHT MERZ The SKM logo trade mark is a registered trade mark of Sinclair Knight Merz Pty Ltd.
D:\Documents and Settings\jgalloway\My Documents\Work\DEFRA\Evidence Review\Evidence Reviews Draft 0.2\Evidence Review - Source 25
- EC Prep Study on Refrigerators & Freezers (TREN Lot 12) v0.2.docx PAGE 3
later retail sector Refrigeration Road Map by the CT.
State-of-the-art applied research for components is given in Section 6.4.
According to manufacturers of commercial refrigerators and freezers, the current vapour-compression technology is the most efficient one, and there is no relevant reason to change.
However, other refrigeration technologies have been applied and tested to commercial
refrigeration equipments. Some of them are described in Section 6.6.
Various improvement options are analysed in Section 7.1 and BST in Section 7.2 for each
product type. Per unit savings and cost given for each option.
Impact scenarios for years 2010, 2015 and 2020 are provided in Section 8.1 to quantify the improvement that can be achieved through the implementation of different improvement
options versus a business-as-usual scenario. EU-wide potential given for annual energy usage
and total GHG emissions over product life
Drivers and Barriers
Possible barriers to eco-design of refrigerated display cabinet (remote and plug in) and vending
machines given in Section 3.4.
Evidence Review
GHG Emissions due to Refrigeration in the Food Chain
SINCLAIR KNIGHT MERZ
The SKM logo trade mark is a registered trade mark of Sinclair Knight Merz Pty Ltd.
D:\Documents and Settings\jgalloway\My Documents\Work\DEFRA\Evidence Review\Evidence Reviews Draft 0.2\Evidence Review - Source 26
- FreightBestPractice Case Studies v0.2.docx PAGE 1
Source Name Cooling Cost and Boosting Efficiency through Eco-friendly Refrigeration Equipment
Author FreightBestPractice
Date 2010
Source No. 26
Source Format Case study report
Sectors covered by source
– No - Yes
Sector Covered?
Agriculture (post harvest)
Food manufacturing
Drink manufacturing
Chill/Cold storage
Refrigerated distribution
Retail
Food Services
Food chain sectors in general
Information in Source
– no information - some information - detailed information
Area Information?
Emissions data - direct
Emissions data - indirect
Reduction Opportunities - direct
Reduction Opportunities - indirect
Strategic - direct
Strategic - indirect
Following table completed with any information contained in the source under the relevant
headings, include reference details e.g. page no., section no., table no. etc.
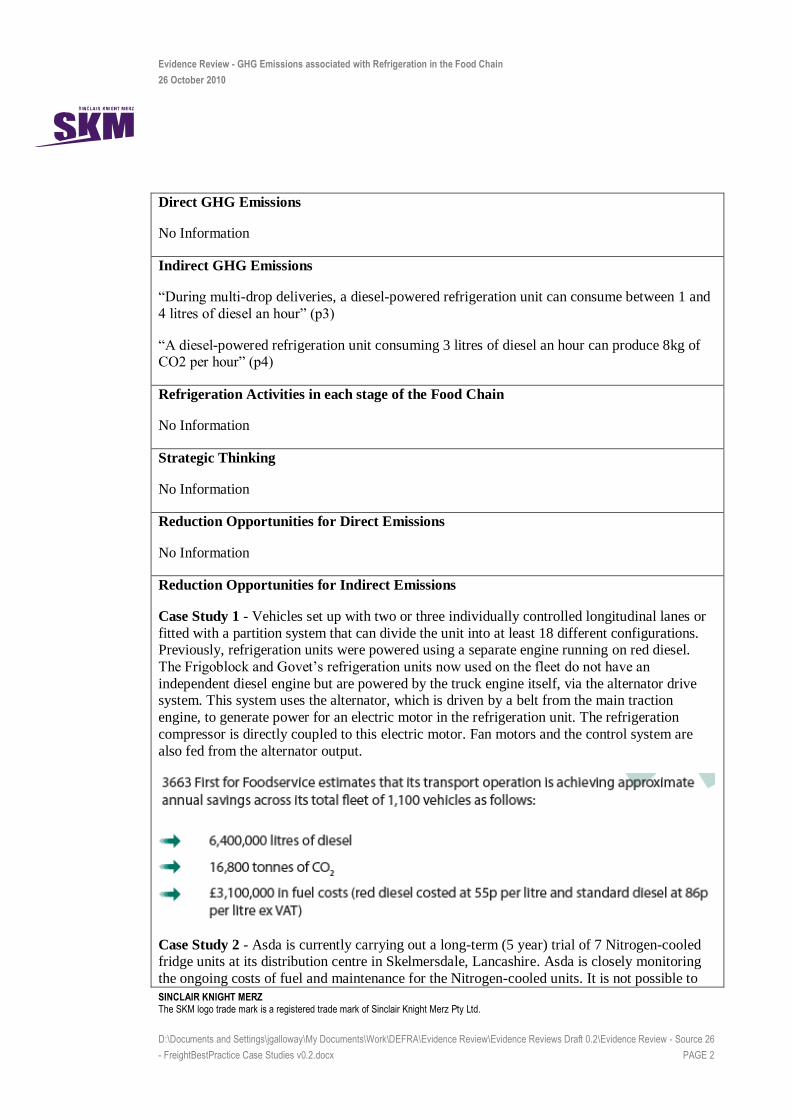
Evidence Review - GHG Emissions associated with Refrigeration in the Food Chain
26 October 2010
SINCLAIR KNIGHT MERZ The SKM logo trade mark is a registered trade mark of Sinclair Knight Merz Pty Ltd.
D:\Documents and Settings\jgalloway\My Documents\Work\DEFRA\Evidence Review\Evidence Reviews Draft 0.2\Evidence Review - Source 26
- FreightBestPractice Case Studies v0.2.docx PAGE 2
Direct GHG Emissions
No Information
Indirect GHG Emissions
“During multi-drop deliveries, a diesel-powered refrigeration unit can consume between 1 and
4 litres of diesel an hour” (p3)
“A diesel-powered refrigeration unit consuming 3 litres of diesel an hour can produce 8kg of CO2 per hour” (p4)
Refrigeration Activities in each stage of the Food Chain
No Information
Strategic Thinking
No Information
Reduction Opportunities for Direct Emissions
No Information
Reduction Opportunities for Indirect Emissions
Case Study 1 - Vehicles set up with two or three individually controlled longitudinal lanes or
fitted with a partition system that can divide the unit into at least 18 different configurations. Previously, refrigeration units were powered using a separate engine running on red diesel.
The Frigoblock and Govet’s refrigeration units now used on the fleet do not have an
independent diesel engine but are powered by the truck engine itself, via the alternator drive system. This system uses the alternator, which is driven by a belt from the main traction
engine, to generate power for an electric motor in the refrigeration unit. The refrigeration
compressor is directly coupled to this electric motor. Fan motors and the control system are
also fed from the alternator output.
Case Study 2 - Asda is currently carrying out a long-term (5 year) trial of 7 Nitrogen-cooled fridge units at its distribution centre in Skelmersdale, Lancashire. Asda is closely monitoring
the ongoing costs of fuel and maintenance for the Nitrogen-cooled units. It is not possible to
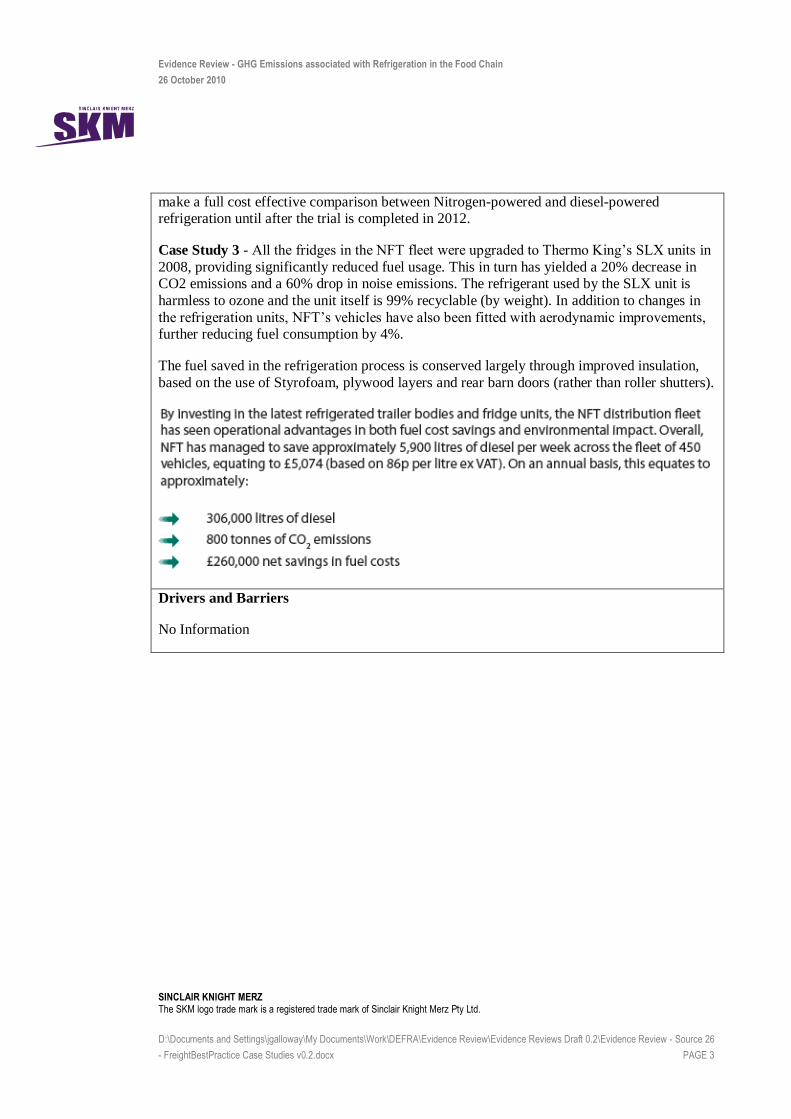
Evidence Review - GHG Emissions associated with Refrigeration in the Food Chain
26 October 2010
SINCLAIR KNIGHT MERZ The SKM logo trade mark is a registered trade mark of Sinclair Knight Merz Pty Ltd.
D:\Documents and Settings\jgalloway\My Documents\Work\DEFRA\Evidence Review\Evidence Reviews Draft 0.2\Evidence Review - Source 26
- FreightBestPractice Case Studies v0.2.docx PAGE 3
make a full cost effective comparison between Nitrogen-powered and diesel-powered refrigeration until after the trial is completed in 2012.
Case Study 3 - All the fridges in the NFT fleet were upgraded to Thermo King’s SLX units in
2008, providing significantly reduced fuel usage. This in turn has yielded a 20% decrease in CO2 emissions and a 60% drop in noise emissions. The refrigerant used by the SLX unit is
harmless to ozone and the unit itself is 99% recyclable (by weight). In addition to changes in
the refrigeration units, NFT’s vehicles have also been fitted with aerodynamic improvements, further reducing fuel consumption by 4%.
The fuel saved in the refrigeration process is conserved largely through improved insulation,
based on the use of Styrofoam, plywood layers and rear barn doors (rather than roller shutters).
Drivers and Barriers
No Information

Evidence Review
GHG Emissions due to Refrigeration in the Food Chain
SINCLAIR KNIGHT MERZ
The SKM logo trade mark is a registered trade mark of Sinclair Knight Merz Pty Ltd.
D:\Documents and Settings\jgalloway\My Documents\Work\DEFRA\Evidence Review\Evidence Reviews Draft 0.2\Evidence Review - Source 27
- Defra Policy Brief on Commercial Refrigeration Products v0.2.docx PAGE 1
Source Name Policy Brief: Improving the Energy Performance of Commercial Refrigeration Products
Author Defra
Date July 2008
Source No. 27
Source Format Policy brief report
Sectors covered by source
– No - Yes
Sector Covered?
Agriculture (post harvest)
Food manufacturing
Drink manufacturing
Chill/Cold storage
Refrigerated distribution
Retail
Food Services
Food chain sectors in general
Information in Source
– no information - some information - detailed information
Area Information?
Emissions data - direct
Emissions data - indirect
Reduction Opportunities - direct
Reduction Opportunities - indirect
Strategic - direct
Strategic - indirect
Following table completed with any information contained in the source under the relevant
headings, include reference details e.g. page no., section no., table no. etc.

Evidence Review - GHG Emissions associated with Refrigeration in the Food Chain
26 October 2010
SINCLAIR KNIGHT MERZ The SKM logo trade mark is a registered trade mark of Sinclair Knight Merz Pty Ltd.
D:\Documents and Settings\jgalloway\My Documents\Work\DEFRA\Evidence Review\Evidence Reviews Draft 0.2\Evidence Review - Source 27
- Defra Policy Brief on Commercial Refrigeration Products v0.2.docx PAGE 2
Direct GHG Emissions
No Information
Indirect GHG Emissions
Process chillers - 5.3 TWh (2.9 MtCO2) - 2006
Refrigerated (retail) display cabinets (integral systems) - 7.3 TWh (4.0 MtCO2)
Commercial (catering) service cabinets - 1.8 TWh (1.0 MtCO2) - 2006
Cellar cooling - 2.0 TWh (1.1 MtCO2) – 2006
Refrigerated vending machines - 0.2 TWh (0.1 MtCO2)
Refrigeration Activities in each stage of the Food Chain
Process chillers - Estimated 11,000 are in operation in the UK today
Refrigerated retail display cabinets (remote) - Estimated 208,000 remote Retail Display
Cabinets are installed
Refrigerated (retail) display cabinets (integral systems) - 586,000 cabinets are in working
operation covering both food retailing applications and food service applications.
Commercial (catering) service cabinets - estimated that 432,000 cabinets are in working operation in the UK (2006)
Cellar cooling - 148,000 systems are in operation in UK licensed premises (2006)
Refrigerated vending machines - 77,000 refrigerated machines are in use in the UK
Strategic Thinking
Policies, risks and measures discussed in Section 3.
EU and international policy actions, programmes and Initiatives discussed in Section 3.3
including Eco-Design of Energy-using Products (EuP), F-Gas Regulations, Voluntary product
standards and information provision, Eurovent Certification Programme, ASERCOM
UK policy actions, programmes and initiatives discussed in Section 3.4 including Public
procurement, Voluntary product standards, Enhanced Capital Allowance
Reduction Opportunities for Direct Emissions
No Information

Evidence Review - GHG Emissions associated with Refrigeration in the Food Chain
26 October 2010
SINCLAIR KNIGHT MERZ The SKM logo trade mark is a registered trade mark of Sinclair Knight Merz Pty Ltd.
D:\Documents and Settings\jgalloway\My Documents\Work\DEFRA\Evidence Review\Evidence Reviews Draft 0.2\Evidence Review - Source 27
- Defra Policy Brief on Commercial Refrigeration Products v0.2.docx PAGE 3
Reduction Opportunities for Indirect Emissions
The price premium for the best performing products is in the order of 10 to 20%, but they will
use 20 to 40% less energy. With lifetime energy use typically being 4 times the capital cost,
viewed in lifecycle-cost terms, the price premium for more efficient equipments will be more than offset by the energy cost savings
Drivers and Barriers
There are a number of factors that influence the choice of refrigerant for new equipment.
These include thermodynamic, chemical, safety and environmental properties, as well as
practical and market implications such as cost, global availability of the fluids and system
components, and technical familiarity of engineers and technicians. In particular, equipment producers tend to balance GWP and flammability/toxicity according to the intended product
market. Another important factor for manufacturers adopting new refrigerants is the potential
need for modifications to production processes, system design and component construction, all of which can impose significant costs on new refrigeration and air conditioning (RAC)
equipment. (page 14)