ex-vessel value and size composition of reported may
TRANSCRIPT

Gulf and Caribbean Research Gulf and Caribbean Research
Volume 7 Issue 3
January 1983
Ex-Vessel Value and Size Composition of Reported May - August Ex-Vessel Value and Size Composition of Reported May - August
Catches of Brown Shrimp and White Shrimp from 1960 to 1981 as Catches of Brown Shrimp and White Shrimp from 1960 to 1981 as
Related to the Texas Closure Related to the Texas Closure
Charles Wax Caillouet Jr. National Marine Fisheries Service, Galveston
Dennis Brian Koi National Marine Fisheries Service, Galveston
Follow this and additional works at: https://aquila.usm.edu/gcr
Part of the Marine Biology Commons
Recommended Citation Recommended Citation Caillouet, C. W. Jr. and D. B. Koi. 1983. Ex-Vessel Value and Size Composition of Reported May - August Catches of Brown Shrimp and White Shrimp from 1960 to 1981 as Related to the Texas Closure. Gulf Research Reports 7 (3): 187-203. Retrieved from https://aquila.usm.edu/gcr/vol7/iss3/1 DOI: https://doi.org/10.18785/grr.0703.01
This Article is brought to you for free and open access by The Aquila Digital Community. It has been accepted for inclusion in Gulf and Caribbean Research by an authorized editor of The Aquila Digital Community. For more information, please contact [email protected].

GulfResearch Reports, Vol. 7 , No. 3 , 187-203, 1983
EX-VESSEL VALUE AND SIZE COMPOSITION OF REPORTED MAY-AUGUST CATCHES OF BROWN SHRIMP AND WHITE SHRIMP FROM 1960 TO 1981 AS RELATED TO THE TEXAS CLOSURE'
CHARLES WAX CAILLOUET, Jr. AND DENNIS BRIAN KO1 National Marine Fisheries Service, Southeast Fisheries Center, Galveston Laboratory, Galveston, Texas 77550
ABSTRACT Indices were used to test for trends in ex-vessel price spread (value per shrimp by size category), size com- position, and ex-vessel value composition of the reported May-August catches (inshore and offshore combined) of brown shrimp (Penaeus azrecus) and white shrimp (P. setzferus) from the Texas coast, the Mississippi River to Texas, and Pcnsacola to the Mississippi River, from 1960 to 1981. Levels of reported May-August catch and ex-vessel value of the catch also were examined for the same period. Statistical tests were conducted to determine if 1981 was an outlier as compared to other years, in the context of impacts of closure of the fishery conservation zone (FCZ) off Texas to shrimping from May 22 to July 15, 1981, a management measure referred to as the Texas Closure.
INTRODUCTION
The territorial sea of the State of Texas and the adjacent fishery conservation zone (FCZ) were closed to shrimping for brown shrimp (Penaeus aztecus) from May 22 to July 15, 198 1. This management action was dubbed the Texas Clos- ure by the Gulf of Mexico Fishery Management Council (GMFMC 1980). The territorial sea extends from the coastal baseline to 9 nautical miles off Texas (Figure I). The FCZ, under federal jurisdiction, extends from the outer limit of Texas' territorial sea to 200 miles from shore. The State of Texas eliminated minimum size restrictions on brown shrimp caught in waters open to shrimping before and after the closure, and allowed daytime fishing for white shrimp to continue in waters up to 4 fm in depth within the territorial sea during the closure. The GMFMC (1980) expected that the Texas Closure would lead to an increase in yield of brown shrimp in the FCZ through additional growth and survival and from abatement of the practice of discarding undersized brown shrimp.
For years, there has been considerable controversy regard- ing the optimum size at which shrimp should be harvested (GMFMC 1980). During their life cycle, brown shrimp and white shrimp enter inshore waters (landward of barrier is- lands) as postlarvae, and emigrate a few months later to off- shore waters (seaward of barrier islands) as subadults. For that reason, the shrimp caught inshore generally are smaller than those caught offshore. Thus, to a great extent, the size composition of the catch is dependent on where and when the shrimp are caught during each annual cycle. This choice is complicated by the fact that ecological requirements of brown shrimp and white shrimp differ from one another (Christmas and Etzold 1977, GMFMC 1980), and the peaks in abundance of the two species occur out of phase with one
'Contribution No. R2-34G from the Southeast Fisheries Center, Galveston Laboratory, National Marine Fisheries Service, NOAA.
Manuscript received Sept. 27, 1982; accepted Dec. 3, 1982.
. 26'11 1 GULF N LAT OF MEXICO
9 2 " 5 3 0 W LONG
Figure 1. Boundaries of statistical areas 10-21, the Texas territorial sea and the fishery conservation zone off Texas (based on informa- tion from GMFMC, 1980).
another. The size at which shrimp are harvested is all the more important, because the ex-vessel price per pound of shrimp increases with their size (Neal 1967, Griffin et al. 1974, Griffin and Nichols 1976, Griffin et al. 1976).
The 1981 Texas Closure provided a unique opportunity for exaggerating the contrast between a management strategy that protects small brown shrimp and allows them to grow to larger sizes before harvest and one that allows small as well as large brown shrimp to be harvested in large quantities. Using yield-per-recruit analysis and a simulation model of shrimp fishing, Nichols (1982) predicted that the brown shrimp yield off Texas in May-August 1981 would be 11.7 million pounds greater than that expected had there been no Texas Closure. Poffenberger (1982) showed that the Texas Closure caused an increase in brown shrimp landings off the Texas coast, which in turn caused a decrease in ex- vessel price per pound. Despite the decrease in price, Pof- fenberger (1982) concluded that there was an increase in gross revenue by about 21.5 million dollars from the brown
187

188 CAlLLOUET A N D KO1
shrimp fishery in May-August 1981 over what would have been expected had there been no Texas Closure. Klima et al. (1982) stated that recruitment of brown shrimp in Texas bays and size composition of the offshore stock in 1981 were similar to those in previous years of good production. They also stated that the brown shrimp catch per unit effort was higher in 1981 than would have been the case without the Texas Closure. They concluded that the Texas Closure had a positive impact on relative abundance and production of brown shrimp off Texas. Using fishery-independent data, Matthews (1 982) reported good catch rates of brown shrimp collected off the coast of Texas during the Texas Closure.
Caillouet and Koi (1981) investigated trends in ex-vessel price spread among shrimp size categories, in size composi- tion, and in ex-vessel value composition of the May-August catches (inshore and offshore combined) of brown shrimp and white shrimp from the Texas, Louisiana, Mississippi, and Alabama coasts, for the years 1960 to 1978. They antic- ipated use of their analytical approach in assessing future impacts of the Texas Closure. When they chose May-August as the time interval for their analysis, the specific dates for the Texas Closure had not yet been set. They wanted to make sure that the chosen interval would encompass the future closure interval so as t o assess immediate impacts of the Texas Closure, including those immediately before and in anticipation of the closure, and those during and imme- diately after the closure.
While almost half of the May-August period was closed to shrimping for brown shrimp off the Texas coast in 1981, it was open to shrimping in other areas, both inshore and offshore. Caillouet and Koi (1981) based their analyses on inshore and offshore catch data combined. The stocks of shrimp include inshore and offshore components. The pos- sibility that inshore fishing intensity might increase in areas open to shrimping during the Texas Closure (GMFMC 1980), with consequent effects on the combined inshore and off- shore catch, provided further justification for combining inshore and offshore catches in the analysis. Furthermore, because the yield from inshore areas represents a significant portion of the total yield, we thought that it should not be ignored in assessing impacts of the Texas Closure. In,other words, we did not want to assume that impacts of the Texas Closure were confined only to the offshore fishery.
Two purposes of this paper are to update the analyses of Caillouet and Koi (1981) by addingdata from 1979 to 1981, and to compare the observed 198 1 indices of ex-vessel price spread, size composition, and ex-vessel value composition of the May-August catches of brown shrimp and white shrimp with those expected for 1981 based on average levels or trends from 1960 to 1981. For the latter purpose, we applied linear trend analyses, employing simple linear regres- sion, to the time seriesof indices over the years 1960-1981. Our analyses were designed to test the null hypothesis that
the 1981 indices were not significant2 “outliers” in the 1960-1981 data series.
Our application of simple linear regression analysis, to detect trends and to test hypotheses concerning indices of ex-vessel price spread, size composition, and ex-vessel value composition of shrimp catches, requires some explanation to guide the reader in interpretation of the results. Simple linear regression analysis tests only for linear trends. If there were strongly curvilinear trends in the indices, linear regres- sion analysis alone would not detect them, and this could also lead to a conclusion that there were no significant (linear) trends. However, inspection of our scatter plots (e.g., Figure 9) of the data points by the reader can be helpful in this regard. When our analysis detected no significant linear trend, a mean index was calculated to represent the time series of points.
As shown in our scatter plots of the indices, two types of 95 percent confidence bands were given. The narrower confidence bands (Figure 9) represented the uncertainty in estimating or predicting the population mean index, depicted by either a regression liAe or a horizontal line through the data points (for cases where there was no significant linear trend; e.g., Figure 10). The wider confidence bands (Figure 9) represented the uncertainty in estimating or predicting an individual index level for a particular year. In general, 5 per- cent of the points would be expected to fall outside such confidence bands, due to chance alone. For additional ex- planation, the reader is referred to Snedecor and Cochran (1967, pp. 153-157).
A third purpose of this paper is to determine whether the three indices were correlated with each other or with the weight of the May-August catches, using the entire time series of indices from 1960 to 1981. We made comparisons among such correlations between species and among coastal areas, in order to distinguish the effects of the Texas Closure from other effects such as year-to-year variations in recruit- ment, fishing effort, or both.
METHODS
Description of data
Summations of the May-August catches (inshore and off- shore combined) for brown shrimp and white shrimp and their ex-vessel value were compiled from data files available from the National Marine Fisheries Service (NMFS), South- east Fisheries Center (SEFC), Technical and Information Management Services (TIMS). The data for 1979,1980, and 1981 were those available from the TIMS in February 1982. The reader is cautioned that the 1980 and 1981 data may have undergone slight changes by the TIMS since then, based upon identification of minor errors and upon minor additions
2Refers throughout this paper to the 95% level of confidence.
VALUE AND SIZE O F SHRIMP AS RELATED TO TEXAS CLOSURE 189
t o the data files. Historically, such updating of the files has not been of major consequence.
The characteristics of shrimp catch data were described previously (Caillouet and Koi 1981). Data for 1960 to 1978 were obtained from Caillouet and Koi (1981). The weight of the reported May-August catches (inshore and offshore com- bined) was expressed in pounds (heads off) and the ex-vessel value in dollars (unadjusted for effects of inflation) for each year, coastal area, species, and size category (< 15, 15-20, 21-25, 26-30, 31-40, 41-50, 51-67, and > 68 count), and “pieces,” representing parts of shrimp tails that could not be assigned to a size category.
Separate analyses were conducted for both species and three coastal areas (Figure 1), which were distinguished as follows: 1) Texas coast (statistical areas 18-21 combined); 2) Mississippi River to Texas (statistical areas 13-17 com- bined), representing that part of the Louisiana coast west of the Mississippi River; and 3) Pensacola to the Mississippi River (statistical areas 10-1 2 combined), representing that part of the Louisiana coast east of the Mississippi River, the Mississippi coast, the Alabama coast, and a small part of the upper west coast of Florida (catches from Pensacola Bay are excluded from this area, as they are allocated to the adjacent Apalachicola area by the TIMS). Note that almost half of statistical area 17 wasincluded in the area that was closed to shrimping from May 22 to July 15, 1981 (Figure 1). There- fore, for the years 1960 to 1980, the May-August catch sta- tistics for the Mississippi River to Texas coastal area represent a somewhat larger zone open to shrimping than was the case in 198 1, as a result of the Texas Closure.
ANALYTICAL RESULTS
The analytical methods followed those of Caillouet and Koi (1 98 1).
May-August catches
Table 1 provides background concerning both the magni- tude and stability of the percentage of the May-August catch (all size categories as well as “pieces” combined) taken in- shore vs. offshore, for each species and coastal area from 1960 to 1981. For brown shrimp, the percentage of the May- August catch taken inshore was lowest for the Texas coast (lo%), intermediate for Pensacola to the Mississippi River (SO%), and highest for the Mississippi River to Texas (54%). This elucidates the emphasis on offshore fishing in Texas and on both inshore and offshore fishing in the other two coastal areas. However, the inshore proportion of the May-August brown shrimp catch has been increasing on the Texas coast and in the Pensacola to the Mississippi River area, while it has been decreasing in the Mississippi River t o Texas area. For white shrimp, the percentage of the May-August catch taken inshore was highest for Pensacola to the Mississippi River (62%), intermediate for the Texas coast (54%), and lowest for the Mississippi River to Texas (32%). This percentage showed no significant trend for the Texas coast and Missis- sippi River to Texas, but there was a significant downward
TABLE 1.
Percentages of the May-August catches (inshore and offshore combined) of brown shrimp and white shrimp taken inshore,
and percentages of the calendar year annual catches (inshore and offshore combined) of brown shrimp
and white shrimp taken during May-August, for the Texas Coast, the Mississippi River to Texas,
and Pensacola to the Mississippi River, during 1960 to 1981.
Percentage Percentage May-August Annual Catch Catch Taken Taken in
Inshore May-August
Species Coastal Area Meana Range Meana Range
Brown Shrimp Texas Coast lob 0‘-29 58 47-73 Mississippi River to Texas 54d 35-68 81 74-90 Pensacola to Mississippi River 50e 34-76 84 75-93
White Shrimp Texas Coast 54 30-78 24 16-34 Mississippi River to Texas 32 11-47 19 8-25 Pensacola to Mississippi River 62f 29-94 13 5-23
Averaged over all years from 1960 to 1981. There was a significant upward trend in percentage from 1960 to 1981: Y = -46.2 + 0.8X,where Y = percentage, and X = last two digits (60-81) of each year (1960-1981). The coefficient of de- termination, r’, was 0.55. Rounded to zero, but the percentage was 0.04. There was a significant downward trend in percentage from 1960 to 1981: Y = 109.0 - 0.8X. See footnote b for definitions of Y and X. The coefficient of determination, r2 , was 0.26. There was a significant downward trend in percentage from 1960 to 1981: Y = -41.6 + 1.3X. See footnote b for definitions of Y and X. The coefficient of determination, r’, was 0.61. There was a significant downward trend in percentage from 1960 to 1981 : Y = 206.2 - 2.0X. See footnote b for definitions of Y and X. The coefficient of dctermination, r’, was 0.50.
trend in this percentage for Pensacola to the Mississippi River. The percentage of the calendar year annual catch of
brown shrimp represented by the May-August catch of brown shrimp is shown in Table 1, for each coastal area. Likewise, a similarly calculated percentage is shown for white shrimp. There were no significant trends in this per- centage for either species in any of the three coastal areas from 1960 to 1981. For Pensacola to the Mississippi River, the May-August brown shrimp catch represented 84% of the annual catch, on the average. For the Mississippi River to Texas it averaged 8 1%, and for the Texas coast 58%. Thus, a substantial percentage of the annual brown shrimp catch was taken in May-August within each coastal area. The lower percentage for the Texas coast reflects the emphasis on off- shore fishing with its consequent protracted harvest. For

190 C A l L L o U E T A N D KO1
white shrimp, the average percentage of the annual catch taken in May-August was highest for the Texas coast (24%), intermediate for the Mississippi River to Texas (19%), and lowest for Pensacola to the Mississippi River (1 3%). These low percentages reflected the later harvest of white shrimp, compared to brown shrimp, determined by differences in phasing of life cycle events in these two species.
Within each coastal area, the May-August catch of brown shrimp greatly exceeded that of white shrimp in all years from 1960 to 1981 (Figures 2--7). In all years, the May- August brown shrimp catches from the Mississippi River to
’- TEXAS COAST
-
6-
- v)
0 H 4- J H
-
20
A
i I
t’ /
DOLLARS ,& f P
J ‘i
POUNDS
1976 1960 I960 1964 I966 I972 1962 1966 1970 I974 I976 1982
YEAR
Figure 2. Weight (millions of pounds, heads off) and ex-vessel value (millions of dollars) of reported May-August catches (inshore and offshore combined) of brown shrimp from the Texas coast (statistical areas 18-21 combined), 1960-1981.
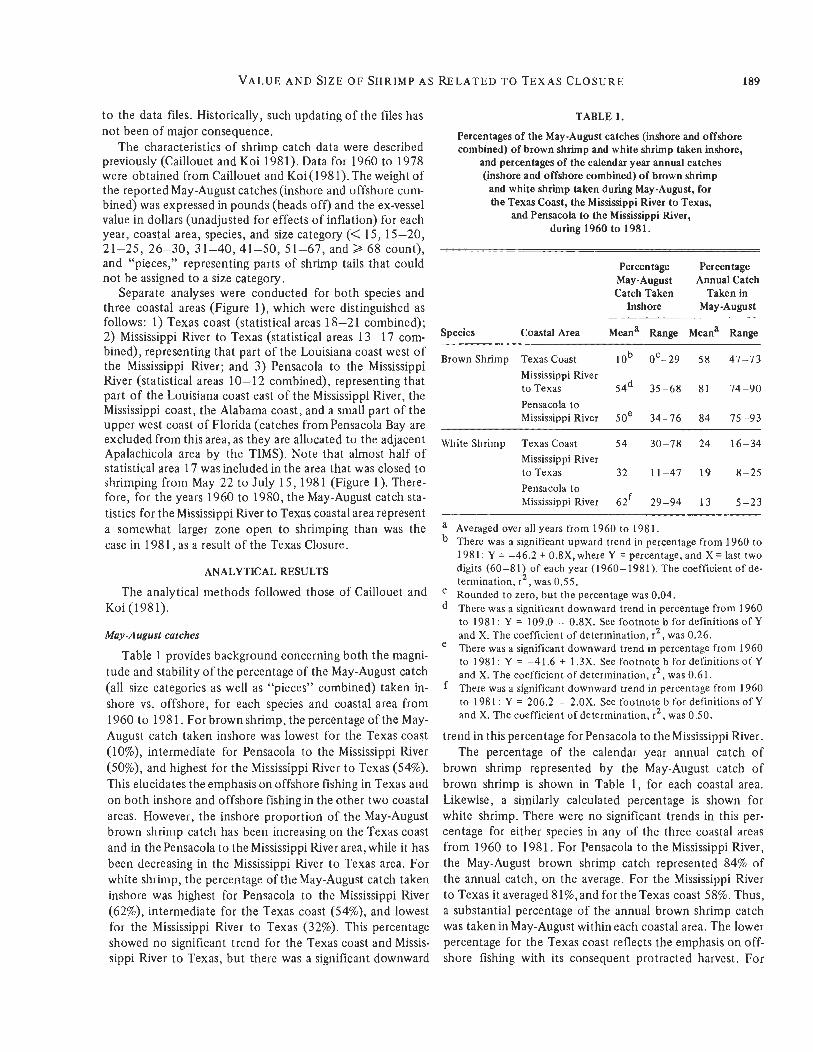
Texas exceeded those from Pensacola to the Mississippi River, and in most years, including 1981, they exceeded those from the Texas coast. TheMay-August catch of brown shrimp from the Texas coast was higher in 1981 than in any previous year except 1967, and the ex-vessel value of this catch was at an unprecedented high for the Texas coast (Figure 2). The May-August brown shrimp catches from the other two coastal areas in 1981 were higher than in 1980, but did not exceed those of all previous years in the 1960- 1980 series (Figures 4 and 6).
Despite the fact that the May-August brown shrimp catch from the Texas coast (29.6 million lb., Figure 2) in 1981 was lower than that from the Mississippi River to Texas (38.4 million lb., Figure 4), it had a greater ex-vessel value (66.3 million dollars) than that from the Mississippi River to Texas (56.8 million dollars). In 198 1, the ex-vessel value (19.3 million dollars) of the May-August brown shrimp catch from Pensacola to the Mississippi River (10.4 million lb.) was much lower than for the other two areas, as was the case in all previous years.
The May-August catch of white shrimp from the Texas coast (1.7 million lb., Figure 3) in 1981 was lower than that
1960 1964 I968 I972 1976 I980
1 Q62 1866 1970 1974 1978 1982 YEAR
Figure 3. Weight (millions of pounds, heads off) and ex-vessel value (millions of dollars) of reported May-August catches (inshore and offshore combined) of white shrimp from the Texas coast (statistical areas 18-21 combined), 1960-1981.
MISSISSIPPI R I V E R TO TEXAS BROWN SHRIMP
20 ;I POUNDS
1960 1964 I968 1972 1976 1980
1962 I966 I970 1974 1978 1982 YEAR
Figure 4. Weight (millions of pounds, heads off) and ex-vessel value (millions of dollars) of reported May-August catches (inshore and offshore combined) of brown shrimp from the Mississippi River to Texas (statistical areas 13-17 combined), 1960-1981.
from the Mississippi River to Texas (7.8 million lb., Figure 5 ) , and the ex-vessel value ofthis catch (5.6 million dollars) was dramatically lower than that from the Mississippi River to Texas (26.6 million dollars). The May-August white shrimp catches from the Mississippi River to Texas and from Pensa- cola to the Mississippi River in 1981 were somewhat higher than in 1980, but the opposite was true for the Texas coast. In all years, the May-August white shrimp catch from the Mississippi River to Texas exceeded that from the Texas coast, and both exceeded that from Pensacola to the Missis- sippi River. The ex-vessel value of the May-August catch of white shrimp from the Mississippi River to Texas in 1981 was at an all time high. While the ex-vessel value of the
V A L U E A N D SIZE O F SHRIMP A S RELATED TO TEXAS CLOSURE 191
MISSISSIPPI RIVER TO TEXAS UHITE SHRIMP
20
t I I I
I
1960 1964 1968 I972 I976
0
I962 I966 1970 I974 1978 I 982 YEAR
Figure 5 . Weight (millions of pounds, heads off) and ex-vessel value (millions of dollars of reported May-August catches (inshore and offshore combined) of white shrimp from the Mississippi River to Texas (statistical areas 13-17 combined), 1960-1981.
PENSACOLA TO THE MISSISSIPPI RIVER BROWN SHRIMP
t
1960 1964 I968 I972 I976 I980
1962 I 968 I970 I074 1978 1982 YEAR
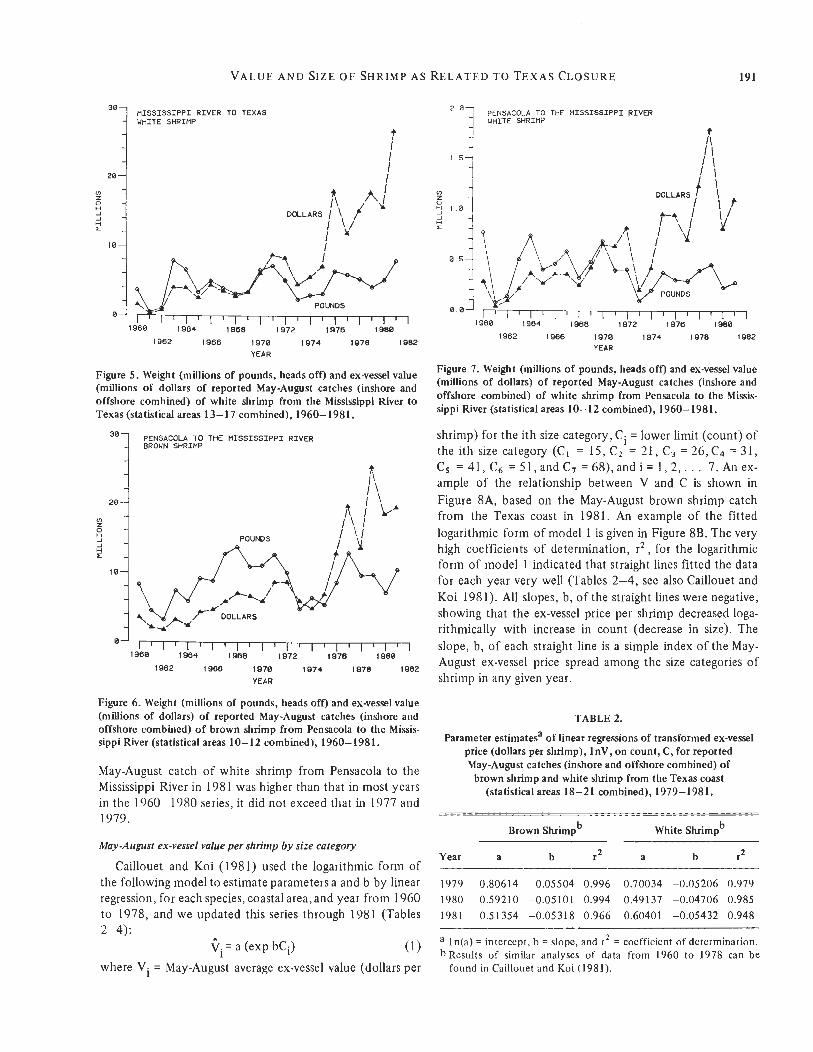
Figure 6. Weight (millions of pounds, heads off) and ex-vessel value (millions of dollars) of reported May-August catches (inshore and offshore combined) of brown shrimp from Pensacola to the Missis- sippi River (statistical areas 10-12 combined), 1960-1981.
May-August catch of white shrimp from Pensacola to the Mississippi River in 1981 was higher than that in most years in the 1960-1980 series, it did not exceed that in 1977 and 1979.
May -August ex-vessel value per shrimp by size category
Caillouet and Koi (1981) used the logarithmic form of the following model to estimate parameters a and b by linear regression, for each species, coastal area, and year from 1960 to 1978, and we updated this series through 1981 (Tables 2-4):
where Vi = May-August average ex-vessel value (dollars per c. 1 = a (exp bCi) (1)
PENSACOLA TO THE MISSISSIPPI RIVER UHITE SHRIMP
I: I 1 1 5
'7 PENSACOLA TO THE MISSISSIPPI RIVER UHITE SHRIMP
I: I 1 1 5 -
0
J H
7 I a -
a .5 -
a . O - l l I , I I I I I I I I I I I
1960 1964 I968 I972 1976 1980
i
8 . 0 I 7 , I , , I I , I I I I I I I I I I I I I I 1960 1964 I968 I972 1976 1980
1978 1982 1962 1966 1970 I974 YEAR
Figure 7. Weight (millions of pounds, heads off) and ex-vessel value (millions of dollars) of reported May-August catches (inshore and offshore combined) of white shrimp from Pensacola to the Missis- sippi River (statistical areas 10-12 combined), 1960-1981.
shrimp) for the ith size category, Ci = lower limit (count) of the ith size category (C, = 15, C2 = 21, C 3 = 26, C4 = 31, C5 = 41, C6 = 5 1 , and C7 = 68), and i = 1 , 2 , . . . 7. An ex- ample of the relationship between V and C is shown in Figure 8A, based on the May-August brown shrimp catch from the Texas coast in 1981. An example of the fitted logarithmic form of model 1 is given in Figure 8B. The very high coefficients of determination, r2 , for the logarithmic form of model 1 indicated that straight lines fitted the data for each year very well (Tables 2-4, see also Caillouet and Koi 1981). All slopes, b, of the straight lines were negative, showing that the ex-vessel price per shrimp decreased loga- rithmically with increase in count (decrease in size). The slope, b, of each straight line is a simple index of the May- August ex-vessel price spread among the size categories of shrimp in any given year.
TABLE 2.
Parameter estimatesa of linear regressions of transformed ex-vessel price (dollars per shrimp), InV, on count, C, for reported May-August catches (inshore and offshore combined) of
brown shrimp and white shrimp from the Texas coast (statistical areas 18-21 combined), 1979-1981.
Brown Shrimpb White Shrimpb
Year a b IZ a b 12
1979 0.80614 -0.05504 0.996 0.70034 -0.05206 0.979 1980 0.59210 -0.05101 0.994 0.49137 -0.04706 0.985 1981 0.51354 -0.05318 0.966 0.60401 -0.05432 0.948
a ln(a) = intercept, b = slope, and r2 = coefficient of determination. b Results of similar analyses of data from 1960 to 1978 can be
found in Caillouet and Koi (1981).

192 C A l L L O U E T A N D KO1
TABLE 3.
Parameter estimatesa of linear regressions of transformed ex-vessel price (dollars per shrimp), lnV, on count, C, for reported May-
August catches (inshore and offshore combined) of brown shrimp and white shrimp from the Mississippi River to Texas (statistical areas 13-17 combined), 1979-1981.
Brown Shrimp b White Shrimpb
Year a h r2 a b 12
1979 0.77312 -0.05398 0.995 0.81 161 -0.05504 0.990 1980 0.56006 -0.05004 0.995 0.56161 -0.05018 0.992 1981 0.57987 -0.05529 0.976 0.73555 0.05975 0.976
a ln(a) = intercept, b = slope, and r2 = coefficient of determination. b Results of similar analyses of data from 1960 to 1978 can be
found in Caillouet and Koi (1981).
TABLE 4.
Parameter estimatesa of linear regressions of transformed ex-vessel value (dollars per shrimp), lnV, on count, C, for reported May-
August catches (inshore and offshore combined) of brown shrimp and white shrimp from Pensacola to the Mississippi
River (statistical areas 10-12 combined), 1979-1981.
Brown Shrimpb White Shrimpb
Year a b r2 a b I2
1979 0.73353 -0.05047 0.989 0.73061 -0.05045 0.980 1980 0.53505 -0.04767 0.987 0.52388 -0.04739 0.985 1981 0.56535 -0.05258 0.972 0.62225 -0.05482 0.944
a ln(a) = intercept, h = slope, and r2 = coefficient of determination. bResults of similar analyses of data from 1960 to 1978 can be
found in Caillouet and Koi (1981).
We excluded the < 15 size category from model 1 so as to be consistent with previous work, and because the line representing the logarithmic form of model 1 is not straight in the region of < 15 count (Caillouet and Koi 1981). The < 15 category represented < 3% of the weight of the May- August catches of brown shrimp in any of the three coastal areas in any given year. In 1981, the < 15 category repre- sented 0.2% of the May-August catches of brown shrimp from the Texas coast, 0.2% from the Mississippi River to Texas, and 0.1% from Pensacola to the Mississippi River. In any given year, the < 15 category represented as high as 23% of the May-August white shrimp catches from the Texas coast (15.6% in 1981), 15% from the Mississippi River to Texas (5.1% in 1981), and 28% from Pensacola to the Mis- sissippi River (3.6% in 1981). The category “pieces” also was excluded from model 1, because it represents parts of shrimp tails which could not be assigned to a size category.
To determine whether there were significant trends in the index of ex-vessel price spread among size categories, we calculated the linear regression of b on the last two digits
(60-81) of each year from 1960 to 1981, for both species and all three coastal areas (Table 5 ) . There were significant downward trends in b for brown shrimp in all three coastal areas (Figures 9, 1 1, and 13) and for white shrimp from the Mississippi River to Texas (Figure 12) and Pensacola to the Mississippi River (Figure 14), but there was no significant trend in b for white shrimp from the Texas coast (Figure 10).
The downward trends indicated that the May-August ex- vessel price spread among size categories increased during the period from 1960 to 1981. Because there was no signifi- cant trend in b for white shrimp from the Texas coast, we calculated the mean of the indices for the years 1960-1981 and plotted the mean as a horizontal solid line through the points in Figure 10. No data point for 1972 was included in calculating the regression trend for white shrimp from Pensacola to the Mississippi River, because no catch was re- ported for the Z 68 count category in 1972 (Caillouet and Koi 1981).
Within each coastal area, the ex-vessel price spread index b for brown shrimp in May-August 1981 fell within the 95% confidence bands for individual levels of b (Figures 9, 11, and 13), indicating that there was no significant departure in 198 1 from the expected increase in ex-vessel price spread
T E X A S COAST BROWN SHRIMP 1981
a.35 1
V I I
I I a 68 7 --1r-7-- I
15 21 26 31 41 51 C
Figure 8. Relationship between the ex-vessel price (dollars per shrimp), V, and count, C, for the reported May-August catch (inshore and offshore combined) of brown shrimp from the Texas coast (sta- tistical areas 18-21 combined) in 1982 (graph A). In graph B, the line was fitted by linear regression (see Table 2).

VALUE AND SIZE O F SHRIMP AS RELATED T O TEXAS CLOSURE 193
TABLE 5 .
Results of tests for trendsa in ex-vessel price spread index b, in size composition index d, and in ex-vessel value composition index h, for reported May-August catches (inshore and offshore combined) of brown shrimp and white shrimp from the Texas coast,
the Mississippi River t o Texas, and Pensacola to the Mississippi River, during 1960 to 1981 (indices b, d and h are defined in the text).
For Ex-vessel For Size For Ex-vessel Species Coastal Area Price Spread Index b Composition Index d Value Composition Index h
Brown Shrimp
Brown Shrimp
Brown Shrimp
White Shrimp
White Shrimp
White Shrimp
Texas Coast
Mississippi River t o Texas
Pensacola to Mississippi River
Texas Coast
Mississippi River to Texas
Pcnsacola to Mississippi River
Trend" Intercept Trend Coefficient of Determination Sum of Squares' Trend Intercept Trend Coefficient of Determination Sum of Squares Trend Intercept Trend Coefficient of Determination Sum of Squares
Trend Intercept Trend Coefficient of Determination Sum of Squares Trend Intercept Trend Coefficient of Determination Sum of Squares Trend Intercept Trend Coefficient of Determination Sum of Squares
-0.0003b -0.03 32
0.222 0.000290
-0.0005h -0.0187
0.367 0.000376
-0.0006b -0.0091
0.486 0.000319
-0.0002 -0.0349
0.092 0.000499
-0.0006b -0.0124
0.361 0.000488
-0.0005h -0.0143
0.296 0.0005 14
0.0024b --0.2 1 8 3
0.641 0.002776 0.0003b
-0.0273
0.334 0.000120 0.0008b
-0.0798
0.396 0.000904
0.0007 -0.1015
0.061 0.007437 0.0009b
-0.1076
0.215 0.002834
-0.0003 -0.0163
0.025 0.002274
0.0023b -0.2353
0.624 0.0029 32 0.0002
-0.0281
0.065 0.0003 17 0.0006b
-0.071 1
0.221 0.001067
0.0007 -0.1 137
0.035 0.01 1162 0.0004
-0.0879
0.043 0.003594
-0.0009 0.0144
0.168 0.003297
a b'or each speciesand coastal area, the trends are represented by the slopes of the linear regressions of indices b, d, and h, respectively, on X, where X represents the last two digits (60-81) of each year, 1960-1981. The indices h , d , and h are shown in Tables 2-4, 6-8, and 9-1 1, respectively, for the years 1979-1981, and in Caillouet and Koi (1981) for the years 1960-1978. Data for 1972 were excluded from regressions for white shrimp from Pensacola to the Mississippi River (see Caillouet and Koi 1981).
b Trend (slope) was significantly different from zero at the 95% level of confidence. c Sum of squares of deviations from linear regression.
for brown shrimp in any of the three coastal areas. The same was true for the May-August 1981 ex-vessel price spread index for white shrimp from the Mississippi k v e r to Texas and from Pensacola to the Mississippi River (Figures 12 and 14). The May-August 1981 ex-vessel price spread index for white shrimp from the Texas coast fell within the 95% confidence limits for individual levels of b (Figure lo), indicating that there was no significant departure in 1981 from the expected price spread based on the mean price spread index. Thus, based upon the inherent variations and trends in ex-vessel price spread, the May-August price spread
index was not a significant outlier in the 1960-1981 time series.
May-August cumulative catch by size category
Caillouet and Koi (1981) used the logarithmic form of the following model to estimate parameters c and d by linear regression for each species, coastal area, and year from 1960 to 1978, and we updated this through 1981 (Tables 6-8):
I
Pi C(CXP dCi)
where Pi = cumulative weight (pounds, heads off) of the

194
-0.0400-
-
CAlLLOUET A N D KO1
. . -. . 1- 1.
I--
-.- -.__ -e-' .-.
TEXAS COAST BKOUN SHRIMP
-0 04001 -0 03007
0 --_ -- . --. '. O
--. 1. -1-
--. .--.
MISSISSIPPI RIVER T O TEXAS BROWN SHRIMP
0450!
-0,0500-$
b -0.0550
-I -0 a600
1 -0.0650
4 -0 0760 , - T - ~ - ~ ~ F T 77-1
1960 I 9 6 4 1968 1972 1976 1980
1962 1966 1970 1974 1978 1982 1962 1966 1970 I974 1978 1982
Figure 9. Trend (solid line) in the ex-vessel price spread index b (open circles) for reported May-August catches (inshore and offshore combined) of brown shrimp from the Texas coast (statistical areas 18-21 combined), 1960-1981 (data from Tables 2 and 5, and Cail- louet and Koi 1981). The 95% confidence bands are shown for the trend line by short dashes and for individual values of b by long dashes. b by long dashes.
Figure 11. Trend (solid line) in the ex-vessel price spread index b (open circles) for reported May-August catches (inshore and offshore combined) of brown shrimp from the Mississippi River to Texas (sta- tistical areas 13-17 combined), 1960-1981 (data from Tables 3 and 5, and Caillouet and Koi 1981). The 95% confidence bands are shown for the trend line by short dashes and for individual values of
MISSISSIPPI RIVER TO TEXAS TEXAS COAST UHITE SHRIMP UHITF SHRIMP
-0 0400
Figure 10. Mean (solid line) ex-vessel price spread index b (open circles) for reported May-August catches (inshore and offshore com- bined) of white shrimp from the Texas coast (statistical areas 18- 21 combined), 1960-1981 (data from Table 2, and Caillouet and Koi 1981). The 95% confidence limits are shown for the mean by short dashes and for individual values of b by long dashes.
Figure 12. Trend (solid line) in the ex-vessel price spread index b (open circles) for reported May-August catches (inshore and offshore combined) of white shrimp from the Mississippi River to Texas (sta- tistical areas 13-17 combined), 1960-1981 (data from Tables 3 and 5, and Caillouet and Koi 1981). The 95% confidence bands are shown for the trend line by short dashes and for individual values of b by long dashes.
May-August catch in the ith size category. The catches in each size category were cumulated starting with the size category of smallest shrimp (highest count, 2 68) and con- tinuing toward the size category of largest shrimp (lowest count, 15-20). An example of the relationship between P and C is shown in Figure 15A, for brown shrimp from the Texas coast in 1981. An example of the fitted logarithmic form of model 2 is shown in Figure 15B. The coefficients of determination for the straight lines representing each year
were very high (Tables 6-8, see also Caillouet and Koi 1981). All slopes, d, were negative, which reflected the con- struction of model 2 by cumulating catches from small- shrimp to large-shrimp size categories (Caillouet and Koi 1981). The slope, d, of each straight line is a simple index of the size composition of the May-August catch in any given year.
In each year, the levels of d for brown shrimp were lowest for the Texas coast, intermediate for Pensacola to
V A L U E A N D SIZE O F SHRIMP A S RELATED TO TEXAS CLOSURE
-0.0400-
b -0 0500-
-0 0600- -
195
PENSACOLA TO THE M I S S I S S I P P I R IVER BROWN SHRIMP
-0 03003
- 0 . 0 7 0 0 A
1962 1966 1970 1974 1978 1982
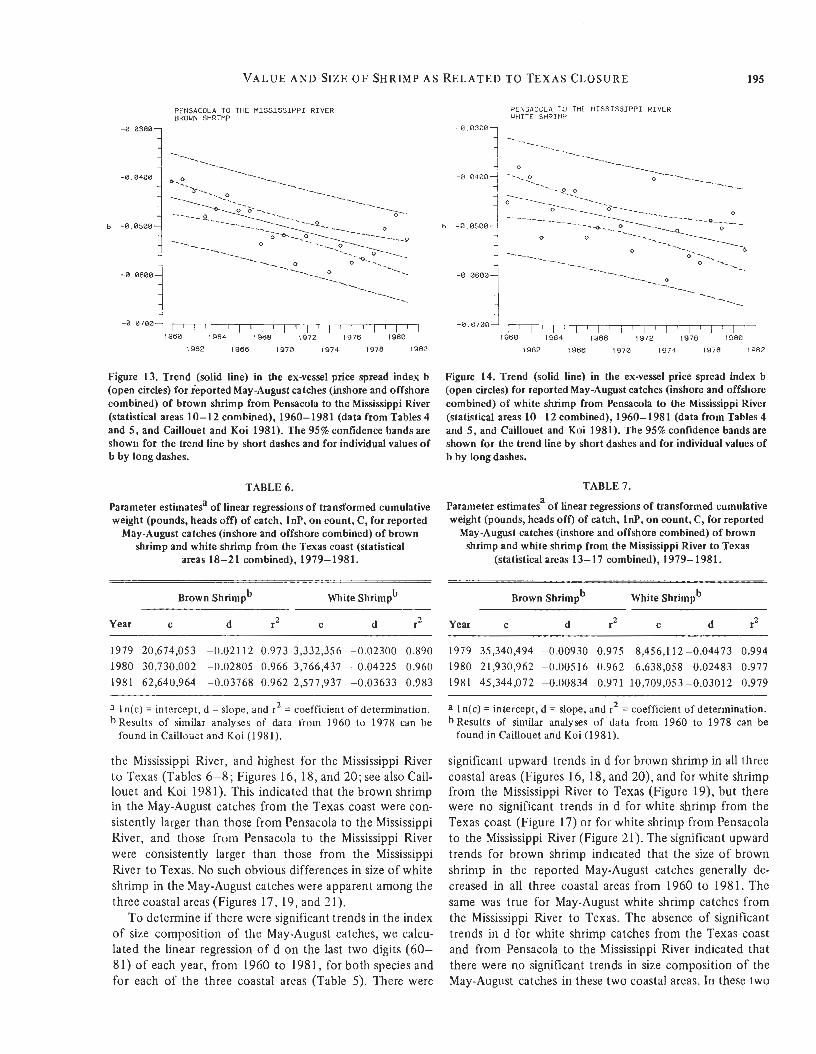
Figure 13. Trend (solid line) in the ex-vessel price spread index b (open circles) for reported May-August catches (inshore and offshore combined) of brown shrimp from Pensacola to the Mississippi River (statistical areas 10-1 2 combined), 1960-1981 (data from Tables 4 and 5, and Caillouet and Koi 1981). The 95% confidence bands are shown for the trend line by short dashes and for individual values of b by long dashes.
TABLE 6.
Parameter estimatesa of linear regressions of transformed cumulative weight (pounds, heads off) of catch, lnP, on count, C, for reported
May-August catches (inshore and offshore combined) of brown shrimp and white shrimp from the Texas coast (statistical
areas 18-21 combined), 1979-1981.
Brown Shrimpb m i t e Shrimpb
Year C d r2 C d r2
1979 20,674,053 -0.02112 0.973 3,332,356 -0.02300 0.890 1980 30,730,002 -0.02805 0.966 3,766,437 -0.04225 0.960 1981 62,640,964 -0.03768 0.962 2,577,937 -0.03633 0.983
a 1 n(c) = intercept, d = slope, and r2 = coefficient of determination. bResults of similar analyses of data from 1960 to 1978 can be
found in Caillouet and Koi (1981).
the Mississippi River, and highest for the Mississippi River to Texas (Tables 6-8; Figures 16, 18, and 20; see also Cail- louet and Koi 1981). This indicated that the brown shrimp in the May-August catches from the Texas coast were con- sistently larger than those from Pensacola to the Mississippi River, and those from Pensacola to the Mississippi River were consistently larger than those from the Mississippi River to Texas. No such obvious differences in size of white shrimp in the May-August catches were apparent among the three coastal areas (Figures 17, 19, and 21).
To determine if there were significant trends in the index of size composition of the May-August catches, we calcu- lated the linear regression of d on the last two digits (60- 81) of each year, from 1960 to 1981, for both species and for each of the three coastal areas (Table 5). There were
-0 0300
-a 0 4 0 0 1
b -0 0500 1 ! -0 0600
PENSACOLA TO THE M I S S I S S I P P I R IVER WHITE SHRIMP
I , , , I , I , , , , , 1960 1964 1968 1972 1976 1980
1962 I966 1970 1974 1978 1982
Figure 14. Trend (solid line) in the ex-vessel price spread index b (open circles) for reported May-August catches (inshore and offshore combined) of white shrimp from Pensacola to the Mississippi River (statistical areas 10-12 combined), 1960-1981 (data from Tables 4 and 5, and Caillouet and Koi 1981). The 95% confidence bands are shown for the trend line by short dashes and for individual values of b by long dashes.
TABLE 7.
Parameter estimatesa of linear regressions of transformed cumulative weight (pounds, heads off) of catch, lnP, on count, C, for reported
May-August catches (inshore and offshore combined) of brown shrimp and white shrimp from the Mississippi River to Texas
(statistical areas 13-17 combined), 1979-1981.
White Shrimpb b Brown Shrimp
Year C d r2 C d r2
1979 35,340,494 -0.00930 0.975 8,456,112 -0.04473 0.994 1980 21,930,962 -0.00516 0.962 6,638,058 -0.02483 0.977 1981 45,344,072 -0.00834 0.971 10,709,053 -0.03012 0.979
a ln(c) = intercept, d = slope, and r2 = coefficient of determination. bResults of similar analyses of data from 1960 to 1978 can be
found in Caillouet and Koi (1981).
significant upward trends in d for brown shrimp in all three coastal areas (Figures 16, 18, and 20), and for white shrimp from the Mississippi River to Texas (Figure 19), but there were no significant trends in d for white shrimp from the Texas coast (Figure 17) or for white shrimp from Pensacola to the Mississippi River (Figure 21). The significant upward trends for brown shrimp indicated that the size of brown shrimp in the reported May-August catches generally de- creased in all three coastal areas from 1960 to 1981. The same was true for May-August white shrimp catches from the Mississippi River to Texas. The absence of significant trends in d for white shrimp catches from the Texas coast and from Pensacola to the Mississippi River indicated that there were no significant trends in size composition of the May-August catches in these two coastal areas. In these two
196 CAlLLOUET A N D KO1
TABLE 8.
Parameter estimatesa of linear regressions of transformed cumulative weight (pounds, heads off) of catch, lnP, on count, C, for reported
May-August catches (inshore and offshore combined) of brown shrimp and white shrimp from Pensacola to the Mississippi
River (statistical areas 10-12 combined), 1979-1981.
Brown Shrimpb White Shrimpb
Year C d r2 C d r2
TEXAS COAST BROUN SHRIMP
1979 13,586,810 -0.01427 0.849 707,215 -0.03047 0.936 1980 11,481,757 -0.02219 0.956 224,118 0.02600 0.926 1981 14,635,344 -0.01490 0.879 369,793 -0.03877 0.969
a ln(c) = intercept, d = slope, and r2 = coefficient of determination. bResults of similar analyses of data from 1960 to 1978 can be
found in Caillouet and Koi (1981).
TEXAS COAST BROUN SHRIMP 1981
----*---. I *--.
I L e 25
20
201 I 9
I
I I I
r I I l l 1 . . . . 0 15 21 26 31 41 51 68
C
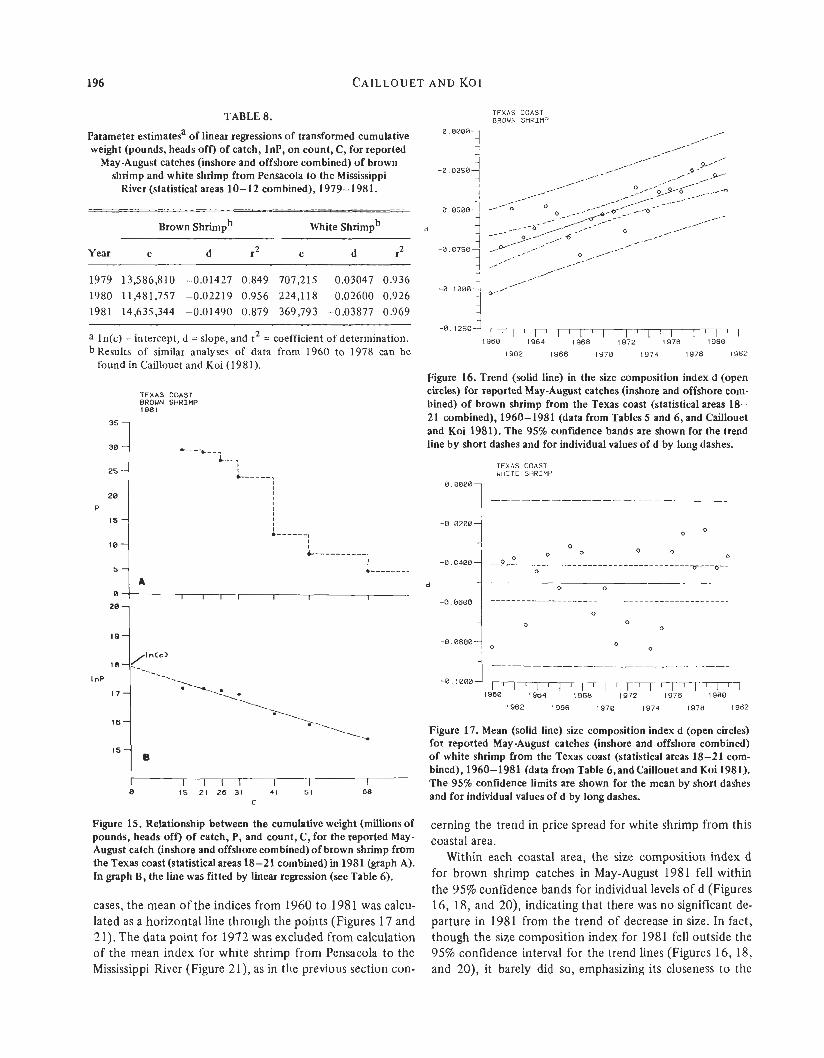
Figure 15. Relationship between the cumulative weight (millions of pounds, heads off) of catch, P, and count, C, for the reported May- August catch (inshore and offshore combined) of brown shrimp from the Texas coast (statisticalareas 18-21 combined) in 1981 (graph A). In graph B, the line was fitted by linear regression (see Table 6).
cases, the mean ofthe indices from 1960 to 1981 was calcu- lated as a horizontal line through the points (Figures 17 and 21). The data point for 1972 was excluded from calculation of the mean index for white shrimp from Pensacola to the Mississippi River (Figure 21), as in the previous section con-
0 0000
-0 0250
3 -0 0500 1
-0 0750
- [ I t I ~ I I I ~ I ' I ' I ' I ' I ' 1 1960 1964 1966 1972 1976 1980
1962 1966 1978 1974 1976 1982
-0 1000
-0 1250
Figure 16. Trend (solid line) in the size composition index d (open circles) for reported May-August catches (inshore and offshore com- bined) of brown shrimp from the Texas coast (statistical areas 18- 21 combined), 1960-1981 (data from Tables 5 and 6, and Caillouet and Koi 1981). The 95% confidence bands are shown for the trend line by short dashes and for individual values of d by long dashes.
TFXAS COAST WHITE SHRIMP
00001
02001 0 0
1960 1964 1966: 1972 1976 1980
1962 1966 1970 1974 1978 1962
Figure 17. Mean (solid line) size composition index d (open circles) foI reported May-August catches (inshore and offshore combined) of white shrimp from the Texas coast (statistical areas 18-21 com- bined), 1960-1981 (data from Table 6,andCaillouet and Koi 1981). The 95% confidence limits are shown for the mean by short dashes and for individual values of d by long dashes.
cerning the trend in price spread for white shrimp from this coastal area.
Within each coastal area, the size composition index d for brown shrimp catches in May-August 1981 fell within the 95% confidence bands for individual levels of d (Figures 16, 18, and 20), indicating that there was no significant de- parture in 1981 from the trend of decrease in size. In fact, though the size composition index for 1981 fell outside the 95% confidence interval for the trend lines (Figures 16, 18, and 20), it barely did so, emphasizing its closeness to the

V A L U E A N D SIZE O F SHRIMP AS RELATED TO TEXAS CLOSURE
-0.0150- -
197
/-. 0 //-- .--- ,.----- -.
MlSSISSIPPI RIVER TO TEXAS BROWN SHRIMP
/ /-.
~ ~ l ~ l ~ l ~ l ~ l ~ l ~ l ~ l ~ l ~ l 1960 1964 1968 1972 1976 1980
-0.0200 3 1962 1966 1970 1974 1978 1982
Figure 18. Trend (solid line) in the size composition index d (open circles) for reported May-August catches (inshore and offshore com- bined) of brown shrimp from the Mississippi River to Texas (statis- ticalareas 13-17combined), 1960-1981 (data from Tables 5 and 7, and Caillouet and Koi 1981). The 95% confidence bands are shown for the trend line by short dashes and for individual values of d by long dashes.
PENSACOLA TO THE MISSISSIPPI RIVER BROWN SHRIMP
0 E l00
0 .0000
1960 1964 1968 1972 1976 1980
~ , , 1 , 1 , 1 1 1 , 1 , 1 , 1 1 , 1 1 , 1 , 1 1962 1966 1970 1974 1978 1982
-0 0100
d -0 8200
-0 0380
-0 0400
-0 0506
Figure 20. Trend (solid line) in the sue composition index d (open circles) for reported May-August catches (inshore and offshore com- bined) of brown shrimp from Pensacola to the Mississippi River (sta- tistical areas 10-12 combined), 1960-1981 (data from Tables 5 and 8, andcaillouet andKoi 1981).The 95% confidence bands are shown for the trend line by short dashes and for individual values of d by long dashes.
cont inued t rend of decreasing size. F rom 1 9 7 9 t o 1981, t h e index moved in a direction indicating in- creasing size of b rown shr imp, b u t such variation was well within expec ted levels o f variability in t h e index. The size composition index for white shrimp catches from the Mississippi fiver to Texas in May-August 1981 showed no significant departure from the trend of decrease in size (Figure 19). The size composition index for white
MISSISSIPPI RIVER TO TEXAS WHITE SHRIMP
0 0 0 0 0 7
_,-' _- - _+--
_/--
/-- _/-- 0 .+-
0 +--
-a 0200
I962 1966 1970 I974 1978 1982
Figure 19. Trend (solid line) in the size composition index d (open circles) for reported May-August catches (inshore and offshore com- bined) of white shrimp from the Mississippi River to Texas (statis- tical areas 13-17 combined),1960-1981 (data from Tables 5 and 7, and Caillouet and Koi 1981). The 95% confidence bands are shown for the trend line by short dashes and for individual values of d by long dashes.
PENSACOLA TO THE MISSISSIPPI RIVER WHITE SHRIMP
I 0 0 0
0 0 0
1 0
I I 1'171'171 -0 0800 i , I I I I l
1960 1964 1966 1972 1976 1960
1962 1966 1970 1974 1978 1982
Figure 21. Mean (solid line) size composition index d (open circles) for reported May-August catches (inshore and offshore combined) of white shrimp from Pensacola to the Mississippi River (statistical areas 10-12 combined), 1960-1981 (data from Table 8, and Caillouet and Koi 1981). The 95% confidence limits are shown for the mean by short dashes and for individual values of d by long dashes.
shr imp catches from t h e o the r t w o coastal areas in May-August 1 9 8 1 fell within the 95% confidence l imits for individual levels of d (Figures 1 7 and 21) , showing tha t there was n o significant depar ture in 1981 from the expected size composition. Thus the May- August 1981 size composition index was not a significant outlier in the 1960 to 1981 time series for either species in any of the three coastal areas.
198 CAILLOUET A N D KO1
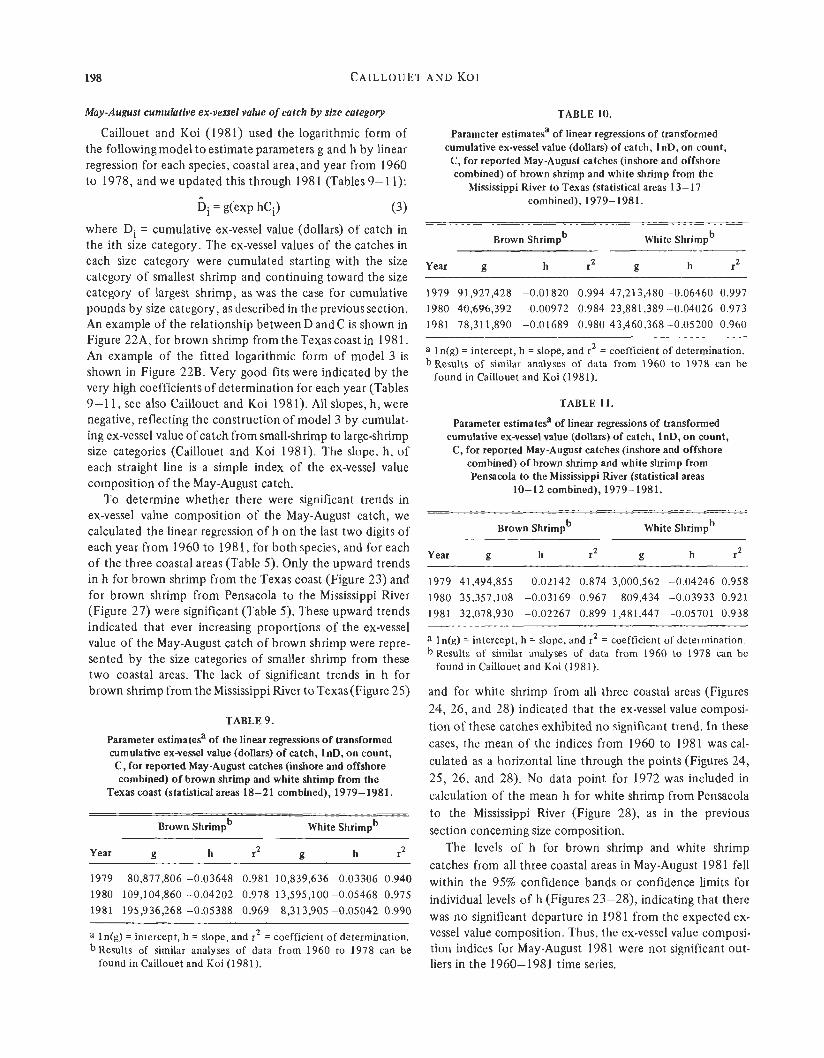
May-August cumulative ex-vessel value of catch by size category
Caillouet and Koi (1981) used the logarithmic form of the followingmodel t o estimate parameters g and h by linear regression for each species, coastal area, and year from 1960 to 1978, and we updated this through 1981 (Tables 9-1 1):
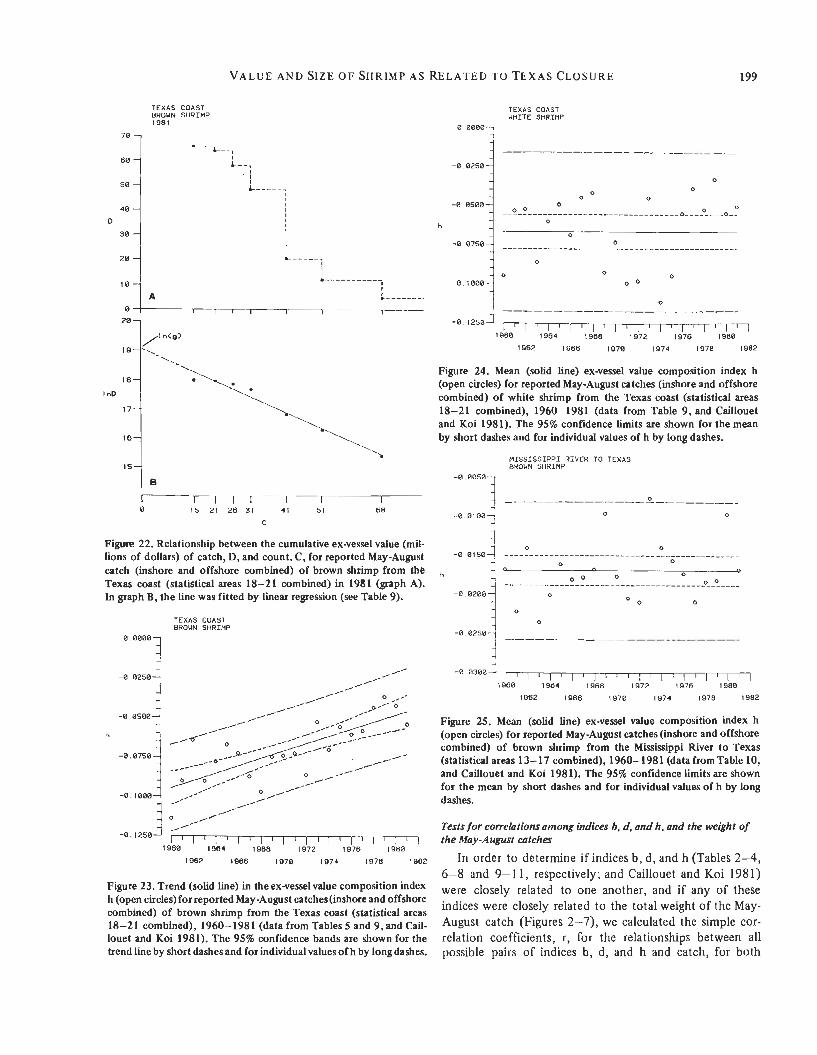
Di = g(exp hCi) (3 ) where Di = cumulative ex-vessel value (dollars) of catch in the ith size category. The ex-vessel values of the catches in each size category were cumulated starting with the size category of smallest shrimp and continuing toward the size category of largest shrimp, as was the case for cumulative pounds by size category, as described in the previous section. An example of the relationship between D and C is shown in Figure 22A, for brown shrimp from the Texas coast in 1981. An example of the fitted logarithmic form of model 3 is shown in Figure 22B. Very good fits were indicated by the very high coefficients of determination for each year (Tables 9-1 1, see also Caillouet and Koi 1981). All slopes, h, were negative, reflecting the construction of model 3 by cumulat- ing ex-vessel value of catch from small-shrimp to large-shrimp size categories (Caillouet and Koi 1981). The slope, h, of each straight line is a simple index of the ex-vessel value composition of the May-August catch.
To determine whether there were significant trends in ex-vessel value composition of the May-August catch, we calculated the linear regression of h on the last two digits of each year from 1960 to 1981, for both species, and for each of the three coastal areas (Table 5 ) . Only the upward trends in h for brown shrimp from the Texas coast (Figure 23) and for brown shrimp from Pensacola to the Mississippi River (Figure 27) were significant (Table 5 ) . These upward trends indicated that ever increasing proportions of the ex-vessel value of the May-August catch of brown shrimp were repre- sented by the size categories of smaller shrimp from these two coastal areas. The lack of significant trends in h for brown shrimp from the Mississippi River to Texas(Figure 25)
TABLE 9.
Parameter estimatesa of the linear regressions of transformed cumulative ex-vessel value (dollars) of catch, InD, on count, C, for reported May-August catches (inshore and offshore combined) of brown shrimp and white shrimp from the
Texas coast (statistical areas 18-21 combined), 1979-1981.
White Shrimpb b Brown Shrimp
Year g h r2 8 h 12
1979 80,877,806 -0.03648 0.981 10,839,636 -0.03306 0.940 1980 109,104,860 -0.04202 0.978 13,595,100 -0.05468 0.975 1981 195,936,268 -0.05388 0.969 8,313,905 -0.05042 0.990
a ln(g) = intercept, h = slope, and I’ = coefficient of determination. bResults of similar analyses of data from 1960 to 1978 can be
found in Caillouet and Koi (1 98 1).
TABLE IO.
Parameter estimatesa of linear regressions of transformed cumulative ex-vessel value (dollars) of catch, 1 nD, on count,
C, for reported May-August catches (inshore and offshore combined) of brown shrimp and white shrimp from the
Mississippi River to Texas (statistical areas 13- 17 combined), 1979- 1981.
-
Brown Shrimp b White Shrimpb
Year g h r2 g h r2
1979 91,927,428 -0.01820 0.994 47,213,480 -0.06460 0.997 1980 40,696,392 0.00972 0.984 23,881,389 -0.04026 0.973 1981 78,311,890 -0.01689 0.980 43,460,368 -0.05200 0.960
a ln(g) = intercept, h = slope, and r2 = coefficient of determination. bResults of similar analyses of data from 1960 to 1978 can be
found in Caillouet and Koi (1981).
TABLE 11.
Parameter estimatesa of linear regressions of transformed cumulative ex-vessel value (dollars) of catch, lnD, on count, C, for reported May-August catches (inshore and offshore
combined) of brown shrimp and white shrimp from Pensacola to the Mississippi River (statistical areas
10-12 combined), 1979-1981.
Brown Shrimp b White Shrimpb
Year g h 12 g h I2
1979 41,494,855 0.02142 0.874 3,000,562 -0.04246 0.958 1980 35,357,108 -0.03169 0.967 809,434 -0.03933 0.921 1981 32,078,930 -0.02267 0.899 1,481,447 -0.05701 0.938
a In(g) = intercept, h = slope, and r2 = coefficient of determination. bResults of similar analyses of data from 1960 to 1978 can be
found in Caillouet and Koi (1981).
and for white shrimp from all three coastal areas (Figures 24, 26, and 28) indicated that the ex-vessel value composi- tion of these catches exhibited no significant trend. In these cases, the mean of the indices from 1960 to 1981 was cal- culated as a horizontal line through the points (Figures 24, 25, 26, and 28). No data point for 1972 was included in calculation of the mean h for white shrimp from Pensacola to the Mississippi River (Figure 28), as in the previous section concerning size composition.
The levels of h for brown shrimp and white shrimp catches from all three coastal areas in May-August 1981 fell within the 95% confidence bands or confidence limits for individual levels of h (Figures 23-28), indicating that there was no significant departure in 1981 from the expected ex- vessel value composition. Thus, the ex-vessel value composi- tion indices for May-August 1981 were not significant out- liers in the 1960-1981 time series.
V A L U E A N D SIZE OF SHRIMP A S REL.4TED T O TEX.%S CLOSURE
TABLE 12.
Simple correlation coefficients, r, for the relationahips among indicesa b, d and h and catchb, for May-August catches (inshore and offshore combined) OP brown shrimp and white shrimp from the Texas Coast (statistical areas 18-21
combined), the Missisrippi River to Texas (statistical areas 13-17 combined), and Pensacoh to the Mississippi River (statistical areas 10-12 combined), 1960-1981 (indices b, d and h are defined in the text).
Texas Coast Mississippi River to T e m Penvcola lo the Mississippi River
Brown Shrimp White Shrimp Brown Shrimp Mite Shrimp Brown Shrimp White Shrimp' Coastal AreaISpecies b d h catch b d h catch b d h catch b d h catch b d h catch b d h catch
Texas Coast Brown b 1.000 -0.314
1.000 Shrimp
catch
White b
Shrimp * catch
Maissippi River t o Texas
Brown Shrimp ,"
catch
White Shrimp h
catch Pensacola to the Mississippi River
Brown Shrimp ,"
catch
white shrimp"
catch
-0.187 -0.167 0.604d 0.133 0.221 -0.47gd 0.897d -0.233 0.987d 0.0118 -0.096 0.421 0.355 0.182 -0.347 0.S07d 1.000 -0.007 -0.028 0.440d 0.389 0.117 -0.253 0.514d
1.000 -0.210 0.083 0.074 -0.109 -0.249 0.073 1.000 0.285 0.42dd -0.52gd 0.593d -0.168
i.ono 11.980d -0 143 n.249 -0.063 1.000 -0.270 0.315 -0.110
1.000 -0.402 0.252
1.000 -0.331 1.000
0.230 -0.56Sd 0.295 0.4741 0.360 0.430d
-0.084 0.6166 0.072 -0.333 0.066 0.319 0.042 0.291 0.143 0.060
0.188 -0.S87d 0.834d 0.176 1.000 -0.161
1.000
0.755' -0.186 -0.227 0.096 -0.164 0.127 -0.4?8a 0.178
0.706d -0.217 0.247 0.030 0.291 0.030
-0.241 4 , 0 4 1
0.866d -0.351 -0.224 0.276
0.210 0.166 -0.633' 0.347
1.900 -fl.4S6d 1.000
0.065 -0.450d -0.067 0.184 -0.011 0.115
0.031 0.370 -0.041 -0.302
0.089 -0.106 0.118 -0.107
-0.164 0.202
-0.049 -O.49Sd 0.131 -0.126 0.196 -0.393 0.147 0.55Id
-0.172 -O.iRld 0.936d 0.002
1.000 1.000 -0.155
0.868' -0.333 -0.169 -0.498' 0.777d 0.249 -0.45fid 0.54Zd 0.44Id -0.062 -0.201 -0.332 -0.374 0.52Sd 0.43ad -0.126 -0.133 -0.295 -0.241 0.130 0.073 0.S16d -0.500d 0.056
0 5 6 j 4 -0.168 -0.083 -0.294 0.690d -0 . IOi 0.143 0.106 0.158 0.098 0.202 0.094 0.219 0.029 0.087 0.093 0.256 0.090
-0.444d 0.463d 0 . 4 Z d 0.126 -0.248 -0.216
0.95gd -0.435d -0.236 -0.467d 0.86Sd 0.269 -0.489d 0.J93d 0,479' 0.023 -0.178 -0.114 -0.011 0.348 0.337 -0.242 0.236 0.050 -0.622d 0.351 0.220 0.685' -0.611' -0.160
-0,416 0.138 0.023 0.083 -0.443d 0.256
-0.424d 0.022 -0.093 0.46Dd -0.577d -0.312
1.000 -0.56Sd -0.365 -0.442d 0.809d 0.304 1.000 0.96Sd 0.169 -0.239 -0.165
1.000 0.091 -0.078 -0.068 1.000 -0.S06d -0.058
1.000 0.020 1.000
0.805d -0.238 - 0 . 0 6 ~ -0.47nd n.qs4d 0.027
-0.129 -0.065 -0.122 -0.057 -0.181 0.360
0.447d 0.052 -0.46Zd -0.406 -0.415 -0.412 -0.117 0.119
0.080 -0.141 0 115 -0.289 0.129 -0.252
-0.247 0.219
0.S3Id 0.009 -0.225 -0.33l
0.073 -0.303 -0.373 0.004
0.047 -0.375 0.238 -0.354
-0.45gd O.43Bd
0.563G 0.142 -0.282 -0.196 -0.122 -0.153 -0.175 0.353
0.314 -0.105 0.940d 0.029 1.000 0.061
1.000
0.318 - 0 . w
a The indices b, d, and h are shown m Tables 2-4.6-8, and 9-ll,respectively, for the years 1979-1981, and in Caillouet and Koi (1981)
b Total MapAugust catch, including "pieces," from Figures 2-7. 5 Data for 1972 were excluded from all correlation analyses involving indices h, d, and h for white shrimp tram Pensacoh to the Miaqissippi
d The correlation coefficient was significantly different from zero at the 95% level of confidence.
COI the years 1960-1978.
River (see Caillouet and Kai 1981).
VALUE A N D SIZE O F SHRIMP A S RELATED TO TEXAS CLOSURE
70 - 68 -
50 -
40 - D
30 -
20 -
10 -
0 20 -
I nD 18-
17-
16-
15-
199
1981
- _ _ - &--I
I L--,
I I I
c-----..
I I I
L-----, I I I *-----------
I I I
A * - - - - - - -, I I I I I I I
/I 19-..,.
'. '.
\ \
\
8
7- I I I
Figure 22. Relationship between the cumulative ex-vessel value (mil- lions of dollars) of catch, D, and count, C, for reported May-August catch (inshore and offshore combined) of brown shrimp from the Texas coast (statistical areas 18-21 combined) in 1981 (graph A). In graph B, the line was fitted by linear regression (see Table 9).
TEXAS COAST BROWN SHRIMP
E 0000
1962 1966 1970 1974 1978 1982
Figure 23. Trend (solid line) in the ex-vessel value composition index h (open circles)for reported May-August catches(inshore and offshore combined) of brown shrimp from the Texas coast (statistical areas 18-21 combined), 1960-1981 (data from Tables 5 and 9, and Cail- louet and Koi 1981). The 95% confidence bands are shown for the trend line by short dashesand for individual values of h by long dashes.
Figure 24. Mean (solid line) ex-vessel value composition index h (open circles) for reported May-August catches (inshore and offshore combined) of white shrimp from the Texas coast (statistical areas 18-21 combined), 1960-1981 (data from Table 9, and Caillouet and Koi 1981). The 95% confidence limits are shown for the mean by short dashes and for individual values of h by long dashes.
M I S S I S S I P P I R IVER TO TEXAS BROWN bHHlMP
---9 _____--- -E . 0850
-E 0180 0 0
-0E3EE--1 I , I , I I I , I I , , 1960 1964 1968 1972 1976 1980
1962 1966 I970 1974 1978 1982
Figure 25. Mean (solid line) ex-vessel value composition index h (open circles) for reported May-August catches (inshore and offshore combined) of brown shrimp from the Mississippi River to Texas (statistical areas 13-17 combined), 1960-1981 (data from Table 10, and Caillouet and Koi 1981). The 95% confidence limits are shown for the mean by short dashes and for individual values of h by long dashes.
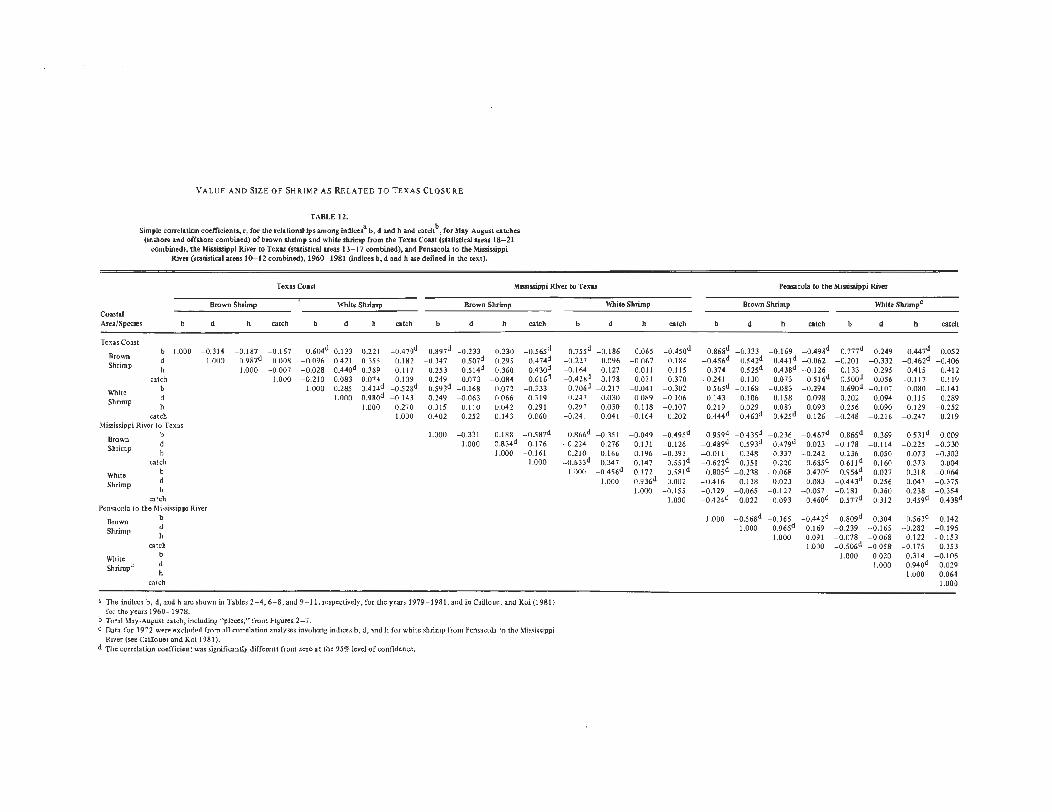
Tests for correlations among indices b, d, and h. and the weight of the May-August catches
In order to determine if indices b, d, and h (Tables 2-4, 6-8 and 9-1 1, respectively; and Caillouet and Koi 1981) were closely related to one another, and if any of these indices were closely related to the total weight of the May- August catch (Figures 2-7), we calculated the simple cor- relation coefficients, r, for the relationshps between all possible pairs of indices b, d, and h and catch, for both

200 C A I L L O U E T A N D KO1
M I S S I S S I P P I R IVER TO TEXAS WHITE SHRIMP
-0. i 080 J l 9 n J 6 4 ' I ' 1 C ! 6 8 T r '1276' ' '1280' '
1962 1966 1970 1974 1978 1962
Figure 26. Mean (solid l i e ) ex-vessel value composition index h (open circles) for reported May-August catches (inshore and offshore combined) of white shrimp from the Mississippi River to Texas (sta- tistical areas 13-17 combined), 1960-1981 (data from Table 10, and Caillouet and Koi 1981). The 95% confidence limits are shown for the mean by short dashes and for individual values of h by long dashes.
PENSACOLA TO THE M I S S I S S I P P I R IVER BROWN SHRIMP
-0 0100
-0 0280
h -0 0308 A 4
-0 0400
-0 0500
ri 0
-0 8 6 0 0 3
I 9 m 8 '
1962 1966 1970 1974 1978 1982
Figure 27. Trend (solid line) in the ex-vessel value composition index h (open circles) for reported May-August catches (inshore and off- shore combined) of brown shrimp from Pensacola to the Mississippi River (statistical areas 10-12 combined), 1960- 1981 (data from Tables 5 and 11, and Caillouet and Koi 1981). The 95% confidence bands are shown for the trend line by short dashes and for individual values of h by long dashes.
species and each of the three coastal areas (Table 12). Each year provided one observation for each index and weight of catch. In the case of all correlation analyses involving indices b, d , and h for white shrimp from Pensacola to the Missis- sippi River, one less observation was available, because the data for 1972 had to be excluded (Caillouet and Koi 198 1).
The reader is cautioned that significant correlations (those significantly greater or less than zero) do not neces- sarily reflect cause and effect relationships. However, a
PENSACOLA TO THE M I S S I S S I P P I R IVER UHITE SHRIMP
O O 0
_ _ _ _ _ _ _ _ _ _ _ _ ~ _ ~ ~ ~ _ _~~_~____-____--__-_____--.
1960 1964 1968 1972 1976 1980
1962 1966 1970 1974 1978 1982
! o o ~ ~ o O O o 0 O O 0 O
0 0000
-8 0200
-0 O'$OO _- - - - - - - - - - - - - - - -9 -~- - - - - - - - - - - - - - - - - - - - - - -~ - .
, , , , , , , 1 ~ , , , 1 , , 1 , 1 , 1
-0 0600
-0 0800
-0 I000
Figure 28. Mean (solid line) ex-vessel value composition index h (open circles) for reported May-August catches (inshore and offshore combined) of white shrimp from Pensacola to the Mississippi River (statistical areas 10-12 combined), 1960-1981 (data from Table 11, and Caillouet and Koi 1981). The 95% confidence limits are shown for the mean by short dashes and for individual values of h by long dashes.
number of general patterns emerged among the significant correlations (Table 12). For example, there were significant positive correlations between the May-August brown shrimp catches in all three coastal areas. Such results suggest that there was a region-wide influence on the May-August catches of brown shrimp, because there was a tendency for the catches to vary in the same direction from year to year in the three coastal areas. This could be explained by region-wide influences on brown shrimp recruitment, or by parallel changes in fishing effort in each of the three coastal areas, or both. The May-August white shrimp catches were not signif- icantly correlated among the coastal areas, with the one ex- ception: the white shrimp catches from the Mississippi River to Texas and from Pensacola to the Mississippi River were significantly correlated with each other. We offer no explana- tion for this correlation.
There were significant positive correlations between the ex-vessel price spread indices, b, for brown shrimp in all three coastal areas (Table 12). The same was true fur price spread indices for white shrimp in all three coastal areas. Also, there were significant positive correlations between the price spread indices for the two species. This suggests aregion- wide influence on price spread, because there was a tendency for the price spread to vary in the same direction from year to year in both speciesand in all three coastal areas. In most cases, but not all, there were significant negative correlations between the price spread index and the weight of the May- August catches (i.e., the current local supply of shrimp), both between species and between coastal areas, suggesting that price spread was wider when the catch was high, and narrower when the catch was low. Again, a regional influence was apparent, because the correlations existed between species and between coastal areas in most cases.

VALUE A N D SIZE O F S H R I M P A S R E L A T E D TO TEXAS CLOSURE 201
Among the highest of the significant correlations were the positive correlations between indices of size composition, d, and ex-vessel value composition, h , for a given species within a given coastal area. This was to be expected, because the ex-vessel value composition of the catch reflects, to a large extent, the size composition ofthe catch. This is particularly important, because it reinforces the general consensus that the size composition of the catch plays a major role in deter- mining the ex-vessel value of the catch (Caillouet and Patella 1978).
While there were a number of additional significant cor- relations depicted in Table 12, they did not follow any particular pattern; therefore we did not attempt an explana- tion for these cases. However, the absence of significant correlations is noteworthy in at least one case. For example, within a given species and coastal area, there were no signifi- cant correlations between the weight of the May-August catch and the size composition index. This indicates that the size composition of the catch is not the major factor af- fecting the weight of the catch, or vice versa. Year to year variations in recruitment, fishing effort or both, may be overriding factors in this regard. That is not to say that size composition has no effect on the weight of the catch. As might be expected, differences in fishing regulations and fishing strategy among the three coastal areas have had pro- nounced effects upon the size composition of the catches (Caillouet et al. 1980, Caillouet and Koi 1980).
DISCUSSION
Based upon our analyses of the best catch statistics avail- able from the TIMS in February 1982, we detected signifi- can t t r ends of decrease in size o f b rown shr imp in the reported May-August catches from the three coastal areas over the years 1960 to 1981. This corroborates similar findings by Caillouet and Koi (1 980) for the period 1960- 1978. In addition, Caillouet et ai. (1980) detected signifi- cant decreases in size of brown shrimp in reported annual catches from Texas and Louisiana from 1959 to 1976, and Caillouet and Koi (1980) detected significant decreases in size of brown shrimp in reported annual landings from the northern Gulf from 1961 to 1977.
In 198 1, the size composition index for the May-August brown shrimp catch in each of the three coastal areas did not depart significantly from that expected, based on the general trends of decrease in size from 1960 to 1981 (Figures 16, 18, and 20). It barely fell out of the 95% confidence bands for the trend lines, and it was well within the 95% confidence intervals for the individual levels of the index predicted for each coastal area for 1981, based on the entire 1960 to 1981 time series. Despite these trends of decrease in size, the total weight of the May-August catch of brown shrimp from all three coastal areas was higher in' 198 1 than in 1980 (Figures 2 , 4 , and 6), and the ex-vessel value of the May-August catch of brown shrimp from the Texas coast
was at an all time high (Figure 2). The higher catches of brown shrimp in 1981, coupled with the continued increase in ex-vessel price spread, enhanced the ex-vessel value of the brown shrimp catches, particularly in Texas where brown shrimp continued to be larger than those in catches from the Mississippi River to Texas and Pensacola to the Missis- sippi River.
The May-August brown shrimp catches in all three coastal areas showed a tendency to vary in the same direction from year to year. Also, the lack of a significant correlation, using the 1960 to 1981 time series, between the total weight and the size composition of the May-August catch of brown shrimp within each of the three coastal areas, suggested that size composition was not the major determinant of weight of the catch or vice versa. These findings, coupled with the fact that there were no detectable departures in 1981 from the trends of decreasing size in brown shrimp in the May- August catches from the three coastal areas during 1960 to 198 1, suggested that the observed increases in brown shrimp catch from all three coastal areas reflected some region-wide influence.
According to Jones and Zweifel (1982), there was more fleet movement in June-August 1981 than in a comparable period in 1980, and they attributed this to the Texas Closure. The change in mobility included shifts to areas away from the Texas coast during the closure and back to the Texas coast thereafter. Klima et al. (1982) indicated that recruit- ment from Texas bays to the offshore fishery appeared to be average to good in 1981, but not so good as to account for the outstanding abundance levels found offshore of Texas. According to Charles J. White (Louisiana Department of Wildlife and Fisheries, Lake Charles, Louisiana, personal communication, March 1982), brown shrimp recruitment in Louisiana, both west and east of the Mississippi River, was near record levels in 1981. Also, J. Y . Christmas (Gulf Coast Research Laboratory, Ocean Springs, Mississippi, personal communication, March 1982) indicated that there was good brown shrimp recruitment in 1981 in the area of Mississippi Sound off the coast of Mississippi.
There were no significant trends in size composition of reported May-August catches of white shrimp from the Texas coast and from Pensacola to the Mississippi River from 1960 to 1981, a result similar to that reported for May-August catches from 1960 to 1978 by Caillouet and Koi (1981). However, there was a significant trend of de- crease in size of white shrimp in the May-August catch from the Mississippi River to Texas from 1960 to 1981. The size composition of the May-August 1981 catch of white shrimp in the three coastal areas showed no significant departure from that expected based on 1960-1981 trends or mean levels (Figures 17, 19, and 21). On the other hand, Caillouet et al. (1 980) and Caillouet and Koi (1 980) detected decreases in size of white shrimp in reported annual catches and landings, respectively, from the northern Gulf of Mexico.

202 CAILLOUET A N D KO1
Therefore, the observed trends of decrease in size of white shrimp in the annual catches and landings from the northern Gulf must reflect an overriding influence of catches in months other than May-August. The low percentages of the annual white shrimp catches taken in May-August (Table 1) corroborate this. While the ex-vessel price spread for white shrimp in the May-August catch from the Mississippi River to Texas and from Pensacola to the Mississippi River in- creased from 1960-1981, no such trend was detected in price spread for white shrimp from the Texas coast (Table 5).
Our analyses did not demonstrate immediate and detect- able increases in size of brown shrimp or white shrimp in the May-August catch concomitant with the Texas Closure in 1981. However, the total weight and ex-vessel value of the May-August catches of both species in each coastal area were higher in 1981 thanin 1980, with one exception: white shrimp from the Texas coast exhibited a slight decrease in weight of May-August catch in 1981 as compared to 1980, but there was nevertheless an increase in ex-vessel value of this catch.
The magnitude of the increase in weight of the May- August catch of brown shrimp between 1980 and 1981 was greater for the Mississippi River to Texas (18.6 million pounds, or 94%, Figure 4) than for either the Texas coast (12.1 million pounds, or 69%, Figure 2) or Pensacola to Mississippi h v e r (3.2 million pounds, or 45%, Figure 6). This occurred despite the fact that approximately half of statis- tical area 17, which is located within the Mississippi River to the Texas coastal area, was closed to shrimping during the Texas Closure. Also, the magnitude of the increase in ex-vessel value of the May-August catch of brown shrimp between 1980 and 1981 wasgreater for the Mississippi River to Texas (22.6 million dollars, or 66%, Figure 4) than for either the Texas coast (1 8.2 million dollars, or 38%, Figure 2 ) or Pensacola to the Mississippi River (0.9 million dollars, or 5%, Figure 6). Nonetheless, in May-August 1981, the Texas coast continued to produce brown shrimp catches of higher ex-vessel value than the other two coastal areas, be- cause these catches were represented by larger shrimp which brought a higher price than in the other two coastal areas. Our findings are consistent with the findings of Poffenberger (1982) who estimated an increase in revenue of 21.5 million dollars to the Gulf of Mexico brown shrimp fishery during May-August 198 1.
We concluded that the increases in brown shrimp catches in May-August 1981, as compared to May-August 1980, ap- peared to be due to a region-wide influence, perhaps good recruitment in 1981, or increased fishing effort, or both. This finding is not necessarily inconsistent with those of Klima et al. (1982), Nichols (1982), or Matthews (1982),
because these authors dealt only with offshore catches, and concluded that offshore abundance and yield of brown shrimp was enhanced by the closure. Our analyses dealt with inshore and offshore catches combined. It was obvious that the continued increase in ex-vessel price spread among size categories of shrimp continued to enhance the ex-vessel value of the catches, especially on the Texas coast.
The reader is reminded that our analyses dealt only with the May-August catches. For the Texas coast, the May- August period produces a smaller proportion (averaging 58%) of the calendar year annual brown shrimp catch from the Texas coast, than does a similar period for the Missis- sippi River to Texas (81%), or for Pensacola to the Missis- sippi River (83%). Thus, the May-August time interval appears to be too brief a period to show the full effects of the Texas Closure on size composition or yield of the brown shrimp. An examination of the annual catches, fishing effort, and recruitment in 198 1, as compared to earlier years, might be useful in more fully assessing the impacts of the Texas Closure. An analysis applying our approach to biological year catch statistics for brown shrimp might also be useful in further assessments of impacts of the Texas Closure or other management strategies. For that purpose, we would recommend a biological year beginning in May of one year and ending in April of the following year, based upon our examination of the weight and size composition of monthly catches of brown shrimp.
ACKNOWLEDGMENTS
We are especially grateful to those who designed and implemented the gathering of data on weight and ex-vessel value of shrimp catches by statistical area, species and size category, since they have made our analyses possible. No- table among them are Charles H. Lyles, Director, Gulf States Marine Fisheries Commission (formerly of the USFWS); George W. Rounsefe l l (deceased; fo rmer ly Direc tor , Galveston Biological Laboratory, BCF, USFWS); Joseph H. Kutkuhn, Director, Great Lakes Fisheries Laboratory, USFWS, Ann Arbor, Michigan (formerly Assistant Director, Galveston Biological Laboratory, BCF, USFWS); George W. Snow (retired; formerly Chief, Division of Statistics and Market News, NMFS, New Orleans, Louisiana); and TIMS.
The manuscript was reviewed by Dr. Edward F. Klima, Director, NMFS Southeast Fisheries Center (SEFC), Galves- ton Laboratory, and by Dr. Albert C. Jones, Dr. Joseph Powers and Mr. John R. Poffenberger, NMFS, SEFC, Miami, Florida, who provided many helpful suggestions. Beatrice Richardson, clerk-typist, NMFS, SEFC, Galveston Labora- tory, typed the manuscript.
REFERENCES CITED
Caillouet, C. W. & D. B. Koi. 1980.Trends in ex-vessel value and size composition of annual landings of brown, pink, and white shrimp from the Gulf and south Atlantic coasts of the United States.
Mar. Fish. Rev. 42(12):18-27. . 198 1. Trends in ex-vessel value and size composition of
reported May-August catches of brown and white shrimp from