ewects of numidity on the adsorption of coating solvent (m ... · pdf fileewects of numidity...
TRANSCRIPT

EWECTS OF NUMIDITY ON THE ADSORPTION OF COATING SOLVENT (m-XYLENE) ON ACTlVATED CARBON
by
Sukanta Basu
A Thesis Subrnitted to the College of Graduate Studies and Research
through Civil and Environmental Engineering in Partial Fulfilment of the Requirements for
the Degree of Master of Applied Science at the University of Windsor
Windsor, Ontario, Canada 2000
O 2000 Sukanta Basu

National Library I * u of Canada Bibliothèque nationale du Canada
Acquisitions and Acquisitions et Bibliographie Senrices services bibliographiques
395 Wellington Street 395. rue Wellington Ottawa ON KI A ON4 Ottawa ON K1 A ON4 Canada Canada
Your file Votre r6térence
Our lik? Notre réfdrence
The author has granted a non- exclusive licence allowing the National Library of Canada to reproduce, loan, distribute or sell copies of this thesis in microforrn, paper or electronic formats.
The author retains ownership of the copyright in this thesis. Neither the thesis nor substantial extracts fiom it may be printed or otherwise reproduced without the author's permission.
L'auteur a accordé une licence non exclusive permettant à la Bibliothèque nationale du Canada de reproduire, prêter, distribuer ou vendre des copies de cette thèse sous la forme de microfiche/film, de reproduction sur papier ou sur format électronique.
L'auteur conserve la propriété du droit d'auteur qui protège cette thèse. Ni la thèse r i des extraits substantiels de celle-ci ne doivent être imprimés ou autrement reproduits sans son autorisation.

ABSTRACT
Control of coating solvent vapors by adsorption on activated carbon in the automotive
industry c m be affected by the presence of humidity. As a foundation to better understand
the adsorptive behavior of these organic solvents, in this investigation, adsorption of m-
xylene in the presence of water vapor on granula activated carbon was studied.
Single cornponent (m-xylene and water vapor) adsorption expenments were first
conducted as prerequisites for the binary component (m-xylene with water vapor) studies.
The dynamic method of gas adsorption technique (passing a flux composed of carrier gas and
adsorbate vapor through a fixed bed adsorbent and subsequently andyzing the outlet
adsorbate concentrations) was used throughout this research. The experirnentd resuits were
then cornpared with predictive models to capture the dominant features of the data.
For the equilibrium and kinetic studies of water vapor adsorption, an online digital
hygrometer was used in conjunction with an electronic balance. Relative humidity values
from 18 to 96% were exarnined. The adsorption isotherm was found to resemble a type V
isothenn (Brunauer classification system). The adsorption capacities from the gravimetric
measurement were within 14% of the values obtained from the kinetic studies based on the
area integration of the breakthrough curves.
The m-xylene adsorption system design was sirnilar to the water vapor adsorption
system, except the online measurement of the adsorbate was done by gas chromatopph with
the help of a six-port valve. The concentration range studied was 52 to 1030 ppm. The
limiting pore volumes resulting from the m-xylene adsorption experiments (0.56 mU,a)

differed considerably from those found in the water vapor adsorption studies (0.2 a). The
explanation of this anornaIous behavior was beyond the scope of this study.
A conglomeration of the single cornponent systerns was employed for the binary
component adsorption experiments. Relative humidity values of 54 to 88% and organic
concentrations from 178 to 1 120 ppm were studied. A surface plot and a matrix table were
used to interpret the comp1icated binary data. The adsorption capacity of rn-xylene decreased
with increasing relative humidity. The effect of humidity was greater at low m-xylene
concentrations.


1 wish to express my deep sense of gratitude to Dr. Paul Henshaw for his
extraordinary support and guidance at all stages throughout this study, especially for d l the
"5 minutes discussion sessions" [never Iess than an hour] he granted me.
1 would Iike to sincerely thank Dr. Nihar Biswas for his pnceless advice regarding my
research, and for having provided the faciiiries needed for this work.
The quality of this thesis was also significantly improved by the valuable suggestions
of my other cornmittee rnembers, Dr. Richard Arndt, Dr. Keith Taylor and Dr. Jatinder
Bewtra, which I greatly appreciated.
The technical support 1 received from Mr. Steve Budinsky of Technicai Support
Centre, and Mr. Patrick Seaguin, technician, Civil and Environmental Engineering was of
great importance and it certainly saved me a lot of time!
Thanks to al1 my friends in Civil and Environmentai Engineering, including a special
thought to Mr. Ahmed Elgendy for his generous help during my research. Most of all, 1 am
indebted to my friend Valérie Guérin, for being there, with me, in the course of many happy
and difficult times.
Lastly, 1 am grateful to the CiviI and Environmental Engineering program for the
financial support I received throughout rny graduate study at University of Windsor.

TABLE OF CONTENTS
ABSTRACT
DEDICATION
NOTATIONS
ACRONYMS
LIST OF TABLES
LIST OF ILLUSTRATIONS
CHAPTER ONE - INTRODUCTION
Background
Paint Solvents-and Air Pollution
Regdations
Ernissions Reduction Options
Control Option - Adsorption
Adsorption - Effects of Humidity
Objective
Scope
CHAPTER 'IWO - LITERATURE REVIEW
2.1 Water Vapor Adsorption
2.1.1 Water Vapor Adsorption: Adsorption Equilibria
2.1.2 Water Vapor Adsorption: Kinetics
2.2 VOC Adsorption
2.2.1 Prediction of VOC Adsorption Capacity
xiv
xiv
vii

2.3 Effects of Humidity on VOC Adsorption
2.3.1 Modeling Effects of Humidity on VOC Adsorption
CHAPTER THREE - MATERIALS AND METHODS
3.1 Adsorbent
3.2 Water Vapor Adsorption
3.2.1 Adsorbate
3.2.2 Experimental Set Up
3 -2.2.1 Vapor Generation
3 -2.2.2 Adsorption
3.2.2.3 Detection
3 -2.3 Procedure
3.3 Single Component VOC Adsorption
3.3.1 Adsorbate
3.3 -2 Experimental Setup
3.3.2.1 Vapor Generation
3.3.2.2 Adsorption
3.3.2.3 Detection
3.3 -3 Procedure
3.4 Binary Component Adsorption
3.4.1 Adsorbates
3.4.2 Experimental Setup
3.4.3 Procedure
CHAPTER FOUR - RESULTS AND DISCUSSION
4.1 Water Vapor Adsorption: Adsorption Equilibria
4.2 Modeling Water Vapor Adsorption Equilibrïa
4.3 Water Vapor Adsorption: Kinetics
4.4 VOC Adsorption
4.5 Effects of Hurnidity on VOC Adsorption

CHAPTER FlVE - CONCLUSIONS AND RECOMMENDATIONS
5.1 Conclusions
5.2 Recornrnendations
APPENDK A - PAINT SOLVENTS
APPENDE B - ROTAMETER CALIBRATION
B.1 Rotameters
B.2 Flow Ranges
B.3 Rotameter Cdibration
APPENDIX C - GC CALIBRATION
REFERENCES
VITA AUCTORIS
* To enhance the readability of this thesis the terms in italics are defined in the glossary.
ix

NOTATIONS
A wide range of notations has been employed in this thesis. To make reference to the
originai papers easier, the original notations have been retained.
adsorption capacity ( g g )
differential rnolar work of adsorption (cal/mole)
number of pnrnary adsorption center
constant of equation 2.9
limiting adsorption capacity (g /g)
kinetic constant in equation 2.12
constant in equation 2.3
inlet concentration (ppm)
outlet concentration (ppm)
constant in equation 2.14
relative hurnidity (%)
hysteresis
kinetic constant in equation 2.13 (min-')
rate of desorption (equation 2.1)
rate of adsorption (equation 2.1)
empirical factor in equations 2.4, 2.5 and 2.6
constant in equation 2.2 1
adsorption rate constant in equation 3.1

ernpirical constant in equation 2.1 1
constant in equation 2.14
adsorbate uptake at equilibrium ( g g )
adsorbate uptake at time t (dg)
equilibrium vapor pressure of adsorbate (kPa)
saturated vapor pressure (kPa)
equilibrium vapor pressure of adsorbate (kPa)
saturated vapor pressure (kPa)
ernpirical constant in equation 2.1 1
saturated vapor pressure (kPa)
adsorption capacity (glg)
air flow rate (Urnin)
limiting adsorption capacity ( g g )
VOC adsorption capacity (g/g)
pure component VOC adsorption capacity (dg)
constant in equation 2.2 1
gas constant (1 -987 caVmole "K)
relative humidity (96)
time (min)
absolute temperature ("K)
breakthrough time (min)
limiting pore volume of the adsorbent (cclg)
molar volume of organic in equations 2.19 and 2.20 (cclgmol)

molar volume of water in equations 2.19 and 2.20
voIume of organic adsorbate adsorbed (cc/g)
limiting adsorption volume (cc/$
limiting adsorption capacity ( g g )
water uptake or loss (dg )
GREEK LETTERS
a difference between two points on isotherm (equation 2.12)
P constant of equations 2.10 and 2.16
Y constant of equation 2, I O
E adsorption potential (cal/mole)
K DR equation constant (equation 2.16)
P density of adsorbate (gkc)
PB bulk density of carbon (gcc)
xii

ACRONYMS
ASTM
CAA
CAAA
CCME
CCOHS
FID
GAC
GC
HAP
HPLC
IGA
NAAQS
NOx
OEM
PPM
RACT
RH
THF
UV
VOC
The Arnerican Society for Testing and Materials
Clean Air Act
Clean Air Act Arnendments
Canadian Council of Ministers of the Environment
Canadian centre for Occupational Health and Safety
Flarne Ionization Detector
Granular Activated Carbon
Gas C hromatograph y
Hazardous Air Pollutant
High-Performance Liquid Chromatography
Intelligent Gravimetric Analyzer
National Ambient Air Quality Standard
Nitrous Oxides
Original Equipment Manufacturers
Parts Per Million @y Volume)
Reasonably Available Control Technology
Relative Hurnidity
Tetrahydrofuran
Ultra Violet
Volatile Organic Compound
... X l l l

LIST OF TABLES
Table 1.1 Source Guideline limits
Table 1.2 Total Annualized Costs ($Near)
Table 1.3 Cost Effectiveness ($/Ton VOC Removed)
Table 3.1 Physical properties of BPL 6x16
Table 3.2 GC Operational Parameters
Table 4.1 Water Vapor Adsorption Equiiibrium Data
Table 4.2 Isothem Parameters
Table 4.3 Adsorption Kinetic Experiments
Table 4.4 Adsorption Rate Constants
Table 4.5 Physicai Properties of rn-xylene at 303" K
Table 4.6 Adsorption Experiment Data of m-xylene
Table 4-7 Cornparison of Models for VOC Adsorption Equilibrium
Table 4.8 Adsorption EquiIibriurn Data for Mixed Vapor
Table 4.9 Matrix Table
Table A. 1 Typical Paint Solvents Used in Automotive Coating Applications
Table A.2 Typical Compositions of Solvents Found in Automotive Paints
xiv

LIST OF ILLUSTRATIONS
Figure 2.1 Cornparison of Water Vapor Adsorption Isothems at 298 K
Figure 2.2 Cross Section of the Adsorbed Layer
according to the Potential Theory
Figure 2.3 Schematic Representation of Okazaki's Model
Figure 3.1 Experimental Setup (Water Vapor Adsorption)
Figure 3.2 Experimentd Setup (VOC Adsorption)
Figure 3.3A Six-Port Valve System (Running Mode)
Figure 3.3B S ix-Port Valve S ystem (Sarnpling Mode)
Figure 3.4 Expenmental Setup (Mixed Vapor Adsorption)
Figure 3.5 Experimental Setup (View 1)
Figure 3.6 Experimental Setup (View 2)
Figure 4.1 Water Vapor Adsorption Isotherm
Figure 4.2 Comparisons of Experimental Data to Results from Models
Figure 4.3 Breakthrough C u ~ e s
Figure 4.4 Comparisons of Gravimetric and Integration Results Data
Figure 4.5 Kinetic Graph (RH= 18%)
Figure 4.6 Kinetic Graph (RH=32%)
Figure 4.7 Kinetic Graph (RH=42%)
Figure 4.8 Kinetic Graph (RH=52%)
Figure 4.9 Kinetic Graph (RH=65%)
Figure 4.10 Kinetic Graph (RH=68 %)

Figure 4.1 1 Kinetic Graph (RH=89%)
Figure 4- 12 Kinetic Graph (RH=96%)
Figure 4.13 VOC Adsorption Isotherrn
Figure 4.14 Characteristic Curve for VOC Adsorption
Figure 4.15 Surface Plot of Mixed Vapor Adsorption
Figure 4.16 Variation of Retained Adsorption Capacity with RH
Figure 4.17 Breakthough Cumes for Water Adsorption
(Binary Component Adsorption)
Figure 4.18 Illustration of the Rollover Phenomena
Figure B. 1 Dry Test Meter Calibration (Air Flow vs. Error Plot)
Figure B.2 Dry Meter Calibration Curve
Figure B.3 Rotarneter Calibration Setup
Figure B.4 Rotameter Calibration (Flow Range 0- 1.5 L h i n )
using Soap Bubbler Meter
Figure B.5 Rotameter Cdibration (Flow Range 0-5.6 Wrnin)
Figure C. 1 GC Calibration of m-xylene (Liquid Phase)
Figure C.2 GC Calibration of m-xylene (Vapor Phase)
Figure C.3 Mems Chart (C=143.8 ppm)
Figure C.4 Means Charts (C=545.9 ppm)
xvi

CHAPTER ONE
INTRODUCTION
1.1 BACKGROUND
Coating of parts by priming, painting and scaling is the most expensive unit operation
in automobile manufacturing and its major source of environmental pollution in terms of
voZutile organic compounds (VOCs), hazardorrs air polZurmrs (HAPs), waste paint streams
and solid waste. It consumes a disproportionate amount of energy considering the small
amount of paint involved. Today, the complete automobile painting process requires
approximately 16% of the total primary energy consumption for the entire vehicle production
process, depending on the car's size (Harsch et ai. 1999). According to Ford Motor
Company's 1997 U.S. Toxic Release Inventory Data, approximately 80% of al1 pollutants
that were released to air, water and land from al1 Ford U.S. automotive operations in 1997
were from paint solvents (Kim et al. 2000). In 1992, General Motor's annual pollution
control costs were over $150 million for the U.S automotive operations. Although, the
pollution control costs were insignificant compared to General Motor's annual operational
costs, more than 60% of these costs were devoted to air ernissions control (Geffen et al.
1998).
Clearly, the above figures depict the economic and environmental importance of the
painting process in the automotive industry.

1.2 PAINT SOLVENTS AlW AIR POLLUTION
Traditional organic automotive paint solvents (Table A. 1, Appendix A), neariy d l of
which are categorized as VOCs, have dorninated the surface coating process for decades
(Healey et al. 1998).
The organic solvents perform the critical role of transporting the resins, pigments,
stabilizers and extenders and giving the coating the necessary viscosity, surface tension and
other chernical properties that aid in the consistent application of individual coating layers.
The choice of a particular organic solvent depends on the substrate composition and
geometry, application equipment to be used, curing temperature and time range, and coating
solids' characteristics.
Evaporation during drying of the paint solvents is the major source of VOC emissions
in automotive rnanufacturing. Additionally cleaning, prirning, surfacing, repairing and
equipment cleaning, also contribute to the overall VOC emissions from the automotive
painting process.
1.3 REGULATIONS
VOCs play the role of precursors in the photochemical smog pollution. When VOCs
are mixed with nitrogen oxides (NO,) and irradiated by ultraviolet (UV) light, a complex
chain of reactions converts them into ozone, aldehydes, hydrogcn peroxide, peroxyacetyl
nitrate, organic and inorganic acids and fine particles. Among these, ozone is considered to
be the most significant photochemical poilutant because of its wide range of effects on
human health, plant growth and climatic change (Bloemen et al. 1993). To achieve ground
level ozone reduction, regulations principally focus on the reduction of VOCs emissions. In

the United States, the Clean Air Act (CAA) is one of the numerous statutes and regulations
that regulate VOCs emissions.
But after more than 20 years of regulations, approximately 100 urban areas in the
United States still exceed the ozone National Ambient Air Quality Standards (NAAQS),
referred to as ozone nonattainment areas. The Clean Air Act Amendments ( C M ) of 1990
greatly increased the regulatory framework for control of volatile organic compound
emissions. The arnendments require that each state with one or more ozone nonattainment
areas impose controls on sources of VOCs sufficient to allow those areas to comply with the
arnbient standard (Hellwig 1998). As a result of the CAAA, many original equipment
manufacnirers (OEMs) were being forced to reduce VOC emissions in their painting
operations (Triplett 1995b).
In addition, in July 1997, the Environmental Protection Agency (EPA) issued its final
ruling to reduce the NAAQS for ozone from 0.12 ppm to 0.8 ppm averaged over an 8-hour
penod (Hussey et al. 1998). This greatly increased the number of nonattainment areas. As a
result, many minor sources of VOC emissions became significant. Facilities that previously
were subject only to either state VOC emissions regulations or were exempt from regulation
were then forced to implement federally defined Reasonably Available Control Technologies
(RACTs) .
Regdations regarding VOC emissions in general or specific organic compounds are
currently found in several jurisdictions in Canada ( E x 1998). In 1990, The Canadian Council
of Ministers of the Environment (CCME) introduced a NOJVOCs Management Plan
(CCME, 1990). Apart from that, a number of studies have been conducted through the
CCME, leading to the development of Codes of Practice for different industries, such as the

New Source Performance Standards and Guidelines for the Reduction of Volatile Organic
Compound Emissions from Canadian Autornotive OEM Coating Facilities (CCME, 1995).
Source Performance Standards Limits (SPSLs) are expressed in grarns of VOC ernitted per
square metre of total vehicle body surface area. Separate limits exist for automobiles,
passenger vans and sport/utility vehicles, Iight duty trucks and vans. Table 1.1 shows the
Source Guideline Limits.
1.4 EMISSIONS REDUCTION OPTIONS
For automotive coating operations, effectively meeting today's strict VOC regulations
is an ongoing challenge. Three primary alternatives may be explored to achieve this goal.
The first is to switch to "environmentally friendly" coatings, such as waterbornes,
UV-cure or powder coatings. But often the critical requirernents of high gloss, smooth
surface and minimal first-mn defects now met by solventborne clear coats are not fulfilled by
these coatings.
The second option is to reduce the VOC emission rate through changes to the paint-
line design. For example, paint-booth exhaust volumes c m be reduced through air re-
circulation (Triplett 1995a).
Table 1.1. Source Guideline Limits
Automobiles Passenger vans & spodutility vehicles Light duty trucks & vans
* Interim limits take effect on January 1,2000 ** Final limits take effect on January 1,2005 Source: Mancina, A. S. (1998)
Intenm*
65 gm/m2 70 gm/m2 80 gm/m2
Final**
55 ,dm ' 60 gm/m' 75 gm/m2
T

The
autcmo tive
adsorption,
final alternative is to install add-on controls. This is the solution chosen by rnost
companies today. Several options are available to control VOCs: oxidation,
UV/ozone catalytic oxidation, biofilters, and wet/dry filtration etc. Tables 1.2 and
1-3 compare
technologies.
the
To
total annualized costs and
compare the technologies
cost effectiveness of some of
on a comrnon basis, the costs
these abatement
were calculated
using published values and vendor supplied cost factors on four mode1 gas streams (100 and
10 ppm benzene in air and 100 and 10 ppm tetrachloroethylene in air, al1 at a flow rate of
10,000 scfm) (EPA 1995).
Table 1.2 Total Annualized Costs ($New)
1 Benzene Conc. ( Tetrachloroehylene Conc. 1
Table 1.3 Cost Effectiveness ($/Ton VOC Removed)
Processes
Catalytic Incineration Regenerative Thermal Incineration
Regenerable Fixed Bed Carbon Adsorption QVF Absorption
1 1 Benzene Conc. 1 Tetrachloroehylene Conc.
Source: EPA (1995)
( P P ~ )
Processes
Catalvtic Incineration
100 27 1,923 180,99 f 98,873
331,400
( P P ~ )
d
Regenerative Thermal Incineration Regenerable Fixed Bed Carbon Adsorption
QVF Absorption
10 274,376 180,99 1 98,873
331,400
100 290,705 245,9 16 98,199
331,400
10 29 1,393 252,3 16 58,7 1 1
33 1,400
( P P ~ )
Source: EPA (1995)
100 5,489
( P P ~ >
50,928 1 1,850 32,800
I
10 55.381
100 5.868
3,653 1,996 6,700
10 58.829
38,147 1,996
66,900
4,964 1,780 3,300

Controlling VOC ernissions from spray coating operations has historicaily been cost
prohibitive, due to high exhaust flow rates coupled with low VOC concentrations
(approximately 100 parts per million by volume) (Ayer 1997, Kim 1997).
One way of compensating for the high control costs is by the recovery of the VOCs.
Low cost adsorbenr (acrivated carbon), high capture efficiency (in the range of 95-98%) and
econornical recovery established adsorption as the technology of choice (Ruhl 1993 and Basu
et al. 2000).
1.5 CONTROL OPTION - ADSORPTION
However, the adoption of adsorption technology is not straightfonvard (Golovoy
1981). Rational methods are essential for reliable and econornically effective design and
operation of an adsorption system. Conscious choice of process factors (e-g. proper
adsorbent) c m reduce the spray booth exhaust concentration by a factor of 10 in surface
coating operations (Hussey et al. 1998).
1.6 ADSORPTION-EFFECTS OF HUMIDITY
Activated carbon's adsorptive capacity drops significantly in the presence of humidity
(Werner et al. 1986). In the case of spray booths with wet Venturi scrubbers (widely used in
automotive coating facilities for primary removal of particulate matter foliowed by
adsorption beds), the humidity level of the inlet Stream to the adsorbent bed is generally very
high. The contaminant Stream may be heated to reduce the relative humidity but the increase
in temperature usually reduces the adsorption efficiency. In applications like s t e m
regeneration of activated carbon, adsorption of water vapor also has been encountered.

Residual water present on the carbon afier regeneration affects the performance of the
subsequent adsorption step. Moreover, in recent years, there has been a growing interest in
the application of waterborne coatings. In waterborne coatings organic solvekts are replaced
with water, thus reducing VOC emissions si-~ficantly (but not cornpletely) while
unfortunateIy increasing the hurnidity level in the spray booth.
Since some level of hurnidity will always be present in spray booths, there is a need
for a better understanding of the adsorptive behavior of VOCs in the presence of hurnidity on
activated carbon.
1.7 OBJECTrVE
The objective of this research was to study the adsorption of an automotive coating
solvent in the presence of water vapor on activated carbon.
1.8 SCOPE
To study the interference of humidity with the adsorption of organic solvent (VOC), it
was essential to understand the manner in which water and VOC adsorb ont0 activated
carbon individually. So, both binary component (m-xylene with water) and single component
(Water and m-xylene) adsorption experiments were conducted using a Iaboratory activated
carbon colurnn. Several predictive models were also investigated for their capability to model
the adsorption processes and experïmental results were compared with the model predictions
wherever possible.

The selection of the solvent (m-xylene) was based on its major usage as a paint
solvent (Table A.2, Appendix A and GoIovoy 1981) as well as its posing a threat to the
public, workers and the environment (Bloemen et al. 1993 and CCOHS 1984).
Ln essence the scope of this work was to:
study the equilibria and kinetics of water vapor adsorption ont0 granular activated
carbon (GAC). - study the single component VOC adsorption ont0 GAC. - demonstrate the adverse effect of humidity on VOC adsorption. - compare the theoretical models delineating the above processes.

CHAPTER TWO
LITERATURE REVIEW
2.1 WATER VAPOR ADSORPTION
Water has a complicated sorptive behavior as revealed by its characteristic s i p o i d -
shaped isotherm (Type V in the Brunauer classification system). This S-shape indicates that
more than one mechanism is responsible for the adsorption of water vapor ont0 rnicroporous
activated carbon (Nol1 et al. 1991). Adsorption of water vapor begins on the prirnary
adsorption sites (oxygen surface complexes) at low relative humidities (Dubinin 1980). The
number of such available primary sites decreases with increasing relative hurnidities (RH) as
more water vapor adsorbs ont0 those sites (Qi et al. 2000). The adsorbed water molecules
then act as secondary adsorption sites and other water molecules attach to these by hydrogen
bonding. At a sufficiently high relative humidity, capillary condensation occurs to fil1 the
micropores with water, causing a sharp increase in the adsorption capacity. This phenomenon
apparently begins to occur at approximately 50% relative humidity, depending on the type of
carbon (Werner et al. 1988).
2.1.1 Water Vapor Adsorption: Adsorption Equilibria
Accurate estimation of adsorption equilibria is of great importance when dealing with
experimental studies and the development of models that predict the performance of
adsorbers (Huggahalli et al. 1996). But, due to the unique sigrnoidal behavior caused by the
primary and secondary adsorption sites, only a few adsorption isotherm models c m be used
to describe the adsorption equilibria of water vapor ont0 activated carbon (Qi et al. 2000).

The first attempt at an approximate quantitative description of the initial region of the
water vapor adsorption isotherm (DS-1) on carbonaceous adsorbents was made by Dubinin
and Serpinsky (Dubinin 1980). Development of the adsorption isotherm equation began with
the assumption of a dynamic equilibrium between adsorption and desorption (Equaüon 2.1).
Lf % is the number of primary adsorption centers, and a is the adsorption value for relative
humidity of h = p/p,, then the dynamic equilibrium condition will be expressed by:
kZ(ao +a)h = k,a
The corresponding adsorption isothem equation (DS- 1) becomes:
k 2 where, c = - 1
Equation 2.2 describes the initial region and the main part of the sharp rise of the isotherm up
to h < I/c. The equation parameters a0 and c can be easily deterrnined graphically from the
linex form of the equation:
The DS-1 model is only valid for RH < 60% (Qi et al. 2000).
Dubinin et al. (1981) extended their earlier model (DS-1) to describe the adsorption
of water vapor over the entire pressure range. An ernpirical factor (1-k3a) was introduced into
the dynamic equilibrium equation to take into account the decrease in the number of acting
adsorption centers with an increase in filling.

The dynamic equilibrium condition was expressed by:
The parameter k was determined from the condition a=& at h=l. Where, a, is the limiting
value of vapor adsorption. Denoting the kinetic constant ratio c = k2/ki, the expression for k3
becomes: 1 1
As a result the isotherm equation (DS-2) for water vapor adsorption on active carbon takes
the form (Barton et al. 199 1):
The parameters (a, c, k3) of this equation can be detennined from a single adsorption
isotherm (Dubinin et al. 198 1).
Barton et al. (1991) modified the models of Dubinin et al. (1980, 1981) and applied
them to water vapor adsorption on a number of carbons having a wide variation in surface
oxide concentration. Following Dubinin and Serpinsky, they derived the cubic form of the
DS model (DS-3). The model assumes that water vapor adsorption takes place initially on
very active primary sites on the carbon surface. The concentration of these sites is so. The
adsorption of water on these sites is similarly expressed as a. Secondary, hydrogen bonded
water is designated as a ~ . Assuming the adsorption equilibrium is descnbed by the mass
action law, the following c m be written:
CI-CS are kinetic parameters governing the rates of adsorption and desorption.
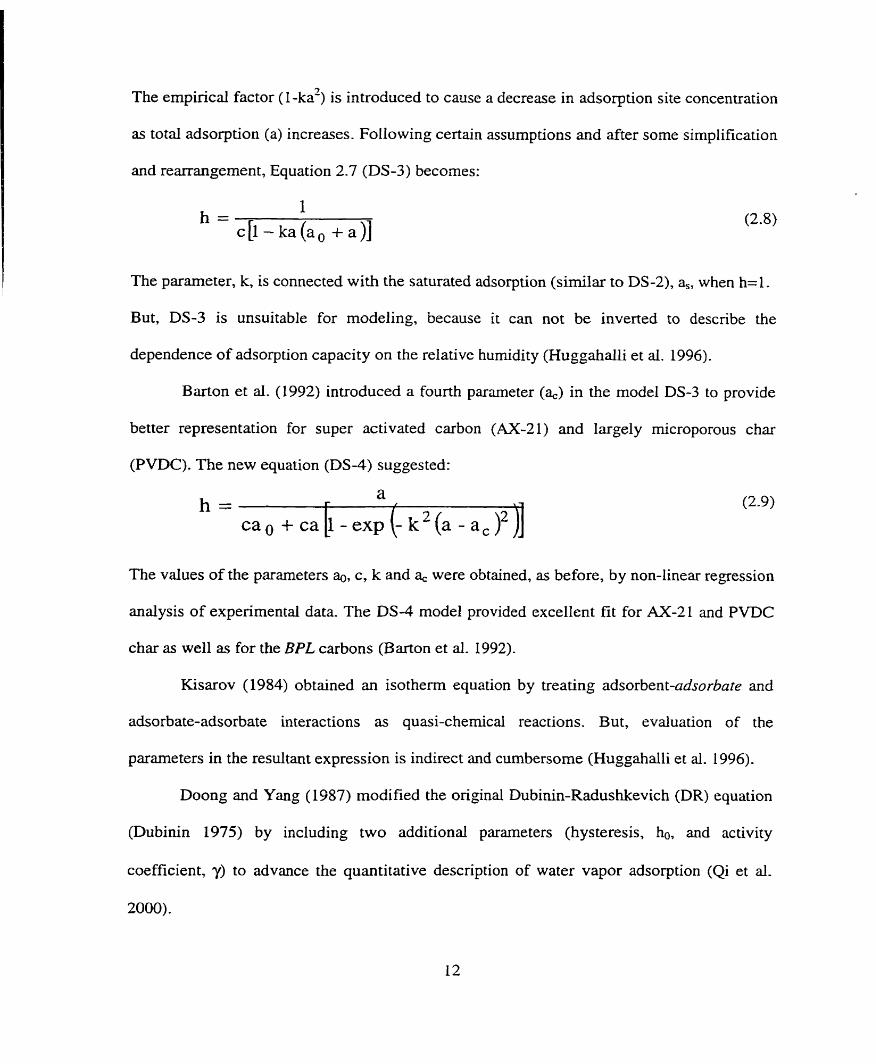
The empirical factor (1-ka') is introduced to cause a decrease in adsorption site concentration
as total adsorption (a) increases. FoIlowing certain assumptions and after some simplification
and rearrangement, Equation 2.7 (DS-3) becoines:
h = 1
c[l- ka(a, + a)]
The parameter, k, is connected with the saturated adsorption (similar to DS-2), h, when h= 1.
But, DS-3 is unsuitable for modeling, because it can not be inverted to descnbe the
dependence of adsorption capacity on the relative humidity (Huggahalli et ai. 1996).
Barton et ai. (1992) introduced a fourth parameter (%) in the model DS-3 to provide
better representation for super activated carbon (AX-21) and largely microporous char
(PVDC). The new equation (DS-4) suggested:
The values of the pararneters ao, c, k and a, were obtained, as before, by non-linear regression
analysis of experimental data. The DS-4 model provided excellent fit for AX-21 and PVDC
char as well as for the BPL carbons (Barton et al. 1992).
Kisarov (1984) obtained an isotherrn equation by treating adsorbent-adsorbate and
adsorbate-adsorbate interactions as quasi-chernical reactions. But, evaluation of the
pararneters in the resultant expression is indirect and cumbersome (Huggahalli et al. 1996)-
Doong and Yang (1987) modified the original Dubinin-Radushkevich (DR) equation
(Dubinin 1975) by including two additional parameters (hysteresis, ho, and activity
coefficient, y) to advance the quantitative description of water vapor adsorption (Qi et al.
2000).

The DY model was written as follows (Qi et al. 3000):
Where, q = adsorption capacity of water vapor; p = density of adsorbed water; Vo = lirniting
pore volume of the adsorbent; P = vapor pressure of water; Po = saturation vapor pressure of
water; T = absolute temperature; B and E are DR isotherm parameters; y = coefficient to
account for different degrees of association in the liquid and adsorbed phases; and ho
accounts for hysteresis. The value for y (RH < 60%) is calculated using the Dubinin-
Serpinsky equation (DS-2), whereas y (RH > 60%) = 1 (Doong et al. 1987).
Recently, Qi et al. (1 998) developed the QHR model (Equation 2.1 1) and compared it
with the DY mode1 (Qi et al. 2000). The QHR rnodel was shown to be in better agreement
with experimental water vapor adsorption data than the DY model for a predominantly
microporous coal-based activated carbon (Qi et al. 2000). The QHR isotherm model can be
wntten as (Qi et al. 1998):
Where, q, p, Vo, P, Po are same as described above. The empincd parameters Pso, and K are
derived by fitting the experimental data to the model. The model was also verified using
experimental data for water vapor adsorption onto four different activated carbon adsorbents
from 288 to 308 K at 101 kPa totd pressure (Qi et al. 1998).

Hassan et al. (1991) compared the water vapor adsorption data (on BPL activated
carbon) of Freeman et al. (1979), Barton et al. (1984), MahIe et al. (1988) and Hasszn et al.
(199 1). Fi,pre 2.1 exhibits the characteristic sieynoid shape water vapor adsorption isothem.
Hassan et al. (1991) attributed the large differences in the uptake values (as shown in the
figure) to differences in the regeneration temperature, lots of activated carbon used and the
ultimate vacuum attainable in each system dunng regeneration.
Figure 2.1. Cornparison of Water Vapor Adsorption Isotherrns at 298 K
(Source: Hassan et al. 1991)
2.1.2 Water Vapor Adsorption: Kinetics
For the water vapor adsorption, knowledge of the shape of the breakrhrough crime is
dso desirable. The time to breakthrough is often the critenon used to assess the performance
of an activated carbon unit. But, investigations of the adsorption kinetics of water vapor on
activated carbons are very scarce (Foley et ai. 1997).

Lin et al. ( 1996) investigated the relationship between adsorption/desorption kinetics
and equilibrium partitioning of water vapor on activated carbon grains. The adsorption and
desorption isotherms, and adsorption and desorption kinetic curves were measured by an
electrobalance (RH O to 86%) at 20°C. A mode1 that accounts for transport within grains by
pore and surface diffusion was coupled with the experimentally determined piecewise-linear
isotherm to interpret the experïmental kinetic data. The mode1 results indicated that gas-
phase difision dominates transport through the pores at RH I 60%. S~ïrfnce diffztsion was
found to be important at higher RH values.
Lodewyckx et ai. (1997) reported a general formula for the dynamic uptake of water
on microporous activated carbons. Three different types of commercial activated carbons
(Chemviron BPL, SC II and Norit RIE) were equilibrated at a known relative hurnidity (O to
90%). Then they were exposed to an air flow with a different (higher or lower) relative
hurnidity. The samples were weighed at regular intervais to obtain a curve for weight
loss/gain vs. tirne. This curve was fitted with the Equation 2.12 using non-linear regression.
Where, AW = water uptake or loss; a = difference between the two points on the water
isotherm; b = kinetic constant and t = time.
In a later work Lodewyckx et al. (1998) tested the validity of Equation 3.12 for two
other types of commercial activated carbon (Chemviron ASC-T and Norit C Granular). They
also tried to evaluate the influence of different parameters (temperature, air flow and bed
depth) on the kinetic constant b.

Foley et al. (1997) studied the adsorption of water vapor on a hïghly microporous
carbon denved from the carbonization of coconut shell. The static atmosphere water vapor
adsorptioddesorption kinetics for a carbon with preadsorbed water were studied using an
Intelligent Gravimetnc Analyzer (IGA) for a series of changes in vapor pressure. The
adsorption rate constants were aiso studied for three relative hurnidities for a dynarnic flow
system at a constant temperature. The water uptake was described by the following
phenomenological model:
Where, M, = gas uptake at time t, Mc = gas uptake at equilibrium, t = tirne and k = ernpirical
constant.
The rate constants were calculated from the gradient of the In(1-Mt/Me) versus time
graph. The rates of adsorption and desorption Vary with the position on the isotherm and
hence the mechanisrn of the adsorption process. The fastest rates were observed for
adsorption on the primary adsorption centers at low relative pressures. The slowest rates of
both adsorption and desorption were observed in the region of relative humidities in the
range 40-70%, where the adsorption process involves the growth of clusters of water
molecules on the primary adsorption centers. This leads to water molecules bridging between
pore walls and adjacent water molecule clusters when a significant amount of free surface is
availabIe and eventually leads to condensation of water vapor in the pores.

2.2 VOC ADSORPTION
The rnechanism of the VOC adsorption is different from that of water vapor
adsorption. Hydrogen bonding to the oxidized adsorption sites is the major influence during
water vapor adsorption, whereas dispersional forces greatly influence the adsorption of
VOCs. Thus, volume filling of the micropores occurs with organic vapor, while adsorption of
water begins at specific sites on the carbon surfaces (Werner et al. 1988).
There have been numerous investigations on the adsorption isotherms of VOCs on
activated carbons. A great number of isotherm models also have been developed. Werner et
al. (1988) made an excellent review of the VOC adsorption predictive models. In the
following section two of the most successful models (Freundlich isotherrn and Potentia.
theory of adsorption) will be bnefly presented.
2.2.1 Prediction of VOC Adsorption Capacity
Freundlich isotherm is an empirical equation (Equation 2.14) whose fom is simply
designed to fit the parabolic shape of a typical adsorption isothem (Werner et ai. 1988).
Where, W = volume of organic adsorbate adsorbed, P = partial pressure of the adsorbate and
KF and f are empirical coefficients (unique for each adsorbate-adsorbent pair and operating
condition). For the design of adsorption systerns, the equilibrium adsorption study on the
same adsorbent at different operating conditions is considered as an essential part of the
design. The Freundlich equation, however, is operating condition specific and can not be
used as a predictive mode1 for untested adsorbates.

The Potential theory of adsorption (Nol1 et al. 199 1, Werner et al. 1988) or the theory
of volume filling (Dubinin et al., 1971; Dubinin 1975) is based on rational physical and
chernical concepts rather than on the empirical fit of experimental data. This theory is
specifically applicable to the adsorption of organic vapors on microporous adsorbents (e.g.
activated carbon). This mode1 predicts, in principle, the adsorption capacity of a given
adsorbent for any untested adsorbate at any concentration and at any temperature.
Based on the Potential theory of adsorption, originally developed by Polanyi (1932),
Dubinin in 1960 developed the theory of adsorption in micropores (Dubinin 1975). The
central idea was the concept of adsorption potential involving adsorbent and adsorbate.
Adsorption potential was defined as the work to transfer an adsorbate molecule from the
vapor phase to a compressed state within the pores of the carbon. Mathematically, the
adsorption potential ( E ) can be expressed as:
Where, R = universal gas constant, T = absolute temperature, P = equilibrium vapor pressure
of the adsorbate vapor at a given temperature, and P, = saturation value of P.
The potential was conceptualized (Figure 2.2) as a field extending outward from the
surface of the carbon and decreasing in force with increasing distance from the surface. The
value of E varies within the adsorption space from some maximum value (E,,) to zero,
depending upon proximity to the adsorbent surface (Tien 1994). W is the volume of space in
the carbon pores in which the potential compressional forces are greater than or equal to the
corresponding e value. Therefore, Wo (corresponding to E = O) is the lirniting adsorption
volume of the microporous carbon. At the surface of the carbon, W = O (E = E,,).
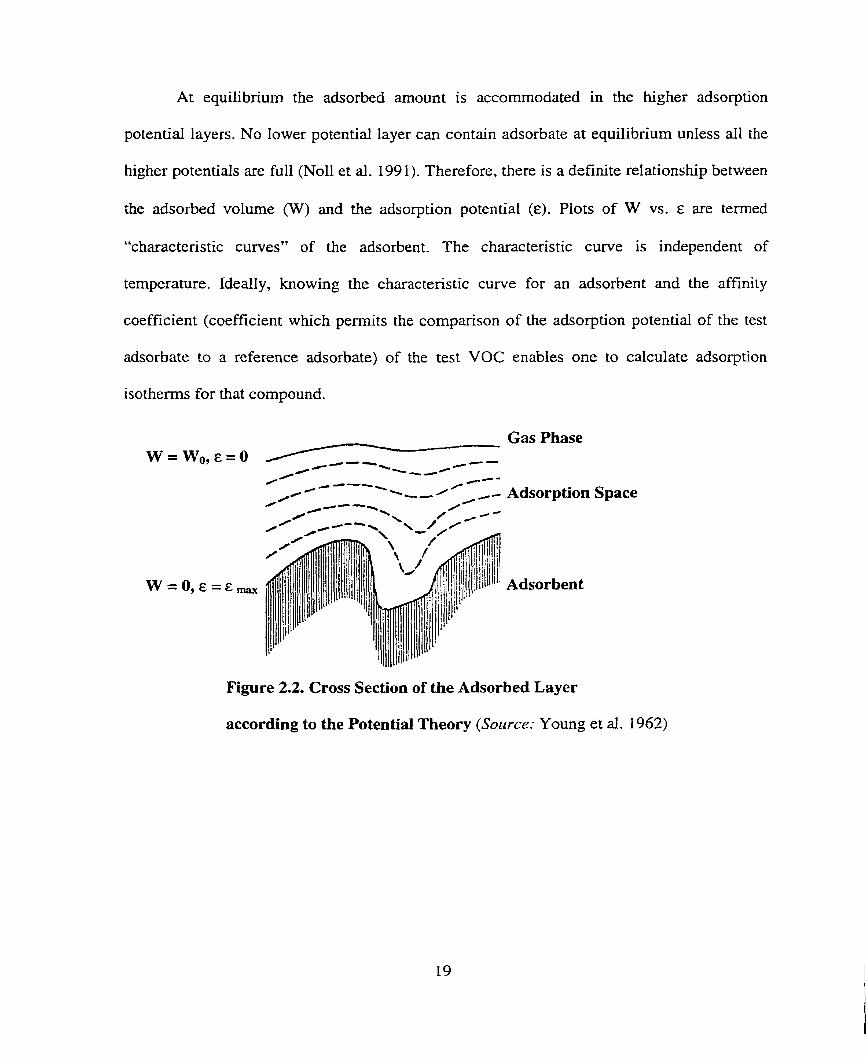
At equilibrium the adsorbed amount is accommodated in the higher adsorption
potential layes. No lower potential layer c m contain adsorbate at equilibrium unless al1 the
higher potentials are full (NoIl et al, 199 1). Therefore, there is a definite relationship between
the adsorbed volume (W) and the adsorption potential (E). Plots of W vs. E are termed
"characteristic curves" of the adsorbent. The characteristic curve is independent of
temperature. Ideally, knowing the characteristic curve for an adsorbent and the affinity
coefficient (coefficient which permits the cornparison of the adsorption potential of the test
adsorbate to a reference adsorbate) of the test VOC enables one to calculate adsorption
isotherms for that compound.
Gas Phase W = W * , & = O y /&-Z /--
/-/ ----A 0
/---- /--
4 ---HI -,- Adsorption Space
Figure 2.2, Cross Section of the Adsorbed Layer
according to the Potential Theory (Source: Young et al. 1962)

Dubinin and CO-workers defined a general mathematical form of the characteristic
curve (Dubinin et d. 1971, Dubinin 1975, Werner et d. 1988), known as the Dubinin-
Radushkhevich (DR) equation:
The DR equation, however, fails for many gas-solid systems (Doong et al., 1988).
During the later stage of the development of the theory of volume filling of micropores,
Dubinin et al. found that the initial principles of the potential theory have no physica.
meaning for adsorption in micropores (Dubinin 1975). They adopted a strict thermodynarnic
interpretation of the function
expressing the differential molar work of adsorption equal, with a negative sign, to the
change in free enthalpy. A more general equation (DA equation) proposed by Dubinin and
Astakhov may be represented as follows (for activated carbon):
where q is the adsorption at a temperature T and equilibrium pressure p, qo is the limiting
adsorption value corresponding to the filling of the whole volume of the adsorption space
Wo, and E is the characteristic free energy of adsorption.

2.3 EFFECTS OF HUMIDITY ON VOC ADSORPTION
Many studies have pointed out that water vapor in the carrier gas could compete with
VOCs and may substantialIy and adversely affect the adsorption of VOCs on activated
carbon (Nelson et al. 1976, Moyer 1983, Jonas et al. 1985, Werner 1985). This effect has
been demonstrated for different applications of activated carbon, various organic adsorbates,
a range of relative adsorbate pressures, and various arnbient conditions of adsorption (Werner
et al. 1988). III essence, air hurnidity is a prime factor, which should be considered dunng the
design and operation of carbon adsorption processes.
Numerous factors influence the extent to which humidity affects the vapor phase
adsorption process. First, the adsorption of various adsorbates is affected differently,
depending largely on their chernical characteristics (Moyer 1983). Ln general, hydrophobic
organic adsorbates are affected by water vapor to a greater extent than hydrophilic adsorbates
(Werner 1985, Cal et al. 1996). Second, the concentration of the adsorbate has a sipificant
influence at a given level of relative humidity (Werner et al. 1988). Decreasing the adsorbate
concentration generally increases the adverse effect of humidity (Moyer 1983, Werner et ai.
1988). Third, the humidity level also influences the magnitude of its effect. Below 50% R H
the effect is minimal, however the effect increases with increasing humidity (Nelson et al.
1976, Jonas et al. 1985, Chou et al. 1997). This statement is in line with the observation that
the water adsorption isothenn on activated carbon increases sharply at about 50% relative
hurnidity (Okazaki et al. 1978). Lastly, the carbon structure c m also influence the magnitude
of impact by water vapor. Water molecules are believed to adsorb ont0 oxidized sites of the
carbon adsorbent (Dubinin 1980, Dubinin et al. 1981). The greater the number of oxidized

sites on the adsorbent, the greater the interference water molecules can exert on the
adsorption of an organic vapor (Werner et al. 1988).
Interference of organic adsorption by water vapor is a special case of multicomponent
adsorption. However, multicornponent adsorption theories generally fail in predicting
adsorption equilibria of organics and water vapor systems. Therefore, in the literature, special
models have been proposed, some of which will be reviewed in the following sections.
2.3.1 Modeling Effects of Humidity on VOC Adsorption
Okazaki et al. (1978) proposed a method to predict the adsorption equilibria of
mixtures of solvent and water vapor on activated carbon. The mode1 is based on evaluating
the arnounts of solvent and water in the capillary condensed phase in the fine pores and in the
ordinary adsorbed phase on the surface of the coarse pores, respectively (Okazaki et al. 1978,
Doong et al. 1987, and Chou et al. 1997). Figure 2.3 illustrates the proposed adsorption
model. According to this model, the organic vapors are adsorbed ont0 the activated carbon by
three different rnechanisms: (1) adsorption on the dry surface (those pores in which
condensation of water vapor does not take place); (2) dissolution in the condensed water; and
(3) adsorption on the wet surface (pores in which condensation occurs). The total capacity of
the activated carbon for the VOC is the sum of these components (Okazaki et al. 1978 and
Crittenden et ai. 1989). The necessary data for this model are: pure component gas-phase
adsorption isothenns, liquid-phase isotherms of organics, vapor-liquid equilibria and pore
volume, surface area distribution curves for the carbon. A large amount of system data
required rnakes this model cumbersome to use (Doong et al. 1987).

VOC Adsorbed on Dry Surface \ Porous Adsorbent \
VOC Adsorbed on Wet
/ / VOC Dissolved in
Water
Dry Pore ' Pore Filled with Water by Capillary Condensation
Figure 2.3. Schernatic Representation of Okazaki's Mode1
(Source: Crittenden et al. 1989)
Manes (1984) developed a Polanyi Potential theory based mode1 for estimating the
effect of humidity on the adsorption of water-imxniscible organic vapors ont0 activated
carbon. It was assumed that adsorbed water reduces the pore space available for adsorption
of an organic compound on a one-to-one volume basis. Additionally, Manes assumed that at
100% RH adsorption of any organic vapor is equivalent to its adsorption from a water
solution. At 100% RH, the net adsorption potential of the organic vapor is its nomal
adsorption potential (GO, associated with its pure-component vapor adsorption in the absence
of water vapor) dirninished by the adsorption potential of an equal volume of water (&,O),
given as:

Where, Vo and V, are molar volumes of the organic and water respectively in their liquid
state. Equation 2.19 is applicable to any immiscible organic under the condition that the
organic adsorbate volume is less than the volume of adsorbed water. If the organic volume is
greater than that of water, no interference results from the presence of water (Werner et al.
1988). Characteristic curves for the pure component adsorption of VOC and water are
prerequisite for this model.
For the more generalized case, if the RH is less than 100%, the modified Equation
2.19 becomes:
The rnethod of solution for the Manes model is somewhat tedious (Cal et al. 1996).
Doong et al. (1987) suggested a model based on Dubinin's theory of volume filling.
This model, however, requires solving by a complicated trial-and-error procedure (Tien
i 984).
Recently, Chou et al. (1997) proposed a simple Freundlich-like modei (Equation
2.21) for adsorption capacities for VOCs in humid air streams.
9 voc RH Un = l - k 4 q voc, RH =O
Where, q,, is the equilibriurn adsorption capacity in an air Stream with a relative hurnidity
RH and q v o c , ~ ~ = ~ corresponds to that with RH = O at the same temperature. The parameters of
equation 2.21 c m be found by regression analysis.

CHAPTER THREE
MATERIALS AND METHODS
3.1 ADSORBENT
The activated carbon used was type BPL (Calgon Carbon Corporation) in 6x16 mesh
form. BPL is a bituminous coal-bâsed virgin granula activated carbon (GAC) activated at a
high ternperature in a stearn atmosphere. Manufacturer's data for the physical properties of
the GAC are listed in Table 3.1.
Table 3.1. Physical Properties of BPL 6x16
Property Value l
The activated carbon was dried at a temperature of approximately 150°C for 24 hours
Approximate S hape Apparent Density (h/mL)
Moisture, weight %, as packed Ash, weight %
Iodine No., (mg/@
and subsequently cooled at room ternperature in a desiccator before the experiments.
Sphere 0.47 Min 2.0 Max 8 Max
1050 Min
3.2 WATER VAPOR ADSORPTION
3.2.1 Adsorbate
Water vapor (18% < RW < 96%) was selected as the target adsorbate.
Particle Size (weight %) > 3.36 mm (US mesh 6) < 1.19 mm (US mesh 16)
5.4 Max 5.0 Max
Source: Calgon Carbon Corporation

3.2.2 Experimental Setup
The experimental setup is shown in Fig. 3.1. It consists of three functionally discrete
sections: vapor generation, adsorption and detection.
3.2.2.1 Vapor Generation
The compressed air from the laboratory air system was used as carrier gas. A
laboratory gas drying unit (Drierite, W. A. Harnmond Drierite Co., Ohio) was used to rernove
oil, hurnidity and submicron particles. The influent hurnidity level alter the drier was less
than 5%. The air was then humidified by diverting a portion of the dry influent air through a
water bubbler and then combining it with the dry dilution air. Two flowmeters with built-in
controllers (FM04-4-40C, Cole Panner) were used to adjust the flow rates (of humid air and
dry dilution air respectively) to achieve a particular design hurnidity level in the influent.
Total flow was measured with a rotameter. The rotameter was calibrated using a soap-bubble
meter (Universal Pump Calibrator, Inspecter' s mode1 302. Environmental Cornpliance Corp.)
and a Dry test meter (175s Meter, Rockwell Manufacturing Company). Appendix B
describes the calibration of the rotarneter.
3.2.2.2 Adsorption
The adsorber was a verticaily supported glass colurnn, 38.5 mm in inner diarneter and
155 mm in height. The lower end of the colurnn had a Bat fntted glass support for the carbon
bed. The column had a ground p l a s outer joint at the top. The design of the adsorber was in
agreement with the ASTM recommendations (ASTM 1995).

Lab Air Drying Unit
\
Water Bath
Vent
i Online Data
J Acquisition
Thenno H ygrometer Sensor Probe
Rotameter
Figure 3.1 Experimental Setup (Water Vapor Adsorption)

Upstream adsorption bed pressure was measured with a pressure gauge (Trerice Pressure
Gauge, Trerice Co., Windsor, Ontario).
3.2.2.3 Detection
The relative humidity was measured with a hiph performance digital thermo-
hygrometer (RH411, Omega Engineering Inc., Stamford, Connecticut). Anaiog signal
outputs (10 mV / %RH and 10 mV / OF) were connected to a computerized data acquisition
system (CIO-DAS 16/Jr, Computer Boards Corporation, Massachusetts). CIO-DAS 16/Jr is a
16 channel 12 bit analog input board capable of data acquisition at 110 KHz. A software
package (Snap-Materm, HEM Data Corp., Michigan) was used as the interface. Online data
acquisition allowed continuous monitoring of relative humidity and temperature
sirnultaneously.
3.2.3 Proceduse
The adsorbent bed weights used in this investigation ranged from 20 to 35 g (dry
weight) of activated carbon (corresponding bed height was approximately 35 mm). Parafilm
was used to seai the colurnn while weighing to avoid any prehurnidification. The column was
connected to the system sometimes after the initial start-up period. This was done to avoid
the exposure of the carbon bed to the unsteady conditions. The flow direction was downward
to avoid fluidization of the bed. The flow rate was maintained at approximately 1 L/rnin. To
maintain an isothermal condition (30°C) the column was placed in a water bath. The
temperature of the bed was measured with a T type therrnocouple placed between the carbon
granules, about 25 mm from the top of the bed. The temperature of the bed varied from 2g°C

to 3 1°C. To delineate the kinetics of water vapor adsorption, RH values of the effluent were
colIected every 40 seconds with the help of the online data acquisition system. To obtain the
equilibrium adsorption data, the tests were continued for at least 1 hour past the time when
the effluent RH equalled the influent RH. The column was then quickiy rernoved from the
system, seded with parafilm and the adsorbent weight gain was rneasured using a balance
(Mettler AE 163).
3.3 Single Component VOC Adsorption
3.3.1 Adsorbate
Anhydrous rn-xylene (99+%, Aldrich) was used as target VOC for adsorption. A
concentration range of approximately 50- 1000 ppm was considered in this research.
3.3.2 Experirnental Setup
The experimental setup is shown in Figure 3.2.
3.3.2.1 Vapor Generation
The vapor generation section was almost identical to the one described in section
3.2.2.1. The only basic difference was that instead of using water in the bubbler, m-xylene
was used. The m-xylene vapor was mixed with the dry dilution air to achieve the desired
VOC concentration in the influent.
3.3.2.2 Adsorption
Sarne as section 3.2.2.2.

Lab Air Drying Unit \
Lab Air Supply
\ \
Pressure Gauge Flowrneters with \
VOC
Adsorption Column 7, Vent
Figure 3.2 Experimental Setup (VOC Adsorption)

3.3.2.3 Detection
A gas chromatograph (HP 5890A) equipped with a megabore HP-INNOWax
capillary column (30 m x 0.53 mm ID) with a 1.0 p film thickness (Hewlett-Packard Co.)
and a flarne ionization detector (FID) was used for the detection of m-xylene. The choice of
HP-INNOWax column was based on its high tolerance for moisture content in the sarnples.
To analyze the concentration of the gas strearns, a six-port valve system (Valco Co.) with a
250 pL sampling loop was used. Fig. 3.3 shows the detailed description of this valve system.
The retention time for m-xylene was 5.87 min using the oven temperature gradient in Table
3.2. The operational parameters of the GC system are given in Table 3.2.
Table 3.2. GC Operational Parameters
3.3.3 Procedure
Carrier: Oven: Injection: GC System:
The basic procedure was the sarne as water vapor adsorption. At low adsorbate
Nitrogen, 1 rnUmin, Constant Pressure 35" C (2.5 min), 10' C h i n to 85O C 250' C , Split (100: 1) HP GC/FID, 300' C
concentrations the complete saturation takes considerable time. To avoid that, an accelerated
testing procedure (ASTM 1995) was adopted for VOC adsorption. It was achieved by
increasing the flow rate (to approximately 4 Umin) through the adsorption bed while
maintaining the desired adsorbate concentration.
The GC was initially calibrated by 6 standard solutions of m-xylene in liquid
tetrahydrofûran (THF; HPLC grade, Fisher Scientific). GC calibration is described in detaii

Influent
Effluent Vent
Sample h p
Split Vent v Figure 3 3 A Six-Port Valve System (Running Mode)
Sample Loop
Influent
Effluent Vent
Innowax Capillary Column
Carrier Gas
Innowax Capillary Column
Figure 3.3B Six-Port Vdve System (Sampihg Mode)

in Appendix C. Two GC liquid standards (143.8 ppm and 545.9 ppm m-xylene in THF) were
injected intermittenily for qudity control also to check the vaiidity of the initial calibration
for that particular test day. Figure C.3 (Appendix C ) shows the Quality Control Chart for the
GC standards ussd. The adsorber influent and effluent were sampled periodically by
diverting the air flow through the sarnpling loop for five minutes. The VOC concentrations
were rneasured and the GC outputs were integrated with 3392A Integrator (Hewlett-Packard)
to evaluate peak areas. The column was considered to be saturated when the effluent
concentration becarne equal to the imposed influent concentration and dso the experimental
run tirne was more than that predicted by Wheeler's model (Equation 3.1). Wheeler's model
was used as a stopping criterion to avoid pre-saturation stopping due to any measurement
error.
At saturation C, = Co. Therefore, the second terrn of Equation 3.1 drops.
As earlier, the column was removed from the system to measure the gain in mass due to
VOC adsorption.
3.4 Binary Component Adsorption
3.4.1 Adsorbates
m-xylene (178-1123 ppm) adsorption in the presence of water vapor (54-88 %RH)
was investigated,

3.4.2 Experimental Setup
Figure 3.4 depicts the experimental setup for the adsorption of the m-xylendwater
vapor system. The setup was a combination of the water vapor adsorption experimental setup
and the single component adsorption setup. Figures 3.5 and 3.6 show different views of the
entire setup. To achieve high humidity Ievels (>70%) the original setup (Figure 3.4) was
modified for some of the runs (mn # 9, 10 and 11). Another water bubbler was added in
series connection with the VOC bubbler.
3.4.3 Procedure
The same procedure as described in the sections 3.2.3 and 3.3.3 was followed. The
stopping criteria were: (1) the inlet humidity level was equal to outlet humidity level; (2) the
influent VOC concentration is equal to the effluent concentration. Wheeler's mode1 was not
considered as a stopping criteria due to the anticipated change in the adsorption behavior of
the VOC in the presence of humidity.


Ro tameter Adsorption Thennocouple Lab Air Drying Unit Sensor Probe Column I 1 /
Figure 3.5 Experimental Setup (View 1)
Heated Transfer Line
6 Port 'vaive
Figure 3.6 Experimental Setup (View 2)

CHAPTER FOUR
RESULTS AND DISCUSSION
4.1 WATER VAPOR ADSORPTION: ADSORPTION EQUIILIBRIA
The experïmental results for water vapor adsorption equilibria are presented and
discussed in this section dong with the results and interpretations based on different mode1
predictions.
Equilibriurn data are listed in Table 4.1. The adsorbed volume (W or V) is calculated
from the adsorption capacity (q) by a simple relation that follows:
where, p is the density (at carbon bed temperature of 303' K) of compressed adsorbate in the
adsorbent pores.
Table 4.1 Water Vapor Adsorption Equilibrium Data
- -
*T is the average ambient temperature dunng experiment

According to Dubinin (19751, the adsorbed substance in micropores in the adsorption
force field is similar to a liquid in a strongly compressed state (with a hydrostatic pressure of
the order of several hundred atmospheres). As a tentative estimate p c m be assumed to be
equal to the normal liquid density at atmospheric pressure for temperatures below its normal
boiling point.
The equilibrium data obtained in this study are somewhat lower than the previous
studies (Fi-we 2.1). The lower capacity of the activated carbon may be due in part to a
surface area lower than that of the carbons used in those studies. The properties of carbon
change sipificantly with production lots. Moreover, the adsorption bed temperature in this
study was 303' K, which is higher than the temperature (298O K) in those studies. For
virtualIy any physical adsorption process, the capacity of adsorbent decreases as the
temperature of the system increases (Young et al. 1962 and Gregg et ai. 1967).
A type V isotherm (Brunauer classification system) was observed for the sorption of
water vapor on the activated carbon as shown in Figure 4.1.
- - - - - - pp
Figure 4.1 Water Vapor Adsorption Isotherm

This observation is in accordance with other studies reported in the literature
(discussed in section 2.1). From the cunre, it is obvious that most of the uptake occurs at RH
greater than 55% (the discussions in section 2.1 therefore remains valid).
4.2 MODELING WATER VAPOR ADSORPTION EQUILIBRIA
The equilibrium data were correlated with DS- 1, DS-2, DS-3, DS-4 and QHl3 models.
The parameters of DS-1 were deterrnined graphically from the linear form of the model
(Equation 2.3). The Levenberg-Marquardt algorithm was applied for the estimation of the
parameters of the other models. This nonlinear regression based algorithm was implemented
using ~ a t a ~ i t ~ ~ , a cornrnercially available software package. The best-fit isotherm
parameters are presented in Table 4.2.
Table 4.2 Isotherm Parameters
- 1 I I 1 1 - . - 1 1 I
* h, Vo and MARE were not calculated for DS-1 because it was not valid
Models
for RH > 87.7% (calculated from h > l/c condition)
a0
The DS-2 and QHR models compare favorably with the experimental data for the entire RH
range (Figure 4.2). The DS-1 model, as is well known, is applicable only for the initial part
of the of the isotherm upswing. The DS-2 model gives the best correlation over the entire
pressure range. The QHR model gave fair predictions, but there appears to be an
overestimation during the first part of the isotherm. DS-3 and DS-4 models were aIso tested
for the experimental data correlation (not shown here). However, numerical vaiues of some
. (dg) DS-1 1 0.0090
c
1.14 -
i4 (Or qO'
-*
V" ( m g ) -*
P5dpo
- K
- MARE (%)
-*

of the regressed pararneters were not theoreticdly feasible (e-g. negative value of Q).
Furthemore the confidence intervals of some of the pararneters were very wide (Le. the
standard errors were large); therefore, these models were eventually not included in this
study.
Figure 4.2 Comparisons of Experimental Data to Results from Models
Agreement between the experimentd and modeled results is descnbed using the
mean absolute relative error (MARE) of q as follows:

where, N is the number of experimental data points, qi,ex,mend = measured expenmental
adsorption capacity, qi,mo&lsd = modeled adsorption capacity using the DS or QHR models.
The saturation adsorption, qa (or h), was obtained by extrapolating the value of q (or
a) for RH = 100% using the mathematical models. The lirniting pore volume, Vo, is related to
the limiting adsorption capacity by Equation 4.1. It is apparent that, although the V. values
depend upon the equation used, their order of magnitude does not change.
4.3 WATER VAPOR ADSORPTION: KINETICS
From the data collected by the online data acquisition system, breakthrough curves
were plotted based on the ratio of outlet hurnidity level to the inlet hurnidity level versus the
adsorption time.
1 1 l l l ,
O 300 600 900 1200 1500
Time (min)
Figure 4.3 Breakthrough Curves

Figure 4.3 illustrates the breakthrough curves for different idet humidity levels. The
numbers 1 to 8 denote different experimental nins with different inlet humîdity. Operating
conditions for these tests are given in Table 4.3.
Table 4.3 Adsorption Kinetic Experiments
The adsorption capacity at time t (q, or Mt) was calculated fiom the breakthrough
Run #
curve area using a numerical integration scheme (Equation 4.3).
Equilibrium adsorption capacity (qe or Me) was calculated considering t = T (stopping time).
The values obtained by the integration method were compared with the gravimetric
rneasurement values (Figure 4.4). The difference between the values was approximately
14%. The difference was caiculated similar to MARE. Instead of q.,,",,d and q,d,led,
%vimeuic and qintegntion were used respectively.
Idet RH (W
Experimentai Run Time
(min)
Saturation Time (min>
Flow (Umin )

+$- Line of Equality - -
Gravimetric Data
Figure 4.4 Comparisons of Gravimetric and Integration Results Data
Typical graphs of ln(1 - M m ) versus time are shown in Figures 4.5 through 4.12.
Table 4.4 shows the adsorption rate constants. The rate constants were calculated frorn the
gradient of the In(1 - M m ) versus tirne graph. It is apparent that the rate constant decreases
with increasing humidity level. Foley et al. (1997) showed at least three regions of linearity
in their kinetic graphs. However, they were unable to show any correlation between the
adsorption rate constant and humidity. In this study, instead of dissecting the kinetic curves
according to the slopes, overall slopes have been calculated.
The findings of this study c m be verified indirectly from the work of Lin et al.
(1996). The rate constant k is proportional to the diffusion coefficient. Diffusivity is a strong
inverse function of concentration (Foley et al. 1997). Lin et al. reported effective diffusion
coefficient values in the range of 3.7 x IO-'' to 2.6 x 10-~~rn'/s for RH 20 % to 86%.

y = -0.0968~
R~ = 0.95
, 1 1
1 O 20 40 60 80 1 O0 Tirne (min)
/ - Experirnental - Model 1 1
Figure 4.5 Kinetic Graph (RH = 18%)
Time (min)
1 - Experimental - Model 1
Figure 4.6 Kinetic Graph (RH = 32 %)

50 100 150 200 250 300
T h e (min)
1 - Experimental - Model
Figure 4.7 Kinetic Graph (RH = 42%)
Tirne (min)
i - Experirnental - Model 1
Figure 4.8 Kinetic Graph (RH = 52 %)

400 600
Time (min)
1 - Experimental - Model /
Figure 4.9 Kinetic Graph (RH = 65%)
Time (min)
- Experimental- Model
Figure 4.10 Kinetic Graph (RH = 68 %)

Time (min)
- Experimental - Model 1
Figure 4.11 Kinetic Graph (RH = 89 %)
l Time (min)
- Experimental - Model
Figure 4.12 Kinetic Graph (RH = 96%)

The values of diffusion coefficients decrease with increasing irtlet RH. This result indirectly
verifies Our results.
TabIe 4.4 Adsorption Rate Constants
The Equations 2.12 and 2.13 are identical in form. The kinetic constant b (Equation
2.12) c m be calculated from the rate constant k (Equation 2.13). Column (3) of TabIe 4.4
shows the values of b for different RH values. It is obvious that the value of b is
approximately constant (= 0.002). Lodewyckx et al. (1997) also obtained an approximate
value of 0.002 for al1 the carbon samples. The only exception was dry carbon put into contact
with a humidity of 20% (value of b = 0.005). In our case surprisingIy the only exception was
at 18% RH (b = 0.0043). This anomaly is not clearly understood. Lodewyckx et al. (1997)
attributed exceptions in their results to a different water adsorption mechanism (not explained
in detail).

4.4 VOC ADSORPTION
Physicd properties of m-xylene are listed in Table 4.5. Equilibrium data for m-xylene
at 30° C are shown in Table 4.6 dong with the predicted and experimental breakthrough
times. As mentioned in section 3.3.3, the adsorption column was considered to be saturated
when the effluent concentration becarne equal to the influent concentration (GC analysis) and
also when the expenmental run time was more than the theoretical run time (calculated by
Wheeler's model). In the cases of run 1 and 2, the second condition was not satisfied
(intentionally) because, in those two cases several repetitive saturation vaiues were observed
by in the effluent gas chromatograph analysis. The Wheeler equation is the simplest kinetic
equation but it has several limitations (Werner et al. 1988) and its accuracy is unacceptable
for volatile compounds (Nelson et al. 1976). It might be possible that the Wheeler equation
overpredicts breakthrough times for low adsorbate concentrations.
Table 4.5 Physical Psoperties of m-xylene at 3 0 3 O K
Table 4.6 Adsorption Experiment Data of m-xylene
The experimental adsorption equilibrium data were correlated with the Freundlich
Run #
1 2 3 4 5 6
(Equation 2.14) and Dubinin-Astakhov models (Equation 2.18). The parameters of the
C (ppm)
52 144 392 413 440
1030
9t: (&) 0.336 0.374 0.403 0.408 0.409 0.456
W
0.393 0.437 0.471 0.477 0.478 0.533
Flow (Umin)
3.66 3.94 3.82 3.63 3.82 3.31
Theoretical Run Time (min) 8879 2795 1366 1365 1071 64 1
Experimental Run Time (min) 5 160 2509 1961 1320 1188 1413

models (Table 4.7) were obtained by nonlinear regession analyses (Levenberg-Marquardt
algorit hm).
Both the models correlated the experimental data with a MARE of approximately 1%.
Figure 4.13 shows the Freundlich mode1 fit.
Table 4.7 Comparison of Models for VOC Adsorption Equilibrium
1 m~ Experimental - ~rëbndl ich l
Figure 4.13 VOC Adsorption Isotherm
Freundlich Mode1
VOC adsorption isotherm (Figure 4.13) differs qualitatively in shape from the water
vapor isotherm (Figure 4.1). The isotherms show pictorially that as a resuit of m-xylene and
water vapor adsorption the adsorbates fil1 the volume of the micropores of the active carbons.
But the nature of filling is quite different. In the case of m-xylene the main micropore
volume is filled in the range of small relative pressures. The filling of the main volume of the
KF
0.332
DA Mode1 40
( d g ) 0.479
f
0.099
vo (mUg) 0.560
MARE (%)
0.998
R'
0.986 (cai/moIe) 5553.56
MARE (%)
1.642
R'
0.953

carbon micropores with water occurs at high relative pressures. Dubinin (1980) pointed out
this peculiarity for benzene and water vapor adsorption on the granu1a.r activated carbon
AG2.
The characteristic curve (section 2.2.1) for the BPL carbon of this study is shown in
Figure 4.14. Ideally, this cuve can be used to predict the adsorption capacity of this carbon
for any adsorbate at any temperature, provided the value of the affinity coefficient is
available (Golovoy et ai. 198 1).
Figure 4.14 Chasacteristic Curve for VOC Adsorption p p p p p p p p - - - - - - - - - - -
As can be seen from the Table 4.7, Vo has a value of 0.56 mUg, representing the pore
volume of the carbon. But, the pore volume calculated from the water vapor capacity (Table
4.2) is 0.2, much less than that obtained by VOC adsorption. Ideally, the lirniting volume
adsorbed by a porous adsorbent should be constant and independent of the adsorbate. In other
words, a porous adsorbent has a fixed pore volume (Carrott et al. 1995). Ln sorne cases, the

apparent micropore volume decreases as the molecular size increases. In other cases, there is
apparently no relationship between the rnicropore volume and molecular size. For example,
water, which is normally considered to be a small molecule, has a tendency to give a
somewhat low value for the micropore volume (Carrott et al. 1995). This observation has
been reported in the literature with values of the pore volume calculated from water vapor
adsorption at RH - 90% to total pore volume from nitrogen adsorption at 77 K in the range
of 0.22 - 0.90 (Foley et al. 1997). In this study we observed a ratio of 0.36 (= V O , ~ ~ ~ J V ~ , V ~ ~ ) .
This phenornenon lacks suitable explanations. Carrott et al. (1995) have proposed that water
vapor adsorption only occurs in pores of slit-width 2 0.37 nm. due to the inability of
adsorbed water to form a stable hydrogen-bonded structure in narrower pores. Further
investigation in this direction was beyond the scope of this study.
4.5 EFFECTS OF NUMIDITY ON VOC ADSORPTION
The effect of moisture on VOC adsorption allows three possibilities: adsorption will
be degraded, it will be unaffected or it will be enhanced (Jonas 1985). This study aims to
delineate the nature of this interference (positive or negative) by humidity on m-xylene
adsorption.
The experimental data of adsorption equilibrium for m-xylene and water vapor
mixture are listed in Table 4.8. The pure component values (qoVwter and qo,voc) are also listed
in Table 4.8. The values of q~,,,,, and qo,voc were predicted by the DS-2 model and
Freundlich model respectively. The binary component (VOC/humidity) resulted in the total
adsorption capacity (qwater + clvoc) of the activated carbon. To find the contribution of water
(q,,,,,) in the total capacity, area integration (using Trapezoidal rule) of the breakthrough

Cumes of water vapor adsorption was applied. The amount of VOC adsorbed (qvoc) was
deterrnined by the material balance of the total experimentai adsorption capacity data
(gravimetric data) and the water vapor adsorption data (integrati~n method).
Table 4.8 Adsorption Equiiibrium Data for Mixed Vapor
In order to draw conclusions, the results presented in Table 4.8 are transforrned into a
matrix table (Table 4.9) and a surface plot (Figure 4.15). For the sake of convenience, the
entire RH region (18% < RH ~ 9 6 % ) was divided into three hurnidity levels: low (L: < GO%),
medium (M: 60% c RH < 80%) and high (H: > 80%). Similarly, the VOC concentration
range (50 ppm < C < 2200 ppm) was divided into two levels: low (L: < 250 ppm) and high
(H: > 250 ppm). These demarcation lines are true only for this work and the definitions of
low, medium or high levels should not be considered as generalized ones.
Table 4.9 Matrix Table
Run #
I I VOC Levels l
Values 1 M 1 0.843 1 0.965 1
C (ppm)
RH (%)
qo.water
(g/g) ~ O , V O C
( g k ) (hater qvoc (dg) . (dg)

The values in the matrix (Table 4.9) denote retained adsorption capacity
(qvoc/qo.voc)- These retained adsorption capacity values are in accord with the Iiterature
values (0.09 to 0.87 for a test hurnidity range of 80% to 90% for 13 different adsorbates)
compiled by Werner (1985).
qvoc
Figure 4.15 Surface Plot of Mixed Vapor Adsorption
The matrix table and the Figure 4.15 indicates that in general, each increase of - - - - - - - - - - - -
homi-diq tevel fufthër aecTe%ePthe carbon's ?idio@ti& capacity for VOC. The lower the
VOC concentration, the more profound the effect of water vapor is on the VOC adsorption
capacity of carbon. In the case of high VOC concentrations, the effects of hurnidity at al1
levels are almost nil. This finding is consistent with a Russian study referred by Jonas et al.
(1985) which found that at high benzene concentration the presence of moisture in the
benzene Stream had virtually no effect on the sorptive capacity of the carbon for benzene

vapor. This was attributed to the very slow adsorption of water vapor by activated carbon and
the displacement of initially adsorbed water vapor by benzene.
Applying a "multiplier factor" determined at one adsorbate concentration to account
for a given humidity at other adsorbate concentration is cornmonplace. Multiplier factor is
used as a tool to account for the effect of hurnidity on the adsorption capacity. But, from the
. above discussion it is obvious that the concept of multiplier factor is not reliable. Because,
low concentrations of adsorbates are affected by a given level of humidity to a greater extent
than higher concentrations. Werner et al. (1985) questioned the validity of this multiplier
factor and suggested additional research in this direction.
The enhancement of adsorption is rather uncornmon. The reason for an increase in the
adsorption capacity for water in two of the binary States (column 6, Table 4.8) compared to
their corresponding single cornponent state values (colurnn 4, Table 4.8) is unclear.
The experimental data was regressed to Chou et ale's model (Chou et al. 1997).
Although the Manes model is theoretically sound, as mentioned earlier, this model is
applicable if and only if the adsorbed organic volume is less than the adsorbed water volume.
Otherwise the model assumes no interference from the presence of hurnidity. As discussed in
section 4.4 the adsorbed water voIume was only 37% of the adsorbed VOC volume at the
saturated state. Even the minimum VOC adsorbed volume (0.39 &g) was much higher than
the adsorbed water volume at 100% RH (0.2 mW,a). This is why the Manes mode1 was not
applied for data prediction.
Figure 4.16 shows the cornparisons of the experimental and modeled (Chou et d.'s
model) results for the low VOC concentration level. The parameters of the model (b =
0.0037 and n = 1.1 16) were obtained by nonlinear regression analysis of the experimental

data points. The good agreement (MARE = 0.4% and 2 = 0.996) between the rnodeled and
the observed results shows the vdidity of Chou et al.'s model. The model, aithough shown to
be valid in correlating the retained adsorption capacity and relative humidity, cannot be used
to predict the quantitative effect of humidity on the activated carbon adsorption capacity for a
specified VOC at an equilibrium temperature (Chou et al. 1997).
/ Low Lebel VOC - Chou et al.% Model High Lewl VOC
Figure 4.16 Variation of Retained Adsorption Capacity with RH
During run # 5 and 6, "rollover phenomena" was observed (Figure 4.17). The
breakthrough curves of water appear with a hump at which the outlet concentration is higher
than the inlet concentration. Water is a polar rnolecule. Its affinity to activated carbon (non-
polar surface) is much smailer than that of m-xylene. Ln addition, the molecular size and
molecular weight of water is smailer than m-xylene. So, water has higher diffusion velocity.
Thus, water eluted much earlier than m-xylene. The elution order is also deterrnined by the
adsorbability of the components. The more strongly adsorbed cornponent (m-xylene) c m
displace the less adsorbed component (water) from the adsorption site it has already occupied

and thus force it to desorb. The replacement of the weakly adsorbed component (water)
results in an increase of its concentration in the gas phase since this increased concentration
at any time is equal to its inlet concentration plus its desorbed concentration (Gong et al.
1993).
l i m e (min)
Figure 4.17 Breakthrough Curves for Water Adsorption (Binary Component Adsorption)
This rollover phenornenon posed difficulties in the integration by Trapezoidal mle.
For these two runs (run # 5 and 6) , the breakthmuph curves were fitted with polynornial
curves (5th degree and 10" degree respectively) prior to integration. The areas of adsorption
and desorption were calculated separately. The net integrated areas pave small negative
values of water adsorption (0.02 and 0.09), which is theoretically not feasible. In this study
these negative values were assumed to be zero for further cdculations. The following figure
illustrates the basics of the rollover phenornena. A, denotes the adsorbed area and Ad the
desorbed area.

Breakthrough Curve
--
Time (t)
Figure 4.18 Illustration of the Rollover Phenornena

CHAPTER FIVE
CONCLUSIONS AND RECOMMENDATIONS
5.1 Conclusions
Surnmarizing al1 of the experimentd and analysis results, the following usehl
conclusions are obtained:
1. Water vapor adsorption follows a type V adsorption isotherm and most of the
uptake occurs at relative hurnidities greater rhan 55%.
2. The kinetics of water vapor adsorption can be satisfactorily represented by the
generalized mode1 of Lodewyckx et ai. (Equation 2.12) with a kinetic constant
equal to 0.002.
3. The adsorption of rn-xylene follows type 1 isotherm and most of the filling occurs
at low partial pressures.
4. Pore volume calculated from water vapor adsorption is much less than the VOC
adsorption. So, water vapor adsorption should not be used as an inexpensive
method for pore volume estimation. This is in contradiction with the statement of
Qi et al. (1998).
5. Increase in humidity level leads to decreased VOC capacity. But, low
concentrations of adsorbate are afIècted by a given level of humidity to a greater
extent than higher concentrations.

5.2 Recommendations
This study provides some fundamental information on the adsorption of m-xylene
and water vapor on activated carbon. Frorn the theoreticai and experimental findings of
this research, several future research directions are recommended as follows:
In this study dry activated carbon was used as adsorbent. The effect of
preconditioning was not observed. The test humidity has different influences on
the adsorption capacity than the preconditioning humidity. The magnitude of this
influence remains unresolved. Further research might resolve this issue.
The Mmes model is valid for water irnrniscible compounds. A similar model
should be developed for water miscible compounds. Moreover, Manes model is
valid if the volume of water adsorbed is more than VOC volume adsorbed. The
model should be modified to extend its applicability.
The pore size and pore volume distribution of the carbon should be determined to
understand the pore volume discrepancy as reported in this work (section 4.4).
This distribution graph will d s o aid in the application of Okazaki et al's model
(Noll et al. 1992).
The kinetics of VOC adsorption in the pure state and in the presence of humidity
should be studied.
The characteristic curve for BPL activated carbon (section 4.14) should be
verified with other adsorbates (with different affinity coefficients)-
Temperature variation in the adsorption bed was not studied here. This could be a
potential area of research.

7. Most of the applications of activated carbon invofve mixtures of contarninants.
However, as the number of components increases, the required experirnental
effort becomes more tedious and time consurning. Yet, multicomponent
adsorption with humidity effects would be a fniitful research area.

PAINT SOLVENTS
Table A.1. Typical Paint Solvents Used in Automotive Coating Applications
Compound
1 8 ] Diacetone alcohol 1 123-42-2 1
1 2 3 4 5 6 7
Acetone Aliphatic hydrocarbons Aliphatic naphtha Amy1 alcohol Butyl alcohol Butyl cellosolve acetate DI water
10 11 - 12 13
67-64- 1 8032-32-4
64742-89-8 6032-29-7 7 1-36-3 1 12-07-2
7732- 18-5
15 1 Glycol monobutyl ether
Diethylene glycol monobutyl ether DPM glycol ether EEP glycol ether Ethyl acetate
1 1 1-76-2 16 1 Heptane
1 19 1 Isobutvl acetate 1 110-19-0
1 12-34-5 34590-94-8 763-69-9 141-78-6
142-82-5 17 18
Hexyl cellosolve Isobutanol
20 21 22 23 24 25 26
1 12-25-4 78-83-1
27 28 29
2
Isopar E Isopropanol MEK Methanol MIBK Minera1 spirits n-butyI acetate
30 3 1 32 33
I
6474 1-66-8 67-63-0 78-93-3 67-56- 1 108-10-1
64742-47-8 123-86-4
n-propyl alcohol Odorless minera1 spirits Pro~asol-B
7 1-23-8 6474 1-65-7 5 13 1-66-8
Source: Personal communications with Mr. A. S . Mancina (Daimler-Chrysler)
Propylene glycol monomethyl ether Solvesso 100 Toluene m-x ylene
107-98-2 64742-95-6
108-88-3 108-38-3

Table A.2. Typical Compositions of Solvents Found in Automotive Paints
DIBK 5-2096 Aliphatic Naphtha 5-15%
Acetone Water 30-50%
Butyl carbitol O-5% n-Butyl acetate 25-55%
Xvlene 5-2596
Non-aqueous dispersion
Source: Personal communications with Mr. A. S. Mancina (Daimler-Chrysler)
Propylene glycol rnonomethyl ether
0-5 %

APPENDIX B
ROT-TER CALIBRATION
B.1 ROTAMI3TERS
The rotameter is the most widely used device for measuring gas flow rates. It is a
round g l a s tube of constantly varying inside diameter, which houses one or more floats,
which are free to move vertically. It has permanently engraved reference scales on its
outer surface. As the gas flows up the tube, the float is displaced and continues to move
upward until the gravitational force on the float equals the upward drag force of the
moving gas strearn. Any change in the flow rate causes the float to occupy a
proportionally different position (Nelson 197 1).
B.2 FLOW RANGES
The flow range of the rotameter (Matheson Co.) used, was O - 5.85 Umin. The
rotameter was calibrated with the help of a primary standard (soap bubble meter) and an
intermediate standard (dry test meter). The soap bubble meter (Universal Pump
Calibrator, Inspecter's mode1 302, Environmental Cornpliance Corp.) has a maximum
working flow rate of 1.5 Wrnin. Whereas the dry test meter (175-S Meter, Rockwell
Manufacturing Company) measures flows greater than 16 Umin with reasonable
accuracy and its accuracy declines below 16 Wmin. Figure B.l shows the plot of air flow
vs. percentage enor for the dry test rneter. Figure B.2 shows the calibration curve for the
dry test meter (calibration test was done by Central Meter Shop, Union Gas, Chatham,
Ontario). The error was defined as: Error = Measured Value - True Value.

-0.3
Air Row (Urnin)
Figure B.1. Dry Test Meter Calibration (Air Flow vs. Error Plot)
(Source: Central Meter Shop, Chatham, ON)
0 1 I , 1 l 1 1
O 20 40 60 80 1 O0 120
Dry Test Meter Reading
Figure B.2. Dry Test Meter Calibration Curve

For the low flow range (less than 1.5 L/rnin) the rotameter was calibrated using
the soap bubble meter. And to calibrate the rotarneter in the 1.5 - 5.6 Umin (maximum
flow rate used in this investigation was 3.5 Wmin) range, the means of the extrapolated
soap bubble meter readings and dry test meter readings were considered. Figure B.3
shows the setup for calibrating the rotarneter against the soap bubble meter. In the case of
calibration using the dry test meter, the soap bubble meter was replaced by the dry test
meter (not shown here). Otherwise the set up was identicd to Figure B.3.
Lab Air
Soap Bubble Meter
-?i- -
-
Manometer
Figure B.3. Rotameter Calibration Setup
Figure B.4 and B.5 shows the calibration curves for the rotameter. Since the
pressure drops across the rotameter (in the case of calibration experiments as well as

actual adsorption expextments) were very small (less than 1 psi), correction factors for
changes in pressure were not applied.
1 1.600
1.400
I 1.200 j CI
,c 1.000
5 1 I - 0.800 3 O rg 0.600
0.400 i 0.200
0.000 ! 1 I l I
0.00 1 .O0 2.00 3.00 4.00
Rotameter Scale
A
Soap Bubble Meter
Figure B.4. Rotameter Calibration (Flow Range O -1.5 Llmin) using
1
Rotameter Sca le
O Soap Bubble Meter A Corrected Dry Test Meter - Calibration Curve
Figure B.5. Rotameter Calibration (Flow Range O -5.6 Lh in )

The cdibration of the GC/FID was needed to identify the retention time of m-
xyIene and to calculate unknown concentrations of m-xylene from instrument responses.
Standards were prepared in tetrahydrohran (THF) solvent in 10 mL voIumeiric fIasks.
The calibration was done using a range of approximately O to 1000 ppm liquid phase
concentration. One micro-litre of sample was manually taken from each standard one at a
time, and injected into the GC using a 10p.L syringe. Three trials were performed for each
standard. Linear regression analysis was applied to correlate the liquid phase
concentration to the mean of the area responses. The standards were sampled from Iowest
to highest concentration to avoid cross contamination. Figure C. 1 shows the caiibration
curve for m-xylene in the liquid phase.
Liquid Phase Conc. (ppm)
Figure C.1 GC Calibration of m-xylene (Liquid Phase)
68

To find the unknown concentrations in the vapor phase (in actual adsorption
experiments) the calibration curve of Figure C.1 was transformed into Figure C.2 using a
mass balance considering sampling volumes and densities in both the phases.
Sarnple Calculation:
Concentration of rn-xylene in vapor phase: 1000 ppm
S ampling volume (vapor phase): 250 pL
Sampling volume (liquid phase): 1 PL
Hence, at 1 atmospheric pressure and 25" C
Volume of xylene in 250 j L vapor: 2.5 IO-' L
Mass of Xylene in 250 pL vapor: 1 -0855 x 1 0 ' ~ ,m
Hence, in the liquid phase 1.0855 x 10 '~ grn of m-xylene is required in 1 p L to
have identical instrument responses to xylene in both the phases. This corresponds to
1262 ppm of m-xylene in the liquid phase (density at 25O C = 0.86 gkc). Therefore, 1000
ppm m-xylene in the vapor phase = 1262 ppm rn-xylene in the liquid phase.
Vapor Phase Conc. (ppm)
+ Trial 1
m Trial 2
Figure C.2 GC Calibration of m-xylene (Vapor Phase)
69

For quality control the Means Chart for two of the standards (143.8 and
545.9 ppm) were constnicted from the average and standard deviation of the
values observed during calibration. This chart includes upper and lower waming
levels (WL) and upper and lower control levels (CL). For the WL, and CL
construction, G s and e s Iiniits were used respectively, where s represents
standard deviation.
Figure C.3 Means Chart (C = 143.8 ppm)
Figure C.4 Means Chart (C = 545.9 ppm)
70

GLOSSARY
Activated Carbon It is a highly porous, carbonaceous material. The very large porosity
provides a large surface area, which results in exceptional adsorptive properties.
Adsorption When a gas (or vapor) is allowed to corne to equilibrium with a solid (or
liquid) surface, the concentration of gas molecules is always found to be greater in the
irnrnediate vicinity of the surface than in the free gas-phase, regardless of the nature of
the gas or surface. The process by which this surface excess is formed is termed
adsorption (Young et al., 1962). The adsorbing phase is called adsorbent, and any
substance being adsorbed is termed as an adsorbate.
BPL It is a biturninous coal based virgin granular carbon activated at a high temperature
in a steam atmosphere, designed for use in gas-phase applications.
Breakthrough Curve The main feature of the dynarnic behavior of fixed-bed
adsorption is the history of effluent concentration. The concentration-time curve (or its
equivalent) is commonly referred to as the breakthrough curve, and the time at which the
effluent concentration reaches a threshold value is called the breakthrough time.
Bninauer Classification Bmnauer, Deming, Deming and Teller in 1940 divided the
isotherms for physical adsorption into five classes (type 1 to type V). The isotherms for
true microporous adsorbents, in which the pore size is not very much greater than the
molecular diameter of the adsorbate molecule, are normally of type 1. Isotherms of types
II and III are generally observed onIy in adsorbents in which there is a wide range of pore

sizes (Ruthven 1984). Types IV and V are characteristic of rnultilayer adsorption on
highly porous adsorbents, the flattening of the isothems at the highest pressures being
attributed to capillary phenornena (Young et ai. 1962).
Capillary Condensation In a porous adsorbent there is a continuous progression from
multilayer adsorption to capillary condensation in which the smaller pores become
completely filled with liquid adsorbate. This occurs because the saturation vapor pressure
in a small pore is reduced, in accordance with the Kelvin equation, by the effect of
surface tension (Ruthven et al. 1984).
Dispersion Force This force originates through the rapidly changing electron density in
one atom, which induces a corresponding electrical moment in a near neighbour, and so
Ieads to attraction between the two atoms. Dispersion forces are always present in
physical adsorption and unless the adsorbate molecule possesses a strong dipole moment,
they will represent the major contribution to the total energy of adsorption.
Hazardous Air Pollutant HAP is any air pollutant listed pursuant to section 122 (b) of
1990 amendmnts of Clean Air Act.
Isotherm It is the relationship between the arnount adsorbed and the pressure, for a
given adsorbate on a given adsorbent at a fixed temperature (Gregg et al. 1967).
Micro-Pore Based on the characteristic adsorptive behavior, Dubinin et al. (1975)
classified the pore sizes (width of the pores) into macro, mes0 and micro pores. The
equivalent radii of the smallest pore variety -rnicropores- are less than 6-7 A.

Ozone Nonattainment Areas These are the areas in the United States, which exceed
the Ozone National Ambient Air Quality Standards (NAAQS). According to a USA
Today computer Analysis, the ruling of the EPA July 1997 increased the total number of
counties in the US in ozone nonattainment areas from 106 to more than 250 (Hussey et
al. 1998).
Surface Diffusion The rate of adsorption in porous adsorbents is generally controlled
by transport within the pore network. It is convenient to consider intraparticle transport as
a diffusive process and to correlate kinetic data in terms of diffusivity defined in
accordance with Fick's first law of diffusion. Transport by movement of moIecules over a
surface is known as surface diffusion (Nol1 et al. 1992).
Volatile Organic Compound VOC is any cornpound that contaîns carbon, excluding
carbon monoxide, carbon dioxide, carbonic acid, metallic carbides or carbonates, and
ammonium carbonate, which participates in atrnospheric photochernical (smog
formation) reactions (EPA7s definition codified at 40 CFR 5 I . 100(s)). A vapor pressure
greater than 0.13 kPa is conventionally used to distinguish them from others (Bloemen et
al. 1993).

REFERENCES
Adamson, A. W., and Gast, A. P. (1997). Physical chemistry of surj6ace.s. John Wiley & Sons, Inc, New York.
ASTM (1995). Standard guide for gas-phase adsorption testing of activated carbon. Arnerican Society of Testing and Materials (D 5 160 - 95).
Ayer, J. (1997). "Controlling VOC and air toxic ernissions from aircraft refinishing facilities- a new approach." The Air and Wasre Management Association 's 9@ Annual Meeting and Exhibition, Toronto, Canada.
Bailey, J. M. (1994). "Air force clears the sky." Industrial Paint & Powder, 12, 22-24.
Barton, S. S . , Evans, M. J. B., and MacDonald, J. A. F. (1991). "The adsorption of water vapor by porous carbon." Carbon, 29(8), 1099- 1 105.
Barton, S. S . , Evans, M. J. B., and MacDonald, J. A. F. (1992). "An equation descnbing water vapour adsorption on porous carbon." Carbon, 30(1), 123- 124.
Basu, S., Henshaw, P. F., and N. Biswas. (2000). "Perspectives of adsorption in the new millennium", The Environmental Specinlty Conference, CSCE, London, Canada.
Biron, E., and Evans, M. J. B. (1998). "Dynamic adsorption of water-soluble and insoluble vapours on activated carbon." Carbon, 36(7-8), 1 19 1- 1 197.
Bloemen H. J. Th. and Burn, J. (1993). Chemistry and analysis of volatile organic compounds in the environment. Blackie Academic and Professional, Glasgow, UK.
Cal, M. P., Rood, M. J., and Larson, S. M. (1996). "Removal of VOCs from hurnidified gas strearns using activated carbon ~10th." Gas Sepnration Pitrification, 10(2), 1 17- 12 1.
Cmott, P. J. M. (1995). "Molecular sieve behavior of activated carbons." Carbon, 33 (9), 1307-13 12.
CCOHS (1984). Chemical hazard summary - Xylene. Canadian Centre for Occupational Health and Safety (Cat. No. CC273-4/84-3E).
Chou, M., and Chiou, J. (1997). "Modeling effects of moisture on adsorption capacity of activated carbon for VOCs." Jounzal of Environmental Engineering, ASCE, 123(5), 437-443.
Crittenden, J. C., Rigg, T. J., Perrarn, D. L., Tang, S. R., and Hand, D. W. (1989). "Predicting gas-phase adsorption equilibria of volatile organics and humidity." Journal of Environmental Engineering, ASCE, 115(3), 560-573.

DataFit, version 7.0, Oakdale Engineering, PA, 1995-2000.
Delage, F., Pré, P., and Cloirec, P. L. (1999). "Effects of moisture on warming of activated carbon bed during VOC adsorption." Journal of Environmental Engineering, ASCE, 125(12), 1160-1 167.
Doong, S. J., and Yang, R. T. (1987). "Adsorption of mixtures of water vapor and hydrocarbons by activated carbon beds: therrnodynamic mode1 for adsorption equilibrium and adsorber dynamics." Recent progress in adsorption and ion exchange, Y. H. Ma and J. P. Ausikaitis, eds., AIChE, Symp. Ser. No. 259, 83, 87-97.
Dubinin, M. M., and Astakhov, V. V. (197 1). "Description of adsorption equilibna of vapors on zeolites over wide ranges of temperature and pressure." Advances in Chemistry Series, R. F. Gould, Ed., vol. 102, 69-85.
Dubinin, M. M. (1975). "Physical adsorption of gases and vapors in micropores." Progress in Surface and Membrane Science, D. A. Cadenhead, et ai., Eds., vol. 9, 1-70.
Dubinin, M. M. (1980). "Water adsorption and the microporous structures of carbonanceous adsorbents." Carbon, 18, 355-364.
Dubinin, M. M., and Serpinsky, V. V. (198 1). "Isotherm equation for water vapor adsorption by rnicroporous carbonaceous adsorbents." Carbon, 19(5), 402-403.
EPA (1995). Sctrvey of conrrol technologies for low concentration organic vapor gas streams. Control Technology Centre, Environmental Protection Agency (EPA-456iR-95- 003).
Foley, N. J., Thomas, K. M., Forshaw, P. L., Stanton, D. and Norman, P. R. (1997). "Kinetics of water vapor adsorption on activated carbon." Lnngmttir, 13,2053-2089.
Geffen, C . A. et al. (1998). "Economic and environmental tradeoffs in new automotive painting technologies." SAE Technical Paper Series, Paper No. 98 1 164, 1-8.
Golovoy, A., and Braslaw, J. (1981). "Adsorption of automotive paint solvents on activated carbon: 1. Equilibrium adsorption of single vapors." Journal of the Air Poll~~tion Control Association, 31(8), 861-865.
Gong, R., and Keener, T. C. (1993). "A qualitative analysis of the effects of water vapor on multi-component vapor-phase carbon adsorption." Jo~rrnal of Air Waste Management Association, 43, 864-872.
Grant, R. J., Joyce, R. S., and Urbanic, J. E. (1984). "The effect of relative humidity on the adsorption of water-irnmiscible organic vapors on activated carbon." Fctndcrmentals of

Adsorption, Proeedings,of the Engineering Foundation Conference, Eds. A. L. Myers and G. Belfort), Bavaria, West Germany, 28, 3 16-333.
Gregg, S. J., and Sing, K. S . W. (1967). Adsorption, su$ace area and porosity. Academic Press.
Hall, T., Breysse, P., Corn, M. and Jonas, L. A. (1988). "Effects of adsorbed water vapor on the adsorption rate constant and the kinetic adsorption capacity of the Wheeler Kinetic Model." Anterican Industrial Hygiene Association Journal, 49(9), 46 1-465.
Harsch, M., Finkbeiner, M., Piwowarczyk, D., and Saur, K. (1999). "Life-cycle simulation of automotive painting processes." Arlrornotive Engineering International, February 1999, 2 1 1 - 2 14.
Hassan, N. M., Ghosh, T. K., Hines, A. L., and Loyalka, S. K. (1991). "Adsorption of water vapor on BPL activated carbon." Carbon, 29(4/5), 68 1-683.
Healey, M. J., Walsh, M. S., Kretkowski, D., and Lewis, J. (1998). "Industrial pollution prevention." Odor and VOC control handbook, H. J. Rafson, Editor in Chief, McGraw-Hill, New York.
Hellwig, G. V. (1998). "US. federal and state laws." Odor and VOC control handbook, H. J. Rafson, Editor in Chief, McGraw-Hill, New York.
Huggahalli, M., and Fair, J. R. (1996). "Prediction of equilibrium adsorption of water ont0 activated carbon." Industrial Engineering Chemistry Research, 35, 207 1-2074.
Hussey, F., and Gupta, A. (1998). "Meet VOC regs with the right adsorbent." Industrial Paint & P o d e r , 3,46-50.
Jonas, A. L., Sansone, E. B., and Fmis, T. S. (1985). "The effect of moisture on the adsorption of chloroform by activated carbon." American Industrial Hygiene Association Journal, 46(1), 20-23.
Kawar, K. H., and Underhill, D. W. (1999). "Effect of relative hurnidity on the adsorption of selected water-miscible organic vapors by activated carbon." American Indrtstrial Hygiene Association Journal, 60, 730-736.
Keener, T. C., and Zhou, D. (1990). "Prediction of activated carbon adsorption performance under high relativity conditions." Etzvironrnental Progress, 9(1), 40-46.
Khan, A. R., Ataullah, R., and Ai-Haddad, A. (1999). "Equilibrium gaseous adsorption at different temperatures." Journal of Environmental Engineering, ASCE, 125(6), 548-555.
Kim, B. R. (1991). "Automotive wastes." Research Journal WPCF, 63(4), 486-489.

Kim, B. R., Kalis, E. M., Salmeen, 1. T., Kruse, C . W., Demir, I., Carlson, S. L. and Rostarn- Abadi, M. (1996). "Evaluating paint-sludge chars for adsorption of selected paint solvents." Journal of Environmental Engineering, ASCE, 122(6), 532-539.
Kim, B. R., Podsiadlik, D. H., Yeh, D. H., Salmeen, 1. T. and Briggs, L. -M. (1997). "Evaluating the conversion of an automotive paint spray-booth scrubber to an activated- sludge system for removing paint volatile organic compounds from air." Water Environment Research, 69(7), 12 1 1 - 122 1.
Kim, B. R., Kalis, E. M., DeWulf, T. and Andrews, K. M. (2000). "Henry's law constants for paint solvents and their implications on volatile organic compound ernissions from automotive painting." Water Environment Research, 72(1), 65-74.
Kisarov, V. M. (1984). "Isotherm equation for the adsorption of water on carbon adsorbents." Russian Journal of Physical Chernistry, 58(8), 1203-1206.
Lin, T., and Nazaroff, W. W. (1996). "Transport and sorption of water vapor in activated carbon," Journal of Environrnental Engineering, ASCE, 122(3), 176- 182.
Lodewyckx, P., and Vansant, E. F. (1997). 'The dynarnic adsorption of water vapour on activated carbon." Carbon, 35(2), 3 10-3 1 1.
Lodewyckx, P., and Vansant, E. F. (1998). "The dynamic adsorption of water vapour on activated carbon." Carbon, 36(3), 304.
Lodewyckx, P., and Vansant, E. E. (1999). "Influence of humidity on adsorption capacity from the Wheeler-Jonas mode1 for prediction of breakthrough times of water irnrniscible organic vapors on activated carbon beds." American Industrial Hygiene Association Journal, 60, 612-617.
Mancina, A. S. ( 1998). "Achieving VOC reductions through pollution preven tion & tvnste minimizution." Waste Reduction '98.
Mmes, M. (1984). "Estimation of the effects of humidity on the adsorption ont0 activated carbon of the vapors of water-irnmiscible organic liquids." Fundamentals of Adsorption, Proeedings,of the Engineering Foundation Conference. Eds. A. L. Myers and G. Belfort), Bavaria, West Gerrnany, 28, 3 16-333.
Moyer, E. S. (1983). "Review of influentid factors affecting the performance of oganic vapor air-purifying respirator cartridges." American lndrtstrial Hygiene Association Journal, 44( 1 ), 46-5 1.
Nelson, G. 0. (1971). Controlled test atmospheres - principles and techniques. Ann Arbor Science Publishers, Inc.

Nelson, G. O., Correia, A. N., and Harder, C. A- (1976). "Respirator cartridge efficiency studies: VlI. effect of relative humidity and temperature." American Industrial Hygiene Association Journal, 280-258.
Noll, K. E., Gounaris, V. and Hou, W. (1991). Adsorption Technology for Air and Water Pollution Control. Lewis Publishers, hc., Michigan.
Okazaki, M., Tarnon, H., and Toei, R. (1978). "Prediction of binary adsorption equilibna of solvent and water vapor on activated carbon." Journal of Chernical Engineering of Japan, 1 1 (3), 209-2 15.
OSHA (1993). "ln-depth survey report: control technology for autobody repair and painting shops at Je# Wyler Autobody Shop, Batavia, Ohio." Report No. ECTB 179- 15a.
Qi, S., Hay, K- J., and Rood, M. J. (1998). "Isotherm equation for water vapor adsorption onto activated carbon." Jo~tmnl of Environmental Engineering, ASCE, 124(1 l), 1 130- 1 134.
Qi, S . , Hay, K. J., Rood, M. J., and Cal, M. P. (2000). "Equilibrium and heat of adsorption for water vapor and activated carbon." Journal of Environmental Engineering. ASCE, 126(3), 267 -27 1.
Reid, R. C . Prausnitz, J. M., and Sherwood, T. K. (1977). The properties of gases and liquids. McGraw-Hill Book Company.
Riddick, J. A., Bunger, W. B., Sakano, T. K. (1986). Organic solvents - physical principles and methods of purification. John Wiley & Sons.
Rix, M. (1998). "Odor and VOC regulations in Canada." Odor and VOC control handbook, H. J . Rafson, Editor in Chief, McGraw-Hill, New York.
Rudisill, E. N., Hacskaylo, J. J., and LeVan, M. D. (1992). "Coadsorption of hydrocarbons and water on BPL activated carbon." Industrial Engineering Chemistry Research, 3 1 (4), 1122-1 130.
Rudzinski, W., and Everett, D. H. (1992). Adsorption of gases on heterogeneous surjfaces. Acadernic Press Inc., CA.
Ruhl, M. J. (1993). "Recover VOCs via Adsorption on Activated Carbon", Chernical Engineering Progress, 89(7), 37-4 1.
Ruthven, D. M. (1984). Principles of adsorption and adsorption processes. John Wiley & Sons.
Spivey, J. J. (1988). "Recovery of volatile organics from srnall industrial sources." Envirofimental Progress, 7( 1 ), 3 1-40.

Tien, C . (1994). Adsorption calculations and modeling. Butterworth-Heinemann. Boston.
Triplett, T. (1995a). "Emissions-reduction options for painting operations." Indrtstrial Paint & Porvder (http://www.ippmagazine.com).
Triplett, T. (1995b). "The waterborne ddernma." Industrial Paint & Powder (http://www.ippmagazine.com).
Werner, M. D. (1985). "The efiects of relative hurnidity on the vapor phase adsorption of tricholoroethylene by activated carbon." American Industrial Hygiene Association Journal, 46(10), 585-590.
Werner, M. D., and Winters, N. L. (1988). "A review of models developed to predict gaseous phase activated carbon adsorption of organic compounds." CRC Critical Reviews in Environmental Control, 16(4), 327-356.
Young, D. M., and Crowell, A. D. (1962). Physical adsorption of gases. Butterworths, London.

VITA AUCTORIS
NAME Sukanta Basu
PLACE OF BIRTH Calcutta, India
YEAR OF BIRTH 1975
EDUCATION Hindu School, Calcutta, hdia 1982-1994
Indian Institute of Technology, Kharagpur, India 1994- 1998 B.Tech (Hons.) (Civil Engineering)
University of Windsor, Ontario, Canada 1 999-2000 M. A.Sc (Environmental Engineering)