evolution rationale for the - digital library/67531/metadc788763/m2/1/high_res... · y geother...
TRANSCRIPT

Y
Geother echnology
Evolution Rationale
for the
Nationa Energy Strategy
W Olctober 1, 1990
W
e
Geothermal Division Office of Utility Technologies US, Department of Energy

DISCLAIMER
This report was prepared as an account of work sponsored by an agency of the United States Government. Neither the United States Government nor any agency Thereof, nor any of their employees, makes any warranty, express or implied, or assumes any legal liability or responsibility for the accuracy, completeness, or usefulness of any information, apparatus, product, or process disclosed, or represents that its use would not infringe privately owned rights. Reference herein to any specific commercial product, process, or service by trade name, trademark, manufacturer, or otherwise does not necessarily constitute or imply its endorsement, recommendation, or favoring by the United States Government or any agency thereof. The views and opinions of authors expressed herein do not necessarily state or reflect those of the United States Government or any agency thereof.

DISCLAIMER Portions of this document may be illegible in electronic image products. Images are produced from the best available original document.

TAnLE OF CONTENTS
V
Y
1.0 INTRODUCTION .......................................... 1.1 Technology Description .................................. 1.2 Resource/LandUse .................................... 1.3 Technology Stakeholders/Users ............................ 1.4 Industry Status ........................................
Market Acceptance and Experience ......................... 1.5
2.0 ECONOMIC STATUS ....................................... 2.1 Figures of Merit ....................................... 2.2 Trends in Geothermal Development ........................
3.0 COST/PERFORMANCE PFIOJECTIONS ......................... 3.1 Base Case Funding Scenario ..............................
3.1.1 Research Activities ................................ 3.1.2 Base Case Teclmology Development Scenario . . . . . . . . . . . . Accelerated Hydrothermal R&D Funding Scenario .............. 3.2.1 Research Activities ................................ 3.2.2 Accelerated R&D Technology Development Scenario . . . . . . . Beyond Hydrothermal Funding Scenario ...................... 3.3.1 Research Activities ............... ............... 3.3.2 Beyond Hydrothermal Development Scenario .............
RATIONALE FOR TECHNOLOGY IMPROVEMENTS .............. 4.1 Current Technology (1990) ............................... 4.2 Mid-Term Base Case Projections (1995-2005) .................. 4.3 Mid-Term Accelerated Case Projections (1995-2005) .............
3.2
3.3
4.0
4.4 Long-Term Projection ( > 2005) ............................ 4.5 Beyond Hydrothermal ...................................
BIBLIOGRAPHY ................................................ i
1
1 7
10 11 14
15
15 17
25
25
25 27
28
28 31
31
33 33
35
35 39 43 43 43
45
c
LIST OF FIGURES
Pape $ . . . . . . . . . . . . . . . . . . FIGURE 1 The Four Types of Geothermal Resources 2
FIGURE 2 Major Sub-systems of a Hydrothermal Electric Project . . . . . . . . . 4
. . . . . . . . . . b FIGURE 3 Hydrothermal Liquid Dominated Technology Options 6
FIGURE 4 Location of U.S. Geothermal Resources .................... 8
FIGURE 5 Hydrothermal Resources and Reserves ...................... 9
FIGURE 6 The U.S. Has Significant Hydrothermal Capacity Connected cr to the Grid ...................................... 12
FIGURE 7 Effects of PURPA on Growth of U.S. Hydrothermal Electric Capacity ........................................ 13
FIGURE 8 Estimated Improvement in Hydrothermal Flash Technology . . . . . 16 &I
FIGURE 9 Deep Well Drilling Costs in U.S. ......................... 18
FIGURE 10 Technology Improvement: Drilling Effectiveness cu at The Geysers ................................... 19
FIGURE 11 Hydrothermal Technology Improvements in Well Cements ...... 20
FIGURE 12 Hydrothermal Technology Improvements in Elastomers . . . . . . . . . 22 bl
FIGURE 13 Improvements in Pace of Reservoir Opening for . Power Production ................................. 23
FIGURE 14 Baseload Electric Technologies Base and Accelerated
FIGURE 15 Impact Points of Reservoir and Technology Variables
R&D Cases ..................................... 24 c*
on Hydrothermal System Costs ....................... 36
ii

LIST OF TABLES
f w TABLE 1
TABLE 2
TABLE 3
Cost and Performance Details Base Case Scenario . . . . . . . . . . . . Hydrothermal (Hot Water) System Description . . . . . . . . . . . . . . . System Cost Estimates, Based on Supply Analysis . . . . . . . . . . . . . U
TABLE 4 Electric Capacities Estimated to be Available at Stated Average Costs . . . . . . . . . . . . . . . . . . . . . . . . . . .
TABLE 5 Technical Assumptions for Hot Dry Rock Economic * Supply Analysis . . . . . . . . . . . . . . . . . . . . . . . . . . . . . . . . . . . TABLE 6
TABLE 7
Estimated Hot Dry Rock Electricity Cost, Cents/kWh . . . . . . . . . . Technology Characterization Cost Projection for
Hot Dry Rock . . . . . . . . . . . . . . . . . . . . . :. . . . . . . . . . . . . Y
TABLE 8 Expected Progression of Hydrothermal Electric Performance and Cost . . . . . , . . . . . . . . . . . . . . . . . . . . . . . .
Y
0 iii
Page
26
28
30
31
32
32
34
31

PREFACE
e This document contains the rationale for projections of cost, performance, and market penetration by geothermal electric technology in various cases of the National Energy Strategy (NES). The rationale supplements the earlier document, Renewable Enerev Technoloq C haracterizations, September 10, 1990, and other submissions by the DOE Geothermal Division in conjunction with NES analysis activities.
Section 1 reviews the nature and extent of geothermal resources, basic components of b geothermal energy systems, achievements to date, status of the industry, and market conditions for geothermal development. Section 2 addresses figures of merit for evaluating the economic viability of geothermal electric projects; technology trends affecting cost are also given. Section 3 examines three scenarios of projected change in cost and performance, based on the judgment of DOE and independent experts: a base case in which recent trends in industry and technology improvement continue in a business-as- usual manner; an accelerated R&D case in which the pace and scope of technology improvements by the federal program are increased; and an augmented case in which hot dry rock technology is developed as a logical follow-on to hydrothermal technology. Finally, Section 4 presents the rationale for achieving the improvements in the near- to long-terms.
b
bd
i v

Q
1.0 INTRODUCTION
v
U
1.1 Technology Description
Geothermal energy -- the heat of the earth -- originates from the earth’s molten interior and the decay of radioactive materials in the crust. In some places, this heat comes to the surface in natural streams of hot water or steam, which have been used since prehistoric times for cooking and bathing. Today, man-made wells convey the heat from subsurface reservoirs to homes, farms, factories, and electric generators.
As shown in Figure 1, there are four types of geothermal energy -- hydrothermal, geopressured, hot dry rock, and magma -- with different physical characteristics. All forms of the resource are potentially capable of electric power generation if sufficient heat can be obtained for economic operation.
The heat from resources having less potential for electric power -- those with temperatures below approximately 150°C (300°F) -- can be used directly for space heating and cooling, geothermal heat pumps, crop drying, commercial greenhouses, fish hatcheries, thermal enhanced oil recovery, and other processes requiring heat. Geothermal heat pumps are 30% more efficient than conventional air-source heat pumps and air conditioners, and general use of geothermal heat pumps could offset the need for 20,000 to 75,000 MWe of new electrical generating capacity between now and 2030. The use of moderate- temperature hydrothermal resources could offset the need for over 1 quad/year of fossil fuels and electricity in providing process heat for industry and agriculture.
W
Y
0
To date, all commercial development of geothermal energy in the United States -- both for power generation and direct use -- employs the hydrothermal resource. For this reason, the discussion herein largely focuses on hydrothermal technology. The advanced technology needed for economically extracting the heat or other forms of energy from geopressured brines and hot dry rock is currently under development by the Geothermal Division. Due to a policy determination, DOE has proposed to defer further research on magma, beginning in FY 1991.
Figure 2 presents the main compone:nts of a hydrothermal electric system. The production and conversion technologies that drive these systems are described below.
geophysics, and geochemistry -- are used to locate reservoirs, ce conditions, and optimize the placement of wells. In hydrothermal
tual geological models define the geometry and physical properties of emical models analyze changes in reservoir fluids and rocks, and
numerical simulation models predict long-term reservoir behavior.
Drilling technology used for geothermal development historically derives from the petroleum industry. Certain critical. components, such as drilling muds, were modified to
1

FIGURE 1
THE FOUR TYPES
ELECTWCKY I OF GEOTHERMAL RESOURCES
HYDROTHERMAL Mter and/or steam trapped in fractured or porous rocks; classified as either liquid- dominated (hot water) or vapor-dominated (steam) according to the principal physical state of the fluid.
GEOPRESSURED Brines at moderately high temperatures (300-4OO0F) under higher than hydrostatic pressures containing dissolved methane.
c I c f I

c c t c t
FIGURE 1
THE FOU X TYPES OF GEOTHERMAL RESOURCES (Cont.)
w
I:
HOT DRY ROCK Relatively water free, but unusual immrmeable rocks at accessible c mixtract heat, the rock must be frktured, and a man-made, confined fluid circulation system created.
MAGMA Molten or partial y molten rock (>14OO0F) at accessible depths in the earth's crust.

FIGURE 2
P
MAJOR SUB-SYSTEMS OF A HYDROTHERMAL ELECTRIC PROJECT
ENERGY EXTRACTlO N POWE R GENERATION
+ GEOLOGICAL MODEUNG
I +
TURBINE
-+-I- \ mMIODYNAMIC NUMERICAL MODEUNG
COOUNG/CONDENSING
EFFLUENT ABATEMENT
HEAT EXCHANGE
INJECTION
c c E , c" (". c F

I r) I .
work in high-temperature environments. These measures proved only marginally adequate. Materials and equipment capable of withstanding not only increasing temperatures but hard, fractured rock formations and saline, chemically reactive hydrothermal fluids were needed. As a result, a segment of the drilling industry devoted to geothermal development has evolved. Subsequently, improvements in drill bits, elastomers, and other drilling components for geothermal use have been adopted as industry-wide standards. A preeminent example of this has been polycrystalline diamond compact (PDC) bits whose worldwide market exceeds $300 million annually. Nevertheless, typical drilling costs for geothermal wells remain 2-4 times the average for oil and gas wells.
&
w Hydrothermal fluids may be produced from wells by artesian flow @e., fluid forced to the surface by ambient pressure differences) or by pumping. In the former case, the fluid may "flash" into two phases, steam and liquid; whereas under pumping, the fluid remains in the liquid phase. The choice between production modes depends on the characteristics of the fluid and the design of the energy conversion system. If the flashing mode is chosen, mineral scale may be deposited in wells and piping, leading to higher operating costs and suboptimum performance.
Power Generation
3
w The energy contained in all four types of geothermal resources may potentially be used to generate electricity or to provide heat for some direct use of the fluid. Three different energy conversion technologies are common for generating electricity with hydrothermal resources. The resource traits that influence the choice of a particular technology are the phase in which it occurs (vapor or liquid), its temperature, its pressure, and its chemistry. The three conversion technologies are: t
0
0
e L,
43
Dry Steam - Conventional turbine-generators are employed with naturally occurring dry steam. There is no significant difference between this type of operation and conventional power generation with a medium-pressure steam turbine, except that the natural steam typically 'must be filtered and chemically treated to remove particulates and trace constituents, such as hydrogen sulfide. This technology is limited because dry steam hydrothermal resources are rare. The nation's only commercial steam field is located at The Geysers in northern California.
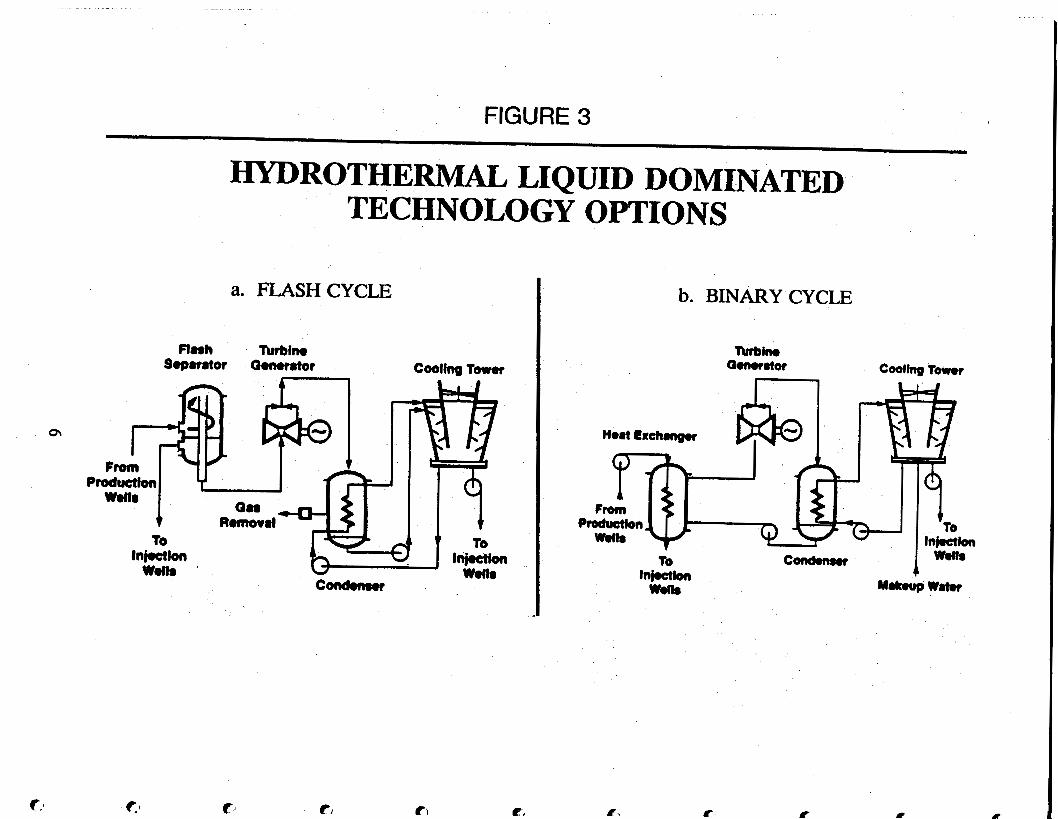
en the temperature of liquid hydrothe resources is 175°C (350°F) or above, flash steam technology may be employed (Figure 3a). With this technology, some liquid flashes to steam as its pressure drops during production. The steam is separated from the liquid fraction and used to drive a turbine-generator. Since corrosive noncondensible gases may be liberated in the flashing process and high levels of dissolved solids may be present in the residual liquid, the materials used and the design of the system become critical in eliminating scaling and corrosion problems which could adversely impact economic operation. Today, the economics of most
ash plants are improved by using a dual-flash cycle which hydrot - 5
t
d
3 u * u X
3 L cd
i
i
c 2

3
separates steam at two different pressures. This method produces as much as 20-30% more power than a single-flash system at the same fluid flow rate. The application of flash steam technology is largely limited to high-temperature, liquid-dominated (hot water) reservoirs.
Binary Cycle - Hydrothermal liquids with temperatures in the lW-175"C (212"-350"F) range are more suited to binary cycle units in order to generate electricity. With this technology (Figure 3b), the heat of the liquid vaporizes a secondary working fluid (e.g., isobutane) for use in the turbine. Today, a number of binary plants are in operation ranging in size from units of less than 1 MWe to 50 MWe. Some larger plants are made up of multiples of small units -- e.g., the 30 MWe binary plant at East Mesa, California, has 26 1.2 MWe modules.
r3
w
W
W Resource/Land Use
Hydrothermal resources are found throughout the United States and its Trust Territories. Low-temperature resources (in the range of 15" to 60°C; 60" to 140"F), which can be used in geothermal heat pump technology, are found Virtually everywhere. The higher grade resources are, however, distributed unevenly across the country. U.S. Geological Survey (USGS) Circular 892 describes the distribution of moderate-temperature hydrothermal resources from 60" to 90°C (140" to 195°F). The resources in this temperature range are widespread in the western and central regions of the United States, but are limited to localized occurrences in the eastern part of the country. The distribution of intermediate- (90" to 150°C; 195" to 300°F) and high-temperature (above 150°C; 300°F) resources is described in USGS Circular 790. All of these higher grade resources are associated with relatively recent tectonic activity. Tectonic activity in the western United States, Alaska, and Hawaii created the hydrothermal resources whose distribution is shown in Figure 4.
W
There still remains a fairly large degree of uncertainty as to the general amount of hydrothermal energy in the United States, especially with respect to reserves, or the economically recoverable amount. Recent resource estimates prepared for DOE (Figure 5 ) report 240 quads of reserves and an accessible resource base greater than 6200 quads [ 11. USGS Circular 790 estimates a resource base of 2400 quads with a generation potential of 95,000 to 150,000 MWe for 30 years.
'(3 Estimates of the drothermal resource base dep on geologic evidence, but the determination of the energy available at any on e requires detailed evaluation, particularly through drilling. The widespread geothermal heat pump resource has been confirmed by shallow water wells throughout the country. The exact locations of the higher grade resources are rm, and the definition of resource sites
Y requires drilling an
Q e environmental impacts from hydrothermal energy are generally low; air emissions are very small compared to any fossil fuel. The typical geothermal electrical plant requires an average of 0.5 acres of land per megawatt; the amount can be reduced substantially with
Y 7

FIGURE 4
LOCATION OF U.S. GEOTHERMAL RESOURCES
c t, t r 1c

OPZ 9s2'9 889'61
I.

space-saving designs, such as multi-well service pads, now in common use. Other hydrothermal applications are usually compatible with a variety of land uses. Geothermal heat pumps have been installed in congested urban areas, in suburban housing tracts, and in open agricultural developments. By 2030, most of the heating and air conditioning installations in homes and industry will need replacement and geothermal heat pumps provide utilities with a cost-effective alternative to offset the demand for new generating capacity with no new requirement for land.
1.3 Technology Stakeholders/Users
To date, hydrothermal electric plants in the United States have been used almost exclusively to provide baseload power to electric utility grids. The baseload characteristic is more or less intrinsic to the technology since: .
The capital costs of the systems are relatively high and the variable operating cost is essentially a fixed percentage of gross revenue, leaving the economics best if the plant runs at full capacity; and
Cycling of production/injection wells on and off rapidly can damage the wells or rock formations near the wellbore.
However, some interest has arisen in cycling dry steam plants at The Geysers, the oldest and largest hydrothermal electric installation in the United States. The purpose is to increase the economic value of the remaining steam in that reservoir by matching its use to the peaking and intermediate-load portions of the utility's demand curves. Experiments to that end are in progress at The Geysers and at a similar dry steam field at Lardarello, Italy.
In the late 1970's, the ownership/management pattern for most hydrothermal electricity projects followed the scheme originally used at The Geysers. There, a public utility owned and operated the power plants, while the steam field was developed by private companies who sold steam to the utility. This pattern has changed markedly since about 1986. Most recent hydrothermal projects (field and plant) are owned and operated by a single entity, usually an independent power producer (IPP), rather than a utility. In this case, the utility buys electricity, rather than steam, from the producer. Currently, IPPs account for more than one-fourth of total installed geothermal capacity.
Utilities in three states -- California, Nevada, and Utah - constitute the major users of today's hydrothermal technology. Other users include geothermal developers, service companies, firms with multiple business interests (primarily petroleum and mining), equipment manufacturers, and entrepreneurs. Firms based in the United States dominate the domestic hydrothermal market, except for turbine-generator systems which are largely dominated by Japan and Israel.
10
P
Y
w
Y
w
3
Y
Y
u
u
Y
1.4 Industry Status
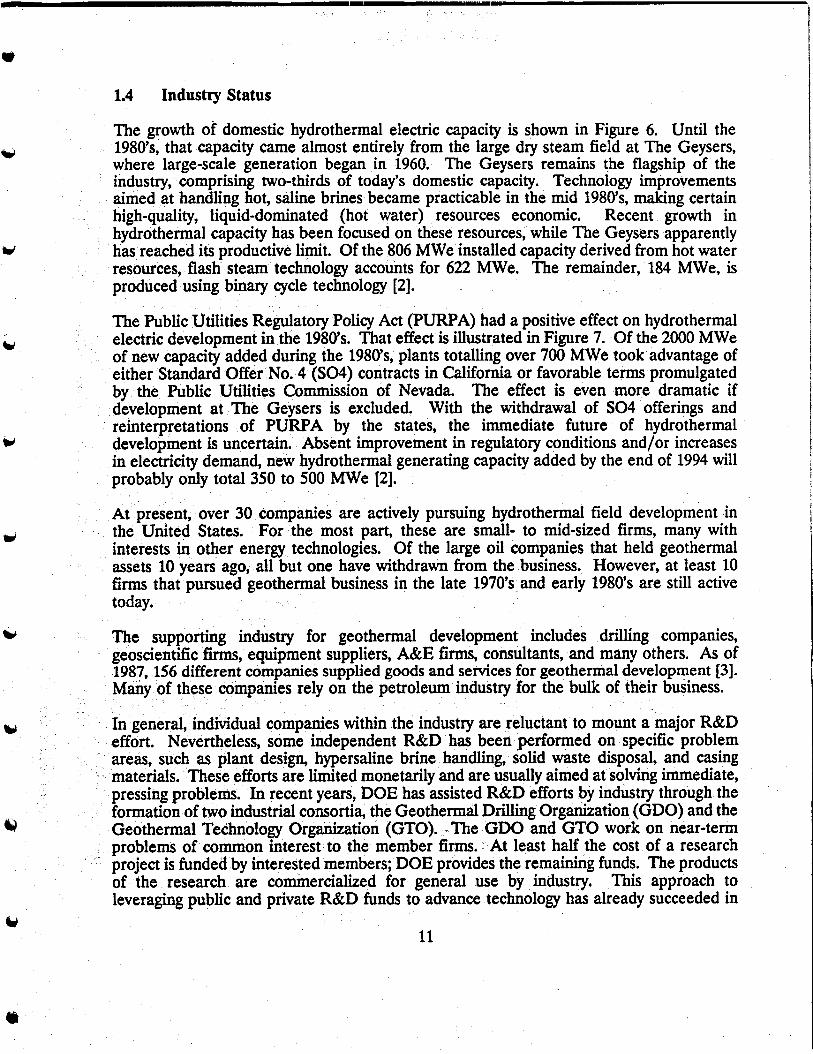
The growth of domestic hydrothermal electric capacity is shown in Figure 6. Until the 1980's, that capacity came almost entirely from the large dry steam field at The Geysers, where large-scale generation began in 1960. The Geysers remains the flagship of the industry, comprising two-thirds of today's domestic capacity. Technology improvements aimed at handling hot, saline brines became practicable in the mid 19803, making certain high-quality, liquid-dominated (hot water) resources economic. Recent growth in hydrothermal capacity has been focused on these resources, while The Geysers apparently has reached its productive li@t. Of the 806 MWe installed capacity derived from hot water resources, flash steam technology accounts for 622 MWe. The remainder, 184 MWe, is produced using binary cycle technology [2].
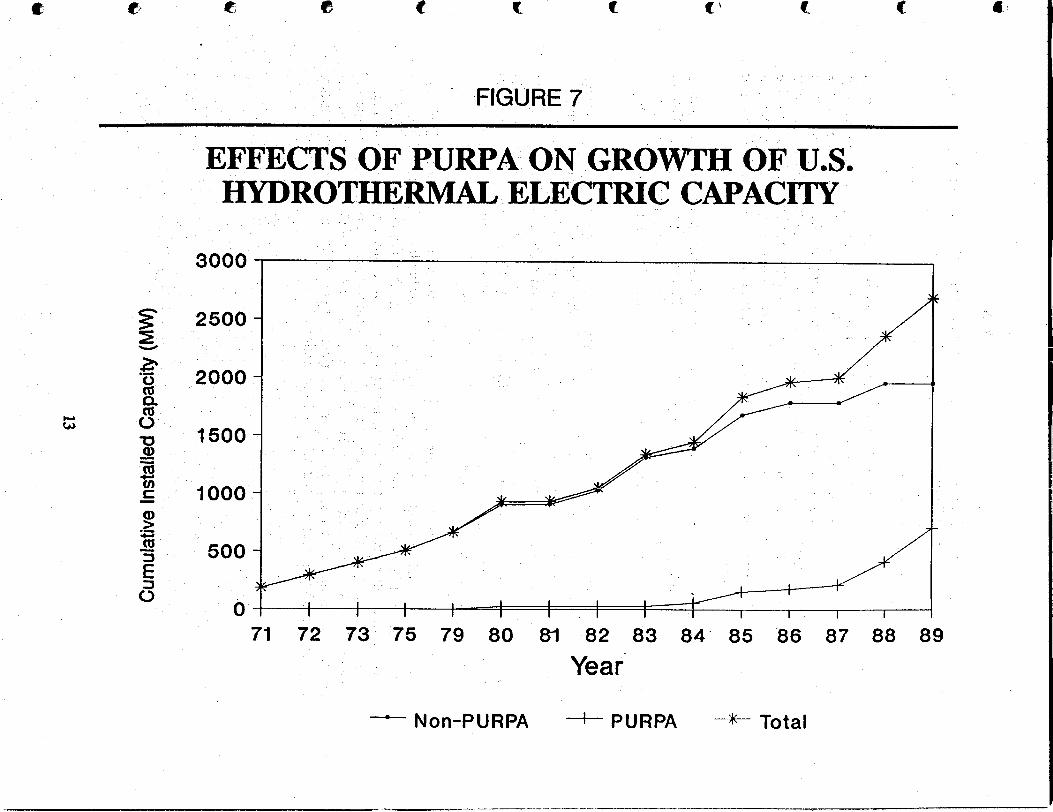
The Public Utilities Regulatory Policy Act (PURPA) had a positive effect on hydrothermal electric development in the 1980's. That effect is illustrated in Figure 7. Of the 2000 MWe of new capacity added during the 198O's, plants totalling over 700 MWe took advantage of either Standard Offer No. 4 (SO4) contracts in California or favorable terms promulgated by the Public Utilities Commission of Nevada. The effect is even more dramatic if development at The Geysers is excluded. With the withdrawal of SO4 offerings and reinterpretations of PURPA by the states, the immediate future of hydrothermal development is uncertain. Absent improvement in regulatory conditions and/or increases in electricity demand, new hydrothermal generating capacity added by the end of 1994 will probably only total 350 to 500 MWe [2].
At present, over 30 companies are actively pursuing hydrothermal field development in the United States. For the most part, these are small- to mid-sized firms, many with interests in other energy technologies. Of the large oil companies that held geothermal assets 10 years ago, all but one have withdrawn from the business. However, at least 10 firms that pursued geothermal business in the late 1970's and early 1980's are still active today.
The supporting industry for geothermal development includes drilling companies, geoscientific firms, equipment suppliers, A&E firms, consultants, and many others. As of 1987, 156 different companies supplied goods and services for geothermal development [3]. Many of these companies rely on the petroleum industry for the bulk of their business.
neral, individual companies within the industry are reluctant to mount a major R&D effort. Nevertheless, some independent R&D has been performed on specific problem areas, such as plant design, hypersaline brine handling, solid waste disposal, and casing materials. These efforts are limited monetarily and are usually aimed at solving immediate, pressing problems. In recent years, DOE has assisted R&D efforts by industry through the formation of two industrial consortia, the Geothermal Drilling Organization (GDO) and the Geothermal Technology Organization (GTO). The GDO and GTO work on near-term problems of common interest to the member firms. least half the cost of a research project is funded by interested members; DOE provid e remaining funds. The products of the research are commercialized for general use by industry. This approach to leveraging public and private R&D funds to advance technology has already succeeded in
11

I
0
2 5 0 n
Q
-
e3 Q
o Q
, r
I U
0
cu Q
o Q
, r
r
a0 Q
, F
0
Qo
Q,
r
I I
1 I
I I
I I
I t
I I
I I
e3
cu
cu
cu
cu
oi
rr
rr
rO
O
00
J 9
a? '9
s "!
0 a?
'9 s
"! ?'a?+ 2
"! 9
G b c L
ii
12
ce 6 e 8 c t t c
t;
' FIGURE 7
EFFECTS F PURPA ON GROWTH OF U.S. HYDROTHERMAL ELECTRIC CAPACITY
3000
2500
2000
1500
1000
500
0 71 72 73 75 79 80 8-l 82 83 84' 85 86 87 88 89
Year
Non-PURPA + PURPA -* Total ---c-

c bringing several new products to the marketplace. Both the GDO and GTO are growing and gaining support throughout the industry.
1.5 Market Acceptance and Experience
At the time the federal Geothermal Energy R&D Program was initiated in 1971, less than 200 MWe of dry steam generating capacity was in production at The Geysers and the nation’s first hot water demonstration plant was still nine years in the future. Hot brines from some reservoirs would scale production wells almost shut, corrode and erode turbine blades, and plug injection wells. Geothermal drilling costs were up to four or five times those of oil and gas drilling, yet drilling was necessary to identify, confirm, and characterize reservoirs in the absence of reliable geoscientific techniques adapted to geothermal conditions. No research into energy extraction from geopressured brines, hot dry rock, or magma had been conducted.
Today, many of the technical impediments have been removed or reduced, and a hydrothermal industry is well established in the United States, with nearly 2800 MWe of capacity installed in three states. Experience has extended far beyond The Geysers. At the end of 1989, 35 hot water plants were in operation, accounting for over 800 MWe of capacity.
In particular, considerable development is taking place at the Salton Sea Known Geothermal Resource Area (KGRA) reservoir in the Imperial Valley of southern California. This development could not have occurred without the lessons learned at the cooperative govenunent/industry Geothermal Loop Experimental Facility (GLEF) on
crystallizer/clarifier technology at this facility in the late 1970’s effectively opened an estimated 2000 MWe capacity in the Imperial Valley to economic use. A 34 MWe dual-flash plant is now at the site of the GLEF.
Despite these achievements, significant technical problems remain. Many investors still view hydrothermal projects as high-risk ventures. Reliable estimates of reservoir productivity and lifetime, two key investment parameters, often are not available. Drilling costs remain well above petroleum- industry averages. Inexpensive and dependable means of locating and confirming new resources, short of drilling, are lacking. An unexpected acceleration in degradation of the steam resource at The Geysers has contributed to
expansion of the market for hydrothermal electricity.
b
c
L
handling brines that are eight times saltier than sea water. Experiments with ‘c
&
investor uncertainty. Unless dealt with effectively, these problems may curtail future b
14

k
2.0 ECONOMIC STATUS
2.1 Figures of Merit
A figure of merit is a number that rates the relative attractiveness of some aspect of a project or technology. The figures of merit listed here are some of the major technology performance criteria commonly used by industry and the DOE Geothermal R&D Program.
w
r' Overall System Figure of Merit
Levelized Cost of Energy (Cents/kWh) - This is the main figure of merit for hydrothermal electric systems. It includes estimates of the risk of project failure or partial failure due to uncertainties in reservoir and technology performance.
Y
3
Y
Y
Q
w
Y
&y Figures of Merit=
To some extent, independent figures of merit can be estimated for hydrothermal "field technology" and "plant technology". When this is done, the dividing line should be drawn in terms of the ideal available work in the geothermal fluid at the power plant inlet, since the available work is highly sensitive to the temperature of the fluid. The field-related expenses then set an upper limit on the value of that work, regardless of conversion plant characteristics.
0 Net Brine Effectiveness (Wh/lb of brine) - This figure of merit describes the critical relationship between the power plant and the well system that supplies the plant. Its value is affected the most by reservoir temperature due to intrinsic thermodynamic factors, but it is also influenced by the power plant design. The higher this number, the less geothermal fluid is needed to make one kilowatt-hour.
Capacity Factor (%) - The capacity factor is the'amount of energy that a power plant produces, expressed as a percentage of the total amount that the plant would produce if it operated at rated capacity during the entire year. The factor is roughly equivalent to the percentage of time electricity is drawn from the generator and reflects the combination of power plant intrinsic availability and use of the plant for some fraction of that availability to meet electrical system demand.
Installed Capital Cost ($/kW) - This includes all engineering, equipment, and construction costs to bring the system on line, exclusive of interest accrued during construction. This figure of merit is one relatively simple way. to track technology improvements over time.
Operation and Maintenance (O&M) Cost ($/kW/Year) - This figure of merit includes all costs to keep the well field and plant operating.
15
Y

10
8
6
4
2
0
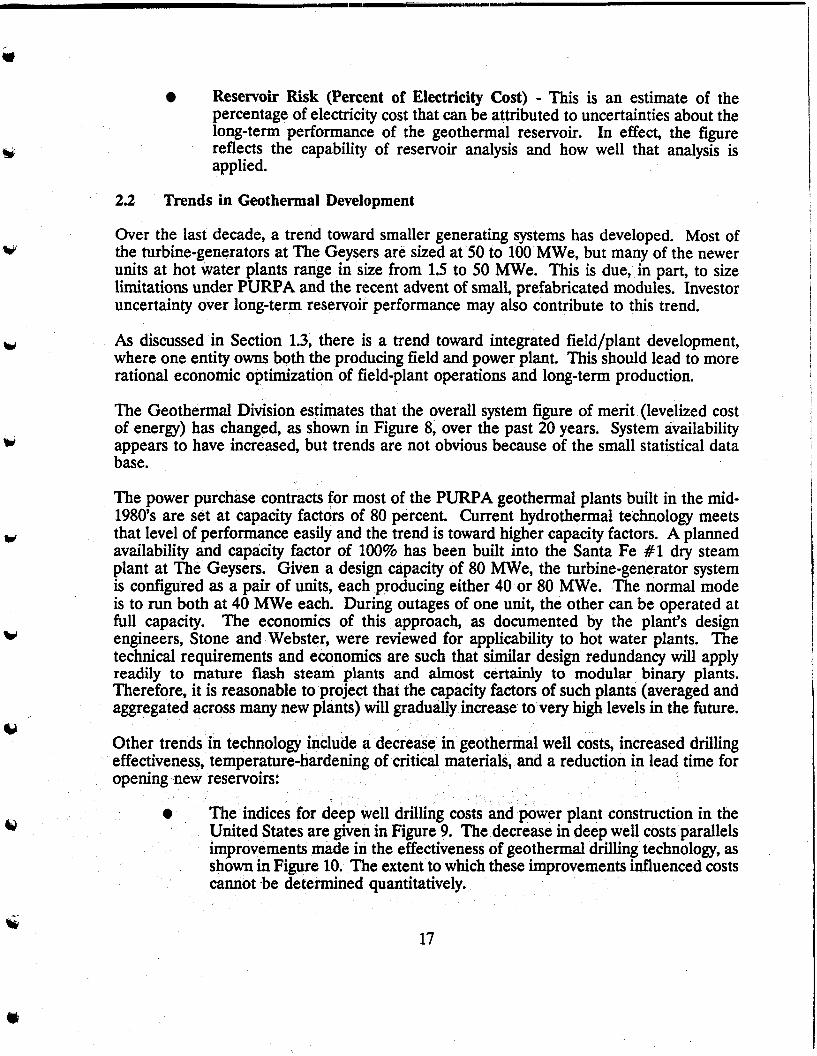
FIGURE 8
ESTIMATED IMPROVEMENT IN HYDROTHERMAL FLASH TECHNOLOGY
1 I I I I I I I 1-
1970 1972 1974 1976 1978 1980 1982 1984 1986 1988 1990 Year
Hydrothermal Flash -.c-
c c' E 1" R
V
W
3
U
w
Reservoir Risk (Percent of Electricity Cost) - This is an estimate of the percentage of electricity cost that can be attributed to uncertainties about the long-term performance of the geothermal reservoir. In effect, the figure reflects the capability of reservoir analysis and how well that analysis is applied.
2.2 Trends in Geothermal Development
Over the last decade, a trend toward smaller generating systems has developed. Most of the turbine-generators at The Geysers are sized at 50 to 100 MWe, but many of the newer units at hot water plants range in size from 1.5 to 50 MWe. This is due, in part, to size limitations under PURPA and the recent advent of small, prefabricated modules. Investor uncertainty over long-term reservoir- performance may also contribute to this trend.
As discussed in Section 1.3, there is a trend toward integrated field/plant development, where one entity owns both the producing field and power plant. This should lead to more rational economic optimization of field-plant operations and long-term production.
The Geothermal Division estimates that the overall system figure of merit (levelized cost of energy) has changed, as shown in Figure 8, over the past 20 years. System availability appears to have increased, but trends are not obvious because of the small statistical data base.
The power purchase contracts for most of the PURPA geothermal plants built in the mid- 1980's are set at capacity factors of 80 percent. Current hydrothermal technology meets that level of performance easily and the trend is toward higher capacity factors. A planned availability and capacity factor of 100% has been built into the Santa Fe #1 dry steam plant at The Geysers. Given a design capacity of 80 MWe, the turbine-generator system is configured as a pair of units, each producing either 40 or 80 W e . The normal mode is to run both at 40 MWe each. During outages of one unit, the other can be operated at full capacity. The economics of this approach, as documented by the plant's design engineers, Stone and Webster, were reviewed for applicability to hot water plants. The technical requirements and economics are such that similar design redundancy will apply readily to mature flash steam plants and almost certainly to modular binary plants. Therefore, it is reasonable to project that the capacity factors of such plants (averaged and aggregated across many new plants) will gradually increase to very high levels in the future.
0 Other trends in technology i lude a decrease in geothermal well costs, increased drilling effectiveness, temperature-hardening of critical materials, and a reduction in lead time for opening new reservoirs:
0 e indices for de ell drilling cos ower plant construction in the United States are given in Figure 9. The decrease in deep well costs parallels improvements made in the effectiveness of geothermal drilling technology, as shown in Figure 10. The extent to which these improvements influenced costs cannot be determined quantitatively.
y3
17

c
e( W
W
n
0
I E
0 C
8
Y
c t t" a .I - E P
@
0
0
I.
I I
I I
I
i i t t cr b
18 Q

f I 4. 1'
FIGURE 10
TECHNOLOGY IMPROVEMENT: DRILLING EFFECTX'IVENESS AT THE GEYSERS
Relative Feet per Hour t .3
1.2
1.1
1
lQ83
Year 1884 1886

FIGURE 11
HYDROTHERMAL TECHNOLOGY IMPROVEMENTS IN 'WELL CEMENTS
Temperature Limit, Degrees C 700
h) 0
76 79 60 81 62 63 64 65 66 87 68 89 90 91 92
Year
* Temperature projection by BNL
d f r c P

W
Y
3
Y
The useful temperatures for both wellbore cements and elastomeric sealing materials have been increased markedly over the last few years (see Figures 11 and 12). These improvements are now used extensively in both geothermal and oil/gas fields.
The mean time between initial discovery of a resource and first power production has decreased over the past two decades from about 20 years to about 6 to 8 years [4] (Figure 13). By installing relatively small (5 to 15 MWe net) plants, operators dre able to test a new reservoir for its capability to support larger capacities while generating income to reduce the carrying costs for discovery expenses.
Additional significant improvements in hydrothermal electric technology have occurred since early 1986 -- the date of the hydrothermal technology performance and cost baseline established by the Geothermal Division. For example, the annual service cost for downhole production pumps has been reduced to 43% of the 1986 baseline value, effective at the end of 1987; reservoir confirmation costs for the Salton Sea area have been decreased by 20%, effective mid-1988; the cost of sludge disposal from Salton Sea flash plants has been reduced to 40% of the 1986 nominal cost; and the service life of production liners at the Salton Sea field has been increased to 30 years, from a nominal 1 year, at a nine-fold increase in the cost of the liner.
Other important improvements that are not well quantified have also been made in the mid- and late 1980's. These advances include the development of the crystallizer-clarifier to prevent siliceous sludges from clogging injection wells; high-temperature wellbore sensors for measuring temperature, pressure, and other parameters; hydrogen sulfide abatement systems; long-bladed, high-efficiency turbines; automated power plant controls; automated field production controls; and upstream stripping of noncondensible gases via steam generators or reboilers.
21
e

FIGURE 12
w
HYDROTHERMAL TECHNOLOGY IMPROVEMENTS IN ELASTOMERS
326
300
276
260
226
200
1 7s
(Performance in static uses)
Temperature Limit, Degrees C
78 79 80 81 82 83 84 86 80 87 88
Year
r t

c
IMPR MENTS IN PACE OF RESERVOIR OPENING FOR POWER PRODUCTION
Successful Projecls Years to (excspl original Geysers)
Completion
I 5s 60 6 S 70 75 80 a 5
Year Discovery Well Completed
4'
Source: Geothermal Resources Council Bulletin, August 1988.

FIGURE 14
c:
BASELOAD ELECTRIC TECHNOLOGIES BASE AND ACCELERATED R&D CASES
- __ - - - - ___
12
I
1990 1995 2000 2005 2010 2015 2020 2025 2030 Year
---I- Coal --A HT - Base Case ( 1 - HT - Accelerated ---* - Oi I
Source: Rerrewuble Energy Technology Cliumcterizations, SAIC, 1990.
Lc\ L" Lc F t . I

Y
cy
W
v
0
Y
3.0 COST/PERFORMANCE PROJECTIONS
The projected improvements in the cost of electricity using hydrothermal technology are plotted in Figure 14. The gradual decline for the base case costs and the somewhat steeper decline and lower ending cost for the accelerated case are the estimated average costs for specific amounts of new hydrothermal electric capacity in western regions of the United States. A number of good quality hydrothermal reservoirs are competitive now with coal- and oil-fueled plants. Other hydrothermal reservoirs of lesser quality will become economic as technology improves. The coal- and oil-fueled cost projections are from Renewable Enerw _ _ Technolow Characterizations [5].
The base case scenario assumes that annual fiinding remains at the same level initially with modest increases in the latter part of this decade. The base case capacities (in units of MWe for 30 years) are predicated upon current trends in the rates of technology improvement (Figure 8) and projections of specific technology changes through research
The accelerated R&D case assumes an increase by a factor of 2 in funding level compared to the base case. Additional new capacity in the accelerated case is expected to result from an acceleration in the pace of technology development coupled with an increase in industry's rate of discovering new resources.
The base case cost projections in Figure 14 were derived only in part from the illustrative flash plant characterized in the hydrothermal section of Renewable Enerw Technology characterizations [5]. That plant is relatively expensive, but was selected to show how certain brine-handling issues have been resolved. The cost projections in Figure 14 also include the added consideration of the quality of available hydrothermal resources. They were developed from a detailed analysis of hydrothermal resources in the United States, current hydrothermal technology, and the feasibility of improving that technology through R&D [6]. As expected, these average costs are less than the costs estimated for the illustrative flash plant (Table 1).
3.1 Base Case Funding Scenario
The base case assumes initial funding of about $22 million per year with gradual increases leading to almost a doubling by the end of the decade. The technology improvements projected under this sce
3.1.1 Research Activities
The researc. ect portfolio for the base case is founded on industry's current major needs. Industry's highest priority concerns the unexpected drop in productivity (pressure and steam flow), coupled with the appearance of corrosive hydrogen chloride, in some areas of The Geysers field. Solutions to these problems will have to be found before the field's shut-in capacity (>400 MWe) can return to production.
[111.
A i
25

1990 1995 2000 2005 2010 2015 2020 2025 2030
CAPACITY FACTOR, Percent
I 81 83 85 88 90 93 95 95 95
Well Field 82 74 66 58 51
Power Plant 119 98 83 72 65
Total, Fixed O&M 201 171 148 l31 117
NOTES:
(a) = Based on a deslgn to accommodate hypersaline, high-temperature brines. (b) = Contingency included specifically to aver reservoir uncertainties.
45 39 33 28
60 57 54 52
105 96 87 80
e
26 e
L

r
Ls
w
Y
s3
w
U
W
Y
The lack of techniques to locate and characterize fractures in underground rock formations significantly inhibits industry's ability to tap consistently the areas of greatest fluid productivity. The result is that many reservoirs have not reached full production potential because they cannot be sufficiently characterized to apply cost-effective exploitation strategies.
Effective means are similarly lacking for identifying hydrothermal systems in regions where the underlying-heat has no obvious surface expression. This is particularly important in the Cascades Range of the Pacific Northwest where shallow, cool groundwater may mask a very large hydrothermal resource.
Injection of spent geothermal fluids back to the production zone is now practiced by virtually all field operators, both as a means of acceptable disposal and to prevent potential land subsidence due to the withdrawal of fluids. If done properly, injection can help maintain reservoir pressure, thereby extending the life of the field. Injection wells must be located so that premature cooling of fluids in the production zones will not occur.
Hydrothermal well costs have declined significantly at some geothermal fields -- the most economical are estimated to be only 50% more expensive than those of oil and gas drilling. However, at other fields, well costs still constitute a major deterrent to increased development. For example, titanium well casing at $1,000 per foot is being used in the harsh Salton Sea environment.
While large-scale binary cycle technology has been tested at a government/industry 45 MWe plant in Heber, California, this technology is marginally economic for commercial use. Further improvements in efficiency are needed to fully exploit intermediate- temperature reservoirs.
In the past decade, technically satisfactory and economical solutions have been found for many of the adverse interactions between hydrothermal brines and energy extraction equipment and materials that seemed intractable in the early 1970's. However, since the remaining adverse interactions differ from reservoir to reservoir, methods to predict or quickly detect them are needed, along with reductions in the cost of materials that will withstand them.
3.1.2 Base Case Technology Development Scenario
The details of the hydrothermal energy cost projections for the base case are shown in Table 1. They are the cost and capacity factor values for the illustrative dual-flash plant in Pene wable Enerm Technolow Characterizations. The system parameters assumed for that flash plant are shown in Table 2.
27

TABLE 2
mROTHERMAL (HOT WATER) SYSTEM DESCRIPTION
(1986 Technology Baseline)
System Type System Design Capacity, MW net Average Well Depth, Feet: Reservoir Saturated Temperature, "C: Total Dissolved Solids, Percent: - Net Brine Effectiveness, Watthour/lb: Producer Well Average Flow, Klb/hr: Financing Assumptions
Dual Flash (a) 50
6000 266 32
400 Utility-Owned
7.8
Notes:
(a)The system described here is similar to Magma Power Comnanv's "Vulcan" dant at Niland. California.
The reasonableness of the cost improvements predicted for the base case is supported by two sets of analyses: (I
Detailed quantitative statements of research program objectives, originated by research program managers and integrated through a systematic cost-of-energy computer model, IM-GEO. These objectives suggest a reduction of 25% to 35% in the cost of energy across a variety of reservoirs
Quantitative analysis of possible cost reductions through "learning" curves or "experience" effects. These suggest that a reduction on the order of 50% in the cost of energy could be achieved sometime in the early part of the next
during the mid-term [ll]. G
century [7]. t
3.2
The accelerated R&D funding scenario assumes about double the funding of the base case.
3.2.1 Research Activities bl
Accelerated Hydrothermal R&D Funding Scenario
The accelerated R&D case assumes that research prescribed under the base case will be accomplished sooner and adopted by industry at a faster pace. Additional specialized R&D initiatives beyond the base case would include:
b
28

Y
Y
u
3
w
Y
Advanced Exploration. Methodology - This cost-shared initiative would examine the latest, most sensitive geoscientific technologies (e.g., seismic refraction, geotomography, remote sensing) that can be used to identify hidden hydrothermal systems. These technologies would be evaluated to judge their merits, both technical and economic, as exploratory tools. In addition, natural phenomena (e.g., optical, electromagnetic, gravitational, chemical, and biological) would be studied to determine whether they offer promise for further development as innovative exploration techniques. Advanced methods of data processing and interpretation would be applied to extract holistic informa.tion from a combined set of exploratory observations. The final methodology (tools and techniques) would be field tested and verified in cooperation with industry.
Innovative Hard Rock Drilling System - In order to make substantial reductions in the cost of geothermal drilling, this initiative would adapt the latest cost-saving innovations from other industries. At a minimum, these would include high-angle drilling to improve the dry hole ratio in fractured reservoirs and continuous coring to reduce costs and increase data returns from exploratory wells. New, untried approaches would be evaluated for their technical and economic feasibility. Critical supporting technology, such as resistant materials and coatings, bonding materials, real-time information flow, and control systems, would be upgraded. At least one complete prototype system would be built and tested with industry cost-sharing.
Modular Energy Conversion System - In a cooperative cost-shared effort, DOE and industry would develop an energy conversion unit based on advanced binary cycle technology. The system would be designed for adaptability to a wide range of geothermal reservoir sizes and characteristics, for transportability, and for ease of factory fabrication and on-site assembly. The project would include the design, fabrication, and field testing of a prototype unit. The participating companies would acquire or retain proprietary rights to the system.
Geothermal Heat Pump Emplacement System - This initiative would create a quick and inexpensive method of drilling shallow heat exchange wells for
, geothermal heat pump applications. Target specifications for the system installation of three, 30-meter wells to service one
ing technology development would include improved in- ground heat exchangers, methods to measure critical parameters in situ, and control systems to maintain peak performance. The final integrated system would be tested by industry under a range of operating conditions.
0
29

TABLE 3
SYSTEM COST ESTIMATES, BASED ON SUPPLY ANALYSIS G
BASE CASE
Cap Cost OM Fixed Cap Fac Level. COE Year ($/kW) ($/kW/yr) (a) (cents/kWh)
1990 1995 2000 2005 2010 2015 2020 2025 2030
2178 2136 2087 2039 1993 1946 1899 1829 1760
181 154 133 118 105 95 86 78 72
81 83 85 88 90 93 95 95 ’
95
5.74 5.17 4.70 4.28 3.96 3.64 3.4 1 3.23 3.07
ACCELERATED CASE
Cap Cost OM Fixed Year ($/kW) ($/kW/yr)
1990 1995 2000 2005 2010 2015 2020 2025 2030
2178 2041 1902 1767 166 1 1622 1583 1565 1565
18 1 147 121 102 88 79 72 65 64
Cap Fac (%)
81 83 85 88 90 93 95 95 95
Level. COE (cents/kWh)
5.74 4.94 4.29 3.71 3.30 3.04 2.84 2.74 2.72
b
30

3.2.2 Accelerated R&D Technology Development Scenario
Details of the hydrothermal energy cost projections for the accelerated R&D case are shown in Table 3 and Table 4. The base case values are included for comparison. (Note that the base case shown in Table 3 differs from that given in Table 1. The cost estimates in Table 3 are considered more representative of the broad range of hydrothermal resources, whereas Table 1 is illustrative of a hypersaline resource.) The values from Table 3 were prepared and used for market penetration analyses within the NES. These are the values plotted in Figure 14.
Additional information concerning the rationale for expected improvements from the accelerated case can be found in Section 4. Technology transfer and cooperative assistance programs are expected to speed up industry's adoption of the improvements and produce feedback on needs for further improvements.
TABLE 4
ELECTRIC CAPACITIES ESTIMATED TO BE AVAILABLE AT STATED AVERAGE COSTS
-
Net GWe (for 30 Years) Region Base Case Accelerated Case
6 10 15 7 0 0 8 10 15 9 20 30
10 20 30
3.3 Beyond Hydrothermal Funding Scenario
The exploitation of hot dry rock and geopressured resources may occur if federal geothermal research is markedly increased beyond the hydrothermal accelerated R&D case. The incentives for shifting to hot dry rock include: (1) the resource base is widespread and exceeds 160,000 quads [l]; (2) if viable, the technology is probably economic today in a few areas of high-temperature gradient; and (3) at least five other nations are actively pursuing hot dry rock research. Geopressured resources, which contain various amounts of dissolved methane, are estimated at more than 73,000 quads of thermal energy and 5,700 quads of energy from methane [l]. The higher temperature fluids have the potential for power generation; the lower temperature fluids may be utilized in direct heat applications, such as thermal enhanced oil recovery. The entrained methane gas may be separated from the fluid and used to generate electricity or sold as natural gas. While some direct applications appear attractive, widespread use of geopressured resources largely depends on the economics of natural gas. Hot dry rock, on the other hand, is more
31

TECHNICAL ASSUMPTIONS FOR HOT DRY ROCK ECONOMIC SUPPLY ANALYSIS
Class
1: 2: 3: 4: 5:
Temperature Gradient Assumption, "C/km
Mapped Power Plant Contour Design Datum
e 20 20 20 - 30 30 30 - 50 40 50 - 70 60
> 70 80 I
Heat to Electric Convers. Effie., Percent
9 12 17 17 17
Thickness of Mined Layer, Meters
500 500 500
1,OOo 1,500
Maximum Capacity Density, MWe/Sq.Mi.
39 52 73
147 220
TABLE 6
ESTIMATED HOT DRY ROCK ELECTRICITY COST, CENTS/kWh
Temp- Grad. Class
1. 2. 3. 4. 5.
TECHNOLOGY STAGE
Today Mature Doublet"' Triplet"
106.3 69.7 50.2 39.2 30.8 19.3 13.0 10.5 15.2 9.8 6.8 5.7 7.9 55 4.0 3.6 6.0 4.5 3.4 3.2
Notes:
(a) "Doublet" and 'Triplet" are optimized patterns for connecting wells [8].
u
b
t
e 32

cp
3
w
Y
w
d
sensitive to improvements in technology. For this reason, the following case specifically addresses only hot dry rock.
This case assumes funding of about 3.5 times the amount projected for the base case over the next decade. Much of the increase is planned for cost-shared, cooperative demonstrations of advanced geothermal technology.
x3.1 Research Activities
Early research under this case would investigate the feasibility of drilling large diameter wells in deep, hot crystalline rocks at one-half to one-third of current costs. The research planned for the hydrothermal accelerated case to develop an innovative drilling system would be intensified. Accelerated development would require expensive reservoir development and demonstration projects and at least one commercial-scale power plant project that would be federal/state/private cost-shared.
The final target technology improvements are expected to be great enough that at least some resources in all regions of the United States would be economic to develop. Initially, however, only the highest gradient areas (>70"C/km) would be attractive targets. These areas lie in the western states.
Early hot dry rock (HDR) development is assumed to occur in the vicinity of developed hydrothermal fields, either as secondary recovery of heat within the naturally fractured part of the reservoir or as primary heat extraction from deep, unfractured hot rock. This assumption minimizes initial exploration and confirmation costs for applications of the technology . 3.3.2 Beyond Hydrothermal Development Scenario
System costs for this analysis are taken from a study by Tester and Herzog [8]. The general resource assumptions are shown in Table 5. The financial assumptions are the same as those used in R R _ - haracteriza ions, except that the system life is 20 years. Construction time is assumed to be 2.5 years at the mature stage of technology development. The estimated cost of electricity, in 1989 constant dollars, is shown in Table 6. The results suggest that, even with today's technology, HDR is marginally economic in areas with the highest quality resources.
Only a portion of the economic HDR resource will be developable, due to constraints of market factors, physical limitations, and socioeconomic factors. This analysis assumes that about 10% of the economic HDR resource would be practicable to develop. (Some experts estimate the "developable fritction" to be as high as 30%.) At the 10% assumption, the full (technically feasible) potential is about 19,OOO GWe.
The cost projection for HDR is shown in Table 7. The results represent average costs across a resource that could support at least 3,800 GWe of installed capacity in the western states with a system lifetime of 20 years. Foi comparison, the curreiit installed electric capacity in the United States for all types is about 600 GWe.
33

TABLE 7
TECHNOLOGY CHARACTERIZATION COST PROJECTION FOR HOT DRY ROCK
1990 1995 2000 2005 2010 2015 2020 2025 2030
CaDital
3,45 1 3,45 1 3,189 2,667 2,206 1,807 1,582 1,559 1,543
O&M
156 156 145 122 106 98 87 81 77
CentdkWh
8.2 8.2 7.5 .
6.3 5.3 4.5 4.0 3.8 3.7
c
Li
34
e

4.0 RATIONALE FOR TECHNOLOGY IMPROVEMENTS
Y
W
Y
td
J
e
The relationship of hydrothermal electric technology to reservoir properties is complex. Some of the main paths through which hydrothermal reservoir characteristics affect the cost of electricity are shown in Figure 15.
Many of the improvements that remain to be made for hydrothermal technology will depend on improving the general ability to measure and predict reservoir characteristics. Other improvements will come from advances in the mechanical components of energy extraction and conversion technology.
Three states of technology maturity are presented here:
Current Technology - Hydrothermal technology in use as of the late 1980's.
Intermediate Target Technology - That technology expected to result from the geothermal R&D program, as currently planned through the 1990's.
Ideal Technology - Technology that could theoretically be achieved over a long period through a combination of intense applied research and learning from industry experience.
Quantitative projections for the three technology states are shown in Table 8, sketched there for a Salton Sea-like flash plant. The states were analyzed assuming capacity factors of 0.80; different capacity factors are used elsewhere in this report.
The "Intermediate Target Technology'' state is based on a quantitative analysis of the technical objectives of the geothermal R&D program [ll]. Reviewers from the geothermal industry and research community agree that this target could be achieved before 2005 through incremental improvements in current technology. This state will be reached in 2000-2005 in the base case and about 5 years earlier in the accelerated case.
The "Ideal Technology" state is a more speculative picture that assumes moiest to large breakthroughs in most geothermal electric subsystems. This state is assumed to be reached in perhaps 2040 in the base case arid about 2025 in the accelerated case.
4.1 Current Technology (1990)
mainly that defined by the technology assessment for the IM-GEO model [9,10]. IM-GEO presents users with the results of cost/risk analyses for eight plant-site combinations that represent a range of typical hydrothermal electric projects. The basic data for these analyses were gathered from industry sources at 10 operating hot water plants. Data on exploration, drilling, and other ancillary activities were provided by contacting various geothermal service organizations. Thus, IM-GEO gives a baseline condition of hydrothermal technology as of 1986. Modest improvements attained
0
assumed for 199
35

FIGURE 15
IMPACT POINTS OF RESERVOIR AND TECHNOLOGY VARIABLES ON HYDROTHERMAL SYSTEM COSTS
w ut
RESOURCE VARIABLE SYSI'EM PERFORMANCE AND COST VARIABLES
Reservoir Geology
Reservoir Geophysics
Well Depth
Rock Hardness
Reservoir %mperature
Brine Chemistry
"ECHNOLOCY VARIABLE Exploration
Reservoir Analysis
Borehole Location
Drilling & Completion
Power Plant Design
Brine Chemistry & Materials
SYSTEM COSTS
Discovery Capital Cost
Production
and O&M Cost -Field Capital
+ Rant Capital and
-t O&MCost
tc L"

TABLE 8
EXPECTED PROGRESSION OF HYDROTHERMAL ELECTRIC # PERFORMANCE AND COST
TECHNOLOGY STATUS ESTIMATE
Intermediate Ideal Y Technical Parameter Current Target Technology
1. Producer Well Average Flow,
2. No. Wells Drilled in
3.
4. Brine Effectiveness,
1000 lb/hr
3 Construction Phase Base cost (No Risk) of well,
$K
Net Watthour/lb 3 5. Flow into Plant,
Million lb/hr
396 473
26 20
1,123 966
7.8 8.2
6.4 6.1
562
14
786
9.5
5.3 6. System Desi& Capacity
Factor, % 80 80 80
CAP, Cents CAP, Cents CAP. Cents r3 Cost Account M /kwh $M /kWh $M /kWh
W
3
1. Identify Reservoir 6.1 0.13 4.7 0.10
4. Downhole Pumps 0.0 0.00
2. Confirm Reservoir 17.6 0.41 8.4 0.19 3. Prod./Inject. Wells 41.3 1.79 28.4 1.27
5. Gathering Equip. 6.1 0.23 6. Make-up Wells 0.0 0.43 0.0 0.24 7. Power Plant (Core) 1.78 41.3 1.74 8. Brine TDS Effects 9. Gas Handling 10. Reservoir Insuranc ---
0.8 4.0 12.5 0.0 4.1 0.0 41.0 16.4 2.7 3.8
0.01 0.08 0.47 0.00 0.13 0.06 1.44 0.54 0.10 0.10
Total Cost: 142.6 6.95 115.4 5.39 85.3 2.94
37

since then via federal and industry innovation successes have been added to bring the technology baseline up to the present.
IM-GEO, in part, emphasizes a novel and detailed analysis of how financial risk (from the viewpoint of investor or lender) is affected by uncertainties in the measurement and prediction of reservoir performance. This model has led to an improved ability to analyze the direct economic benefits of all geothermal research activities. Reservoir technology research can now be evaluated on a basis comparable to that traditionally used for estimating the future economic effects of improved drilling and power plant technology.
Current hydrothermal technology includes major spinoffs to other use sectors. These spinoffs are important because they demonstrate that the R&D program has selected technology improvement targets that are attainable and significant. In particular, spinoffs from geothermal drilling technology are important because the geothermal market is small compared to that for oil and gas, and geothermal equipment is usually not economical to manufacture unless broader applications exist in oil and gas drilling. The following three examples from the Department's research program of the 1980's illustrate the importance and benefits of spinoffs:
Polycrystalline diamond compact (PDC) drill bits - These bits drill 3 to 5 times faster in many formations and With longer lifetimes than standard roller-cone bits. Sandia National Laboratories has estimated that PDC bits now account for roughly $300 to $500 million per year in sales to oil and gas drillers worldwide.
EDPM (Y-267) elastomer - This high-temperature, rubber-like sealing material was developed by Brookhaven National Laboratory and L'Garde Corporation. EDPM (Y-267) enabled many existing drill bit designs to be used at high temperatures without redesigning critical seals. The material has other uses such as in downhole packers for pressurizing rock formations. EDPM (Y-267) is now used extensively in tertiary oil recovery applications and in chemical and nuclear plants.
High-temperature electronic components - Sandia National Laboratories has successfully adapted electronic components from the nuclear weapons program to high-temperature environments. These devices, such as amplifiers, are now used in many oil and gas downhole measurement tools made by drilling service companies. They are cost-effective in most very deep wells where elevated temperatures always pose equipment survivability problems.
These examples demonstrate the general utility of past geothermal technology improvements and the successful transfer of technology to industry. They portend the benefits future improvements may bring.
38

Y
Y
4.2
The base case assumes that current technology improves at a pace and in a direction established over the last 2-3 years. With respect to hydrothermal technology, that pace and direction are expressed in terms of the technical research objectives that the Geothermal Division has established to guide its research planning and management [ll].
Mid-Term Base Case Projections (1995-2005)
The R&D program's technical objectives are defined on three distinct levels. Level I objectives are associated with geothermal resource categories (e.g., geopressured) and provide a target for decreasing the total cost of electric power generated from a particular type of geothermal resource. &vel XI objectives address incremental improvements in the cost and/or performance of major system components. Level 111 objectives identify individual research activity targets for improvements in the cost, efficiency, and dependability of materials, tools, equipment, methods, and processes related to major
Y system components.
The achievement of Level I objectives depends on the achievement of the Level I1 and Level 111 objectives. The Level 111 objectives and associated research activities are the most dynamic part of the research program. All of the base case objectives are expected to be attained during the period 1995 to 2005. However, the full impact of the improvements may not be felt by industry for at least five years.
V
3 9
W
Y
The following sections present objectives in technology improvements for the three major areas of hydrothermal R&D: Reservoir Technology, Hard Rock Penetration, and Conversion Technology.
This area deals with reducing the risks associated with finding, confirming, and producing hydrothermal resources. Improvements expected to be gained through R&D in this area are:
Exploration - The Cascade Range of the Pacific Northwest is considered by many experts as a hydrothermal province with major potential, but exploratory efforts by industry have failed to uncover that potential. Government/industry cooperative efforts will lead to better understanding of the nature of hydrothermal resources in the Cascades. This activity is expected to increase
cially those in frontier areas such as the Cascades, by 20%.
,
0
' the success ratio of wildcat exploration
e ervoir Analysis - The products of this work are the analytic and rpretive tools needed by industry to determine reservoir characteristics
and performance with greater certainty, These tools include geophysical instruments to measure reservoir parameters (e.g., temperature, porosity, permeability) as well as models that simulate reservoir behavior. With improved reservoir analysis, uncertainties are reduced and project costs will fall. "he expected improvements will:
W
Y
39

-- Reduce the number of wells needed to define the resource by 33%.
-- By increasing the accuracy and precision of information used by models of reservoir characteristics and performance, decrease uncertainties in forecasting short-term and long-term reservoir changes in fluid temperature, pressure, flow rate, and chemistry by 10%.
-- --
Reduce uncertainties in predictions of reservoir capacity by 15%.
By improving reservoir evaluation methods, decrease uncertainties in forecasting short-term and long-term reservoir changes in fluid temperature, pressure, flow rate, and chemistry by 15%.
Reduce the number of wells needed to evaluate a reservoir by 10%. -- Brine Injection - Recent pressure declines at The Geysers steam field exemplify the need to conserve hydrothermal liquids with an injection program. Some injection programs at hot water fields have achieved only marginal success. This work provides the means to evaluate injection alternatives and devise strategies that will maintain reservoir integrity (Le., productivity and lifetime). The expected improvements will:
-- Increase the success ratio of in-fill wells for production and injection, Le., decrease the dry hole ratio for in-fii wells for production and injection by 33%.
-- Improve methods for positioning and designing geothermal production and injection wells in order to reduce the aggregate cost of wells by 15%.
-- Improve reservoir monitoring methods to decrease uncertainties in forecasting short-term and long-term reservoir changes in fluid temperature; pressure, flow rate, and chemistry by 10%.
-- Reduce the number of low-flow and short-lived production and injection wells drilled after production begins by 15%.
-- Improve the efficiency of the production and injection schemes to reduce the number of make-up wells by 10%.
-- Reduce uncertainties related to long-term reservoir changes in fluid temperature and injection breakthrough by 10%.
-- Reduce the number and severity of unexpected environmental problems, especially those related to potential seismicity and subsidence.
40 e

Hmd Rock Penetmtro ' n
Wells constitute 30%-50% of the cost of a hydrothermal power plant. Whereas reservoir technology R&D seeks to reduce risk by minimizing the investment in drilling wells, R&D in hard rock penetration deals with reducing the cost of individual wells. The expected improvements associated with drilling technology include:
Lost Circulation Control - Loss of drilling fluids into fractured rock can effectively double drilling costs due to downtime. Special drilling fluids (e.g., foams, cements) and emplacement tools suited to hydrothermal environments will help reduce or curtail these losses. Costs associated with lost circulation
. episodes are expected to be reduced by 30%.
Rock Penetration Mechanics - This area will produce integrated systems for increasing the efficiency of collecting core from deep geothermal wells and reaching shallow aquifers suitable for geothermal heat pump applications. The costs of deep wells and directionally drilled wells are expected to be reduced by 10%.
Wellbore Instrumentation - This work focuses on the development of probes which can give reliable information about the hydrothermal environment. State-of-the-art probes, including a radar fracture mapping tool, flow meter, and pressure sensor, will be fabricated. A unique downhole microprocessor with memory capability will be developed to avoid the need for expensive cable for data transmission. The expected effects of this research will:
-- Decrease the cost of drilling production-related geothermal wells by about 5% through better identification of fractures.
Decrease the uncertainties in measurements of downhole and wellhead temperature, pressure, and flow measurements for moderate-
-- e uncertainties for similar measurements at reservoir
0
0
-- reservoirs by 25%.
temperatures greater than 250°C by 50%.
Conversion Technology
To a large extent, this area focuses on improving the efficiency and cost-effectiveness of surface systems, including piping, turbine-generators, condensers, pumps, and so forth. The research activities concentrate on three areas in which the greatest improvements are
a ed conversion efficiencies for moderate-temper resources using binary cycle technology. Better efficiencies will be obtained from the use of supersaturated vapor expansions, countercurrent integral condensation with recuperation, and the
y3 expected:
Y 41

optimization of operating parameters and mixed working fluids. Modifications to reduce cooling water make-up requirements in arid areas will be pursued. The expected improvements will:
-- Increase net hydrothermal fluid effectiveness of binary plants by 28%. c
-- Reduce cooling water make-up requirements for hydrothermal power plants by .20%.
Materials - A serious deterrent to the expanded use of hydrothermal resources has been the lack of economic, durable construction materials for handling hot brines and other fluids associated with hydrothermal power generation. These fluids, with concentrations as high as one-third total dissolved solids, can be extremely corrosive and can deposit scale on exposed
Resistant materials, such as stainless steel and titanium, are durable, but expensive. This research will continue to find low-cost alternatives in the form of new or reformulated elastomers, cements, and polymer-concrete linings for metals. The expected improvements will result in:
-- Well cementing materials with a service lifetime of 30 years at high temperatures.
t 0
surfaces. Under such conditions, conventional materials deteriorate quickly. c
(r
-- A corrosion-resistant and low-fouling heat exchanger tube material costing no more than one-third the cost of high-alloy steels.
Advanced Brine Chemistry - Hydrothermal fluids contain a myriad of chemical compounds, many of which can interfere with efficient plant operation or can create an environmental hazard. These fluids tend to be highly reactive, leading to corrosion and scaling of equipment surfaces. Treatments, such as
This work will provide the basic chemical knowledge of fluid behavior in order to apply such treatments in a prudent, cost-effective manner. Efforts will continue to devise a system to detoxify hydrothermal wastes with biochemical processes. The expected improvements will:
G
inhibitors, can control many effects of hydrothermal fluids. 4
-- Reduce geothermal production well maintenance costs related to scale b deposition by 20%.
Reduce geothermal field surface equipment costs related to scale deposition by 20%.
-- Reduce geothermal power plant maintenance and equipment replacement costs related to scale deposition by 20%.
-- (Li
-- Reduce cost of surface disposal of sludge from geothermal brines by 25%. e
42

4.3
The accelerated case contains the base case and its resultant technology improvements, plus advances brought about by new initiatives. Whereas the base case provides for gradual, systematic changes in technology that may take many years to have a widespread impact, the accelerated case offers quantum jumps in technology that could make more hydrothermal resources economic much sooner.
Mid-Term Accelerated Case Projections (1995-2005)
u
- Y
Y
Four initiatives are proposed to aug,ment the base case, which will result in the following improvements: (1) a synthesis of resource exploration methods directed toward locating and characterizing the nation's undiscovered hydrothermal resources which the USGS has estimated as high as 2000 quads; (2) an innovative drilling system (e.g., continuous coring; spallation) to reduce drilling costs by as much as 50% during the mid-term, making them comparable to oil and gas drilling costs; (3) a modular energy conversion system to hasten production from new fields with high or speculative risk; (4) an emplacement system and related equipment for geothermal heat pumps which should remove a major deterrent to wider application of this technology.
The accelerated case yields only modest decreases in cost (10%) or an effective acceleration of roughly five years in market penetration during the mid-term. While these gains are significant for a technology that is already commercially proven, the real benefit of the accelerated case lies in the large resource base made available for production. The estimated potential generation capacity deemed likely to be developed increases from 25,000 MWe in the base case to about 45,000 MWe in the accelerated case. This improvement is the product of all the initiatives, but primarily the two directed at exploration and drilling. The full cumulative effects of the accelerated case are expected to be felt beyond 2005, after the improvements have permeated throughout the industry.
4.4 Long-Term Projection (>
In an active, evolving technology such as hydrothermal, improvements in cost and efficiency will continue to be made. The influences of innovations from related fields and new scientific insights into hydrothermal processes, along with axi ongoing R&D effort, will ensure the improvements. Barring some unforeseen major breakthrough outside the bounds of the base program and initiatives, further improvements in hydrothermal technology will be incremental, methodical, and gratiual. However, they wil l have a major cumulative effect over 25 years. The future effects of the base case and accelerated case relative to current technology is shown as "Ideal Technology" in Table 8. The total cost of energy is expected to be reduced from current levels by almost 60%.
W
*
13
Y
u
4.5 Beyond Hydrothermal h
By definition, hydrothermal resources require the coincidence of heat as an energy source and water as a transport medium. This requirement places constraints on the quality, quantity, and distribution of hydrothermal resources. These constraints can be relaxed with the hot dry rock (HDR) resource, which requires only an accessible heat source in fairly
0
43

impermeable rock. At depth, such conditions constitute the norm in the earth’s crust, making HDR a ubiquitous resource.
HDR extraction technology requires the accurate placement of wells in a volume of hydraulically fractured rock. Water is circulated through the fractures using injection wells, becomes heated by the rock, and is produced via other wells. After energy extraction at the surface for power generation or direct use, the water is recirculated to the fractured rock reservoir.
HDR technology and hydrothermal technology are similar and mutually supporting. Improvements in hydrothermal technology have comparable application to HDR and vice versa. Any differences are ones of emphasis. For instance, HDR requires the use of well stimulation techniques, typically hydraulic fracturing, to create a reservoir; hydrothermal development usually does not require massive stimulation.
The strong similarities between the technologies suggest that initial application of HDR technology may be at or near the fringes of a hydrothermal field. In fact, HDR experiments have been proposed as a means of dealing with the reservoir problems at The Geysers.
While HDR technology has not yet been proven commercially feasible, experiments by LQS Alamos National Laboratory in the late 1970’s and early 1980’s demonstrated the engineering feasibility of the concept. A reservoir was created in hydraulically fractured rock at a depth of about 9OOO feet and water was circulated through the reservoir using two wells. The closed-loop system ran continuously for 286 days at power levels of about 2.5 MWt (150°C) before the experiment was terminated. Since then, the British have operated a small HDR loop continuously for more than three years.
Today, HDR research programs are active in Germany, France, Japan, and the Soviet Union, as well as in the United States and the United Kingdom. The United States effort revolves around a long-term flow test of a commercial-scale, building-block reservoir. This test, plus ambitious developments planned by the European Community and Japan, will establish the feasibility of HDR as a marketable energy source.
HDR is geothermal technolopy for the 21st century, after the potential of hydrothermal resources has been fully exploited. It is a logical successor to hydrothermal; hence, its considerable potential should be assessed in planning the nation’s long-term energy supplies.
44

Y
iG
w
v
3
v
BIBLIOGRAPHY
1.
2.
3.
4.
5.
6.
7.
8.
9.
10.
11.
Meridian Corporation, Charjicterization of U.S. Energv -- Resources and Reserves, Prepared for: Deputy Assistant Secretary for Renewable Energy, U.S. Department of Energy, June 1989.
Rannels, J.E. and McLarty, L., "Geothermal Power Generation in the United States - 1985 through 1989," Proceedings of the Geothermal Resources Council Annual Meeting, August 1990.
Geothermal Resources Council, Listin. of United States Companies That Supplv Goods and Services for Geothermal' Explorers. Developers and Producers Internationallv, August 1987.
Erskine, M.C., Jr. and Coyle, E.P., Geot hemal Resources Bulletin, August 1988.
SAIC, "Renewable Energy Technology Characterizations," Alexandria, Virginia, September 10, 1990.
U.S. Department of Energy "Revised Technology-Characterization Cost Data for Hydrothermal Electricity as Inputs to FOSSIL-2 and SAIC Spread-Sheet Models," May 8, 1990.
Krawiec, F. and Flaim, T., "Solar Cost Reduction Through Technical Improvements: The Concept of Learning and Experience," Solar Energy Research Institute, Report RR-52-173, 1979.
Tester, J.W. and Herzog, H.J., "Economic Predictions for Heat Mining: A Review and Analysis of Hot Dry Rock Geothermal Energy Technology," July 1990.
Petty, S., Entingh, D., and Livesay, BJ., "Impact of R&D on Cost of Geothermal Power - Documentation of Model Version 2.09," Contractor Report to Sandia National Laboratories, SAND87-7018, February 1988.
Traeger, R. and Entingh, D., "Quantiwng the Cost-of-Power Impacts of federal Geothermal R&D," Proc eedings of the Geothermal Technolow Division Proeram Review VI, San Francisco, California, U.S. Department of Energy, April 1988.
Division, April 1989. U.S. Department of Energy,
45