evolution of chemical and biological characterization ... · pdf fileevolution of chemical and...
TRANSCRIPT
ORIGINAL RESEARCH
Evolution of chemical and biological characterizationduring agitated pile composting of flower waste
Dayanand Sharma1 • V. Sudharsan Varma2 • Kunwar D. Yadav1 • Ajay. S. Kalamdhad2
Received: 19 July 2016 / Accepted: 29 January 2017 / Published online: 14 February 2017
� The Author(s) 2017. This article is published with open access at Springerlink.com
Abstract
Purpose Flower waste dumping in landfills and other
disposal sites is causing major environmental issues due to
its highly biodegradable nature. Instead, flower waste can
be successfully composted for its higher nutrient value.
Therefore, this study evaluated the pile composting of
flower waste with different combinations of cow dung and
saw dust to produce stabilized compost.
Methods Five agitated piles of flower waste mixture were
formed in trapezoidal shape to perform the composting.
Pile (P0) was a control experiment, which contained
100 kg flower waste. The quantity of flower waste mixture
with cow dung and saw dust in the other Piles was a total of
100 kg i.e. P1 (50:40:10) kg, P2 (60:30:10) kg, P3
(70:20:10) kg and P4 (80:10:10) kg, respectively.
Results Temperature above 50 �C was observed in all the
piles except in P0. Physico-chemical characteristics of
compost showed a stabilized compost obtained by pro-
portionate mix of flower waste, cow dung and saw dust.
Pile P2 was observed with pH 7.23 and electrical conduc-
tivity 3.98 mS cm-1, total organic carbon 30.9%, total
nitrogen 2.31% and C:N ratio 14, thus a good proportion
for compost amongst all the piles.
Conclusions Appropriate proportion of waste mixture
played an important role in providing favorable conditions
for the microbial transformation of flower waste to stabi-
lized compost. Temperature influenced the growth of
microbes and maximum temperature was helpful in fast
degradation of organic matter. Finally, flower waste with a
combination of cow dung and saw dust was found to be
successful during pile composting.
Keywords Agitated pile � C:N ratio � Co-composting �Flower waste � Nutrients
Introduction
In India, flowers are used for various purposes such as an
offering to deities in religious places for worship, making
garlands and bouquets, as decorative item for various
religious ceremonies and social gatherings. As a result,
about 300 MT of flower waste is generated per day and it
has been found to be one of the major constituents of
municipal solid waste (Singh et al. 2013). Most of the
flower waste generated is disposed by directly dumping it
in open land, water bodies. Alternatively, it is mixed with
municipal solid waste for further treatment. Significant
increase in leachate formation has been reported when
flower waste/organic waste is mixed with municipal waste
and is disposed off. Leachate production and percolation
into ground water pollutes the ground of nearby landfill
area (Varma and Kalamdhad 2014b). Flower waste dis-
posed into rivers causes pollution of river water and is also
harmful for both human and aquatic life. Thus, owing to
the organic nature of flower waste and the significant
presence of macro and micronutrients, composting offers a
feasible solution to deal with flower waste.
Composting is defined as the natural biological
decomposition of organic matter under self heating, aerobic
and moist conditions to produce a stable nutrient enriched
product which is used as organic manure (Bustamante et al.
& Dayanand Sharma
1 Civil Engineering Department, Sardar Vallabhbhai National
Institute of Technology, Surat, Gujarat 395007, India
2 Civil Engineering Department, Indian Institute of
Technology, Guwahati, Assam 781039, India
123
Int J Recycl Org Waste Agricult (2017) 6:89–98
DOI 10.1007/s40093-017-0155-9

2009). Organic wastes that have high moisture content
generate the leachate during the initial stage of composting
and are responsible for decrease in temperature and
development of the anaerobic condition. Leachate problem
can be solved by addition of bulking agent which also
allows free passage of air during the process of compost-
ing. Bulking agents also act as buffer against the organic
acids produced during the initial stage of decomposition.
They also help to maintain the pH 6–8 (Sanchez-Monedero
et al. 2001). Typically used bulking agents for composting
process are saw dust and dry leaves (Varma and Kalamd-
had 2014b), newspaper (Ball et al. 2000), Wheat bran
(Wang et al. 2012), Pumice (Wang et al. 2014; Wu et al.
2015) and wood shaving (Adhikari et al. 2009).
Several studies have been reported for agitated pile
composting of organic waste such as vegetable waste
(Varma and Kalamdhad 2014a), water hyacinth (Singh and
Kalamdhad 2015), municipal solid waste (Iyengar and
Bhave 2006), chicken litter (Gao et al. 2010), sewage
sludge and pig faeces (Huang et al. 2004), food waste and
saw dust (Zhou et al. 2014). However, there is limited
literature available on the composting of flower waste with
cow dung and saw dust as bulking agent.
Therefore, this study was focused on physico-chemical
and biological characterization during composting of flower
waste with cow dung and saw dust in different proportions.
The best proportion for flower waste composting along with
the addition of cow dung and saw dust was evaluated based
on maturity and final micro-macronutrient concentration
during the different stages of the composting process.
Materials and methods
Feedstock
This study was conducted in Environmental Engineering
laboratory, SVNIT, Surat, Gujarat (India). Surat is situated
on the bank of the river Tapti. It is located at 21.17oN
latitude and 72.83oE longitude. Flower waste was collected
from temples in Surat area, India. The debris (plastic,
threads, incense sticks, coconut, etc.) was removed from
flower waste manually. Large quantities of marigold were
found along with rose, lotus, and siroi lily. Fresh cow dung
was collected from a dairy farm in a nearby village. Saw
dust was collected from a saw mill in Bhatar market.
Table 1 shows the initial characteristics of feedstock.
Agitated pile composting
Identical agitated piles of trapezoidal shaped were pre-
pared. The bottom length was 2700 mm, width 450 mm,
height 500 mm and top width was 100 mm and L/W ratio
was kept as 6 with 100 kg of total weight. Cow dung and
saw dust were mixed thoroughly followed by addition of
the flower waste. The mixture was again made to blend
properly. Studies were conducted in duplicate and average
value was reported. Initially, all the piles were covered
with plastic sheets for six days. The proportions of each
pile are shown in Table 2.
All piles were manually turned upside down after three
days. A sample of one kg was then collected from the top
bottom and the centre at various locations of the pile and
thoroughly mixed to form a homogenous sample. This
process was repeated every three days for the first thirty
days and then at an interval of seven days for the next thirty
days. The collected samples were dried and crushed into
fine powder. They were sieved through a 0.2 mm sieve and
kept in desiccator for further analysis.
Analysis of physico-chemical parameters
The temperature was monitored throughout the composting
period using digital thermometers. The temperature at
different locations of each pile was measured and the
average temperature was reported. Moisture content was
monitored up to 30 days and after that moisture content
was adjusted between 55 to 60%, if needed; water was
added on dry weight basis during the turning of piles.
Gravimetric method was used for determining the moisture
content of the sample after pile turning (BIS, 1982). For
determining the pH and conductivity, 10 g dried sieved
sample was diluted by 100 mL distilled water (1:10 w/v)
and kept through mixing in rotary shaker for 2 h. Then the
sample was left to be settled for half an hour for settling
and finally filtered through the whatman filter paper no 42
(Singh and Kalamdhad 2016).
Total nitrogen was determined by Kjeldahl method.
Ammonical nitrogen (NH4?-N) was determined by KCl
extraction method followed by phenate method (APHA
2005). Volatile solids were determined by keeping the oven
dried sieved sample in a muffle furnace for 550 ± 5 �C for
2 h. The total organic carbon was calculated by dividing
the volatile solids by 1.83 (Adhikari et al. 2009).
Fresh wet samples were used for the presence of CO2
and determination of germination index. The CO2 evolu-
tion rate was determined as described by Singh and
Kalamdhad (2014). The Germination Index test was
determined as described by Zhang and Sun (2015).
The macronutrients (P, K, Na, Ca and Mg) and the
micronutrients (Fe, Mn, Zn and Cu) present in the compost
were analyzed according to Singh and Kalamdhad (2012).
The sample was digested before analysis by heating 0.2 g
dry sample with a ratio of 5:1 of 10 mL H2SO4 and HClO4
at 300 �C for 2 h. The digested sample was used for
determining the total phosphorous present using stannous
90 Int J Recycl Org Waste Agricult (2017) 6:89–98
123
chloride method (APHA 2005; Singh and Kalamdhad
2014). The concentrations of Na and K were determined
using flame photometer (Systronics 128l) and the con-
centrations of calcium (Ca), copper (Cu), zinc (Zn), man-
ganese (Mn), iron (Fe), chromium (Cr) and magnesium
(Mg) were determined by Inductively Coupled Plasma
Atomic Emission Spectroscopy method.
Statistical analysis
The value of measured Physico-chemical parameters
reported for each trial is the mean of duplicate. A one way
repeated measure ANOVA was used to test for differences
in each of the measured Physico-chemical parameters
during composting. SPSS 13.0 was used to perform the
analysis of variance (ANOVA P\ 0.05) for each param-
eter among five piles. The objective of statistical analysis
was to determine the significant differences among the
parameters analyzed for different combinations. Table 3
shows the Anova of physico-chemical parameters.
Results and discussion
Initial characteristic of waste material
The initial characteristic of the combination of different
waste mixture content piles is shown in Table 1. Flower
waste, cow dung and saw dust contained 82.01, 80.10
and 16.71% of moisture content, respectively. Singh and
Kalamdhad (2014) reported that bulking agent regulates
moisture content and provides free air passage. In pile
P0 (100 kg), flower waste lump formation was observed
on the third day and it was possibly due to excess
moisture content and lack of air passage between the
particles. Leachate production was also observed in pile
P0. The covering of each pile with plastic sheet helped
to increase the temperature inside the pile and it reached
the thermophilic phase within one day. Due to the
presence of moisture and the action of microbes there
was an increase in humidity inside the pile. As a result,
vapours were seen on the inner surface of the plastic
sheets.
The bacterial activity increased due to the temperature
inside the pile and presence of moisture (water) converted
this heat into steam. Varma and Kalamdhad (2014b)
reported that vapour provided was responsible for the
breakdown of tough organic material (lignin or tannin).
Turning or proper mixing of piles in every three days
provided adequate oxygen to the piles, which reduced the
stucking and enhanced the temperature.
Table 1 Initial characteristics
of feedstock materialParameters Flowers waste Cow dung Saw dust
Moisture content (%) 82.01 ± 0.7 80.10 ± 2.1 16.71 ± 0.7
pH 5.26 ± 0.03 7.19 ± 0.04 5.85 ± 0.90
Electrical conductivity (mS cm-1) 4.51 ± 0.08 3.29 ± 0.08 0.98 ± 0.91
Total organic carbon (%) 44.70 ± 1.5 32.20 ± 1.8 54.20 ± 1.2
Total nitrogen (%) 2.13 ± 0.08 1.39 ± 0.20 0.68 ± 0.09
NH4?-N (%) 1.80 ± 0.08 0.37 ± 0.08 0.21 ± 0.07
C:N ratio 20.90 ± 0.3 23.10 ± 0.4 79.77 ± 2.1
Total phosphorous (g kg-1) 3.15 ± 0.08 2.52 ± 0.07 1.25 ± 0.09
Na (g kg-1) 0.90 ± 0.08 2.49 ± 0.05 0.65 ± 0.07
K (g kg-1) 13.75 ± 0.50 10.42 ± 0.31 1.31 ± 0.15
Ca (g kg-1) 6.31 ± 0.95 8.92 ± 0.63 2.94 ± 0.70
Cu (mg kg-1) 48.62 ± 0.3 36.24 ± 0.2 17.82 ± 0.2
Zn (mg kg-1) 129.53 ± 1.0 178.22 ± 1.3 6.21 ± 1.3
Mn (mg kg-1) 98 ± 0.8 258 ± 1.1 56 ± 1.0
Fe (g kg-1) 1.86 ± 0.57 1.88 ± 0.57 0.47 ± 0.51
Mg (g kg-1) 2.55 ± 0.19 5.83 ± 0.15 1.23 ± 0.12
NH4?-N ammoniacal nitrogen, C:N ratio carbon to nitrogen ratio, Na sodium, K potassium, Ca calcium, Cu
copper, Zn zinc, Mn manganese, Fe iron, Mg magnesium
Table 2 Combination of flower waste, cow dung and saw dust
Name of pile Flower waste (kg) Cow dung (kg) Saw dust (kg)
P0 100 – –
P1 50 40 10
P2 60 30 10
P3 70 20 10
P4 80 10 10
Int J Recycl Org Waste Agricult (2017) 6:89–98 91
123
Temperature
Temperature is one of the key indicators for active
microbial biomass. Figure 1 shows variation of tempera-
ture in each pile during the composting process. Each pile
attained the mesosphilic phase (Temp \40 �C), ther-
mophilic phase ([45 �C), cooling and maturation phase.
However, pile P0 could not attain proper thermophilic
phase ([45 �C) because of the presence of excess moisture
which was unfavourable for the growth of microbes. Piles
P1 and P4 remained at temperature[50 �C for three and
two days, respectively. Piles P2 and P3 remained at[50 �Cfor 4 and 6 days, respectively. Maximum thermophilic
phase was observed in piles P2 and P3 due to the proper
combination of flower waste and cow dung. The presence
of higher and lower proportion of waste mixture was
responsible for the duration of thermophilic phase and for
achieving maximum temperature. The maximum temper-
ature recorded in piles P2 and P3 was 58.40 and 57.32 �C,respectively. Temperature between 50 and 60 �C for two
consecutive days kills the pathogens and this sanitizes the
compost (Awasthi et al. 2015). For each pile, the obser-
vation was that within 15 days the temperature became
near to the ambient temperature. Similar variations of
temperature were reported by Abdullah et al. (2013), Singh
and Kalamdhad (2014), Varma and Kalamdhad (2014b) for
the composting of different organic waste.
Moisture content
Figure 2 illustrates moisture content variations in each pile.
Initial moisture content of piles P0, P1, P2, P3 and P4 were
82.0 ± 2.68%, 72.5 ± 3.01%, 73.7 ± 2.92%, 76.7 ±
3.21%, 81.2 ± 2.87%, respectively. Moisture content
decreases linearly in P1, P2, P3 and P4. Whereas increase in
moisture content and formation of leachate was observed in
Table 3 Anova of physicochemical parameters
Parameters Anova Sum of squares Degree of freedom (df) Mean square F value P value
Electrical conductivity Between groups 75.780 4 18.945 209.660 0.0001
Within groups 6.777 75 0.090
Total 82.557 79
Total organic carbon Between groups 279.835 4 69.959 5.004 0.001
Within groups 1048.604 75 13.981
Total 1328.439 79
C:N ratio Between groups 269.943 4 67.486 4.677 0.002
Within groups 1082.122 75 14.428
Total 1352.066 79
Ash content Between groups 937.140 4 234.285 5.004 0.001
Within groups 3511.670 75 46.822
Total 4448.810 79
Total nitrogen Between groups 0.785 4 0.196 5.115 0.001
Within groups 2.878 75 0.038
Total 3.663 79
Sodium Between groups 15.420 4 3.855 21.046 0.0001
Within groups 13.737 75 0.183
Total 29.157 79
Potassium Between groups 205.705 4 51.426 54.613 0.0001
Within groups 70.623 75 0.942
Total 276.329 79
Fig. 1 Variation of temperature during the composting period
92 Int J Recycl Org Waste Agricult (2017) 6:89–98
123
P0, decrease in moisture content was primarily because of
the use of saw dust, which absorbed excess moisture, and
thus maintained moisture content, whereas in absence of
bulking agent, moisture content increased. Simultaneously,
with the increase of cow dung, decrease in temperature was
observed. Cow dung provides microbial inoculums which
enhances microbial activity resulting in increasing the rate
of degradation of organic matter. P1 and P4 took more time
because of the presence of ratio of cow dung and flower
waste i.e. 4:5 and 1:8, respectively. This indicates that the
ratio of cow dung and flower waste significantly affects the
composting and the adequate ratio must be maintained.
pH and Electrical conductivity (EC)
Figure 3 shows the variation in pH and electrical conduc-
tivity during composting. The increase in pH value was
observed for the first 15 days and later a slight variation in
pH value was observed for the next 15 days (15–30 days).
After 30 days, pH of compost was stabilized at 7.5 ± 1.2 in
each pile. The increase in pH was mainly due to the regular
turning process which assists in maintaining adequate oxy-
gen to keep aerobic condition (Awasthi et al. 2015).
The neutral pH value was observed after the 12th day as
flower waste contained high water soluble K concentration
which reacts with bi-carbonic acid (HCO3-) during the
degradation of organic matter to form strong base KOH.
The buffering capacity of humus and volatilization of
ammonia result in a slight decrease in pH value. Similar
results were reported for organic waste composting
(Kalamdhad and Kazmi 2009; Mena et al. 2003). The final
pH value between 6 and 8 shows the maturity of the
compost (Varma and Kalamdhad 2014a).
Electrical conductivity represents the salinity of compost.
The range of EC into compost is 0.14–12 mS cm-1 which is
suitable for the growth of plants (Huang et al. 2004). Initial
low value in electrical conductivity in waste composition
shows the suitability of flower waste for composting. It was
observed that the increased electrical conductivity in the
beginning of thermophilic phase became stable in cooling
phase. However, this behaviour was not observed in pile P0
where electrical conductivity increased. The degradation of
organicmatter took place in the beginning of the thermophilic
phase which released mineral salts such as ammonium and
phosphate and that increased the electrical conductivity. Sta-
bilized electrical conductivity value attributes to the
volatilization of mineral salts (Yadav et al. 2013). Inspite of
electrical conductivity value in between 0.12 and12.2
mS cm-1 in P0, it did not indicate quality compost due to the
high moisture content and the low temperature which influ-
ence the degradation of the organic matter.
Total organic carbon (TOC), ash content
and ammoniacal nitrogen (NH41-N)
Changes in carbon concentration indicate compost maturity.
Higher rate of carbon content degradation indicates stabi-
lized compost at the end of the composting. Variation of
total organic carbon is shown in Fig. 4a. Reduction of total
organic carbon at the end of composting in piles P0, P1, P2,
P3 and P4 were 13.5, 24.5, 29.6, 30.9 and 22.4%, respec-
tively. The low reduction of total organic carbon in P0 was
due to unavailability of inoculum such as cow dung and the
absence of temperature[50 �C. Pile P1 had easily digestible
organic substrate for microbes. This reduction in total
organic carbon was higher than that of P4. The percentage
reduction of total organic carbon in P2 and P3 was higher
due to the availability of thermophilic bacteria which
enhances the degradation rate of complex cellulose and
protein. A similar result in the reduction of total organic
carbon in organic waste was reported in the literature
(Awasthi et al. 2015; Zhou et al. 2014). The reduction of the
total organic carbon content indicates the mineralization of
the organic matter and the maturity of the compost.
Figure 4b shows the variation of ash contents during the
composting period. Initially the presence of ash content in
pile P0, P1, P2, P3 and P4 were 18.65 ± 2.63, 19.44 ±
3.12, 19.51 ± 2.75, 17.26 ± 1.95 and 17.39 ± 2.75%,
respectively, which was increased, respectively, to
29.70 ± 3.11, 39.22 ± 2.42, 43.37 ± 1.58, 42.90 ± 1.75
and 35.95 ± 2.35% at the end of composting period.
Higher rate of increase in ash contents was observed in pile
P2 (6:3:1) ratio of waste mixture due to the higher rate of
degradation of organic matter at the time of thermophilic
phase. In pile P0, the increase in percentage of ash content
was less as compared to the pile containing cow dung and
saw dust due to lower temperature and presence of higher
moisture content.Fig. 2 Variation of moisture content during the composting period
Int J Recycl Org Waste Agricult (2017) 6:89–98 93
123

Figure 4c shows the variation of ammoniacal nitrogen
during the composting period. It was observed that in P0 the
ammoniacal nitrogen reduction was high when compared to
other piles. This may be due to the low temperature in
thermophilic phase and low degradation rate of the organic
matter. In piles P1, P2, P3 and P4 the initial ammoniacal
nitrogen were 73.0 ± 21.3, 179.8 ± 19.5, 172.3 ± 21.5 and
142.2 ± 16.5 mg kg-1, respectively, which finally
decreased to 81.8 ± 23.2, 75.3 ± 24.5, 95.8 ± 19.5 and
66.4 ± 18.9 mg kg-1, respectively, during composting. The
ammoniacal nitrogen concentration decreased due to the
volatilization of NH4?-N by the microbes and the nitrifica-
tion during the composting process.
Macro nutrients (N, P, K, Na, Ca and Mg)
and micro nutrients (Fe, Mn, Zn and Cu)
The Macro nutrients in the organic matter are used by the
microbes for body metabolism and also for the growth of
plants. Figure 5a shows the variation of total nitrogen
content. The initial concentration of total nitrogen in piles
P0–P4 was between at 1.6 and 1.7% and increased to
concentrations of 2.2–2.3% at the end of the composting
process. The increasing trends of total nitrogen in this study
was found to be similar to results by Jolanun and Tow-
prayoon (2010). Total nitrogen increased due to the
degradation of organic matter and loss of carbon in the
form of CO2 and the contribution of nitrogen fixing bac-
teria which were the responsible for the increase of total
nitrogen content (Garcia et al. 1992).
Figure 5b shows the increase in concentration of sodium
from the initial to the final day of composting. Initial
concentrations of sodium in piles P0–P4 were
2.5–3.2 g kg-1 which increased to 5.3–4.9 g kg-1 within
the 60 days composting period. The concentration of
macronutrients P, K, Na, Ca and Mg increased gradually
which indicates the net loss in dry mass due to the degra-
dation of organic matter and the release of CO2, NH3 and
H2S during the composting process (Bustamante et al.
2009).
Fig. 3 Variation of pH and
electrical conductivity during
composting period
Fig. 4 Variation of total organic carbon ash content and ammoniacal nitrogen during composting period
94 Int J Recycl Org Waste Agricult (2017) 6:89–98
123
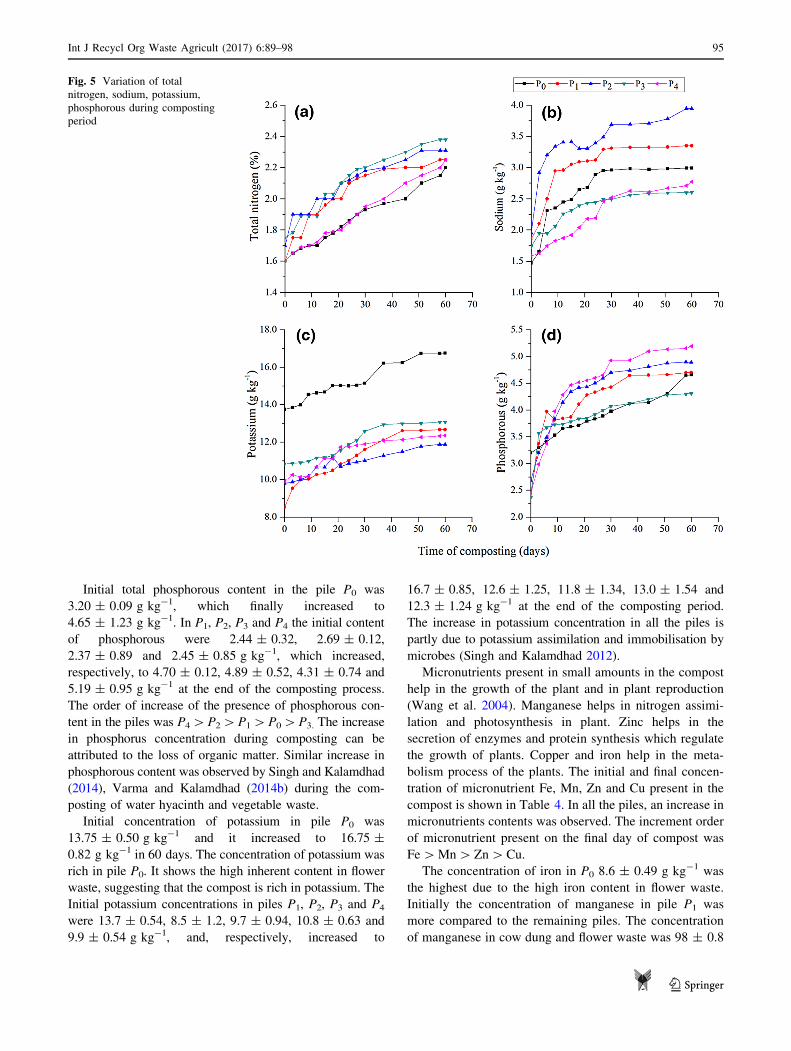
Initial total phosphorous content in the pile P0 was
3.20 ± 0.09 g kg-1, which finally increased to
4.65 ± 1.23 g kg-1. In P1, P2, P3 and P4 the initial content
of phosphorous were 2.44 ± 0.32, 2.69 ± 0.12,
2.37 ± 0.89 and 2.45 ± 0.85 g kg-1, which increased,
respectively, to 4.70 ± 0.12, 4.89 ± 0.52, 4.31 ± 0.74 and
5.19 ± 0.95 g kg-1 at the end of the composting process.
The order of increase of the presence of phosphorous con-
tent in the piles was P4[P2[P1[P0[P3. The increase
in phosphorus concentration during composting can be
attributed to the loss of organic matter. Similar increase in
phosphorous content was observed by Singh and Kalamdhad
(2014), Varma and Kalamdhad (2014b) during the com-
posting of water hyacinth and vegetable waste.
Initial concentration of potassium in pile P0 was
13.75 ± 0.50 g kg-1 and it increased to 16.75 ±
0.82 g kg-1 in 60 days. The concentration of potassium was
rich in pile P0. It shows the high inherent content in flower
waste, suggesting that the compost is rich in potassium. The
Initial potassium concentrations in piles P1, P2, P3 and P4
were 13.7 ± 0.54, 8.5 ± 1.2, 9.7 ± 0.94, 10.8 ± 0.63 and
9.9 ± 0.54 g kg-1, and, respectively, increased to
16.7 ± 0.85, 12.6 ± 1.25, 11.8 ± 1.34, 13.0 ± 1.54 and
12.3 ± 1.24 g kg-1 at the end of the composting period.
The increase in potassium concentration in all the piles is
partly due to potassium assimilation and immobilisation by
microbes (Singh and Kalamdhad 2012).
Micronutrients present in small amounts in the compost
help in the growth of the plant and in plant reproduction
(Wang et al. 2004). Manganese helps in nitrogen assimi-
lation and photosynthesis in plant. Zinc helps in the
secretion of enzymes and protein synthesis which regulate
the growth of plants. Copper and iron help in the meta-
bolism process of the plants. The initial and final concen-
tration of micronutrient Fe, Mn, Zn and Cu present in the
compost is shown in Table 4. In all the piles, an increase in
micronutrients contents was observed. The increment order
of micronutrient present on the final day of compost was
Fe[Mn[Zn[Cu.
The concentration of iron in P0 8.6 ± 0.49 g kg-1 was
the highest due to the high iron content in flower waste.
Initially the concentration of manganese in pile P1 was
more compared to the remaining piles. The concentration
of manganese in cow dung and flower waste was 98 ± 0.8
Fig. 5 Variation of total
nitrogen, sodium, potassium,
phosphorous during composting
period
Int J Recycl Org Waste Agricult (2017) 6:89–98 95
123
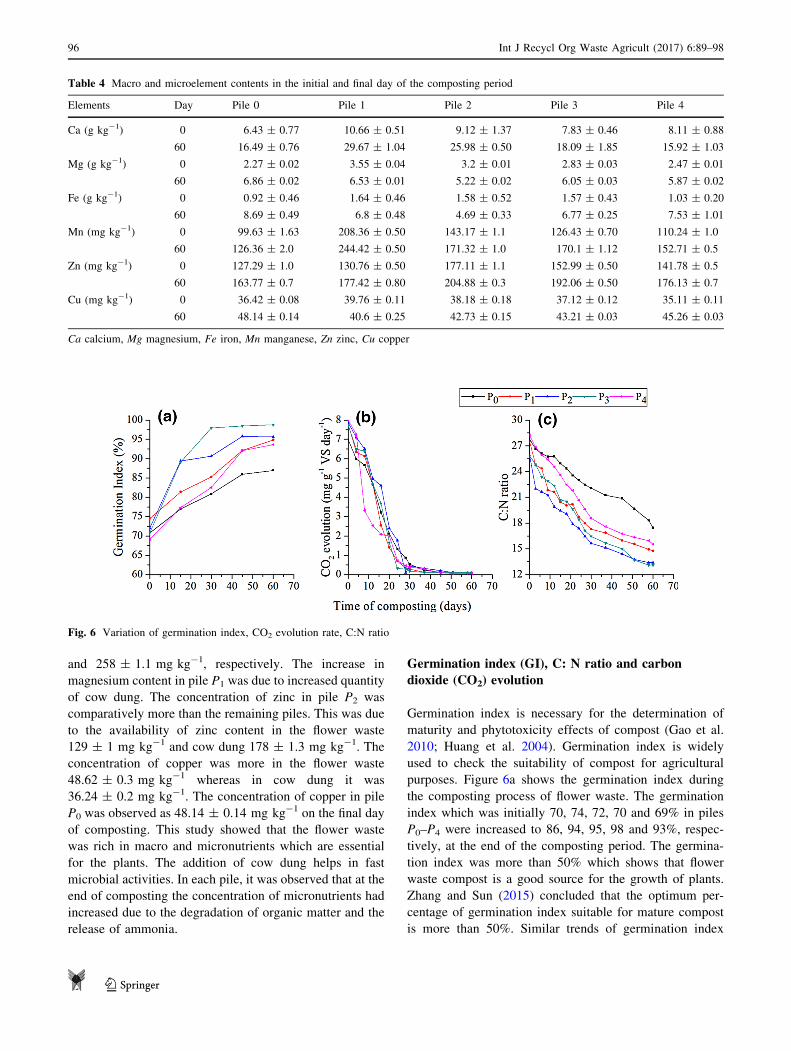
and 258 ± 1.1 mg kg-1, respectively. The increase in
magnesium content in pile P1 was due to increased quantity
of cow dung. The concentration of zinc in pile P2 was
comparatively more than the remaining piles. This was due
to the availability of zinc content in the flower waste
129 ± 1 mg kg-1 and cow dung 178 ± 1.3 mg kg-1. The
concentration of copper was more in the flower waste
48.62 ± 0.3 mg kg-1 whereas in cow dung it was
36.24 ± 0.2 mg kg-1. The concentration of copper in pile
P0 was observed as 48.14 ± 0.14 mg kg-1 on the final day
of composting. This study showed that the flower waste
was rich in macro and micronutrients which are essential
for the plants. The addition of cow dung helps in fast
microbial activities. In each pile, it was observed that at the
end of composting the concentration of micronutrients had
increased due to the degradation of organic matter and the
release of ammonia.
Germination index (GI), C: N ratio and carbon
dioxide (CO2) evolution
Germination index is necessary for the determination of
maturity and phytotoxicity effects of compost (Gao et al.
2010; Huang et al. 2004). Germination index is widely
used to check the suitability of compost for agricultural
purposes. Figure 6a shows the germination index during
the composting process of flower waste. The germination
index which was initially 70, 74, 72, 70 and 69% in piles
P0–P4 were increased to 86, 94, 95, 98 and 93%, respec-
tively, at the end of the composting period. The germina-
tion index was more than 50% which shows that flower
waste compost is a good source for the growth of plants.
Zhang and Sun (2015) concluded that the optimum per-
centage of germination index suitable for mature compost
is more than 50%. Similar trends of germination index
Table 4 Macro and microelement contents in the initial and final day of the composting period
Elements Day Pile 0 Pile 1 Pile 2 Pile 3 Pile 4
Ca (g kg-1) 0 6.43 ± 0.77 10.66 ± 0.51 9.12 ± 1.37 7.83 ± 0.46 8.11 ± 0.88
60 16.49 ± 0.76 29.67 ± 1.04 25.98 ± 0.50 18.09 ± 1.85 15.92 ± 1.03
Mg (g kg-1) 0 2.27 ± 0.02 3.55 ± 0.04 3.2 ± 0.01 2.83 ± 0.03 2.47 ± 0.01
60 6.86 ± 0.02 6.53 ± 0.01 5.22 ± 0.02 6.05 ± 0.03 5.87 ± 0.02
Fe (g kg-1) 0 0.92 ± 0.46 1.64 ± 0.46 1.58 ± 0.52 1.57 ± 0.43 1.03 ± 0.20
60 8.69 ± 0.49 6.8 ± 0.48 4.69 ± 0.33 6.77 ± 0.25 7.53 ± 1.01
Mn (mg kg-1) 0 99.63 ± 1.63 208.36 ± 0.50 143.17 ± 1.1 126.43 ± 0.70 110.24 ± 1.0
60 126.36 ± 2.0 244.42 ± 0.50 171.32 ± 1.0 170.1 ± 1.12 152.71 ± 0.5
Zn (mg kg-1) 0 127.29 ± 1.0 130.76 ± 0.50 177.11 ± 1.1 152.99 ± 0.50 141.78 ± 0.5
60 163.77 ± 0.7 177.42 ± 0.80 204.88 ± 0.3 192.06 ± 0.50 176.13 ± 0.7
Cu (mg kg-1) 0 36.42 ± 0.08 39.76 ± 0.11 38.18 ± 0.18 37.12 ± 0.12 35.11 ± 0.11
60 48.14 ± 0.14 40.6 ± 0.25 42.73 ± 0.15 43.21 ± 0.03 45.26 ± 0.03
Ca calcium, Mg magnesium, Fe iron, Mn manganese, Zn zinc, Cu copper
Fig. 6 Variation of germination index, CO2 evolution rate, C:N ratio
96 Int J Recycl Org Waste Agricult (2017) 6:89–98
123
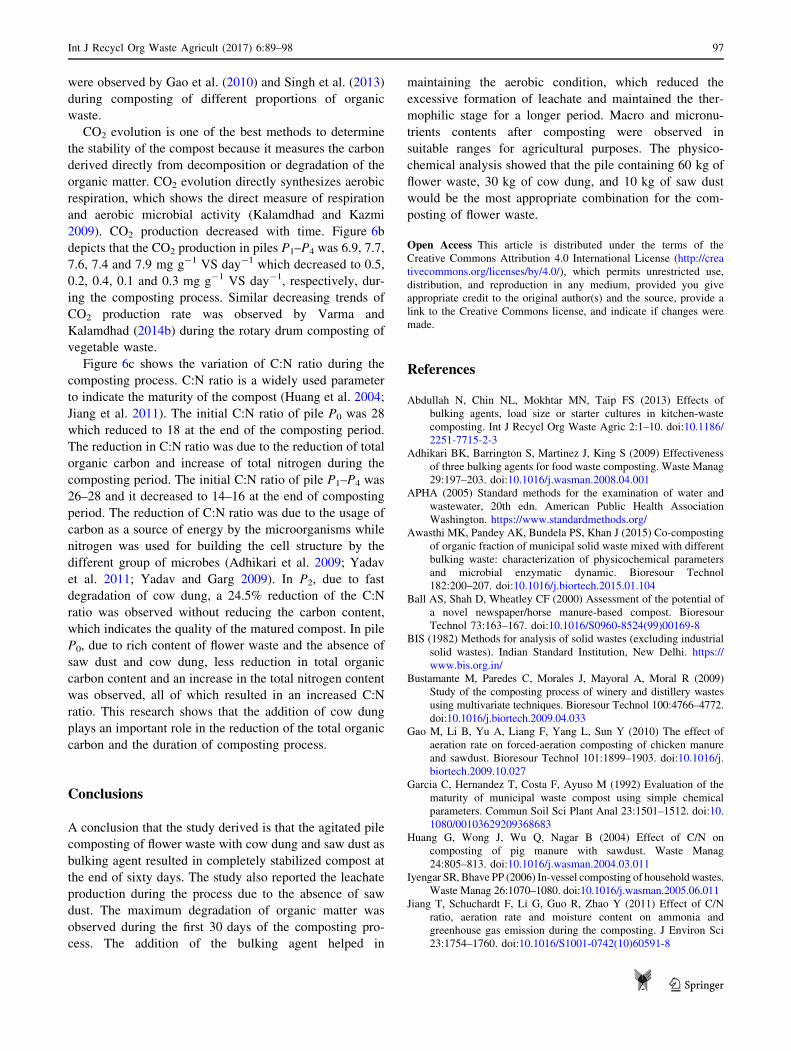
were observed by Gao et al. (2010) and Singh et al. (2013)
during composting of different proportions of organic
waste.
CO2 evolution is one of the best methods to determine
the stability of the compost because it measures the carbon
derived directly from decomposition or degradation of the
organic matter. CO2 evolution directly synthesizes aerobic
respiration, which shows the direct measure of respiration
and aerobic microbial activity (Kalamdhad and Kazmi
2009). CO2 production decreased with time. Figure 6b
depicts that the CO2 production in piles P1–P4 was 6.9, 7.7,
7.6, 7.4 and 7.9 mg g-1 VS day-1 which decreased to 0.5,
0.2, 0.4, 0.1 and 0.3 mg g-1 VS day-1, respectively, dur-
ing the composting process. Similar decreasing trends of
CO2 production rate was observed by Varma and
Kalamdhad (2014b) during the rotary drum composting of
vegetable waste.
Figure 6c shows the variation of C:N ratio during the
composting process. C:N ratio is a widely used parameter
to indicate the maturity of the compost (Huang et al. 2004;
Jiang et al. 2011). The initial C:N ratio of pile P0 was 28
which reduced to 18 at the end of the composting period.
The reduction in C:N ratio was due to the reduction of total
organic carbon and increase of total nitrogen during the
composting period. The initial C:N ratio of pile P1–P4 was
26–28 and it decreased to 14–16 at the end of composting
period. The reduction of C:N ratio was due to the usage of
carbon as a source of energy by the microorganisms while
nitrogen was used for building the cell structure by the
different group of microbes (Adhikari et al. 2009; Yadav
et al. 2011; Yadav and Garg 2009). In P2, due to fast
degradation of cow dung, a 24.5% reduction of the C:N
ratio was observed without reducing the carbon content,
which indicates the quality of the matured compost. In pile
P0, due to rich content of flower waste and the absence of
saw dust and cow dung, less reduction in total organic
carbon content and an increase in the total nitrogen content
was observed, all of which resulted in an increased C:N
ratio. This research shows that the addition of cow dung
plays an important role in the reduction of the total organic
carbon and the duration of composting process.
Conclusions
A conclusion that the study derived is that the agitated pile
composting of flower waste with cow dung and saw dust as
bulking agent resulted in completely stabilized compost at
the end of sixty days. The study also reported the leachate
production during the process due to the absence of saw
dust. The maximum degradation of organic matter was
observed during the first 30 days of the composting pro-
cess. The addition of the bulking agent helped in
maintaining the aerobic condition, which reduced the
excessive formation of leachate and maintained the ther-
mophilic stage for a longer period. Macro and micronu-
trients contents after composting were observed in
suitable ranges for agricultural purposes. The physico-
chemical analysis showed that the pile containing 60 kg of
flower waste, 30 kg of cow dung, and 10 kg of saw dust
would be the most appropriate combination for the com-
posting of flower waste.
Open Access This article is distributed under the terms of the
Creative Commons Attribution 4.0 International License (http://crea
tivecommons.org/licenses/by/4.0/), which permits unrestricted use,
distribution, and reproduction in any medium, provided you give
appropriate credit to the original author(s) and the source, provide a
link to the Creative Commons license, and indicate if changes were
made.
References
Abdullah N, Chin NL, Mokhtar MN, Taip FS (2013) Effects of
bulking agents, load size or starter cultures in kitchen-waste
composting. Int J Recycl Org Waste Agric 2:1–10. doi:10.1186/
2251-7715-2-3
Adhikari BK, Barrington S, Martinez J, King S (2009) Effectiveness
of three bulking agents for food waste composting. Waste Manag
29:197–203. doi:10.1016/j.wasman.2008.04.001
APHA (2005) Standard methods for the examination of water and
wastewater, 20th edn. American Public Health Association
Washington. https://www.standardmethods.org/
Awasthi MK, Pandey AK, Bundela PS, Khan J (2015) Co-composting
of organic fraction of municipal solid waste mixed with different
bulking waste: characterization of physicochemical parameters
and microbial enzymatic dynamic. Bioresour Technol
182:200–207. doi:10.1016/j.biortech.2015.01.104
Ball AS, Shah D, Wheatley CF (2000) Assessment of the potential of
a novel newspaper/horse manure-based compost. Bioresour
Technol 73:163–167. doi:10.1016/S0960-8524(99)00169-8
BIS (1982) Methods for analysis of solid wastes (excluding industrial
solid wastes). Indian Standard Institution, New Delhi. https://
www.bis.org.in/
Bustamante M, Paredes C, Morales J, Mayoral A, Moral R (2009)
Study of the composting process of winery and distillery wastes
using multivariate techniques. Bioresour Technol 100:4766–4772.
doi:10.1016/j.biortech.2009.04.033
Gao M, Li B, Yu A, Liang F, Yang L, Sun Y (2010) The effect of
aeration rate on forced-aeration composting of chicken manure
and sawdust. Bioresour Technol 101:1899–1903. doi:10.1016/j.
biortech.2009.10.027
Garcia C, Hernandez T, Costa F, Ayuso M (1992) Evaluation of the
maturity of municipal waste compost using simple chemical
parameters. Commun Soil Sci Plant Anal 23:1501–1512. doi:10.
1080/00103629209368683
Huang G, Wong J, Wu Q, Nagar B (2004) Effect of C/N on
composting of pig manure with sawdust. Waste Manag
24:805–813. doi:10.1016/j.wasman.2004.03.011
Iyengar SR, Bhave PP (2006) In-vessel composting of household wastes.
Waste Manag 26:1070–1080. doi:10.1016/j.wasman.2005.06.011
Jiang T, Schuchardt F, Li G, Guo R, Zhao Y (2011) Effect of C/N
ratio, aeration rate and moisture content on ammonia and
greenhouse gas emission during the composting. J Environ Sci
23:1754–1760. doi:10.1016/S1001-0742(10)60591-8
Int J Recycl Org Waste Agricult (2017) 6:89–98 97
123
Jolanun B, Towprayoon S (2010) Novel bulking agent from clay
residue for food waste composting. Bioresour Technol
101:4484–4490. doi:10.1016/j.biortech.2010.01.116
Kalamdhad AS, Kazmi A (2009) Effects of turning frequency on
compost stability and some chemical characteristics in a rotary
drum composter. Chemosphere 74:1327–1334. doi:10.1016/j.
chemosphere.2008.11.058
Mena E, Garrido A, Hernandez T, Garcia C (2003) Bioremediation of
sewage sludge by composting. Commun Soil Sci Plant Anal
34:957–971. doi:10.1081/CSS-120019102
Sanchez-Monedero M, Roig A, Paredes C, Bernal M (2001) Nitrogen
transformation during organic waste composting by the Rutgers
system and its effects on pH, EC and maturity of the composting
mixtures. Bioresour Technol 78:301–308. doi:10.1016/S0960-
8524(01)00031-1
Singh J, Kalamdhad AS (2012) Concentration and speciation of heavy
metals during water hyacinth composting. Bioresour Technol
24:169–179. doi:10.1016/j.biortech.2012.08.043
Singh WR, Kalamdhad AS (2014) Potential for composting of green
phumdi biomass of Loktak lake. Ecol Eng 67:119–126. doi:10.
1016/j.ecoleng.2014.03.086
Singh J, Kalamdhad AS (2015) Assessment of compost quality in
agitated pile composting of water hyacinth collected from
different sources. Int J Recycl Org Waste Agric 4:175–183.
doi:10.1007/s40093-015-0097-z
Singh WR, Kalamdhad AS (2016) Transformation of nutrients and
heavy metals during vermicomposting of the invasive green
weed Salvinia natans using Eisenia fetida. Int J Recycl Org
Waste Agric, pp 1–16 doi:10.1007/s40093-016-0129-3
Singh A, Jain A, Sarma BK, Abhilash P, Singh HB (2013) Solid waste
management of temple floral offerings by vermicomposting
using Eisenia fetida. Waste Manag 33:1113–1118. doi:10.1016/j.
wasman.2013.01.022
Varma VS, Kalamdhad A (2014a) Evolution of chemical and
biological characterization during thermophilic composting of
vegetable waste using rotary drum composter. Int J Environ Sci
Technol, pp 1–10. doi:10.1007/s13762-014-0582-3
Varma VS, Kalamdhad AS (2014b) Stability and microbial community
analysis during rotary drum composting of vegetable waste. Int J
Recycl Org Waste Agric 3:1–9. doi:10.1007/s40093-014-0052-4
Wang P, Changa C, Watson M, Dick W, Chen Y, Hoitink H (2004)
Maturity indices for composted dairy and pig manures. Soil Biol
Biochem 36:767–776. doi:10.1016/j.soilbio.2003.12.012
Wang L-P, Shen Q-R, Yu G-H, Ran W, Xu Y-C (2012) Fate of
biopolymers during rapeseed meal and wheat bran composting as
studied by two-dimensional correlation spectroscopy in combi-
nation with multiple fluorescence labeling techniques. Bioresour
Technol 105:88–94. doi:10.1016/j.biortech.2011.11.064
Wang K, Li X, He C, Chen C-L, Bai J, Ren N, Wang J-Y (2014)
Transformation of dissolved organic matters in swine, cow and
chicken manures during composting. Bioresour Technol
168:222–228. doi:10.1016/j.biortech.2014.03.129
Wu C, Li W, Wang K, Li Y (2015) Usage of pumice as bulking agent
in sewage sludge composting. Bioresour Technol 190:516–521.
doi:10.1016/j.biortech.2015.03.104
Yadav A, Garg VK (2009) Feasibility of nutrient recovery from
industrial sludge by vermicomposting technology. J Hazard
Mater 168:262–268. doi:10.1016/j.jhazmat.2009.02.035
Yadav KD, Tare V, Ahammed MM (2011) Vermicomposting of
source-separated human faeces by Eisenia fetida: effect of
stocking density on feed consumption rate, growth characteris-
tics and vermicompost production. Waste Manag 31:1162–1168.
doi:10.1016/j.wasman.2011.02.008
Yadav A, Gupta R, Garg VK (2013) Organic manure production from
cow dung and biogas plant slurry by vermicomposting under
field conditions. Int J Recycl Org Waste Agric 2:21. doi:10.1186/
2251-7715-2-21
Zhang L, Sun X (2015) Influence of bulking agents on physical,
chemical, and microbiological properties during the two-stage
composting of green waste. Waste Manag 48:115–126. doi:10.
1016/j.wasman.2015.11.032
Zhou Y, Selvam A, Wong JW (2014) Evaluation of humic substances
during co-composting of food waste, sawdust and Chinese
medicinal herbal residues. Bioresour Technol 168:229–234.
doi:10.1016/j.biortech.2014.05.070
98 Int J Recycl Org Waste Agricult (2017) 6:89–98
123