evidence table 11. outcomes related to diabetes mellitus ... · evidence table 11. outcomes related...
TRANSCRIPT
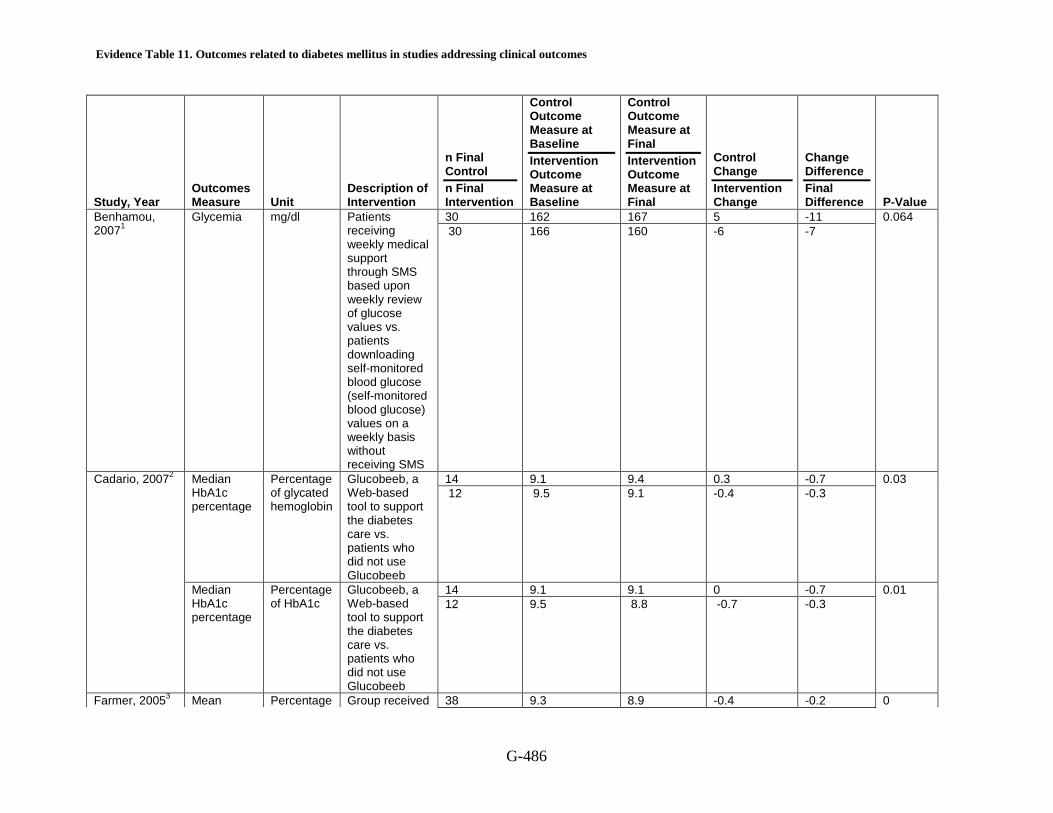
Evidence Table 11. Outcomes related to diabetes mellitus in studies addressing clinical outcomes
G-486
Study, Year Outcomes Measure Unit
Description of Intervention
n Final Control n Final Intervention
Control Outcome Measure at Baseline Intervention Outcome Measure at Baseline
Control Outcome Measure at Final Intervention Outcome Measure at Final
Control Change Intervention Change
Change Difference Final Difference P-Value
Benhamou, 20071
Glycemia
mg/dl
Patients receiving weekly medical support through SMS based upon weekly review of glucose values vs. patients downloading self-monitored blood glucose (self-monitored blood glucose) values on a weekly basis without receiving SMS
30 162 167 5 -11 0.064 30 166 160 -6 -7
Cadario, 20072
Median HbA1c percentage
Percentage of glycated hemoglobin
Glucobeeb, a Web-based tool to support the diabetes care vs. patients who did not use Glucobeeb
14 9.1 9.4 0.3 -0.7 0.03 12 9.5 9.1 -0.4 -0.3
Median HbA1c percentage
Percentage of HbA1c
Glucobeeb, a Web-based tool to support the diabetes care vs. patients who did not use Glucobeeb
14 9.1 9.1 0 -0.7 0.01 12 9.5 8.8 -0.7 -0.3
Farmer, 20053 Mean Percentage Group received 38 9.3 8.9 -0.4 -0.2 0
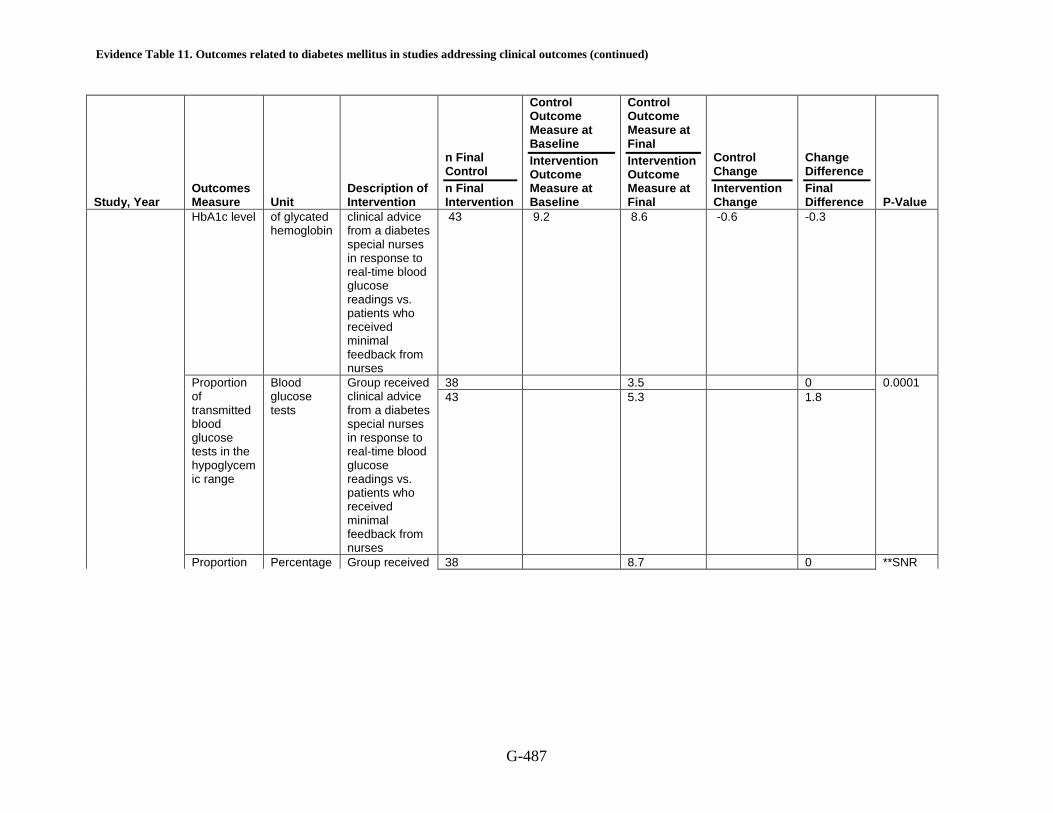
Evidence Table 11. Outcomes related to diabetes mellitus in studies addressing clinical outcomes (continued)
G-487
Study, Year Outcomes Measure Unit
Description of Intervention
n Final Control n Final Intervention
Control Outcome Measure at Baseline Intervention Outcome Measure at Baseline
Control Outcome Measure at Final Intervention Outcome Measure at Final
Control Change Intervention Change
Change Difference Final Difference P-Value
HbA1c level
of glycated hemoglobin
clinical advice from a diabetes special nurses in response to real-time blood glucose readings vs. patients who received minimal feedback from nurses
43 9.2 8.6 -0.6 -0.3
Proportion of transmitted blood glucose tests in the hypoglycemic range
Blood glucose tests
Group received clinical advice from a diabetes special nurses in response to real-time blood glucose readings vs. patients who received minimal feedback from nurses
38 3.5 0 0.0001 43 5.3 1.8
Proportion Percentage Group received 38 8.7 0 **SNR

Evidence Table 11. Outcomes related to diabetes mellitus in studies addressing clinical outcomes (continued)
G-488
Study, Year Outcomes Measure Unit
Description of Intervention
n Final Control n Final Intervention
Control Outcome Measure at Baseline Intervention Outcome Measure at Baseline
Control Outcome Measure at Final Intervention Outcome Measure at Final
Control Change Intervention Change
Change Difference Final Difference P-Value
of participants achieving an HbA1c reduction of >=0.7% and an HbA1c <= 8.0% at 9 months
of patients with outcome
clinical advice from a diabetes special nurses in response to real-time blood glucose readings vs. patients who received minimal feedback from nurses
43 29.8 21.1
Glasgow, 20004
Physiologic outcomes: HbA1c
Percentage of HbA1c
Telephone follow-up vs. the basic intervention condition received by all participants involved a meeting with a health counselor at a central location and having specific dietary goals set with the aid of a multimedia touch-screen computer
67 7.6 7.4 -0.2 0.2 0 75 7.3 7.3 0 -0.1
Physiologic mg/dl Telephone 67 210 206 -4 -5 0

Evidence Table 11. Outcomes related to diabetes mellitus in studies addressing clinical outcomes (continued)
G-489
Study, Year Outcomes Measure Unit
Description of Intervention
n Final Control n Final Intervention
Control Outcome Measure at Baseline Intervention Outcome Measure at Baseline
Control Outcome Measure at Final Intervention Outcome Measure at Final
Control Change Intervention Change
Change Difference Final Difference P-Value
outcomes: Total cholesterol
follow-up vs. the basic intervention condition received by all participants involved a meeting with a health counselor at a central location and having specific dietary goals set with the aid of a multimedia touch-screen computer
75 203 194 -9 -12
Physiologic kg Telephone 67 199 197 -2 0 0

Evidence Table 11. Outcomes related to diabetes mellitus in studies addressing clinical outcomes (continued)
G-490
Study, Year Outcomes Measure Unit
Description of Intervention
n Final Control n Final Intervention
Control Outcome Measure at Baseline Intervention Outcome Measure at Baseline
Control Outcome Measure at Final Intervention Outcome Measure at Final
Control Change Intervention Change
Change Difference Final Difference P-Value
outcomes: Weight
follow-up vs. the basic intervention condition received by all participants involved a meeting with a health counselor at a central location and having specific dietary goals set with the aid of a multimedia touch-screen computer
75 212 210 -2 13
Physiologic No unit Telephone 67 5.1 4.9 -0.2 -0.3 0

Evidence Table 11. Outcomes related to diabetes mellitus in studies addressing clinical outcomes (continued)
G-491
Study, Year Outcomes Measure Unit
Description of Intervention
n Final Control n Final Intervention
Control Outcome Measure at Baseline Intervention Outcome Measure at Baseline
Control Outcome Measure at Final Intervention Outcome Measure at Final
Control Change Intervention Change
Change Difference Final Difference P-Value
outcomes lipid ratio: Total/HDL
follow-up vs. The basic intervention condition received by all participants involved a meeting with a health counselor at a central location and having specific dietary goals set with the aid of a multimedia touch-screen computer
75 5.1 4.6 -0.5 -0.3
Quality of Score unit Telephone 67 25.7 26 0.3 0.1 0.058

Evidence Table 11. Outcomes related to diabetes mellitus in studies addressing clinical outcomes (continued)
G-492
Study, Year Outcomes Measure Unit
Description of Intervention
n Final Control n Final Intervention
Control Outcome Measure at Baseline Intervention Outcome Measure at Baseline
Control Outcome Measure at Final Intervention Outcome Measure at Final
Control Change Intervention Change
Change Difference Final Difference P-Value
life: Satisfaction outcomes--Diabetes intrusiveness
follow-up vs. the basic intervention condition received by all participants involved a meeting with a health counselor at a central location and having specific dietary goals set with the aid of a multimedia touch-screen computer
75 29.2 29.6 0.4 3.6
Physiologic Percentage Community 67 7.6 7.4 -0.2 0.1 0
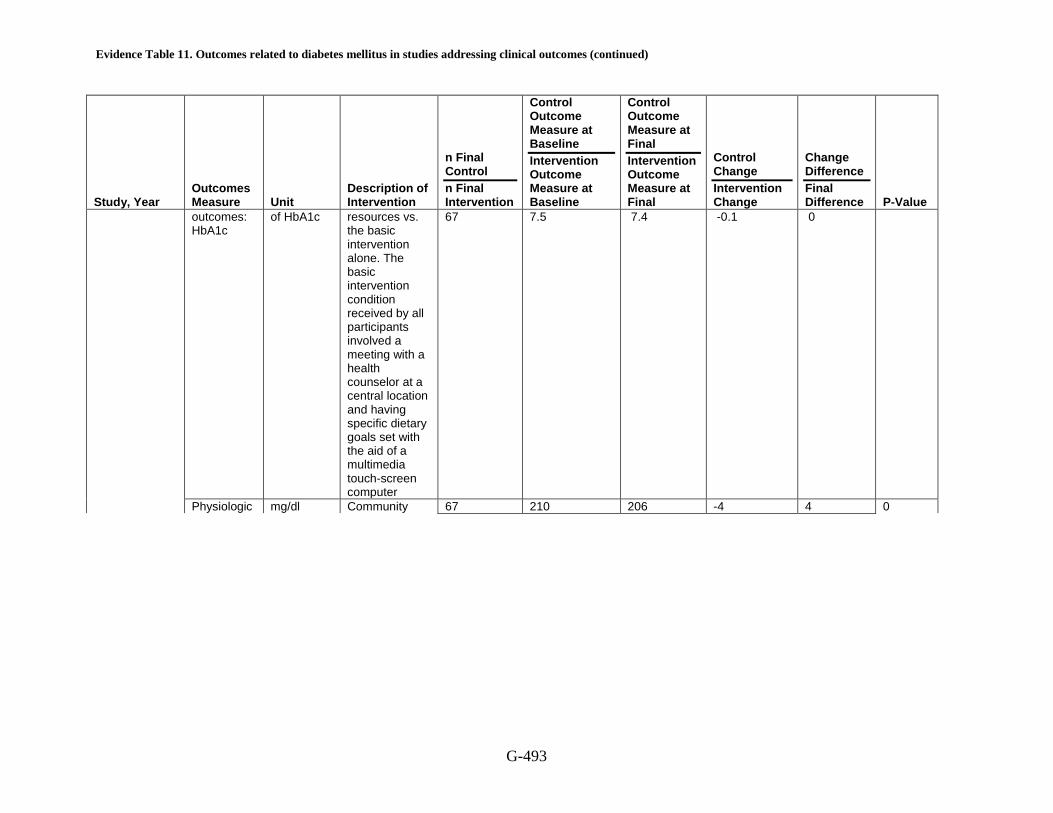
Evidence Table 11. Outcomes related to diabetes mellitus in studies addressing clinical outcomes (continued)
G-493
Study, Year Outcomes Measure Unit
Description of Intervention
n Final Control n Final Intervention
Control Outcome Measure at Baseline Intervention Outcome Measure at Baseline
Control Outcome Measure at Final Intervention Outcome Measure at Final
Control Change Intervention Change
Change Difference Final Difference P-Value
outcomes: HbA1c
of HbA1c
resources vs. the basic intervention alone. The basic intervention condition received by all participants involved a meeting with a health counselor at a central location and having specific dietary goals set with the aid of a multimedia touch-screen computer
67 7.5 7.4 -0.1 0
Physiologic mg/dl Community 67 210 206 -4 4 0

Evidence Table 11. Outcomes related to diabetes mellitus in studies addressing clinical outcomes (continued)
G-494
Study, Year Outcomes Measure Unit
Description of Intervention
n Final Control n Final Intervention
Control Outcome Measure at Baseline Intervention Outcome Measure at Baseline
Control Outcome Measure at Final Intervention Outcome Measure at Final
Control Change Intervention Change
Change Difference Final Difference P-Value
outcomes: Total cholesterol
resources vs. basic intervention alone. The basic intervention condition received by all participants involved a meeting with a health counselor at a central location and having specific dietary goals set with the aid of a multimedia touch-screen computer
67 202 202 0 -4
Physiologic kg Community 67 199 197 -2 0 0
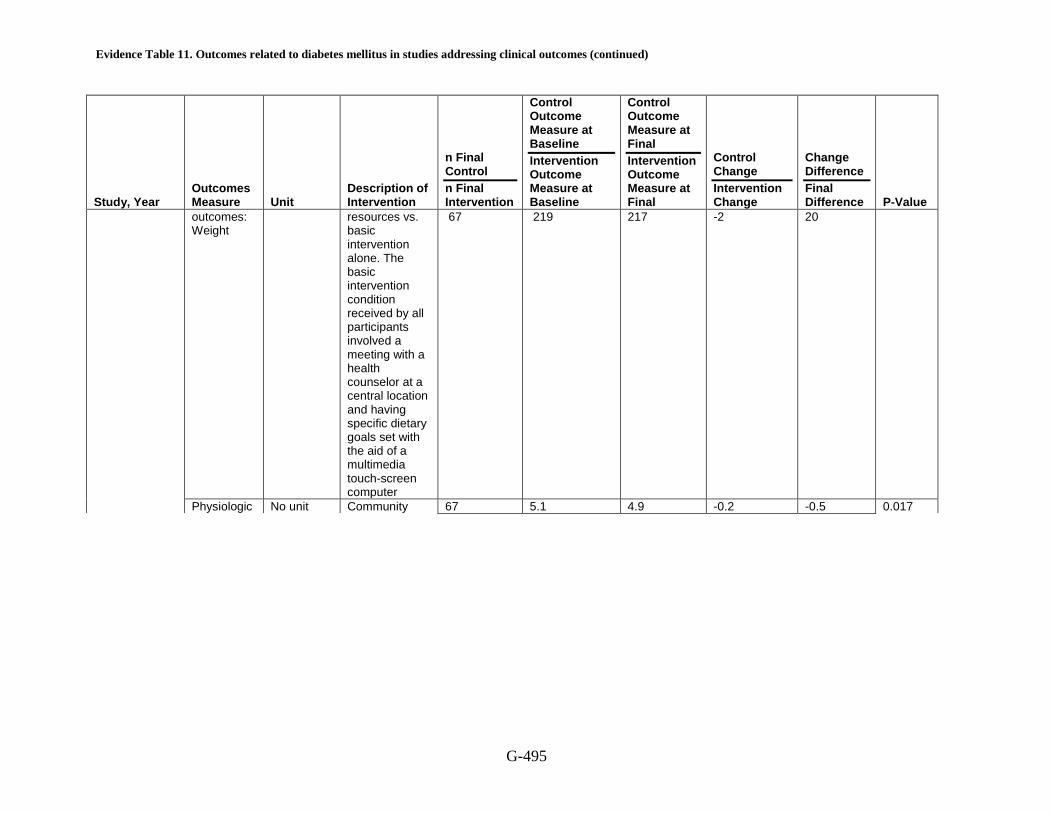
Evidence Table 11. Outcomes related to diabetes mellitus in studies addressing clinical outcomes (continued)
G-495
Study, Year Outcomes Measure Unit
Description of Intervention
n Final Control n Final Intervention
Control Outcome Measure at Baseline Intervention Outcome Measure at Baseline
Control Outcome Measure at Final Intervention Outcome Measure at Final
Control Change Intervention Change
Change Difference Final Difference P-Value
outcomes: Weight
resources vs. basic intervention alone. The basic intervention condition received by all participants involved a meeting with a health counselor at a central location and having specific dietary goals set with the aid of a multimedia touch-screen computer
67 219 217 -2 20
Physiologic No unit Community 67 5.1 4.9 -0.2 -0.5 0.017

Evidence Table 11. Outcomes related to diabetes mellitus in studies addressing clinical outcomes (continued)
G-496
Study, Year Outcomes Measure Unit
Description of Intervention
n Final Control n Final Intervention
Control Outcome Measure at Baseline Intervention Outcome Measure at Baseline
Control Outcome Measure at Final Intervention Outcome Measure at Final
Control Change Intervention Change
Change Difference Final Difference P-Value
outcomes lipid ratio: Total/HDL
resources vs. basic intervention alone. The basic intervention condition received by all participants involved a meeting with a health counselor at a central location and having specific dietary goals set with the aid of a multimedia touch-screen computer
67 5.2 4.5 -0.7 -0.4
Quality of Score unit Community 67 25.7 26 0.3 -0.7 0

Evidence Table 11. Outcomes related to diabetes mellitus in studies addressing clinical outcomes (continued)
G-497
Study, Year Outcomes Measure Unit
Description of Intervention
n Final Control n Final Intervention
Control Outcome Measure at Baseline Intervention Outcome Measure at Baseline
Control Outcome Measure at Final Intervention Outcome Measure at Final
Control Change Intervention Change
Change Difference Final Difference P-Value
life: Satisfaction outcomes--Diabetes intrusiveness
resources vs. basic intervention alone. The basic intervention condition received by all participants involved a meeting with a health counselor at a central location and having specific dietary goals set with the aid of a multimedia touch-screen computer
67 28.6 28.2 -0.4 2.2
Physiologic Percentage Telephone 67 7.6 7.4 -0.2 0.1 0

Evidence Table 11. Outcomes related to diabetes mellitus in studies addressing clinical outcomes (continued)
G-498
Study, Year Outcomes Measure Unit
Description of Intervention
n Final Control n Final Intervention
Control Outcome Measure at Baseline Intervention Outcome Measure at Baseline
Control Outcome Measure at Final Intervention Outcome Measure at Final
Control Change Intervention Change
Change Difference Final Difference P-Value
outcomes: HbA1c
of HbA1c
follow-up support and community resources vs. basic intervention. The basic intervention condition received by all participants involved a meeting with a health counselor at a central location and having specific dietary goals set with the aid of a multimedia touch-screen computer
68 7.6 7.5 -0.1 0.1
Physiologic mg/dl Telephone 67 210 206 -4 0 0

Evidence Table 11. Outcomes related to diabetes mellitus in studies addressing clinical outcomes (continued)
G-499
Study, Year Outcomes Measure Unit
Description of Intervention
n Final Control n Final Intervention
Control Outcome Measure at Baseline Intervention Outcome Measure at Baseline
Control Outcome Measure at Final Intervention Outcome Measure at Final
Control Change Intervention Change
Change Difference Final Difference P-Value
outcomes: Total cholesterol
follow-up support and community resources vs. Basic intervention. The basic intervention condition received by all participants involved a meeting with a health counselor at a central location and having specific dietary goals set with the aid of a multimedia touch-screen computer
68 205 201 -4 -5
Physiologic kg Telephone 67 199 197 -2 0 0

Evidence Table 11. Outcomes related to diabetes mellitus in studies addressing clinical outcomes (continued)
G-500
Study, Year Outcomes Measure Unit
Description of Intervention
n Final Control n Final Intervention
Control Outcome Measure at Baseline Intervention Outcome Measure at Baseline
Control Outcome Measure at Final Intervention Outcome Measure at Final
Control Change Intervention Change
Change Difference Final Difference P-Value
outcomes: Weight
follow-up support and community resources vs. basic intervention. The basic intervention condition received by all participants involved a meeting with a health counselor at a central location and having specific dietary goals set with the aid of a multimedia touch-screen computer
68 221 219 -2 22
Physiologic outcomes: Lipid ratio
No unit
Telephone follow-up support and
67 5.1 4.9 -0.2 0
0.045

Evidence Table 11. Outcomes related to diabetes mellitus in studies addressing clinical outcomes (continued)
G-501
Study, Year Outcomes Measure Unit
Description of Intervention
n Final Control n Final Intervention
Control Outcome Measure at Baseline Intervention Outcome Measure at Baseline
Control Outcome Measure at Final Intervention Outcome Measure at Final
Control Change Intervention Change
Change Difference Final Difference P-Value
Total cholesterol/HDL cholesterol
community resources vs. basic intervention. The basic intervention condition received by all participants involved a meeting with a health counselor at a central location and having specific dietary goals set with the aid of a multimedia touch-screen computer
68 4.9 4.7 -0.2 -0.2
Quality of Score unit Telephone 67 25.7 26 0.3 -1.9 0

Evidence Table 11. Outcomes related to diabetes mellitus in studies addressing clinical outcomes (continued)
G-502
Study, Year Outcomes Measure Unit
Description of Intervention
n Final Control n Final Intervention
Control Outcome Measure at Baseline Intervention Outcome Measure at Baseline
Control Outcome Measure at Final Intervention Outcome Measure at Final
Control Change Intervention Change
Change Difference Final Difference P-Value
life: Satisfaction outcomes--Diabetes intrusiveness
follow-up support and community resources vs. basic intervention. The basic intervention condition received by all participants involved a meeting with a health counselor at a central location and having specific dietary goals set with the aid of a multimedia touch-screen computer
68 30.8 29.2 -1.6 3.2
Glasgow, HbA1c Percentage Intervention 354 7.3 7.13 -0.17 -0.02 0

Evidence Table 11. Outcomes related to diabetes mellitus in studies addressing clinical outcomes (continued)
G-503
Study, Year Outcomes Measure Unit
Description of Intervention
n Final Control n Final Intervention
Control Outcome Measure at Baseline Intervention Outcome Measure at Baseline
Control Outcome Measure at Final Intervention Outcome Measure at Final
Control Change Intervention Change
Change Difference Final Difference P-Value
20055
of HbA1c
group completed treatment components touch-screen, physician goal-setting care manager meeting and follow-up phone call. Health risks and risks reciting addressed the Provider Recognition Program measure vs. control group completed a touch-screen computer assessment but one that focused on general health risks and risks reciting that did not address the Provider Recognition Program measure
379 7.33 7.14 -0.19 0.01
Total No unit Intervention 354 4.38 4.14 -0.24 0.09 0

Evidence Table 11. Outcomes related to diabetes mellitus in studies addressing clinical outcomes (continued)
G-504
Study, Year Outcomes Measure Unit
Description of Intervention
n Final Control n Final Intervention
Control Outcome Measure at Baseline Intervention Outcome Measure at Baseline
Control Outcome Measure at Final Intervention Outcome Measure at Final
Control Change Intervention Change
Change Difference Final Difference P-Value
cholesterol/ HDL cholesterol
group completed treatment components touch-screen, physician goal-setting care manager meeting and follow-up phone call. Health risks and risks reciting addressed the Provider Recognition Program measure vs. control group completed a touch-screen computer assessment but one that focused on general health risks and risks reciting that did not address the Provider Recognition Program measure
379 4.32 4.17 -0.15 0.03
Glasgow, HbA1c Percentage Tailored self- 153 7.5 7.5 0 -0.1 0

Evidence Table 11. Outcomes related to diabetes mellitus in studies addressing clinical outcomes (continued)
G-505
Study, Year Outcomes Measure Unit
Description of Intervention
n Final Control n Final Intervention
Control Outcome Measure at Baseline Intervention Outcome Measure at Baseline
Control Outcome Measure at Final Intervention Outcome Measure at Final
Control Change Intervention Change
Change Difference Final Difference P-Value
20066
of glycated hemoglobin
management vs. computer-aided enhanced usual care
148 7.4 7.3 -0.1 -0.2
Total cholesterol/HDL cholesterol
No unit
Tailored self-management vs. computer-aided enhanced usual care
153 3.9 3.8 -0.1 0 0 148 3.9 3.8 -0.1 0
Patient Health Questionaire-9 total score
Score unit
Tailored self-management vs. computer-aided enhanced usual care
153 5.4 5.5 0.1 -0.3 0 148 5.7 5.5 -0.2 0
Diabetes Distress scale
Score unit
Ttailored self-management vs. computer-aided enhanced usual care
153 41.5 36.2 -5.3 -1.2 0 148 40.1 33.6 -6.5 -2.6
Total cholesterol
mg/dl
Tailored self-management vs. computer-aided enhanced usual care
153 185.1 184.1 -1 -1 148 185.1 183.1 -2 -1
HDL cholesterol
mg/dl
Tailored self-management vs. computer-aided enhanced usual care
153 50 50.9 0.9 0.3 0.083 148 49.2 50.4 1.2 -0.5
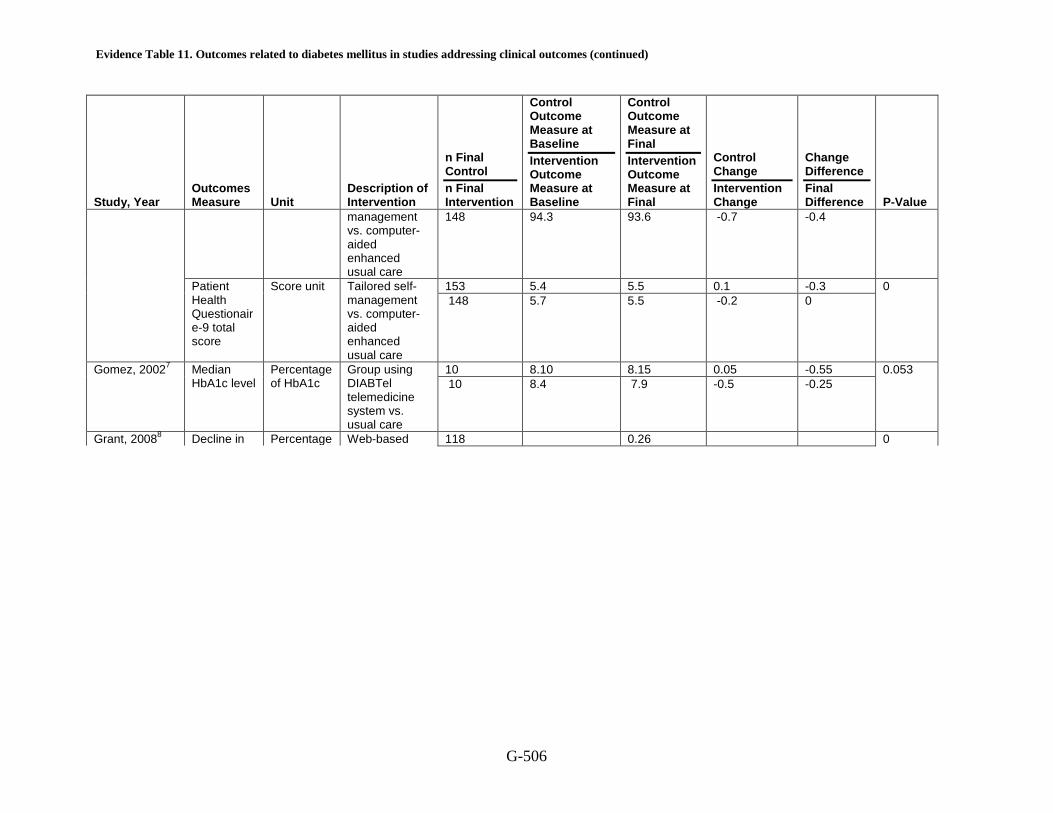
Weight Grams Tailored self- 153 94 94 0 -0.7 0.007
Evidence Table 11. Outcomes related to diabetes mellitus in studies addressing clinical outcomes (continued)
G-506
Study, Year Outcomes Measure Unit
Description of Intervention
n Final Control n Final Intervention
Control Outcome Measure at Baseline Intervention Outcome Measure at Baseline
Control Outcome Measure at Final Intervention Outcome Measure at Final
Control Change Intervention Change
Change Difference Final Difference P-Value
management vs. computer-aided enhanced usual care
148 94.3 93.6 -0.7 -0.4
Patient Health Questionaire-9 total score
Score unit
Tailored self-management vs. computer-aided enhanced usual care
153 5.4 5.5 0.1 -0.3 0 148 5.7 5.5 -0.2 0
Gomez, 20027
Median HbA1c level
Percentage of HbA1c
Group using DIABTel telemedicine system vs. usual care
10 8.10 8.15 0.05 -0.55 0.053 10 8.4 7.9 -0.5 -0.25
Grant, 20088 Decline in Percentage Web-based 118 0.26 0

Evidence Table 11. Outcomes related to diabetes mellitus in studies addressing clinical outcomes (continued)
G-507
Study, Year Outcomes Measure Unit
Description of Intervention
n Final Control n Final Intervention
Control Outcome Measure at Baseline Intervention Outcome Measure at Baseline
Control Outcome Measure at Final Intervention Outcome Measure at Final
Control Change Intervention Change
Change Difference Final Difference P-Value
HbA1c
of HbA1c
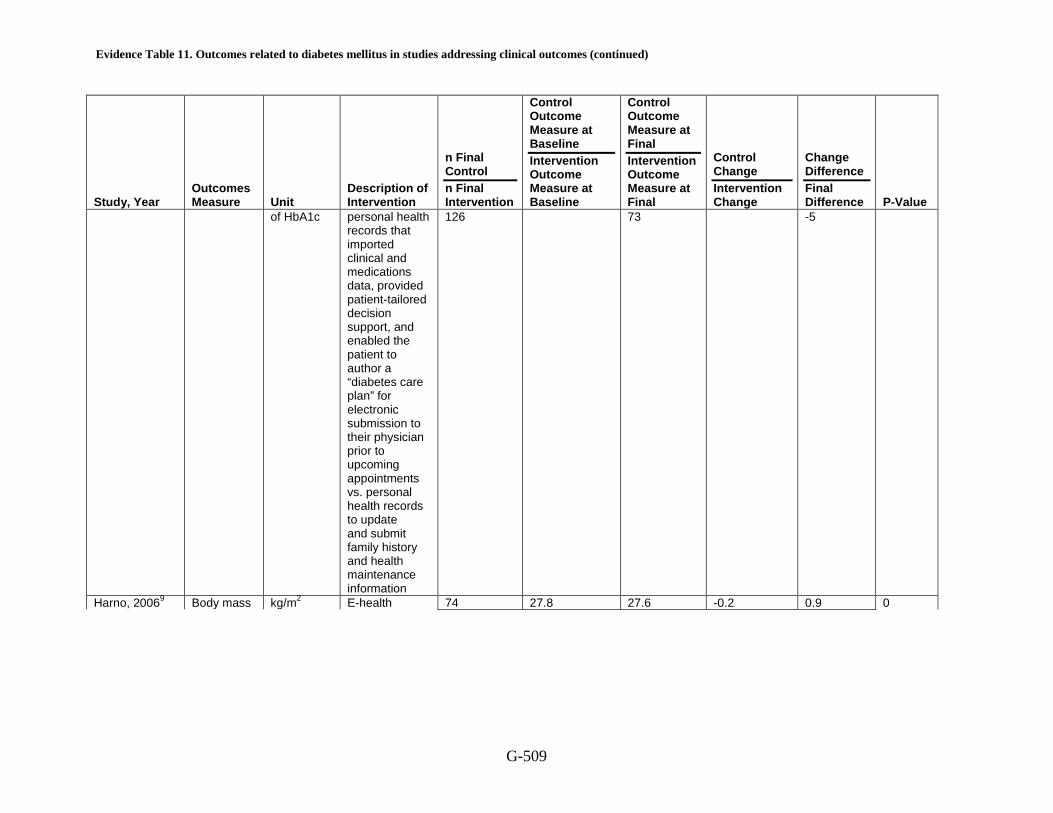
personal health records that imported clinical and medications data, provided patient-tailored decision support, and enabled the patient to author a “diabetes care plan” for electronic submission to their physician prior to upcoming appointments vs. personal health records to update and submit family history and health maintenance information
126 0.16 0.1
HbA1c Percentage Web-based 118 7.2 0

Evidence Table 11. Outcomes related to diabetes mellitus in studies addressing clinical outcomes (continued)
G-508
Study, Year Outcomes Measure Unit
Description of Intervention
n Final Control n Final Intervention
Control Outcome Measure at Baseline Intervention Outcome Measure at Baseline
Control Outcome Measure at Final Intervention Outcome Measure at Final
Control Change Intervention Change
Change Difference Final Difference P-Value
of HbA1c personal health records that imported clinical and medications data, provided patient-tailored decision support, and enabled the patient to author a “diabetes care plan” for electronic submission to their physician prior to upcoming appointments vs. personal health records to update and submit family history and health maintenance information
126 7.1 0.1
HbA1c goal Percentage Web-based 118 68 0
Evidence Table 11. Outcomes related to diabetes mellitus in studies addressing clinical outcomes (continued)
G-509
Study, Year Outcomes Measure Unit
Description of Intervention
n Final Control n Final Intervention
Control Outcome Measure at Baseline Intervention Outcome Measure at Baseline
Control Outcome Measure at Final Intervention Outcome Measure at Final
Control Change Intervention Change
Change Difference Final Difference P-Value
of HbA1c
personal health records that imported clinical and medications data, provided patient-tailored decision support, and enabled the patient to author a “diabetes care plan” for electronic submission to their physician prior to upcoming appointments vs. personal health records to update and submit family history and health maintenance information
126 73 -5
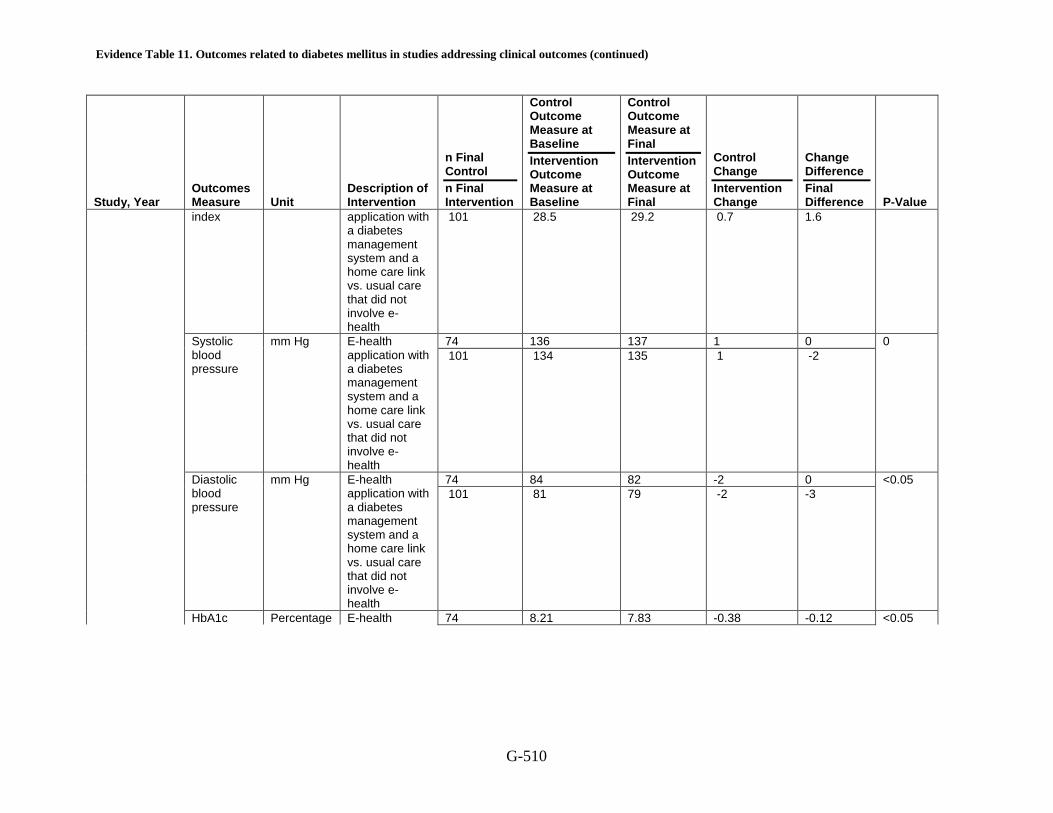
Harno, 20069 Body mass kg/m2 E-health 74 27.8 27.6 -0.2 0.9 0
Evidence Table 11. Outcomes related to diabetes mellitus in studies addressing clinical outcomes (continued)
G-510
Study, Year Outcomes Measure Unit
Description of Intervention
n Final Control n Final Intervention
Control Outcome Measure at Baseline Intervention Outcome Measure at Baseline
Control Outcome Measure at Final Intervention Outcome Measure at Final
Control Change Intervention Change
Change Difference Final Difference P-Value
index
application with a diabetes management system and a home care link vs. usual care that did not involve e-health
101 28.5 29.2 0.7 1.6
Systolic blood pressure
mm Hg
E-health application with a diabetes management system and a home care link vs. usual care that did not involve e-health
74 136 137 1 0 0 101 134 135 1 -2
Diastolic blood pressure
mm Hg
E-health application with a diabetes management system and a home care link vs. usual care that did not involve e-health
74 84 82 -2 0 <0.05 101 81 79 -2 -3
HbA1c Percentage E-health 74 8.21 7.83 -0.38 -0.12 <0.05

Evidence Table 11. Outcomes related to diabetes mellitus in studies addressing clinical outcomes (continued)
G-511
Study, Year Outcomes Measure Unit
Description of Intervention
n Final Control n Final Intervention
Control Outcome Measure at Baseline Intervention Outcome Measure at Baseline
Control Outcome Measure at Final Intervention Outcome Measure at Final
Control Change Intervention Change
Change Difference Final Difference P-Value
of HbA1c
application with a diabetes management system and a home care link vs. usual care that did not involve e-health
101 7.82 7.32 -0.5 -0.51
Fasting glucose
mg/dl E-health application with a diabetes management system and a home care link vs. usual care that did not involve e-health
74 9.91 10.87 0.96 -1.16 <0.001 101 9.08 8.88 -0.2 -1.99
Cholesterol
mmol/l
E-health application with a diabetes management system and a home care link vs. usual care that did not involve e-health
74 4.91 5.03 0.12 -0.33 <0.05 101 4.95 4.74 -0.21 -0.29
HDL mmol/l E-health 74 1.58 1.55 -0.03 0.11 0

Evidence Table 11. Outcomes related to diabetes mellitus in studies addressing clinical outcomes (continued)
G-512
Study, Year Outcomes Measure Unit
Description of Intervention
n Final Control n Final Intervention
Control Outcome Measure at Baseline Intervention Outcome Measure at Baseline
Control Outcome Measure at Final Intervention Outcome Measure at Final
Control Change Intervention Change
Change Difference Final Difference P-Value
application with a diabetes management system and a home care link vs. usual care that did not involve e-health
101 1.58 1.66 0.08 0.11
LDL
mmol/l
E-health application with a diabetes management system and a home care link vs. usual care that did not involve e-health
74 2.65 2.76 0.11 -0.29 <0.05 101 2.7 2.52 0.18 -0.24
Triglyceride
mmol/l
E-health application with a diabetes management system and a home care link vs. usual care that did not involve e-health
74 1.46 1.67 0.21 -0.26 <0.05 101 1.49 1.44 -0.05 -0.23
Creatinine mmol/l E-health 74 84 73 -11 0 0

Evidence Table 11. Outcomes related to diabetes mellitus in studies addressing clinical outcomes (continued)
G-513
Study, Year Outcomes Measure Unit
Description of Intervention
n Final Control n Final Intervention
Control Outcome Measure at Baseline Intervention Outcome Measure at Baseline
Control Outcome Measure at Final Intervention Outcome Measure at Final
Control Change Intervention Change
Change Difference Final Difference P-Value
application with a diabetes management system and a home care link vs. usual care that did not involve e-health
101 86 75 -11 2
Hetlevik, 200010
Average HbA1c in registered patients
Percentage of HbA1c
Diabetes mellitus patients whose physicians used a computer-based clinical decision support system (CDSS) vs. diabetes mellitus patients whose physicians used pre-existing routines for treatment
408 8.2 8 -0.2 -0.1 0.083 368 8.2 7.9 -0.3 -0.1
Systolic mm Hg Diabetes 408 151.7 153.7 2 -3.1 **SNR

Evidence Table 11. Outcomes related to diabetes mellitus in studies addressing clinical outcomes (continued)
G-514
Study, Year Outcomes Measure Unit
Description of Intervention
n Final Control n Final Intervention
Control Outcome Measure at Baseline Intervention Outcome Measure at Baseline
Control Outcome Measure at Final Intervention Outcome Measure at Final
Control Change Intervention Change
Change Difference Final Difference P-Value
blood pressure in registered patients
mellitus patients whose physicians used a computer-based clinical decision support system (CDSS) vs. diabetes mellitus patients whose physicians used pre-existing routines for treatment
368 152.5 151.4 -1.1 -2.3
Diastolic blood pressure in registered patients
mm Hg
Diabetes mellitus patients whose physicians used a computer-based clinical decision support system (CDSS) vs. diabetes mellitus patients whose physicians used pre-existing routines for treatment
408 85.3 85.3 0 -1.7 **SNR 368 84.5 82.8 -1.7 -2.5

Evidence Table 11. Outcomes related to diabetes mellitus in studies addressing clinical outcomes (continued)
G-515
Study, Year Outcomes Measure Unit
Description of Intervention
n Final Control n Final Intervention
Control Outcome Measure at Baseline Intervention Outcome Measure at Baseline
Control Outcome Measure at Final Intervention Outcome Measure at Final
Control Change Intervention Change
Change Difference Final Difference P-Value
Serum cholesterol in registered patients
mmol/l
Diabetes mellitus patients whose physicians used a computer-based clinical decision support system (CDSS) vs. diabetes mellitus patients whose physicians used pre-existing routines for treatment
408 6.6 6.3 -0.3 -0.1 0.007 368 6.6 6.2 -0.4 -0.1
Body mass index in registered patients
kg/m2
Diabetes mellitus patients whose physicians used a computer-based clinical decision support system (CDSS) vs. diabetes mellitus patients whose physicians used pre-existing routines for treatment
408 28.3 <0.001 368 28.6 0.3

Evidence Table 11. Outcomes related to diabetes mellitus in studies addressing clinical outcomes (continued)
G-516
Study, Year Outcomes Measure Unit
Description of Intervention
n Final Control n Final Intervention
Control Outcome Measure at Baseline Intervention Outcome Measure at Baseline
Control Outcome Measure at Final Intervention Outcome Measure at Final
Control Change Intervention Change
Change Difference Final Difference P-Value
Coronary heart disease risk score (female)
Score unit
Diabetes mellitus patients whose physicians used a computer-based clinical decision support system (CDSS) vs. diabetes mellitus patients whose physicians used pre-existing routines for treatment
408 14.2 **SNR 368 14.3 0.1
Coronary heart disease risk score (male)
Score unit
Diabetes mellitus patients whose physicians used a computer-based clinical decision support system (CDSS) vs. diabetes mellitus patients whose physicians used pre-existing routines for treatment
408 48.7 **SNR 368 51.4 2.7

Evidence Table 11. Outcomes related to diabetes mellitus in studies addressing clinical outcomes (continued)
G-517
Study, Year Outcomes Measure Unit
Description of Intervention
n Final Control n Final Intervention
Control Outcome Measure at Baseline Intervention Outcome Measure at Baseline
Control Outcome Measure at Final Intervention Outcome Measure at Final
Control Change Intervention Change
Change Difference Final Difference P-Value
Percentage of registered patients who are smokers
Percentage of patients with outcome
Diabetes mellitus patients whose physicians used a computer-based clinical decision support system (CDSS) vs. diabetes mellitus patients whose physicians used pre-existing routines for treatment
408 16 0.05 368 19 3
Percentage of registered patients with cardiovascular inheritance
Percentage of patients with outcome
Diabetes mellitus patients whose physicians used a computer-based clinical decision support system (CDSS) vs. diabetes mellitus patients whose physicians used pre-existing routines for treatment
408 63 <0.001 368 66 3

Evidence Table 11. Outcomes related to diabetes mellitus in studies addressing clinical outcomes (continued)
G-518
Study, Year Outcomes Measure Unit
Description of Intervention
n Final Control n Final Intervention
Control Outcome Measure at Baseline Intervention Outcome Measure at Baseline
Control Outcome Measure at Final Intervention Outcome Measure at Final
Control Change Intervention Change
Change Difference Final Difference P-Value
Homko, 200711
Percent of patients requiring diabetes therapy (diet)
Percentage of patients with outcome
Patients in the Internet group were provided with computer and Internet access. Women sent blood glucose and other health data directly to their care providers via the Internet and received information advice from their health care provider vs. women in the control group, who were asked to record their information in a logbook, which was reviewed by the medical team at prenatal visit
25 64 **SNR 32 44 -20
Percent of Percentage Patients in the 25 32 **SNR

Evidence Table 11. Outcomes related to diabetes mellitus in studies addressing clinical outcomes (continued)
G-519
Study, Year Outcomes Measure Unit
Description of Intervention
n Final Control n Final Intervention
Control Outcome Measure at Baseline Intervention Outcome Measure at Baseline
Control Outcome Measure at Final Intervention Outcome Measure at Final
Control Change Intervention Change
Change Difference Final Difference P-Value
patients requiring diabetes therapy (glyburide)
of patients with outcome
Internet group were provided with computer and internet access. Women sent blood glucose and other health data directly to their care providers via the Internet and received information advice from their health care provider vs. women in the control group, who were asked to record their information in a logbook, which was reviewed by the medical team at prenatal visit
32 25 -7
Percent of Percentage Patients in the 25 4 <0.05
Evidence Table 11. Outcomes related to diabetes mellitus in studies addressing clinical outcomes (continued)
G-520
Study, Year Outcomes Measure Unit
Description of Intervention
n Final Control n Final Intervention
Control Outcome Measure at Baseline Intervention Outcome Measure at Baseline
Control Outcome Measure at Final Intervention Outcome Measure at Final
Control Change Intervention Change
Change Difference Final Difference P-Value
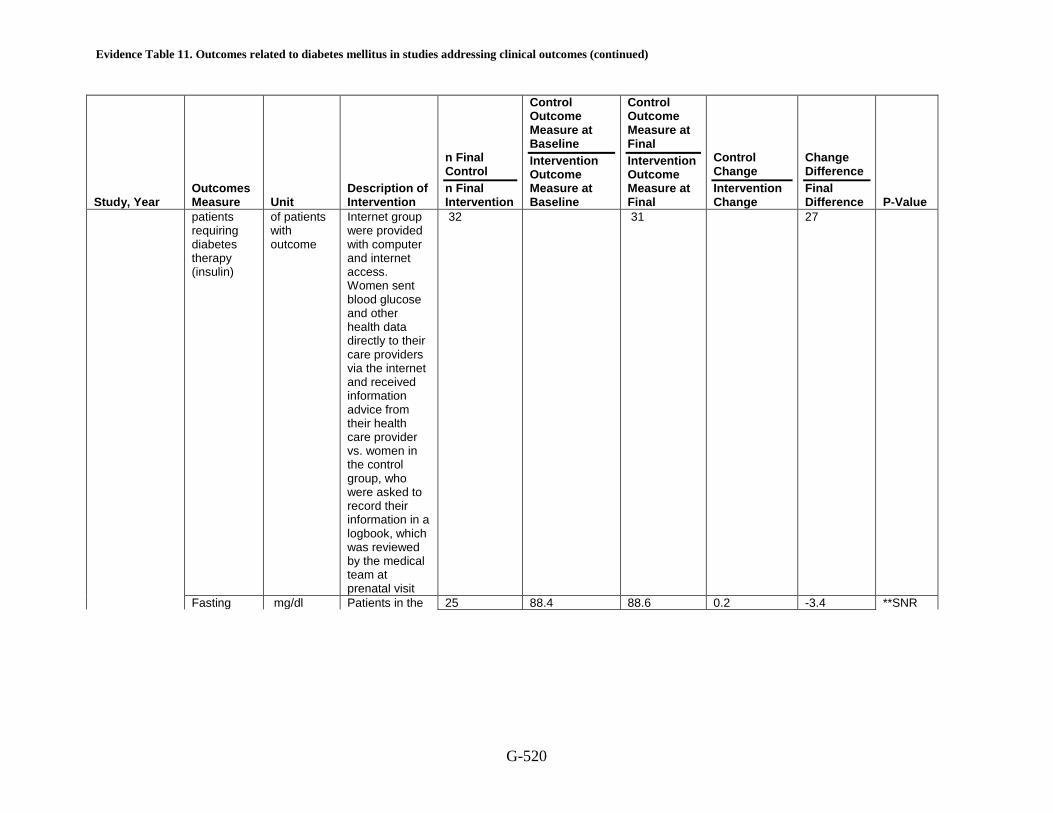
patients requiring diabetes therapy (insulin)
of patients with outcome
Internet group were provided with computer and internet access. Women sent blood glucose and other health data directly to their care providers via the internet and received information advice from their health care provider vs. women in the control group, who were asked to record their information in a logbook, which was reviewed by the medical team at prenatal visit
32 31 27
Fasting mg/dl Patients in the 25 88.4 88.6 0.2 -3.4 **SNR

Evidence Table 11. Outcomes related to diabetes mellitus in studies addressing clinical outcomes (continued)
G-521
Study, Year Outcomes Measure Unit
Description of Intervention
n Final Control n Final Intervention
Control Outcome Measure at Baseline Intervention Outcome Measure at Baseline
Control Outcome Measure at Final Intervention Outcome Measure at Final
Control Change Intervention Change
Change Difference Final Difference P-Value
blood sugar
Internet group were provided with computer and internet access. Women sent blood glucose and other health data directly to their care providers via the internet and received information advice from their health care provider vs. women in the control group, who were asked to record their information in a logbook, which was reviewed by the medical team at prenatal visit
32 94 90.8 -3.2 2.2
HbA1c at Percentage Patients in the 25 6.2 **SNR

Evidence Table 11. Outcomes related to diabetes mellitus in studies addressing clinical outcomes (continued)
G-522
Study, Year Outcomes Measure Unit
Description of Intervention
n Final Control n Final Intervention
Control Outcome Measure at Baseline Intervention Outcome Measure at Baseline
Control Outcome Measure at Final Intervention Outcome Measure at Final
Control Change Intervention Change
Change Difference Final Difference P-Value
delivery
of HbA1c
Internet group were provided with computer and internet access. Women sent blood glucose and other health data directly to their care providers via the internet and received information advice from their health care provider vs. women in the control group, who were asked to record their information in a logbook, which was reviewed by the medical team at prenatal visit
32 6.1 -0.1
Maternal mg/dl Patients in the 25 104.5 **SNR

Evidence Table 11. Outcomes related to diabetes mellitus in studies addressing clinical outcomes (continued)
G-523
Study, Year Outcomes Measure Unit
Description of Intervention
n Final Control n Final Intervention
Control Outcome Measure at Baseline Intervention Outcome Measure at Baseline
Control Outcome Measure at Final Intervention Outcome Measure at Final
Control Change Intervention Change
Change Difference Final Difference P-Value
glucose control: Mean blood glucose (mg/dl)
Internet group were provided with computer and internet access. Women sent blood glucose and other health data directly to their care providers via the internet and received information advice from their health care provider vs. women in the control group, who were asked to record their information in a logbook, which was reviewed by the medical team at prenatal visit
32 106.6 2.1
Maternal Percentage Patients in the 25 40 0

Evidence Table 11. Outcomes related to diabetes mellitus in studies addressing clinical outcomes (continued)
G-524
Study, Year Outcomes Measure Unit
Description of Intervention
n Final Control n Final Intervention
Control Outcome Measure at Baseline Intervention Outcome Measure at Baseline
Control Outcome Measure at Final Intervention Outcome Measure at Final
Control Change Intervention Change
Change Difference Final Difference P-Value
pregnancy outcome: Caesarean delivery
of patients with outcome
Internet group were provided with computer and internet access. Women sent blood glucose and other health data directly to their care providers via the internet and received information advice from their health care provider vs. women in the control group, who were asked to record their information in a logbook, which was reviewed by the medical team at prenatal visit
32 69 29
Maternal Percentage Patients in the 25 12 **SNR

Evidence Table 11. Outcomes related to diabetes mellitus in studies addressing clinical outcomes (continued)
G-525
Study, Year Outcomes Measure Unit
Description of Intervention
n Final Control n Final Intervention
Control Outcome Measure at Baseline Intervention Outcome Measure at Baseline
Control Outcome Measure at Final Intervention Outcome Measure at Final
Control Change Intervention Change
Change Difference Final Difference P-Value
pregnancy outcome: Premature rupture of membranes
of patients with outcome
Internet group were provided with computer and internet access. Women sent blood glucose and other health data directly to their care providers via the internet and received information advice from their health care provider vs. women in the control group, who were asked to record their information in a logbook, which was reviewed by the medical team at prenatal visit prenatal visit
32 -9
Maternal Percentage Patients in the 25 0 **SNR
Evidence Table 11. Outcomes related to diabetes mellitus in studies addressing clinical outcomes (continued)
G-526
Study, Year Outcomes Measure Unit
Description of Intervention
n Final Control n Final Intervention
Control Outcome Measure at Baseline Intervention Outcome Measure at Baseline
Control Outcome Measure at Final Intervention Outcome Measure at Final
Control Change Intervention Change
Change Difference Final Difference P-Value
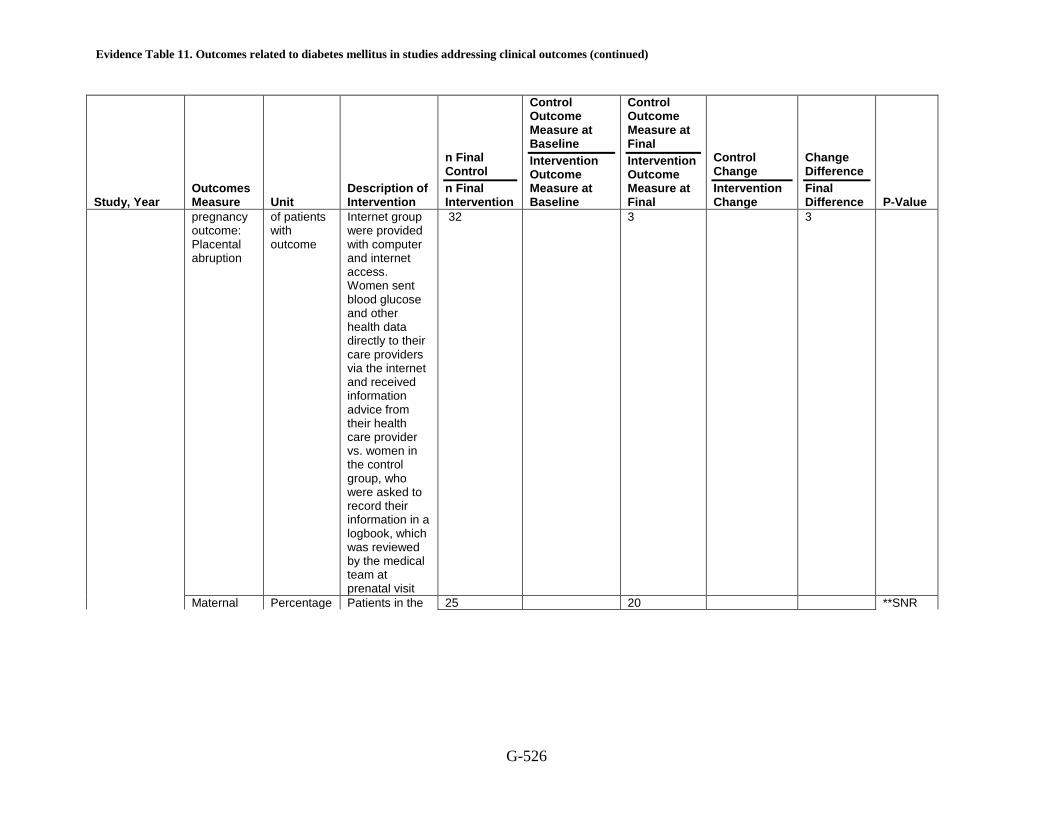
pregnancy outcome: Placental abruption
of patients with outcome
Internet group were provided with computer and internet access. Women sent blood glucose and other health data directly to their care providers via the internet and received information advice from their health care provider vs. women in the control group, who were asked to record their information in a logbook, which was reviewed by the medical team at prenatal visit
32 3 3
Maternal Percentage Patients in the 25 20 **SNR

Evidence Table 11. Outcomes related to diabetes mellitus in studies addressing clinical outcomes (continued)
G-527
Study, Year Outcomes Measure Unit
Description of Intervention
n Final Control n Final Intervention
Control Outcome Measure at Baseline Intervention Outcome Measure at Baseline
Control Outcome Measure at Final Intervention Outcome Measure at Final
Control Change Intervention Change
Change Difference Final Difference P-Value
pregnancy outcome: Pre-eclampsia/ gestational hypertension
of patients with outcome
Internet group were provided with computer and internet access. Women sent blood glucose and other health data directly to their care providers via the internet and received information advice from their health care provider vs. Women in the control group, who were asked to record their information in a logbook, which was reviewed by the medical team at prenatal visit
32 28 8
Laffel, 200712 Mean Percentage Integrated 92 0.27 0

Evidence Table 11. Outcomes related to diabetes mellitus in studies addressing clinical outcomes (continued)
G-528
Study, Year Outcomes Measure Unit
Description of Intervention
n Final Control n Final Intervention
Control Outcome Measure at Baseline Intervention Outcome Measure at Baseline
Control Outcome Measure at Final Intervention Outcome Measure at Final
Control Change Intervention Change
Change Difference Final Difference P-Value
decrease in HbA1c
of HbA1c
glucose meters and electronic logbooks (electronic group) vs. paper log books (control group)
113 0.35 0.08
Montori, 200413
Mean HbA1c level
Percentage of glycated hemoglobin
Telecare (glucometer transmission with feedback) vs. glucometer transmission without feedback
15 8.8 8.2 -0.6 -0.7 0.03 13 9.1 7.8 -1.3 -0.4
Proportion of patients with HbA1c with HbA1c <=0.7% after 6months
Percentage of patients with outcome
Telecare (glucometer transmission with feedback) vs. glucometer transmission without feedback
15 7 0 **SNR 13 29 22
Noel, 200414 Bed-days- Days Intervention 57 525 194 -331 63 <0.0001

Evidence Table 11. Outcomes related to diabetes mellitus in studies addressing clinical outcomes (continued)
G-529
Study, Year Outcomes Measure Unit
Description of Intervention
n Final Control n Final Intervention
Control Outcome Measure at Baseline Intervention Outcome Measure at Baseline
Control Outcome Measure at Final Intervention Outcome Measure at Final
Control Change Intervention Change
Change Difference Final Difference P-Value
of-care
patients received home telehealth units that used standard phone lines to communicate with the hospital and were integrated into hospital electronic health records vs. usual home healthcare services plus nurse case management
47 317 49 -268 -145
Urgent Visits Intervention 57 302 307 5 -88 0.023

Evidence Table 11. Outcomes related to diabetes mellitus in studies addressing clinical outcomes (continued)
G-530
Study, Year Outcomes Measure Unit
Description of Intervention
n Final Control n Final Intervention
Control Outcome Measure at Baseline Intervention Outcome Measure at Baseline
Control Outcome Measure at Final Intervention Outcome Measure at Final
Control Change Intervention Change
Change Difference Final Difference P-Value
clinic/emergency room visits
patients received home telehealth units that used standard phone lines to communicate with the hospital and were integrated into hospital electronic health records vs. usual home healthcare services plus nurse case management
47 320 237 -83 -70
HbA1c Percentage Intervention 57 7.03 7.83 0.8 -1.8 <0.0001

Evidence Table 11. Outcomes related to diabetes mellitus in studies addressing clinical outcomes (continued)
G-531
Study, Year Outcomes Measure Unit
Description of Intervention
n Final Control n Final Intervention
Control Outcome Measure at Baseline Intervention Outcome Measure at Baseline
Control Outcome Measure at Final Intervention Outcome Measure at Final
Control Change Intervention Change
Change Difference Final Difference P-Value
of glycated hemoglobin
patients received home telehealth units that used standard phone lines to communicate with the hospital and were integrated into hospital electronic health records vs. usual home healthcare services plus nurse case management
47 8.3 7.3 -1 -0.53
Cognitive Score unit Intervention 57 19.42 19.43 0.01 0.68 <0.028

Evidence Table 11. Outcomes related to diabetes mellitus in studies addressing clinical outcomes (continued)
G-532
Study, Year Outcomes Measure Unit
Description of Intervention
n Final Control n Final Intervention
Control Outcome Measure at Baseline Intervention Outcome Measure at Baseline
Control Outcome Measure at Final Intervention Outcome Measure at Final
Control Change Intervention Change
Change Difference Final Difference P-Value
status
patients received home telehealth units that used standard phone lines to communicate with the hospital and were integrated into hospital electronic health records vs. usual home healthcare services plus nurse case management
47 19.31 20 0.69 0.57
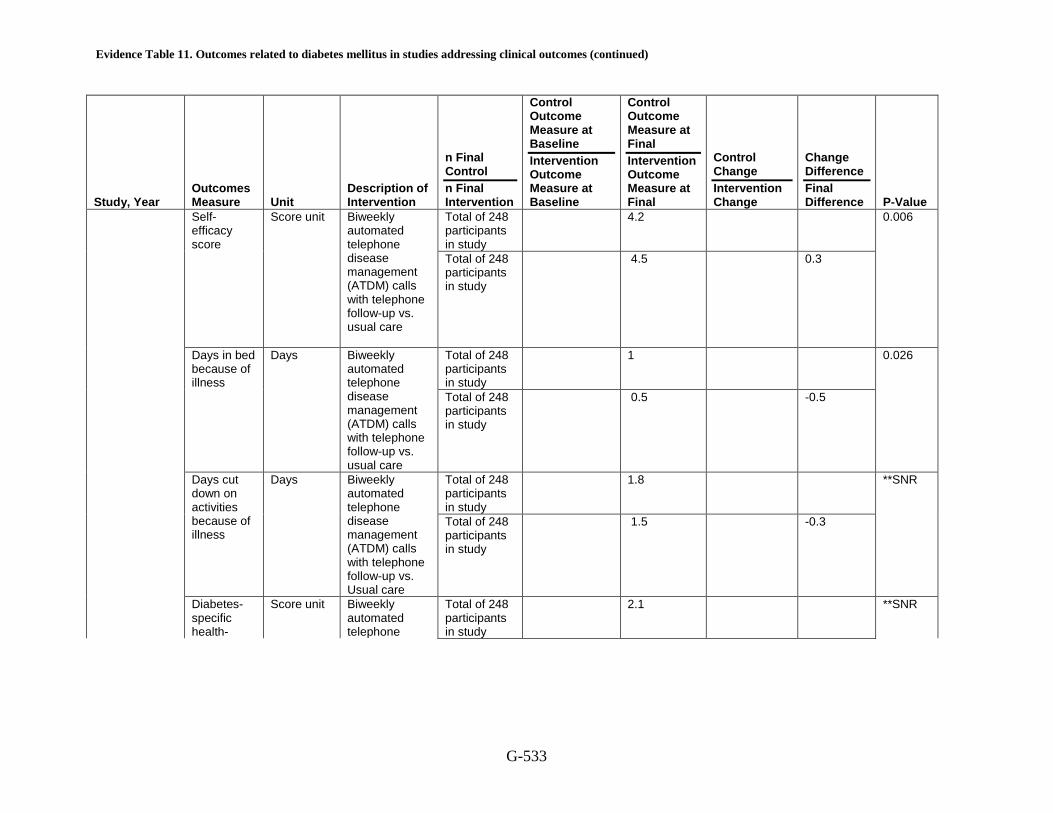
Piette, 200015
Depression score
Score unit
Biweekly automated telephone disease management (ATDM) calls with telephone follow-up vs. usual care
Total of 248 participants in study
17.6 0.023
Total of 248 participants in study
13.7 -3.9
Anxiety score
Score unit
Biweekly automated telephone disease management (ATDM) calls with telephone follow-up vs. usual care
Total of 248 participants in study
3.7 **SNR
Total of 248 participants in study
3.8 0.1
Evidence Table 11. Outcomes related to diabetes mellitus in studies addressing clinical outcomes (continued)
G-533
Study, Year Outcomes Measure Unit
Description of Intervention
n Final Control n Final Intervention
Control Outcome Measure at Baseline Intervention Outcome Measure at Baseline
Control Outcome Measure at Final Intervention Outcome Measure at Final
Control Change Intervention Change
Change Difference Final Difference P-Value
Self-efficacy score
Score unit
Biweekly automated telephone disease management (ATDM) calls with telephone follow-up vs. usual care
Total of 248 participants in study
4.2 0.006
Total of 248 participants in study
4.5 0.3
Days in bed because of illness
Days
Biweekly automated telephone disease management (ATDM) calls with telephone follow-up vs. usual care
Total of 248 participants in study
1 0.026
Total of 248 participants in study
0.5 -0.5
Days cut down on activities because of illness
Days
Biweekly automated telephone disease management (ATDM) calls with telephone follow-up vs. Usual care
Total of 248 participants in study
1.8 **SNR
Total of 248 participants in study
1.5 -0.3
Diabetes-specific health-
Score unit
Biweekly automated telephone
Total of 248 participants in study
2.1 **SNR

Evidence Table 11. Outcomes related to diabetes mellitus in studies addressing clinical outcomes (continued)
G-534
Study, Year Outcomes Measure Unit
Description of Intervention
n Final Control n Final Intervention
Control Outcome Measure at Baseline Intervention Outcome Measure at Baseline
Control Outcome Measure at Final Intervention Outcome Measure at Final
Control Change Intervention Change
Change Difference Final Difference P-Value
related quality of life: Summary scale
disease management (ATDM) calls with telephone follow-up vs. usual care
Total of 248 participants in study
2.1 0
General health-related quality of life: Physical functioning
Score unit
Biweekly automated telephone disease management (ATDM) calls with telephone follow-up vs. usual care
Total of 248 participants in study
52.7 **SNR
Total of 248 participants in study
58.5 5.8
General health-related quality of life: Role limitations (physical)
Score unit
Biweekly automated telephone disease management (ATDM) calls with telephone follow-up vs. usual care
Total of 248 participants in study
49.3 **SNR
Total of 248 participants in study
46 -3.3
General health-related quality of life: Social functioning
Score unit
Biweekly automated telephone disease management (ATDM) calls with telephone follow-up vs. usual care
Total of 248 participants in study
69.3 **SNR
Total of 248 participants in study
76.2 6.9
General health-related
Score unit
Biweekly automated telephone
Total of 248 participants in study
56.7 **SNR

Evidence Table 11. Outcomes related to diabetes mellitus in studies addressing clinical outcomes (continued)
G-535
Study, Year Outcomes Measure Unit
Description of Intervention
n Final Control n Final Intervention
Control Outcome Measure at Baseline Intervention Outcome Measure at Baseline
Control Outcome Measure at Final Intervention Outcome Measure at Final
Control Change Intervention Change
Change Difference Final Difference P-Value
quality of life: Bodily pain
disease management (ATDM) calls with telephone follow-up vs. usual care
Total of 248 participants in study
60.2 3.5
General health-related quality of life: Role limitations (mental)
Score unit
Biweekly automated telephone disease management (ATDM) calls with telephone follow-up vs. usual care
Total of 248 participants in study
74.3 **SNR
Total of 248 participants in study
80.3 6
General health-related quality of life: General health perceptions
Score unit
Biweekly automated telephone disease management (ATDM) calls with telephone follow-up vs. usual care
Total of 248 participants in study
42.4 <0.042 46.1 3.7
Quinn, 200816 HbA1c level Percentage Well-doc 13 9.05 8.37 -0.68 -1.35 <0.02

Evidence Table 11. Outcomes related to diabetes mellitus in studies addressing clinical outcomes (continued)
G-536
Study, Year Outcomes Measure Unit
Description of Intervention
n Final Control n Final Intervention
Control Outcome Measure at Baseline Intervention Outcome Measure at Baseline
Control Outcome Measure at Final Intervention Outcome Measure at Final
Control Change Intervention Change
Change Difference Final Difference P-Value
of glycated hemoglobin
intervention vs. Control group. The intervention group received cell phone-based software designed by endocrinologists and certified diabetes educators. Patients randomized to the control group received One Touch Ultra™ BG meters (Life scan, Milpitas, CA) and adequate BG testing strips and lancets for the duration of the trial
13 9.51 7.48 -2.03 -0.89
New Percent of Well-doc 13 20 0

Evidence Table 11. Outcomes related to diabetes mellitus in studies addressing clinical outcomes (continued)
G-537
Study, Year Outcomes Measure Unit
Description of Intervention
n Final Control n Final Intervention
Control Outcome Measure at Baseline Intervention Outcome Measure at Baseline
Control Outcome Measure at Final Intervention Outcome Measure at Final
Control Change Intervention Change
Change Difference Final Difference P-Value
diagnosis depression
patients with new diagnosis
intervention vs. control group. The intervention group received cell phone-based software designed by endocrinologists and certified diabetes educators. Patients randomized to the control group received One Touch Ultra™ BG meters (Lifescan, Milpitas, CA) and adequate BG testing strips and lancets for the duration of the trial.
13 9 -11
Ralston, 200917
Mean glycated hemoglobin
Percentage of glycated hemoglobin
Web-based care management vs. usual care
35 7.9 8.1 0.2 -1.1 0.01 39 8.2 7.3 -0.9 -0.8
Glycated Percentage Web-based 35 100 89 11 22 0.03

Evidence Table 11. Outcomes related to diabetes mellitus in studies addressing clinical outcomes (continued)
G-538
Study, Year Outcomes Measure Unit
Description of Intervention
n Final Control n Final Intervention
Control Outcome Measure at Baseline Intervention Outcome Measure at Baseline
Control Outcome Measure at Final Intervention Outcome Measure at Final
Control Change Intervention Change
Change Difference Final Difference P-Value
hemoglobin<7%
of patients with outcome
care management vs. usual care
39 100 67 33 -22
Shea, 2007 18
Mean HbA1c level
% of HbA1c
Home telemedicine unit vs. no home telemedicine unit
821 7.42 7.17 0.25 0.13 0.006 844 7.35 6.97 0.38 -0.2
HbA1c in subgroup with HbA1c >7% at baseline
% of HbA1c
Home telemedicine unit vs. no home telemedicine unit
821 8.52 7.78 0.74 0.19 0.002 844 8.35 7.42 0.93 -0.36
Smith, 200819
HbA1c (median
Percentage of HbA1c
Virtual consultation vs. no virtual consultation
277 7.3 6.7 -0.6 0 0 358 7.3 6.7 -0.6 0
Systolic blood pressure, median
mm Hg
Virtual consultation vs. no virtual consultation
277 130 128 -2 1 0 358 130 129 -1 1
Diastolic blood pressure (mm Hg), median
Mm Hg
Virtual consultation vs. no virtual consultation
277 72 70 -2 0 0 358 72 70 -2 0
LDL-c (mg/dl), median
Mg/dl
Virtual consultation vs. no virtual consultation
277 105 95 -10 -2 0 358 104 92 -12 -3
Estimated Score unit Virtual 277 16 16 0 -3 0

Evidence Table 11. Outcomes related to diabetes mellitus in studies addressing clinical outcomes (continued)
G-539
Study, Year Outcomes Measure Unit
Description of Intervention
n Final Control n Final Intervention
Control Outcome Measure at Baseline Intervention Outcome Measure at Baseline
Control Outcome Measure at Final Intervention Outcome Measure at Final
Control Change Intervention Change
Change Difference Final Difference P-Value
10-yr coronary artery disease risk 10-y risk, median
consultation vs. no virtual consultation
358 18 15 -3 -1
Minnesota community aggregate optimal diabetes score
Percentage of patients with outcome
Virtual consultation vs. no virtual consultation
277 18 0 358 30 12
Thomas, 200720
Mean HgbA1c
Percentage of glycated hemoglobin
Computerized diabetes registry vs. control group (usual clinic education)
231 7.4 7.4 0 0 0 252 7.3 7.3 0 -0.1
Mean LDL cholesterol
mg/dl
Computerized diabetes registry vs. control group (usual clinic education)
231 101.6 97.5 -4.1 -1.1 0 252 103.6 98.4 -5.2 0.9
Mean systolic blood pressure
mm Hg
Computerized diabetes registry vs. control group (usual clinic education)
231 129.1 130.8 1.7 -2.2 0 252 131.5 131 -0.5 0.2
Mean mm Hg Computerized 231 70.5 73.5 3 -3.2 0

Evidence Table 11. Outcomes related to diabetes mellitus in studies addressing clinical outcomes (continued)
G-540
Study, Year Outcomes Measure Unit
Description of Intervention
n Final Control n Final Intervention
Control Outcome Measure at Baseline Intervention Outcome Measure at Baseline
Control Outcome Measure at Final Intervention Outcome Measure at Final
Control Change Intervention Change
Change Difference Final Difference P-Value
diastolic blood pressure
diabetes registry vs. Control group (usual clinic education)
252 72.6 72.4 -0.2 -1.1
HbA1c
% of glycated hemoglobin
Patients receiving weekly medical support through SMS based upon weekly review of glucose values vs. patients downloading self-monitored blood glucose (SMBG) values on a weekly basis without receiving SMS
30 8.22 8.34 0.12 -0.25 0.097 30 8.31 8.18 -0.13 -0.16
HgbA1c <7.0% (% with outcome)
% of patients with outcome
Computerized diabetes registry vs. control group (usual clinic education)
231 62 0 0 252 58 -4
Mean LDL <100 mg/dl (% with outcome)
Percentage of patients with outcome
Computerized diabetes registry vs. control group (usual clinic education)
231 61 0 252 60 -1
Bp <130/85 Percentage Computerized 231 50 0 0

Evidence Table 11. Outcomes related to diabetes mellitus in studies addressing clinical outcomes (continued)
G-541
Study, Year Outcomes Measure Unit
Description of Intervention
n Final Control n Final Intervention
Control Outcome Measure at Baseline Intervention Outcome Measure at Baseline
Control Outcome Measure at Final Intervention Outcome Measure at Final
Control Change Intervention Change
Change Difference Final Difference P-Value
mmHg (% with outcome
of patients with outcome
diabetes registry vs. control group (usual clinic education)
252 50 0
Yoon, 200821 Mean HbA1c level
HbA1c Access to a website through cell phones or wired connections transmitting blood glucose levels weekly through telecare and receiving feedback and suggestions from providers vs. usual care that did not use cell phones for treatment
26 7.59 8.4 0.81 -2.13 <0.05 25 8.09 6.77 -1.32 -1.63
**SNR: Significance not reported
P-value of 0 = p-value > 0.10 ATDM: Automated telephone disease management, BG: Blood glucose, SMS: Short message service, CDSS: Clinical decision support system, dl: Deciliter, HbA1c: Glycated hemoglobin, HDL: High-density lipoprotein, kg: Kilograms, LDL: Low-density lipoprotein, mg: Milligrams, mmHg: Millimeters mercury, PHQ: Patient Health Questionnaire, mmol: Millimoles, SMBG: Self-monitored blood glucose, TSM: Tailored self-management
Evidence Table 11. Outcomes related to diabetes mellitus in studies addressing clinical outcomes (continued)
G-542
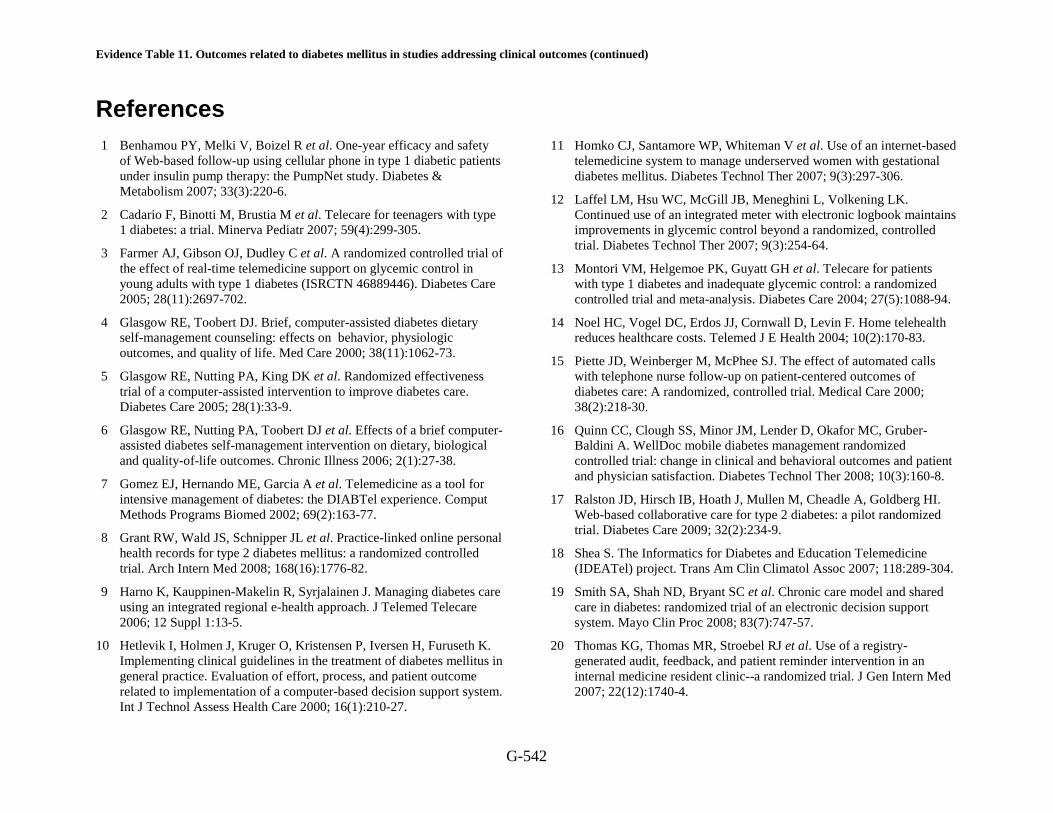
References 1 Benhamou PY, Melki V, Boizel R et al. One-year efficacy and safety
of Web-based follow-up using cellular phone in type 1 diabetic patients under insulin pump therapy: the PumpNet study. Diabetes & Metabolism 2007; 33(3):220-6.
2 Cadario F, Binotti M, Brustia M et al. Telecare for teenagers with type 1 diabetes: a trial. Minerva Pediatr 2007; 59(4):299-305.
3 Farmer AJ, Gibson OJ, Dudley C et al. A randomized controlled trial of the effect of real-time telemedicine support on glycemic control in young adults with type 1 diabetes (ISRCTN 46889446). Diabetes Care 2005; 28(11):2697-702.
4 Glasgow RE, Toobert DJ. Brief, computer-assisted diabetes dietary self-management counseling: effects on behavior, physiologic outcomes, and quality of life. Med Care 2000; 38(11):1062-73.
5 Glasgow RE, Nutting PA, King DK et al. Randomized effectiveness trial of a computer-assisted intervention to improve diabetes care. Diabetes Care 2005; 28(1):33-9.
6 Glasgow RE, Nutting PA, Toobert DJ et al. Effects of a brief computer-assisted diabetes self-management intervention on dietary, biological and quality-of-life outcomes. Chronic Illness 2006; 2(1):27-38.
7 Gomez EJ, Hernando ME, Garcia A et al. Telemedicine as a tool for intensive management of diabetes: the DIABTel experience. Comput Methods Programs Biomed 2002; 69(2):163-77.
8 Grant RW, Wald JS, Schnipper JL et al. Practice-linked online personal health records for type 2 diabetes mellitus: a randomized controlled trial. Arch Intern Med 2008; 168(16):1776-82.
9 Harno K, Kauppinen-Makelin R, Syrjalainen J. Managing diabetes care using an integrated regional e-health approach. J Telemed Telecare 2006; 12 Suppl 1:13-5.
10 Hetlevik I, Holmen J, Kruger O, Kristensen P, Iversen H, Furuseth K. Implementing clinical guidelines in the treatment of diabetes mellitus in general practice. Evaluation of effort, process, and patient outcome related to implementation of a computer-based decision support system. Int J Technol Assess Health Care 2000; 16(1):210-27.
11 Homko CJ, Santamore WP, Whiteman V et al. Use of an internet-based telemedicine system to manage underserved women with gestational diabetes mellitus. Diabetes Technol Ther 2007; 9(3):297-306.
12 Laffel LM, Hsu WC, McGill JB, Meneghini L, Volkening LK. Continued use of an integrated meter with electronic logbook maintains improvements in glycemic control beyond a randomized, controlled trial. Diabetes Technol Ther 2007; 9(3):254-64.
13 Montori VM, Helgemoe PK, Guyatt GH et al. Telecare for patients with type 1 diabetes and inadequate glycemic control: a randomized controlled trial and meta-analysis. Diabetes Care 2004; 27(5):1088-94.
14 Noel HC, Vogel DC, Erdos JJ, Cornwall D, Levin F. Home telehealth reduces healthcare costs. Telemed J E Health 2004; 10(2):170-83.
15 Piette JD, Weinberger M, McPhee SJ. The effect of automated calls with telephone nurse follow-up on patient-centered outcomes of diabetes care: A randomized, controlled trial. Medical Care 2000; 38(2):218-30.
16 Quinn CC, Clough SS, Minor JM, Lender D, Okafor MC, Gruber-Baldini A. WellDoc mobile diabetes management randomized controlled trial: change in clinical and behavioral outcomes and patient and physician satisfaction. Diabetes Technol Ther 2008; 10(3):160-8.
17 Ralston JD, Hirsch IB, Hoath J, Mullen M, Cheadle A, Goldberg HI. Web-based collaborative care for type 2 diabetes: a pilot randomized trial. Diabetes Care 2009; 32(2):234-9.
18 Shea S. The Informatics for Diabetes and Education Telemedicine (IDEATel) project. Trans Am Clin Climatol Assoc 2007; 118:289-304.
19 Smith SA, Shah ND, Bryant SC et al. Chronic care model and shared care in diabetes: randomized trial of an electronic decision support system. Mayo Clin Proc 2008; 83(7):747-57.
20 Thomas KG, Thomas MR, Stroebel RJ et al. Use of a registry-generated audit, feedback, and patient reminder intervention in an internal medicine resident clinic--a randomized trial. J Gen Intern Med 2007; 22(12):1740-4.
Evidence Table 11. Outcomes related to diabetes mellitus in studies addressing clinical outcomes (continued)
G-543
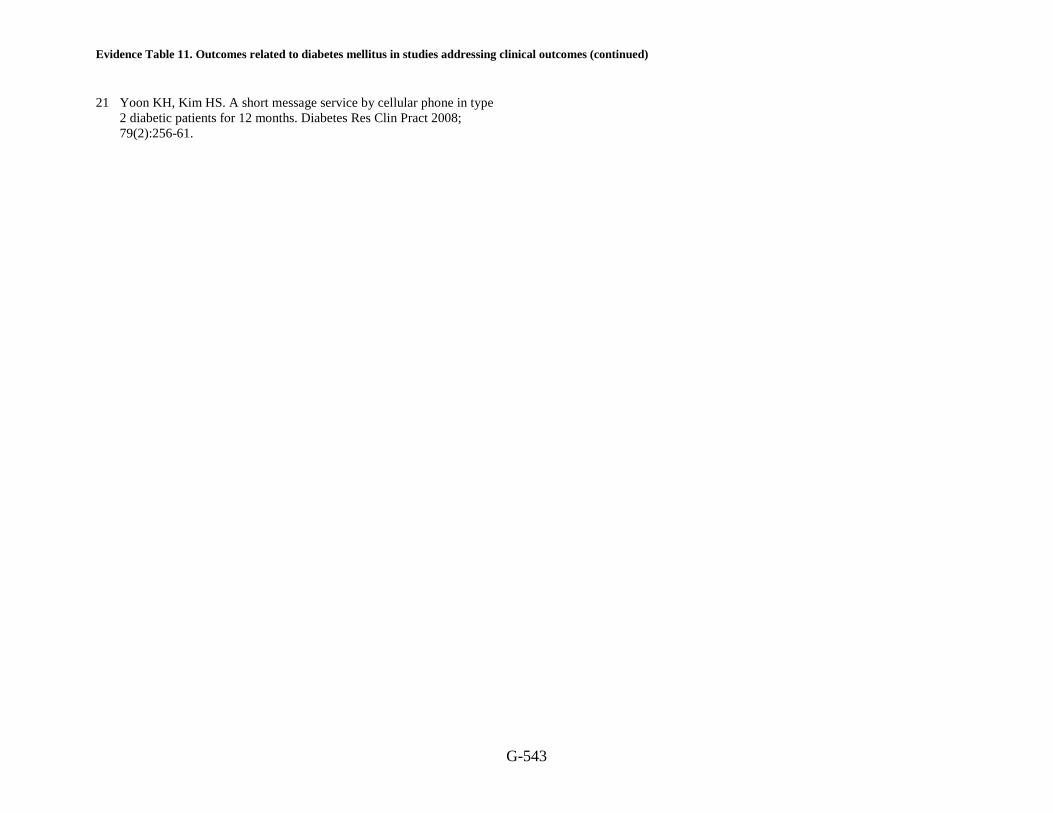
21 Yoon KH, Kim HS. A short message service by cellular phone in type 2 diabetic patients for 12 months. Diabetes Res Clin Pract 2008; 79(2):256-61.