diabetes mellitus and adverse pregnancy outcomes
TRANSCRIPT

Page 1/15
Fasting plasma glucose in the �rst trimester is related to GestationalDiabetes Mellitus and adverse pregnancy outcomesJia-Ning Tong
Southern Medical UniversityLin-Lin Wu
Southern Medical UniversityYi-Xuan Chen
Southern Medical UniversityXiao-Nian Guan
Southern Medical UniversityFu-Ying Tian
Southern Medical UniversityHua-Fan Zhang
Southern Medical UniversityKan Liu
Southern Medical UniversityAi-Qi Yin
Southern Medical UniversityXiao-Xia Wu
Southern Medical UniversityJian-min Niu ( [email protected] )
Southern Medical University
Research Article
Keywords: FPG, GDM, The �rst trimester, Adverse pregnancy outcomes
Posted Date: April 30th, 2021
DOI: https://doi.org/10.21203/rs.3.rs-459897/v1
License: This work is licensed under a Creative Commons Attribution 4.0 International License. Read Full License
Version of Record: A version of this preprint was published at Endocrine on August 3rd, 2021. See the published version athttps://doi.org/10.1007/s12020-021-02831-w.
Page 2/15
AbstractPurpose
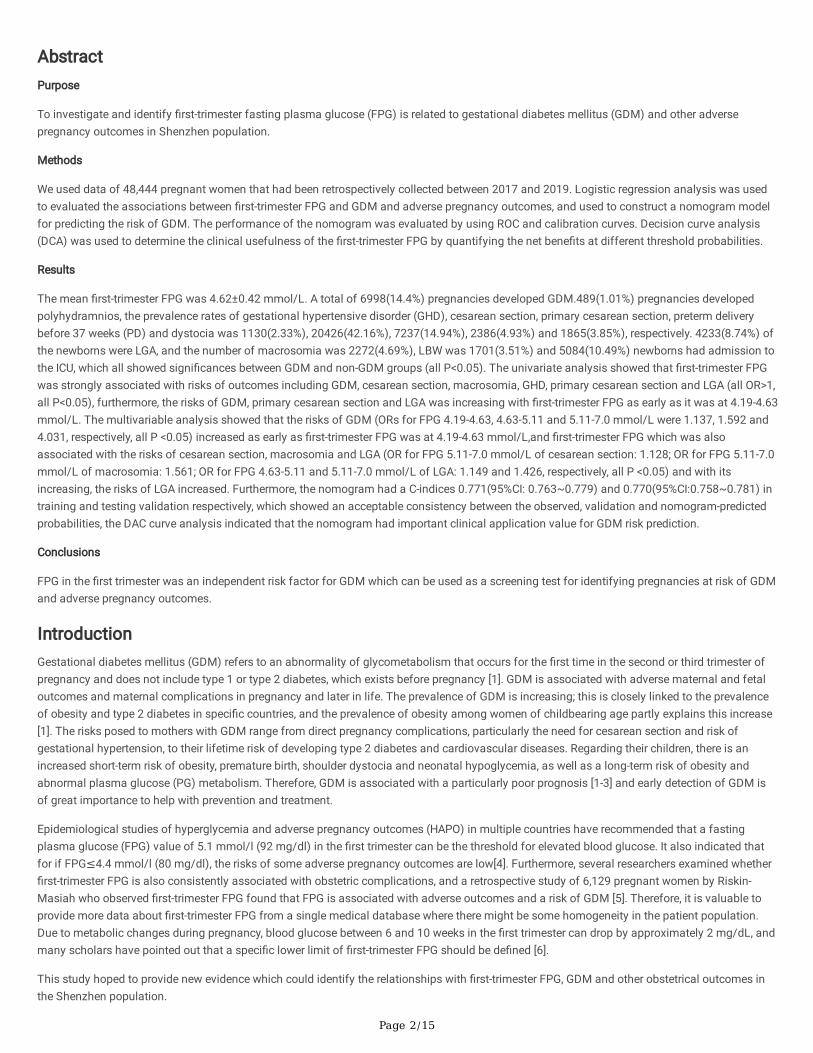
To investigate and identify �rst-trimester fasting plasma glucose (FPG) is related to gestational diabetes mellitus (GDM) and other adversepregnancy outcomes in Shenzhen population.
Methods
We used data of 48,444 pregnant women that had been retrospectively collected between 2017 and 2019. Logistic regression analysis was usedto evaluated the associations between �rst-trimester FPG and GDM and adverse pregnancy outcomes, and used to construct a nomogram modelfor predicting the risk of GDM. The performance of the nomogram was evaluated by using ROC and calibration curves. Decision curve analysis(DCA) was used to determine the clinical usefulness of the �rst-trimester FPG by quantifying the net bene�ts at different threshold probabilities.
Results
The mean �rst-trimester FPG was 4.62±0.42 mmol/L. A total of 6998(14.4%) pregnancies developed GDM.489(1.01%) pregnancies developedpolyhydramnios, the prevalence rates of gestational hypertensive disorder (GHD), cesarean section, primary cesarean section, preterm deliverybefore 37 weeks (PD) and dystocia was 1130(2.33%), 20426(42.16%), 7237(14.94%), 2386(4.93%) and 1865(3.85%), respectively. 4233(8.74%) ofthe newborns were LGA, and the number of macrosomia was 2272(4.69%), LBW was 1701(3.51%) and 5084(10.49%) newborns had admission tothe ICU, which all showed signi�cances between GDM and non-GDM groups (all P<0.05). The univariate analysis showed that �rst-trimester FPGwas strongly associated with risks of outcomes including GDM, cesarean section, macrosomia, GHD, primary cesarean section and LGA (all OR>1,all P<0.05), furthermore, the risks of GDM, primary cesarean section and LGA was increasing with �rst-trimester FPG as early as it was at 4.19-4.63mmol/L. The multivariable analysis showed that the risks of GDM (ORs for FPG 4.19-4.63, 4.63-5.11 and 5.11-7.0 mmol/L were 1.137, 1.592 and4.031, respectively, all P <0.05) increased as early as �rst-trimester FPG was at 4.19-4.63 mmol/L,and �rst-trimester FPG which was alsoassociated with the risks of cesarean section, macrosomia and LGA (OR for FPG 5.11-7.0 mmol/L of cesarean section: 1.128; OR for FPG 5.11-7.0mmol/L of macrosomia: 1.561; OR for FPG 4.63-5.11 and 5.11-7.0 mmol/L of LGA: 1.149 and 1.426, respectively, all P <0.05) and with itsincreasing, the risks of LGA increased. Furthermore, the nomogram had a C-indices 0.771(95%CI: 0.763~0.779) and 0.770(95%CI:0.758~0.781) intraining and testing validation respectively, which showed an acceptable consistency between the observed, validation and nomogram-predictedprobabilities, the DAC curve analysis indicated that the nomogram had important clinical application value for GDM risk prediction.
Conclusions
FPG in the �rst trimester was an independent risk factor for GDM which can be used as a screening test for identifying pregnancies at risk of GDMand adverse pregnancy outcomes.
IntroductionGestational diabetes mellitus (GDM) refers to an abnormality of glycometabolism that occurs for the �rst time in the second or third trimester ofpregnancy and does not include type 1 or type 2 diabetes, which exists before pregnancy [1]. GDM is associated with adverse maternal and fetaloutcomes and maternal complications in pregnancy and later in life. The prevalence of GDM is increasing; this is closely linked to the prevalenceof obesity and type 2 diabetes in speci�c countries, and the prevalence of obesity among women of childbearing age partly explains this increase[1]. The risks posed to mothers with GDM range from direct pregnancy complications, particularly the need for cesarean section and risk ofgestational hypertension, to their lifetime risk of developing type 2 diabetes and cardiovascular diseases. Regarding their children, there is anincreased short-term risk of obesity, premature birth, shoulder dystocia and neonatal hypoglycemia, as well as a long-term risk of obesity andabnormal plasma glucose (PG) metabolism. Therefore, GDM is associated with a particularly poor prognosis [1-3] and early detection of GDM isof great importance to help with prevention and treatment.
Epidemiological studies of hyperglycemia and adverse pregnancy outcomes (HAPO) in multiple countries have recommended that a fastingplasma glucose (FPG) value of 5.1 mmol/l (92 mg/dl) in the �rst trimester can be the threshold for elevated blood glucose. It also indicated thatfor if FPG≤4.4 mmol/l (80 mg/dl), the risks of some adverse pregnancy outcomes are low[4]. Furthermore, several researchers examined whether�rst-trimester FPG is also consistently associated with obstetric complications, and a retrospective study of 6,129 pregnant women by Riskin-Masiah who observed �rst-trimester FPG found that FPG is associated with adverse outcomes and a risk of GDM [5]. Therefore, it is valuable toprovide more data about �rst-trimester FPG from a single medical database where there might be some homogeneity in the patient population.Due to metabolic changes during pregnancy, blood glucose between 6 and 10 weeks in the �rst trimester can drop by approximately 2 mg/dL, andmany scholars have pointed out that a speci�c lower limit of �rst-trimester FPG should be de�ned [6].
This study hoped to provide new evidence which could identify the relationships with �rst-trimester FPG, GDM and other obstetrical outcomes inthe Shenzhen population.
Page 3/15
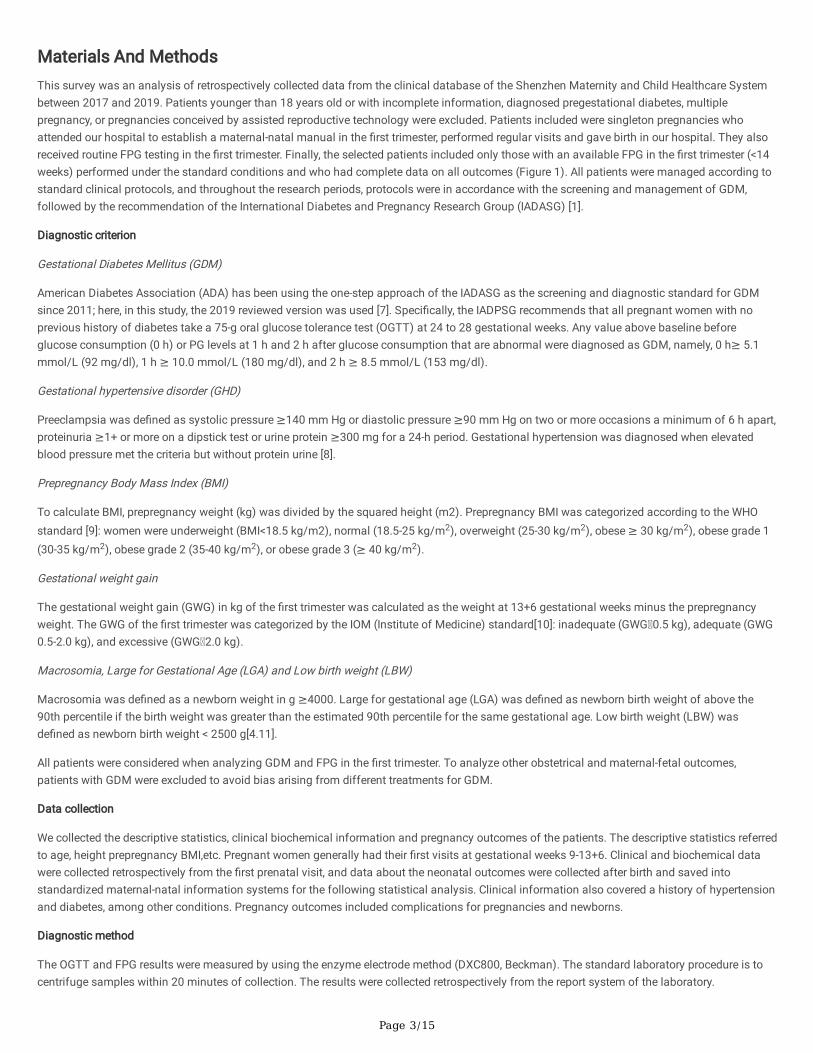
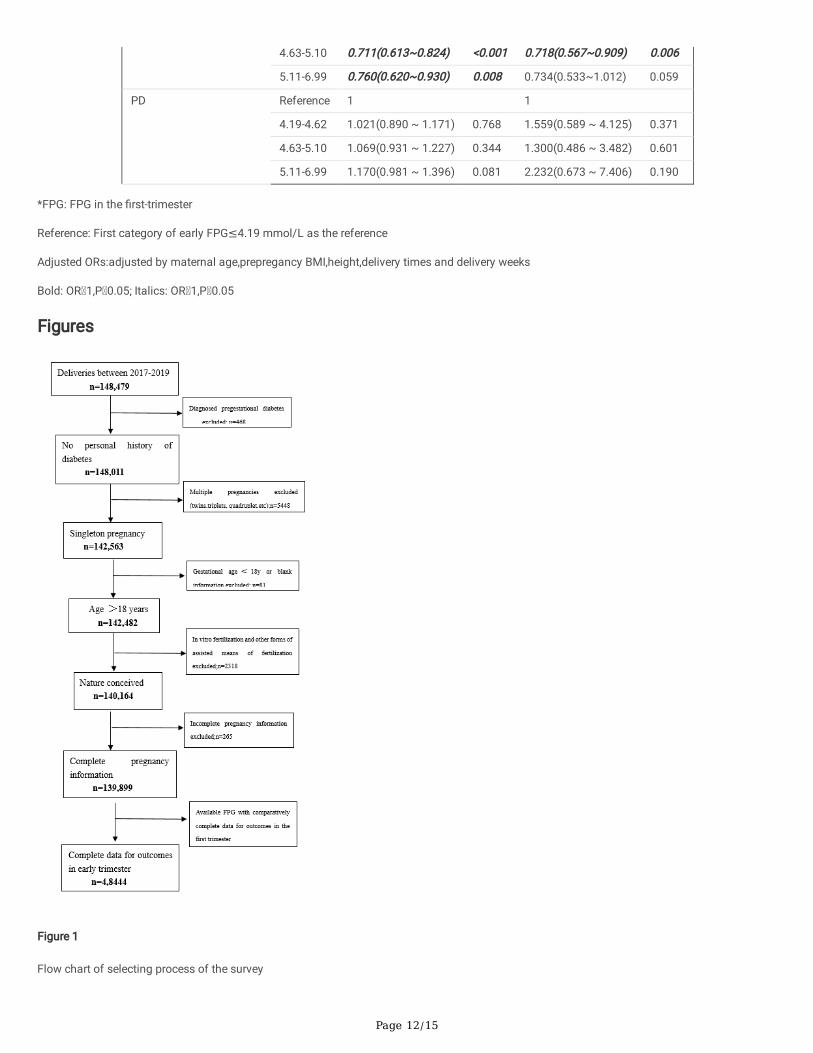
Materials And MethodsThis survey was an analysis of retrospectively collected data from the clinical database of the Shenzhen Maternity and Child Healthcare Systembetween 2017 and 2019. Patients younger than 18 years old or with incomplete information, diagnosed pregestational diabetes, multiplepregnancy, or pregnancies conceived by assisted reproductive technology were excluded. Patients included were singleton pregnancies whoattended our hospital to establish a maternal-natal manual in the �rst trimester, performed regular visits and gave birth in our hospital. They alsoreceived routine FPG testing in the �rst trimester. Finally, the selected patients included only those with an available FPG in the �rst trimester (<14weeks) performed under the standard conditions and who had complete data on all outcomes (Figure 1). All patients were managed according tostandard clinical protocols, and throughout the research periods, protocols were in accordance with the screening and management of GDM,followed by the recommendation of the International Diabetes and Pregnancy Research Group (IADASG) [1].
Diagnostic criterion
Gestational Diabetes Mellitus (GDM)
American Diabetes Association (ADA) has been using the one-step approach of the IADASG as the screening and diagnostic standard for GDMsince 2011; here, in this study, the 2019 reviewed version was used [7]. Speci�cally, the IADPSG recommends that all pregnant women with noprevious history of diabetes take a 75-g oral glucose tolerance test (OGTT) at 24 to 28 gestational weeks. Any value above baseline beforeglucose consumption (0 h) or PG levels at 1 h and 2 h after glucose consumption that are abnormal were diagnosed as GDM, namely, 0 h≥ 5.1mmol/L (92 mg/dl), 1 h ≥ 10.0 mmol/L (180 mg/dl), and 2 h ≥ 8.5 mmol/L (153 mg/dl).
Gestational hypertensive disorder (GHD)
Preeclampsia was de�ned as systolic pressure ≥140 mm Hg or diastolic pressure ≥90 mm Hg on two or more occasions a minimum of 6 h apart,proteinuria ≥1+ or more on a dipstick test or urine protein ≥300 mg for a 24-h period. Gestational hypertension was diagnosed when elevatedblood pressure met the criteria but without protein urine [8].
Prepregnancy Body Mass Index (BMI)
To calculate BMI, prepregnancy weight (kg) was divided by the squared height (m2). Prepregnancy BMI was categorized according to the WHOstandard [9]: women were underweight (BMI<18.5 kg/m2), normal (18.5-25 kg/m2), overweight (25-30 kg/m2), obese ≥ 30 kg/m2), obese grade 1(30-35 kg/m2), obese grade 2 (35-40 kg/m2), or obese grade 3 (≥ 40 kg/m2).
Gestational weight gain
The gestational weight gain (GWG) in kg of the �rst trimester was calculated as the weight at 13+6 gestational weeks minus the prepregnancyweight. The GWG of the �rst trimester was categorized by the IOM (Institute of Medicine) standard[10]: inadequate (GWG 0.5 kg), adequate (GWG0.5-2.0 kg), and excessive (GWG 2.0 kg).
Macrosomia, Large for Gestational Age (LGA) and Low birth weight (LBW)
Macrosomia was de�ned as a newborn weight in g ≥4000. Large for gestational age (LGA) was de�ned as newborn birth weight of above the90th percentile if the birth weight was greater than the estimated 90th percentile for the same gestational age. Low birth weight (LBW) wasde�ned as newborn birth weight < 2500 g[4.11].
All patients were considered when analyzing GDM and FPG in the �rst trimester. To analyze other obstetrical and maternal-fetal outcomes,patients with GDM were excluded to avoid bias arising from different treatments for GDM.
Data collection
We collected the descriptive statistics, clinical biochemical information and pregnancy outcomes of the patients. The descriptive statistics referredto age, height prepregnancy BMI,etc. Pregnant women generally had their �rst visits at gestational weeks 9-13+6. Clinical and biochemical datawere collected retrospectively from the �rst prenatal visit, and data about the neonatal outcomes were collected after birth and saved intostandardized maternal-natal information systems for the following statistical analysis. Clinical information also covered a history of hypertensionand diabetes, among other conditions. Pregnancy outcomes included complications for pregnancies and newborns.
Diagnostic method
The OGTT and FPG results were measured by using the enzyme electrode method (DXC800, Beckman). The standard laboratory procedure is tocentrifuge samples within 20 minutes of collection. The results were collected retrospectively from the report system of the laboratory.
Page 4/15
Outcomes
The obstetrical adverse outcomes included GDM, cesarean section, primary cesarean section, polyhydramnios, preterm delivery before 37weeks(PD), dystocia and GHD, which included high blood pressure during pregnancy and preeclampsia. The neonatal outcomes included macrosomia,LGA, LBW, and ICU attendance of newborns. The main outcomes for this survey were the risk of GDM, primary cesarean section and LGA, while theothers were secondary outcomes.
Statistical analysis
Analyses were performed using R statistical software version 3.6.1. Continuous variables were presented as the means with standard deviations,while categorical data were expressed as counts and percentages. Summary statistics between both groups were compared using either unpairedStudent’s t-test or Mann-Whitney tests for continuous data, and chi-squared tests or Fisher’s Exact Test for categorical data. Univariate andmultivariable adjusted odds ratios (OR) with 95% con�dence interval (CI) of FPG for associations between �rst-trimester FPG and GDM andadverse pregnancy outcomes were estimated using the logistical regression model. Nomogram and calibration curve were performed with the“rms” package, then, a nomogram diagram for predicting the risk of GDM with �rst-trimester FPG for GDM was established by using the stepAIC�lter variables, which nomogram model was used for predicting the risk of GDM and enabling the user to easily compute output probabilities.Decision curve analysis (DCA) was performed with the “dca” package, which was conducted to determine the clinical usefulness of the �rst-trimester FPG nomogram by quantifying the net bene�ts at different threshold probabilities. A p value of < 0.05 was considered to indicatestatistical signi�cance.
ResultsBaseline Demographic and adverse outcome
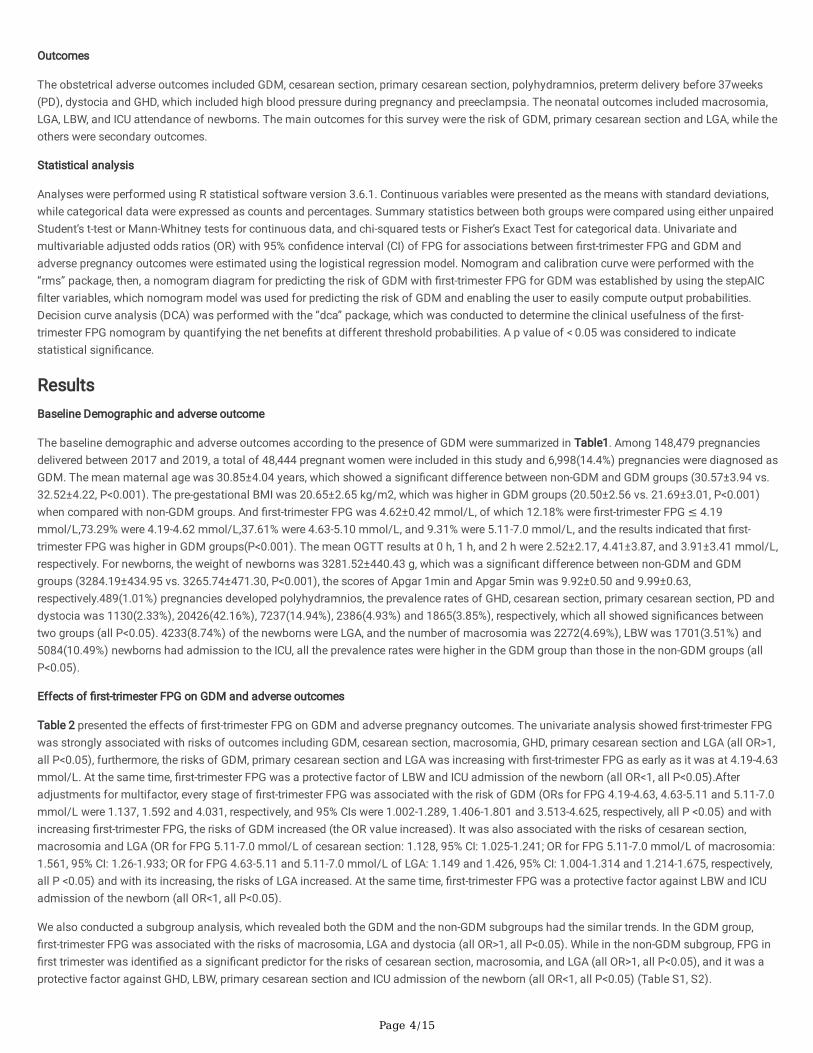
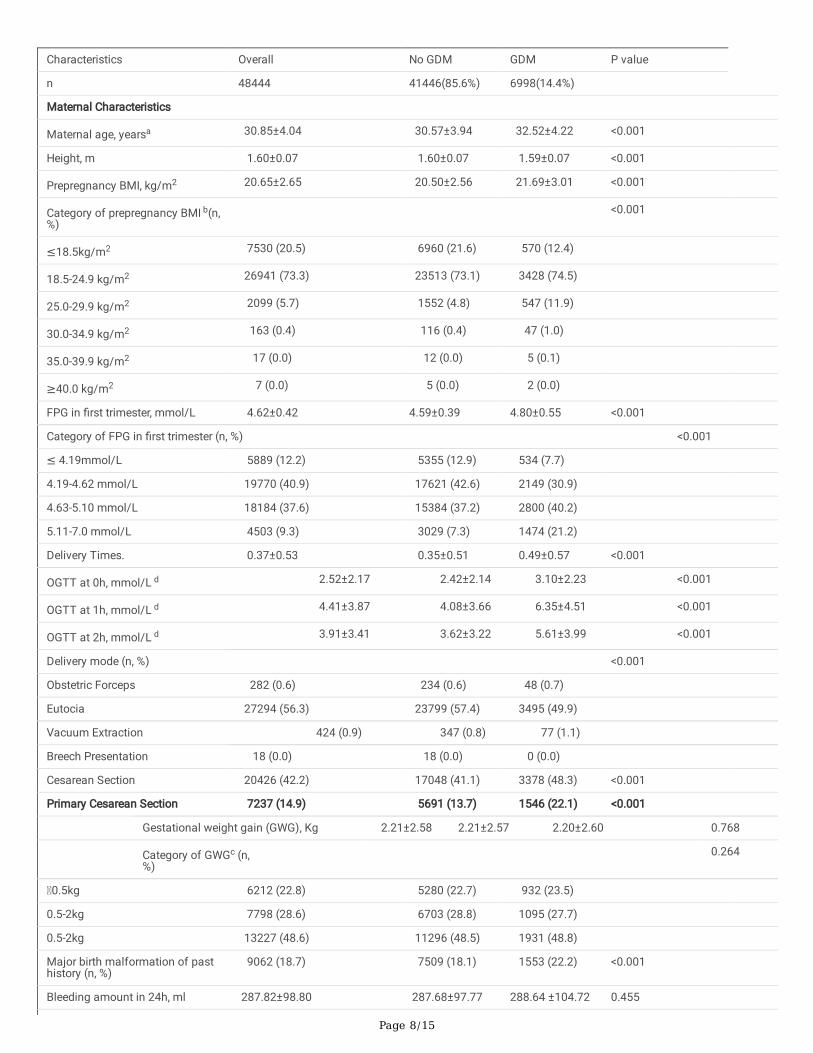
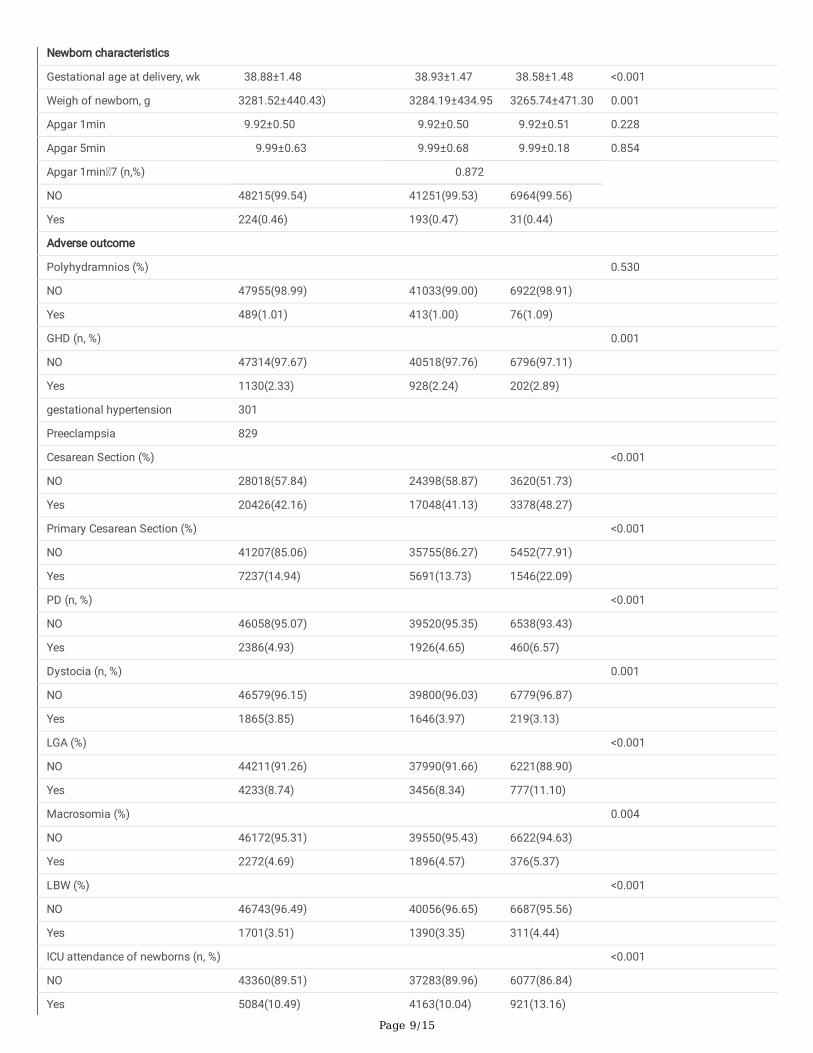
The baseline demographic and adverse outcomes according to the presence of GDM were summarized in Table1. Among 148,479 pregnanciesdelivered between 2017 and 2019, a total of 48,444 pregnant women were included in this study and 6,998(14.4%) pregnancies were diagnosed asGDM. The mean maternal age was 30.85±4.04 years, which showed a signi�cant difference between non-GDM and GDM groups (30.57±3.94 vs.32.52±4.22, P<0.001). The pre-gestational BMI was 20.65±2.65 kg/m2, which was higher in GDM groups (20.50±2.56 vs. 21.69±3.01, P<0.001)when compared with non-GDM groups. And �rst-trimester FPG was 4.62±0.42 mmol/L, of which 12.18% were �rst-trimester FPG ≤ 4.19mmol/L,73.29% were 4.19-4.62 mmol/L,37.61% were 4.63-5.10 mmol/L, and 9.31% were 5.11-7.0 mmol/L, and the results indicated that �rst-trimester FPG was higher in GDM groups(P<0.001). The mean OGTT results at 0 h, 1 h, and 2 h were 2.52±2.17, 4.41±3.87, and 3.91±3.41 mmol/L,respectively. For newborns, the weight of newborns was 3281.52±440.43 g, which was a signi�cant difference between non-GDM and GDMgroups (3284.19±434.95 vs. 3265.74±471.30, P<0.001), the scores of Apgar 1min and Apgar 5min was 9.92±0.50 and 9.99±0.63,respectively.489(1.01%) pregnancies developed polyhydramnios, the prevalence rates of GHD, cesarean section, primary cesarean section, PD anddystocia was 1130(2.33%), 20426(42.16%), 7237(14.94%), 2386(4.93%) and 1865(3.85%), respectively, which all showed signi�cances betweentwo groups (all P<0.05). 4233(8.74%) of the newborns were LGA, and the number of macrosomia was 2272(4.69%), LBW was 1701(3.51%) and5084(10.49%) newborns had admission to the ICU, all the prevalence rates were higher in the GDM group than those in the non-GDM groups (allP<0.05).
Effects of �rst-trimester FPG on GDM and adverse outcomes
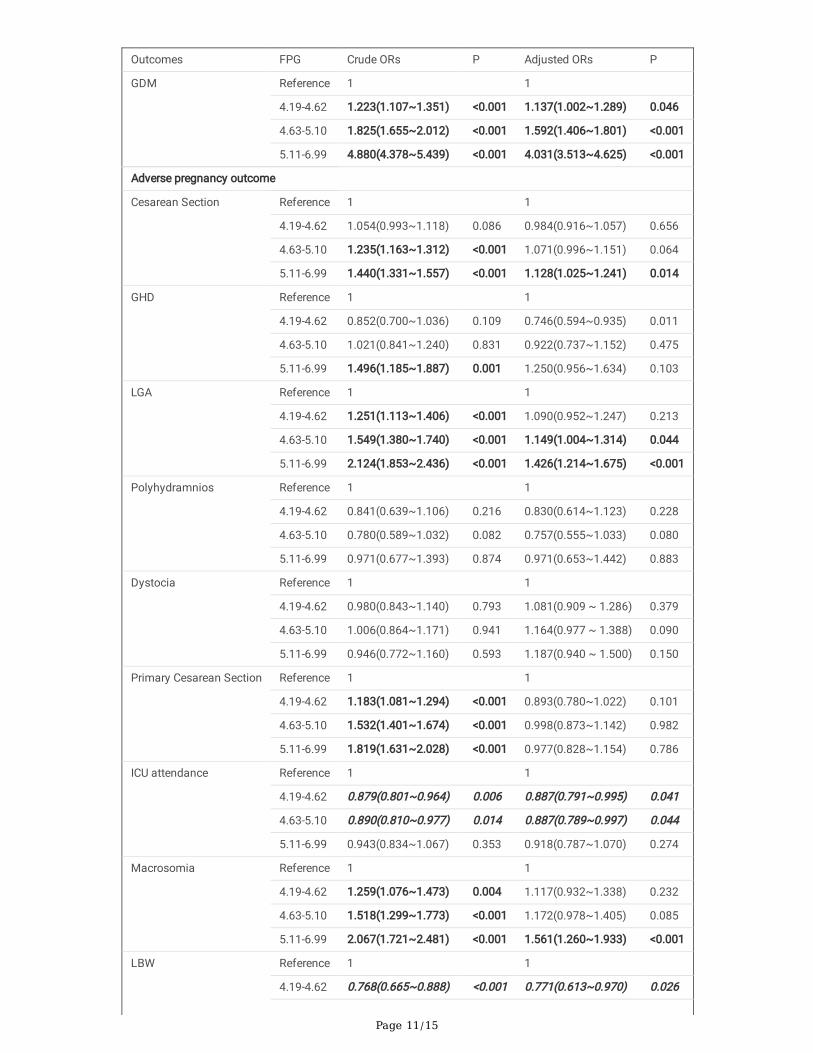
Table 2 presented the effects of �rst-trimester FPG on GDM and adverse pregnancy outcomes. The univariate analysis showed �rst-trimester FPGwas strongly associated with risks of outcomes including GDM, cesarean section, macrosomia, GHD, primary cesarean section and LGA (all OR>1,all P<0.05), furthermore, the risks of GDM, primary cesarean section and LGA was increasing with �rst-trimester FPG as early as it was at 4.19-4.63mmol/L. At the same time, �rst-trimester FPG was a protective factor of LBW and ICU admission of the newborn (all OR<1, all P<0.05).Afteradjustments for multifactor, every stage of �rst-trimester FPG was associated with the risk of GDM (ORs for FPG 4.19-4.63, 4.63-5.11 and 5.11-7.0mmol/L were 1.137, 1.592 and 4.031, respectively, and 95% CIs were 1.002-1.289, 1.406-1.801 and 3.513-4.625, respectively, all P <0.05) and withincreasing �rst-trimester FPG, the risks of GDM increased (the OR value increased). It was also associated with the risks of cesarean section,macrosomia and LGA (OR for FPG 5.11-7.0 mmol/L of cesarean section: 1.128, 95% CI: 1.025-1.241; OR for FPG 5.11-7.0 mmol/L of macrosomia:1.561, 95% CI: 1.26-1.933; OR for FPG 4.63-5.11 and 5.11-7.0 mmol/L of LGA: 1.149 and 1.426, 95% CI: 1.004-1.314 and 1.214-1.675, respectively,all P <0.05) and with its increasing, the risks of LGA increased. At the same time, �rst-trimester FPG was a protective factor against LBW and ICUadmission of the newborn (all OR<1, all P<0.05).
We also conducted a subgroup analysis, which revealed both the GDM and the non-GDM subgroups had the similar trends. In the GDM group,�rst-trimester FPG was associated with the risks of macrosomia, LGA and dystocia (all OR>1, all P<0.05). While in the non-GDM subgroup, FPG in�rst trimester was identi�ed as a signi�cant predictor for the risks of cesarean section, macrosomia, and LGA (all OR>1, all P<0.05), and it was aprotective factor against GHD, LBW, primary cesarean section and ICU admission of the newborn (all OR<1, all P<0.05) (Table S1, S2).
Page 5/15
The establishment nomogram model for predicting the risk of GDM
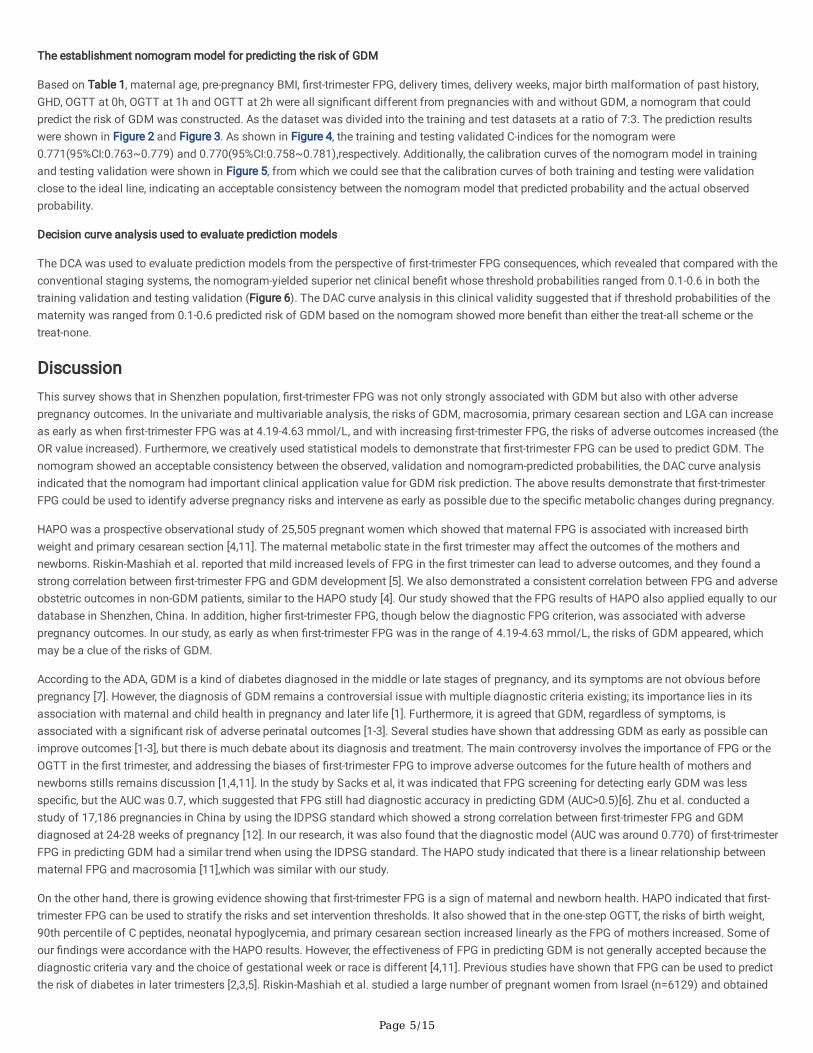
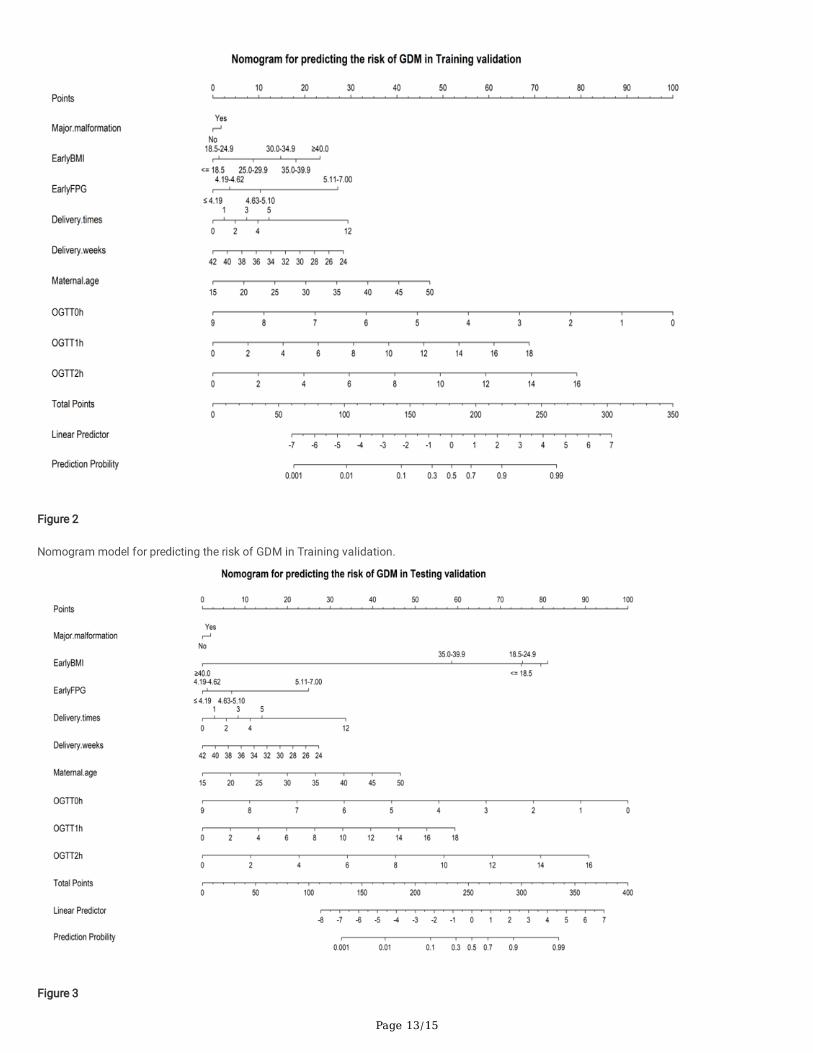
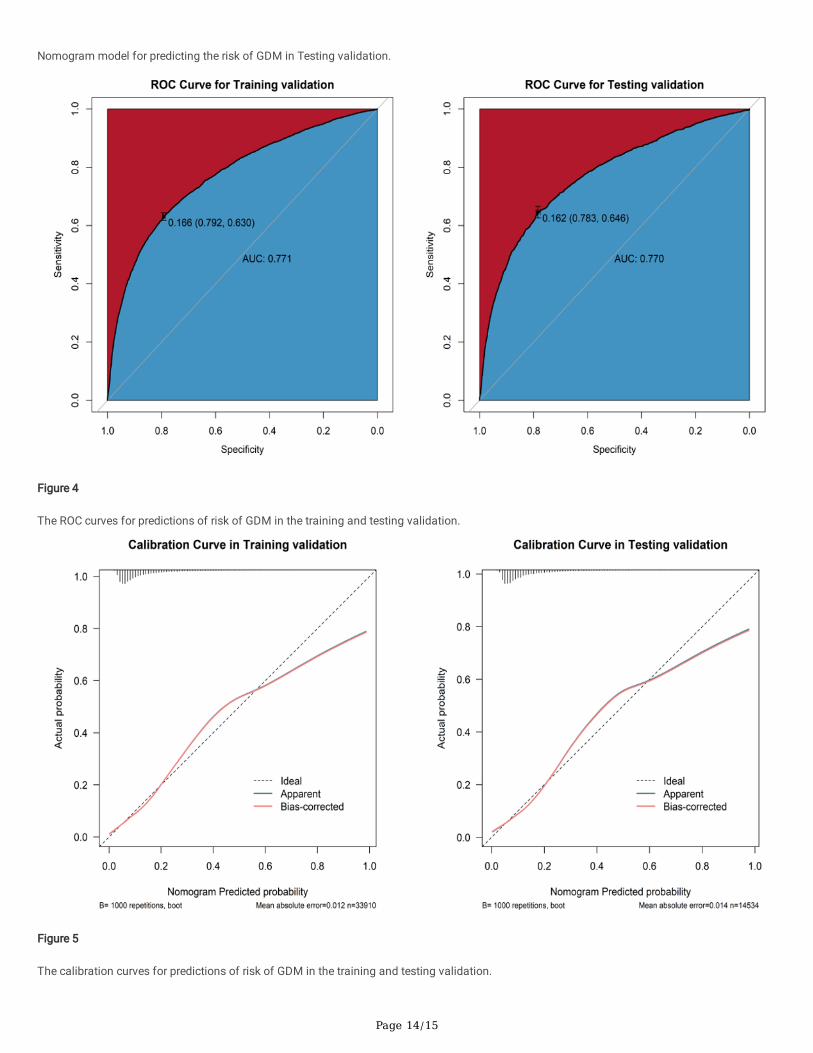
Based on Table 1, maternal age, pre-pregnancy BMI, �rst-trimester FPG, delivery times, delivery weeks, major birth malformation of past history,GHD, OGTT at 0h, OGTT at 1h and OGTT at 2h were all signi�cant different from pregnancies with and without GDM, a nomogram that couldpredict the risk of GDM was constructed. As the dataset was divided into the training and test datasets at a ratio of 7:3. The prediction resultswere shown in Figure 2 and Figure 3. As shown in Figure 4, the training and testing validated C-indices for the nomogram were0.771(95%CI:0.763~0.779) and 0.770(95%CI:0.758~0.781),respectively. Additionally, the calibration curves of the nomogram model in trainingand testing validation were shown in Figure 5, from which we could see that the calibration curves of both training and testing were validationclose to the ideal line, indicating an acceptable consistency between the nomogram model that predicted probability and the actual observedprobability.
Decision curve analysis used to evaluate prediction models
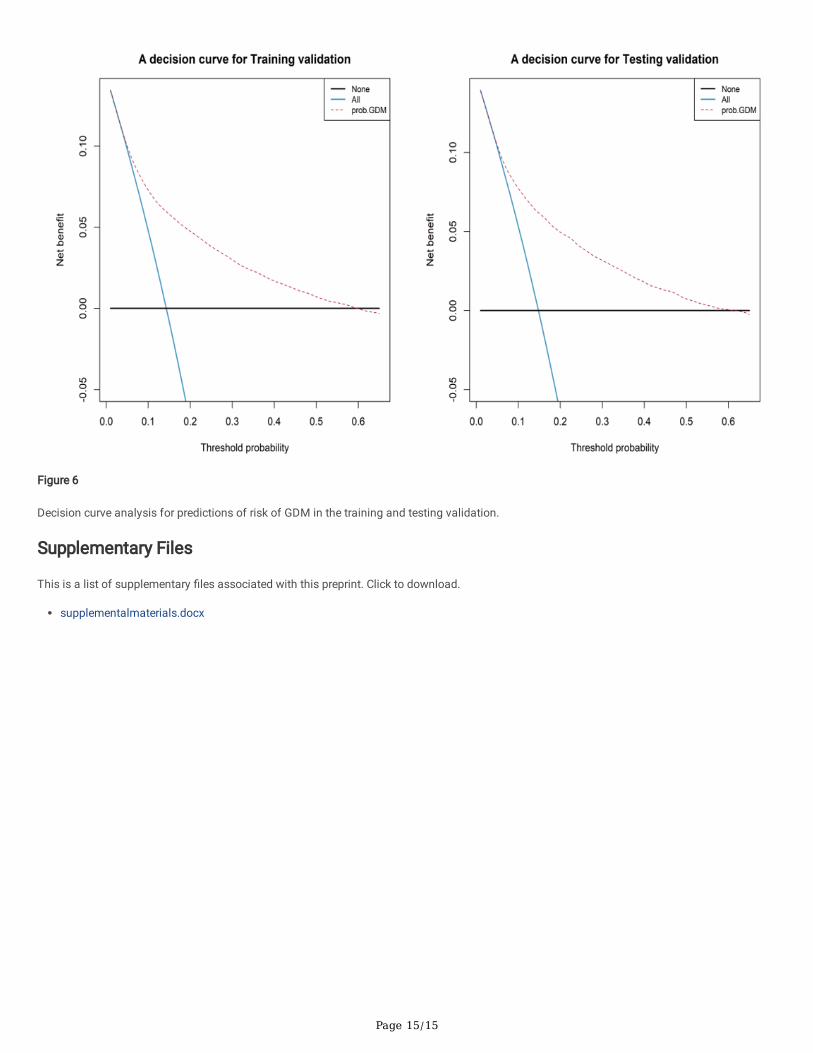
The DCA was used to evaluate prediction models from the perspective of �rst-trimester FPG consequences, which revealed that compared with theconventional staging systems, the nomogram-yielded superior net clinical bene�t whose threshold probabilities ranged from 0.1-0.6 in both thetraining validation and testing validation (Figure 6). The DAC curve analysis in this clinical validity suggested that if threshold probabilities of thematernity was ranged from 0.1-0.6 predicted risk of GDM based on the nomogram showed more bene�t than either the treat-all scheme or thetreat-none.
DiscussionThis survey shows that in Shenzhen population, �rst-trimester FPG was not only strongly associated with GDM but also with other adversepregnancy outcomes. In the univariate and multivariable analysis, the risks of GDM, macrosomia, primary cesarean section and LGA can increaseas early as when �rst-trimester FPG was at 4.19-4.63 mmol/L, and with increasing �rst-trimester FPG, the risks of adverse outcomes increased (theOR value increased). Furthermore, we creatively used statistical models to demonstrate that �rst-trimester FPG can be used to predict GDM. Thenomogram showed an acceptable consistency between the observed, validation and nomogram-predicted probabilities, the DAC curve analysisindicated that the nomogram had important clinical application value for GDM risk prediction. The above results demonstrate that �rst-trimesterFPG could be used to identify adverse pregnancy risks and intervene as early as possible due to the speci�c metabolic changes during pregnancy.
HAPO was a prospective observational study of 25,505 pregnant women which showed that maternal FPG is associated with increased birthweight and primary cesarean section [4,11]. The maternal metabolic state in the �rst trimester may affect the outcomes of the mothers andnewborns. Riskin-Mashiah et al. reported that mild increased levels of FPG in the �rst trimester can lead to adverse outcomes, and they found astrong correlation between �rst-trimester FPG and GDM development [5]. We also demonstrated a consistent correlation between FPG and adverseobstetric outcomes in non-GDM patients, similar to the HAPO study [4]. Our study showed that the FPG results of HAPO also applied equally to ourdatabase in Shenzhen, China. In addition, higher �rst-trimester FPG, though below the diagnostic FPG criterion, was associated with adversepregnancy outcomes. In our study, as early as when �rst-trimester FPG was in the range of 4.19-4.63 mmol/L, the risks of GDM appeared, whichmay be a clue of the risks of GDM.
According to the ADA, GDM is a kind of diabetes diagnosed in the middle or late stages of pregnancy, and its symptoms are not obvious beforepregnancy [7]. However, the diagnosis of GDM remains a controversial issue with multiple diagnostic criteria existing; its importance lies in itsassociation with maternal and child health in pregnancy and later life [1]. Furthermore, it is agreed that GDM, regardless of symptoms, isassociated with a signi�cant risk of adverse perinatal outcomes [1-3]. Several studies have shown that addressing GDM as early as possible canimprove outcomes [1-3], but there is much debate about its diagnosis and treatment. The main controversy involves the importance of FPG or theOGTT in the �rst trimester, and addressing the biases of �rst-trimester FPG to improve adverse outcomes for the future health of mothers andnewborns stills remains discussion [1,4,11]. In the study by Sacks et al, it was indicated that FPG screening for detecting early GDM was lessspeci�c, but the AUC was 0.7, which suggested that FPG still had diagnostic accuracy in predicting GDM (AUC>0.5)[6]. Zhu et al. conducted astudy of 17,186 pregnancies in China by using the IDPSG standard which showed a strong correlation between �rst-trimester FPG and GDMdiagnosed at 24-28 weeks of pregnancy [12]. In our research, it was also found that the diagnostic model (AUC was around 0.770) of �rst-trimesterFPG in predicting GDM had a similar trend when using the IDPSG standard. The HAPO study indicated that there is a linear relationship betweenmaternal FPG and macrosomia [11],which was similar with our study.
On the other hand, there is growing evidence showing that �rst-trimester FPG is a sign of maternal and newborn health. HAPO indicated that �rst-trimester FPG can be used to stratify the risks and set intervention thresholds. It also showed that in the one-step OGTT, the risks of birth weight,90th percentile of C peptides, neonatal hypoglycemia, and primary cesarean section increased linearly as the FPG of mothers increased. Some ofour �ndings were accordance with the HAPO results. However, the effectiveness of FPG in predicting GDM is not generally accepted because thediagnostic criteria vary and the choice of gestational week or race is different [4,11]. Previous studies have shown that FPG can be used to predictthe risk of diabetes in later trimesters [2,3,5]. Riskin-Mashiah et al. studied a large number of pregnant women from Israel (n=6129) and obtained
Page 6/15
similar results to ours, namely, that �rst-trimester FPG has an independent relationship with the risks of GDM and LGA[5]. In addition, studies oflifestyle interventions to prevent GDM have shown that it works best in the early stages of pregnancy [13-14].
ConclusionsWe found a strong correlation between �rst-trimester FPG and GDM, LGA, and other adverse obstetric outcomes, and identify its clinicalsigni�cance in Shenzhen population. Therefore, we recommend that FPG be used as a marker of obstetric risk, but the diagnosis of GDM mayneed comprehensive consideration. The current diagnostic standards for GDM in China should be re-examined. Further research to �nd theoptimal cutoff value for �rst-trimester FPG and determine the optimal treatment based on the classi�cation of FPG will be challenging.
LimitationsOur research has some limitations. The nutritional status of pregnancies may affect fetal growth and other perinatal outcomes, but we lack therelated data. The value of PG and bilirubin of newborns is also very important for the survey, but the data are unavailable now. A number ofconfounded factors, such as microsomia in the past, may in�uence the clinical decision, such as the choice of delivery method. The lack of anidenti�ed cutoff value for �rst-trimester FPG to date needs further exploration and indicates that the survey needs additional, more thoroughresearch. However, our study did �nd a signi�cant correlation between adverse outcomes and higher maternal �rst-trimester FPG under thediagnostic criterion for GDM (in the total population and non-GDM group), suggesting a need to reconsider current criteria for diagnosing andaddressing �rst-trimester FPG.
DeclarationsFunding
The survey was supported by the National Natural Science Foundation of China(81830041,81771611),Shen Zhen Science and TechnologyInnovation Committee Special Funding for Future Industry JCYJ20170412140326739
Con�icts of interest
None
Availability of data and material
All data generated or analyzed during this study were included in this published article
Code availability
The codes used during and/or analyzed during the current study are available from the corresponding authors (JM Niu) on reasonable request.
Author contributions
JM Niu were responsible for the study conception and design. JN Tong did the statistical analysis and wrote the script. LL Wu, YX Chen, XN Guan,and XX Wu collected the data. FY Tian and HF Zhang gave help to the data interpretation. K Liu and AQ Yin helped to revise part of the script. Allauthors contributed to the study design, including data collection, data interpretation and manuscript revision, and gave �nal approval of theversion to be published.
Ethics approval
This research was approved by the Review Board for Human Investigation and the Ethics Committee of Shenzhen Maternal and Children Hospital.Informed consent was obtained from every patient, and the investigations were performed in accordance with the principles of the Declaration ofHelsinki.
Consent to participate
Written informed consent was obtained from individual or guardian participants.
Consent for publication
Not applicable
Acknowledgements
Page 7/15
The authors thank Prof. Xin Zhou at Tianjin University General Hospital about the structure suggestion of the manuscript.
References[1]. I.A.o. Diabetes, P.S.G.C.P.J.D. care, International association of diabetes and pregnancy study groups recommendations on the diagnosis andclassi�cation of hyperglycemia in pregnancy, 33 (2010) 676-682.
[2]. G. Sesmilo, P. Prats, S. Garcia, I. Rodríguez, A. Rodríguez-Melcón, I. Berges, B.J.A.d. Serra, First-trimester fasting glycemia as a predictor ofgestational diabetes (GDM) and adverse pregnancy outcomes, 57 (2020) 697-703.
[3]. M.E. Bianco, A. Kuang, J.L. Josefson, P.M. Catalano, A.R. Dyer, L.P. Lowe, B.E. Metzger, D.M. Scholtens, W.L.J.D. Lowe, Hyperglycemia andAdverse Pregnancy Outcome Follow-Up Study: newborn anthropometrics and childhood glucose metabolism, 64 (2021) 561-570.
[4] B.E. Metzger, M. Contreras, D. Sacks, W. Watson, S. Dooley, M. Foderaro, C. Niznik, J. Bjaloncik, P. Catalano, L.J.N.E.j.o.m. Dierker, Hyperglycemiaand adverse pregnancy outcomes, 358 (2008) 1991-2002.
[5] S. Riskin-Mashiah, A. Damti, G. Younes, R.J.E.J.o.O. Auslender, Gynecology, R. Biology, First trimester fasting hyperglycemia as a predictor forthe development of gestational diabetes mellitus, 152 (2010) 163-167.
[6]. D.B. Sacks, D.E. Bruns, D.E. Goldstein, N.K. Maclaren, J.M. McDonald, M.J.C.c. Parrott, Guidelines and recommendations for laboratory analysisin the diagnosis and management of diabetes mellitus, 48 (2002) 436-472.
[7]. A.D.A.J.C.d.a.p.o.t.A.D. Association, Standards of medical care in diabetes—2019 abridged for primary care providers, 37 (2019) 11.
[8]. M.A. Brown, L.A. Magee, L.C. Kenny, S.A. Karumanchi, F.P. McCarthy, S. Saito, D.R. Hall, C.E. Warren, G. Adoyi, S.J.H. Ishaku, Hypertensivedisorders of pregnancy: ISSHP classi�cation, diagnosis, and management recommendations for international practice, 72(1) (2018) 24-43.
[9]. W.H. Organization, Obesity: preventing and managing the global epidemic, (2000).
[10]. N.R. Council, Weight gain during pregnancy: reexamining the guidelines, (2010).
[11]. W.L. Lowe, D.M. Scholtens, A. Kuang, B. Linder, J.M. Lawrence, Y. Lebenthal, D. McCance, J. Hamilton, M. Nodzenski, O.J.D.c. Talbot,Hyperglycemia and adverse pregnancy outcome follow-up study (HAPO FUS): maternal gestational diabetes mellitus and childhood glucosemetabolism, 42(3) (2019) 372-380.
[12]. W.-w. Zhu, H.-x. Yang, Y.-m. Wei, J. Yan, Z.-l. Wang, X.-l. Li, H.-r. Wu, N. Li, M.-h. Zhang, X.-h.J.D.c. Liu, Evaluation of the value of fasting plasmaglucose in the �rst prenatal visit to diagnose gestational diabetes mellitus in China, 36(3) (2013) 586-590.
[13]. E. Cosson, E. Vicaut, N. Berkane, T.L. Cianganu, C. Baudry, J.-J. Portal, J. Boujenah, P. Valensi, L.J.D. Carbillon, Metabolism, Prognosisassociated with initial care of increased fasting glucose in early pregnancy: A retrospective study, (2020).
[14]. S.B. Koivusalo, K. Rönö, M.M. Klemetti, R.P. Roine, J. Lindström, M. Erkkola, R.J. Kaaja, M. Pöyhönen-Alho, A. Tiitinen, E.J.D.c. Huvinen,Gestational diabetes mellitus can be prevented by lifestyle intervention: the Finnish Gestational Diabetes Prevention Study (RADIEL): arandomized controlled trial, 39(1) (2016) 24-30.
TablesTable1 Baseline demographic and adverse pregnancy outcome
Page 8/15
Characteristics Overall No GDM GDM P value
n 48444 41446(85.6%) 6998(14.4%)
Maternal Characteristics
Maternal age, yearsa 30.85±4.04 30.57±3.94 32.52±4.22 <0.001
Height, m 1.60±0.07 1.60±0.07 1.59±0.07 <0.001
Prepregnancy BMI, kg/m2 20.65±2.65 20.50±2.56 21.69±3.01 <0.001
Category of prepregnancy BMI b(n,%)
<0.001
≤18.5kg/m2 7530 (20.5) 6960 (21.6) 570 (12.4)
18.5-24.9 kg/m2 26941 (73.3) 23513 (73.1) 3428 (74.5)
25.0-29.9 kg/m2 2099 (5.7) 1552 (4.8) 547 (11.9)
30.0-34.9 kg/m2 163 (0.4) 116 (0.4) 47 (1.0)
35.0-39.9 kg/m2 17 (0.0) 12 (0.0) 5 (0.1)
≥40.0 kg/m2 7 (0.0) 5 (0.0) 2 (0.0)
FPG in �rst trimester, mmol/L 4.62±0.42 4.59±0.39 4.80±0.55 <0.001
Category of FPG in �rst trimester (n, %) <0.001
≤ 4.19mmol/L 5889 (12.2) 5355 (12.9) 534 (7.7)
4.19-4.62 mmol/L 19770 (40.9) 17621 (42.6) 2149 (30.9)
4.63-5.10 mmol/L 18184 (37.6) 15384 (37.2) 2800 (40.2)
5.11-7.0 mmol/L 4503 (9.3) 3029 (7.3) 1474 (21.2)
Delivery Times. 0.37±0.53 0.35±0.51 0.49±0.57 <0.001
OGTT at 0h, mmol/L d 2.52±2.17 2.42±2.14 3.10±2.23 <0.001
OGTT at 1h, mmol/L d 4.41±3.87 4.08±3.66 6.35±4.51 <0.001
OGTT at 2h, mmol/L d 3.91±3.41 3.62±3.22 5.61±3.99 <0.001
Delivery mode (n, %) <0.001
Obstetric Forceps 282 (0.6) 234 (0.6) 48 (0.7)
Eutocia 27294 (56.3) 23799 (57.4) 3495 (49.9)
Vacuum Extraction 424 (0.9) 347 (0.8) 77 (1.1)
Breech Presentation 18 (0.0) 18 (0.0) 0 (0.0)
Cesarean Section 20426 (42.2) 17048 (41.1) 3378 (48.3) <0.001
Primary Cesarean Section 7237 (14.9) 5691 (13.7) 1546 (22.1) <0.001
Gestational weight gain (GWG), Kg 2.21±2.58 2.21±2.57 2.20±2.60 0.768
Category of GWGc (n,%)
0.264
0.5kg 6212 (22.8) 5280 (22.7) 932 (23.5)
0.5-2kg 7798 (28.6) 6703 (28.8) 1095 (27.7)
0.5-2kg 13227 (48.6) 11296 (48.5) 1931 (48.8)
Major birth malformation of pasthistory (n, %)
9062 (18.7) 7509 (18.1) 1553 (22.2) <0.001
Bleeding amount in 24h, ml 287.82±98.80 287.68±97.77 288.64 ±104.72 0.455
Page 9/15
Newborn characteristics
Gestational age at delivery, wk 38.88±1.48 38.93±1.47 38.58±1.48 <0.001
Weigh of newborn, g 3281.52±440.43) 3284.19±434.95 3265.74±471.30 0.001
Apgar 1min 9.92±0.50 9.92±0.50 9.92±0.51 0.228
Apgar 5min 9.99±0.63 9.99±0.68 9.99±0.18 0.854
Apgar 1min 7 (n,%) 0.872
NO 48215(99.54) 41251(99.53) 6964(99.56)
Yes 224(0.46) 193(0.47) 31(0.44)
Adverse outcome
Polyhydramnios (%) 0.530
NO 47955(98.99) 41033(99.00) 6922(98.91)
Yes 489(1.01) 413(1.00) 76(1.09)
GHD (n, %) 0.001
NO 47314(97.67) 40518(97.76) 6796(97.11)
Yes 1130(2.33) 928(2.24) 202(2.89)
gestational hypertension 301
Preeclampsia 829
Cesarean Section (%) <0.001
NO 28018(57.84) 24398(58.87) 3620(51.73)
Yes 20426(42.16) 17048(41.13) 3378(48.27)
Primary Cesarean Section (%) <0.001
NO 41207(85.06) 35755(86.27) 5452(77.91)
Yes 7237(14.94) 5691(13.73) 1546(22.09)
PD (n, %) <0.001
NO 46058(95.07) 39520(95.35) 6538(93.43)
Yes 2386(4.93) 1926(4.65) 460(6.57)
Dystocia (n, %) 0.001
NO 46579(96.15) 39800(96.03) 6779(96.87)
Yes 1865(3.85) 1646(3.97) 219(3.13)
LGA (%) <0.001
NO 44211(91.26) 37990(91.66) 6221(88.90)
Yes 4233(8.74) 3456(8.34) 777(11.10)
Macrosomia (%) 0.004
NO 46172(95.31) 39550(95.43) 6622(94.63)
Yes 2272(4.69) 1896(4.57) 376(5.37)
LBW (%) <0.001
NO 46743(96.49) 40056(96.65) 6687(95.56)
Yes 1701(3.51) 1390(3.35) 311(4.44)
ICU attendance of newborns (n, %) <0.001
NO 43360(89.51) 37283(89.96) 6077(86.84)
Yes 5084(10.49) 4163(10.04) 921(13.16)

Page 10/15
a: At delivery
b: Categorized by WHO standard
c: Categorized by Institute ofMedicine standard
LBW: Low Birth Weight
LGA: Large for Gestational Age
GHD: Gestational HypertensiveDisorder
PD: Preterm Delivery before37weeks
Dystocia: Shoulder dystocia orbirth injury
Table2 OR for GDM and adverse pregnancy outcomes according to �rst-trimester FPG*
Page 11/15
Outcomes FPG Crude ORs P Adjusted ORs P
GDM Reference 1 1
4.19-4.62 1.223(1.107~1.351) <0.001 1.137(1.002~1.289) 0.046
4.63-5.10 1.825(1.655~2.012) <0.001 1.592(1.406~1.801) <0.001
5.11-6.99 4.880(4.378~5.439) <0.001 4.031(3.513~4.625) <0.001
Adverse pregnancy outcome
Cesarean Section Reference 1 1
4.19-4.62 1.054(0.993~1.118) 0.086 0.984(0.916~1.057) 0.656
4.63-5.10 1.235(1.163~1.312) <0.001 1.071(0.996~1.151) 0.064
5.11-6.99 1.440(1.331~1.557) <0.001 1.128(1.025~1.241) 0.014
GHD Reference 1 1
4.19-4.62 0.852(0.700~1.036) 0.109 0.746(0.594~0.935) 0.011
4.63-5.10 1.021(0.841~1.240) 0.831 0.922(0.737~1.152) 0.475
5.11-6.99 1.496(1.185~1.887) 0.001 1.250(0.956~1.634) 0.103
LGA Reference 1 1
4.19-4.62 1.251(1.113~1.406) <0.001 1.090(0.952~1.247) 0.213
4.63-5.10 1.549(1.380~1.740) <0.001 1.149(1.004~1.314) 0.044
5.11-6.99 2.124(1.853~2.436) <0.001 1.426(1.214~1.675) <0.001
Polyhydramnios Reference 1 1
4.19-4.62 0.841(0.639~1.106) 0.216 0.830(0.614~1.123) 0.228
4.63-5.10 0.780(0.589~1.032) 0.082 0.757(0.555~1.033) 0.080
5.11-6.99 0.971(0.677~1.393) 0.874 0.971(0.653~1.442) 0.883
Dystocia Reference 1 1
4.19-4.62 0.980(0.843~1.140) 0.793 1.081(0.909 ~ 1.286) 0.379
4.63-5.10 1.006(0.864~1.171) 0.941 1.164(0.977 ~ 1.388) 0.090
5.11-6.99 0.946(0.772~1.160) 0.593 1.187(0.940 ~ 1.500) 0.150
Primary Cesarean Section Reference 1 1
4.19-4.62 1.183(1.081~1.294) <0.001 0.893(0.780~1.022) 0.101
4.63-5.10 1.532(1.401~1.674) <0.001 0.998(0.873~1.142) 0.982
5.11-6.99 1.819(1.631~2.028) <0.001 0.977(0.828~1.154) 0.786
ICU attendance Reference 1 1
4.19-4.62 0.879(0.801~0.964) 0.006 0.887(0.791~0.995) 0.041
4.63-5.10 0.890(0.810~0.977) 0.014 0.887(0.789~0.997) 0.044
5.11-6.99 0.943(0.834~1.067) 0.353 0.918(0.787~1.070) 0.274
Macrosomia Reference 1 1
4.19-4.62 1.259(1.076~1.473) 0.004 1.117(0.932~1.338) 0.232
4.63-5.10 1.518(1.299~1.773) <0.001 1.172(0.978~1.405) 0.085
5.11-6.99 2.067(1.721~2.481) <0.001 1.561(1.260~1.933) <0.001
LBW Reference 1 1
4.19-4.62 0.768(0.665~0.888) <0.001 0.771(0.613~0.970) 0.026
Page 12/15
4.63-5.10 0.711(0.613~0.824) <0.001 0.718(0.567~0.909) 0.006
5.11-6.99 0.760(0.620~0.930) 0.008 0.734(0.533~1.012) 0.059
PD Reference 1 1
4.19-4.62 1.021(0.890 ~ 1.171) 0.768 1.559(0.589 ~ 4.125) 0.371
4.63-5.10 1.069(0.931 ~ 1.227) 0.344 1.300(0.486 ~ 3.482) 0.601
5.11-6.99 1.170(0.981 ~ 1.396) 0.081 2.232(0.673 ~ 7.406) 0.190
*FPG: FPG in the �rst-trimester
Reference: First category of early FPG≤4.19 mmol/L as the reference
Adjusted ORs:adjusted by maternal age,prepregancy BMI,height,delivery times and delivery weeks
Bold: OR 1,P 0.05; Italics: OR 1,P 0.05
Figures
Figure 1
Flow chart of selecting process of the survey
Page 13/15
Figure 2
Nomogram model for predicting the risk of GDM in Training validation.
Figure 3
Page 14/15
Nomogram model for predicting the risk of GDM in Testing validation.
Figure 4
The ROC curves for predictions of risk of GDM in the training and testing validation.
Figure 5
The calibration curves for predictions of risk of GDM in the training and testing validation.
Page 15/15
Figure 6
Decision curve analysis for predictions of risk of GDM in the training and testing validation.
Supplementary Files
This is a list of supplementary �les associated with this preprint. Click to download.
supplementalmaterials.docx