evidence of general economic principles of bargaining and
TRANSCRIPT

Articleshttps://doi.org/10.1038/s41562-020-0916-8
1Division of the Humanities and Social Sciences, California Institute of Technology, Pasadena, CA, USA. 2MobLab, Pasadena, CA, USA. 3Department of Economics, Texas A&M University, College Station, TX, USA. 4Department of Economics, LMU Munich, Munich, Germany. 5Department of Economics, National Taiwan University, Taipei, Taiwan. 6Center for Research in Econometric Theory and Applications, Taipei, Taiwan. 7Department of Economics, University of Pittsburgh, Pittsburgh, PA, USA. ✉e-mail: [email protected]
Social scientists generally search for lawful regularities in human behaviour and their causes. A necessary condition for such regularity is that, when the same methods are used by dif-
ferent scientists, the results are roughly the same. However, testing for regularity in this way is challenging because even the most care-fully attempted replications differ from original studies1–3.
Another way to learn about regularity of human behaviour is to repeat an experimental protocol that is highly standardized, over and over. We take advantage of such standardization in an educa-tional technology platform (called MobLab). This platform was specifically designed to offer simple, standardized experimental interfaces and procedures for instructors to conduct experiments in basic economics classes. Instructors love standardization because it makes teaching simpler. Most instructors who use the educa-tional platform have never run any other experiments in their own research. It is a happy coincidence of wants that the standardization that is useful for instructors is also so useful for testing reproduc-ibility at scale.
Of course, there will always be some differences between classrooms and other variables affecting behaviour. These dif-ferences include student demographics, knowledge, incentives (some instructors tie grades to performance in experiments) and pre-experimental classroom experience4. In our dataset, such dif-ferences become an informative source of variation in human behaviour because the differences are not confounded with differ-ences in experimental protocols governing how the experiments are conducted.
The main reason to value a new dataset is that it generates valu-able insights that are not available from other sources. Using these data, we explore regularity and differences in two kinds of collective human behaviour: centralized buyer–seller trade and two-person bargaining. The centralized buyer–seller trades are markets in
which buyers and sellers are assigned values and costs (called ‘induced value’ in experimental jargon), which motivate them to buy or sell. Trading is centralized because all subjects see a common screen showing at what amount other subjects are willing to buy or sell. The two-person bargaining is an ‘ultimatum game’. One sub-ject offers a share of a known amount of money to another subject, who can accept or reject their share. If she rejects the offer, nobody gets anything. This game is a stylized model of a common event that often occurs at the end of everyday bargaining. Variants of the game have also been used to isolate many cognitive and emo-tional processes.
The behaviour should interest a wide range of social scientists besides economists. The ultimatum game is now widely used to study sociality, in neuroscience5, anthropology6, animal behaviour7, child development8 and psychiatry9. Scientists have also measured the effects of alcohol intoxication10, meditation experience11, sero-tonin change12 and prefrontal damage13,14 on ultimatum bargaining. The scientific value of these variations depends on having a clear picture of what ‘normal’ human ultimatum bargaining looks like. Our data contribute to this picture.
We also analysed thousands of periods of trading in buyer–seller markets. These markets have not previously been of much interest in social and biological sciences but they could be. For example, the experimental market designs often choose equilibrium prices that are not round numbers. The equilibrium-predicted price might be designed to be 112, rather than a rounder-numbered price of 100. Cognitive neuroscientists have known for years that a lot of mathe-matical processing involves a ‘number sense’15 that uses approxima-tion. Dehaene and Mehler16 show that round numbers such as 100 are more common, across several cultures, than adjacent numbers. These phenomena are consistent with noisy encoding in keeping with the Weber–Fechner law. These considerations create the possibility
Evidence of general economic principles of bargaining and trade from 2,000 classroom experimentsPo-Hsuan Lin 1,2, Alexander L. Brown 3, Taisuke Imai 4, Joseph Tao-yi Wang 5,6, Stephanie W. Wang 2,7 and Colin F. Camerer 1 ✉
Standardized classroom experiments provide evidence about how well scientific results reproduce when nearly identical meth-ods are used. We use a sample of around 20,000 observations to test reproducibility of behaviour in trading and ultimatum bargaining. Double-auction results are highly reproducible and are close to equilibrium predictions about prices and quantities from economic theory. Our sample also shows robust correlations between individual surplus and trading order, and autocor-relation of successive price changes, which test different theories of price dynamics. In ultimatum bargaining, the large dataset provides sufficient power to identify that equal-split offers are accepted more often and more quickly than slightly unequal offers. Our results imply a general consistency of results across a variety of different countries and cultures in two of the most commonly used designs in experimental economics.
NATurE HumAN BEHAvIour | www.nature.com/nathumbehav

Articles Nature HumaN BeHavIOur
that economic theory will be off by a little bit because trading prices are rounded off. Other theories of efficient adaptive coding17 offer hypotheses about how perceptions of numbers are influenced by a previous sequence of numbers. These theories could be applied to understanding details about how a sequence of numerical bids, offers and trade prices influence perception of new prices and mar-ket adjustment. These sensible ideas are completely absent from how most economists think about gradual price adjustment.
Herbert Simon18 hypothesized that observable behaviour results from a ‘scissors’ consisting of a cognitive strategy (one blade) inter-acting with an institutional environment (the second blade). Our trading market evidence is consistent with this view. We show simu-lation results suggesting that very simple kinds of ‘zero intelligence’ cognitive strategies are consistent with trading dynamics within an experimental period, since the results of those simple strategies can be mutually beneficial due to the institutional environment. However, it is also evident that in smaller markets more sophis-ticated theories of trading dynamics, in which traders anticipate strategies of others, gain in accuracy.
The contrast between the large role of fairness in two-person bar-gaining and its nonexistent role in centralized trade among many traders should also be of general interest in social science. It has been hypothesized that two-person bargaining is ‘personal’, activat-ing evolved concerns for fairness and reciprocity from our ancestral life19. These concerns could generate differences in bargaining out-comes across different geographical settings, and even across types of classes and students due to cultural norms about sharing and due to classroom exposure.
Centralized trade, in contrast, is thought to be ‘impersonal’: a market of people acting selfishly, with no concern for fairness, can produce highly mutually beneficial outcomes without deliberately trying to create efficiency in trade or fairness. As Adam Smith famously wrote, ‘it is not from the benevolence of the butcher, the brewer, or the baker that we expect our dinner, but from their regard to their own interest’20. Indeed, economic theory has shown math-ematically why concerns for fairness that influence two-person bar-gaining should have no impact on large markets because a single trader is unable to create fairness in the face of competition21,22. If fairness concerns are indeed muted in many markets, centralized buyer–seller trading experiments may produce nearly identical out-comes for students all over the world.
An acknowledged limit of this approach is that the subjects are all naturally occurring students in classes (in a narrow range of age and analytical skill). Most choices are not incentivized by mone-tary earnings determined by choices. Note, however, that in early experimental economics studies23,24 subjects were not incentivized for trades. Nonetheless, those unincentivized data were important in suggesting basic principles about behaviour in markets. It later became customary to pay subjects earnings linked to experimental behaviour and even to pay a small ‘commission’ for executing trades (since otherwise marginal trades were not made)25. Summaries of different experiments with within-experiment variation in no-, medium- and high-performance incentives have sometimes shown decreased variability in response noise with incentive pay26,27, although the most reliable differences come from not paying at all, especially when a response is socially desirable (for example, tak-ing more risk or sharing money with strangers)28. Attempts to con-duct the ultimatum game without monetary incentives29 also find roughly similar results as when financial incentives are used30. That is, average offers are much greater than zero but many offers are less than half and conditional acceptance rates increase in offer size. A recent meta-analysis31 also finds no effect of increased incentives.
While we believe that incentive pay linked to choices is usually desirable in economics experiments, the experimental platform did not impose this on instructors. However, a limited analysis across different types of incentives offered by about 10% of the instructors
suggests different levels of incentives do not create substantial dif-ferences in behaviour. While many readers may not be overly con-cerned about drawing conclusions from unincentivized classroom data, economists often are, and hence we address their concern to the extent possible.
resultsBuyer–seller double auctions. Centralized markets, in which buy-ers and sellers compete impersonally, are both prominent in eco-nomic theory and are how a lot of trading in developed economies is actually organized. In pioneering economic experiments, demand from buyers and supply from sellers are ‘induced’ artificially so that numerical predictions can be made (see Methods). Even with a small number of traders on each side of the market, traders can arrive at a maximum number of mutually beneficial trades as long as there is centralized exchange of information about prices and trading opportunities—called ‘price discovery’24,25.
The key idea used to analyse these experiments is ‘competitive equilibrium’ (CE), familiar in economics but almost unknown in other social sciences. In CE, there is a price at which the number of units bought equals the number of units sold (the intersection of supply and demand curves) and no agent has market power to raise or lower prices. In the markets created by MobLab, in CE the traders are collectively maximizing the sum of profit (‘producer surplus’) and consumer surplus, which is the total net value of goods pur-chased minus prices paid.
Experimental results on convergence to CE has been summa-rized by Charles Holt32: ‘The striking competitive tendency of the double-auction institution, which has been confirmed by at least a thousand market sessions in a variety of designs, indicate that nei-ther complete information nor large numbers of traders is a nec-essary condition for convergence to competitive equilibrium (CE) outcomes’. Other summary handbook and textbook chapters draw similar conclusions33–36. While these assertions about convergence are widely accepted, there are actually no hard data summarizing the numerical speed of convergence in prices, volume and allocative efficiency across many experiments. Convergence to CE in small markets is ‘folk wisdom’ in experimental economics. However—as a reader of this paper remarked—folk wisdom is not science (and is sometimes wrong). So, even if our results are simply showing that folk wisdom is correct, we regard that clear evidence as a scientific contribution.
Furthermore, despite the many experiments on centralized dou-ble auctions, there are few tests of the dynamics of how prices change within trading periods and across trading periods. Dynamics are important because how rapidly and smoothly a market equilibrates can make a large difference in design and in public acceptance of markets and changes. For example, if a government changes a tar-iff on imported goods that changes local prices, whether the price adjustment is fast or slow could have large impact on political econ-omy, jobs, stock prices, local housing and more. Theories of price dynamics are needed to predict how such adjustments work and vary across markets.
In a handbook chapter on auctions37, it is noted that Cason and Friedman’s38 important analysis used only one dataset that satisfied theory assumptions. And in those data, ‘...the few traders involved result in only two or three transactions within each market period, so the power of this test is quite low’. Our results therefore fill in an important gap in our knowledge by providing highly powered evidence from many experiments about numerical prop-erties of double-auction outcomes and particularly within-period trading dynamics.
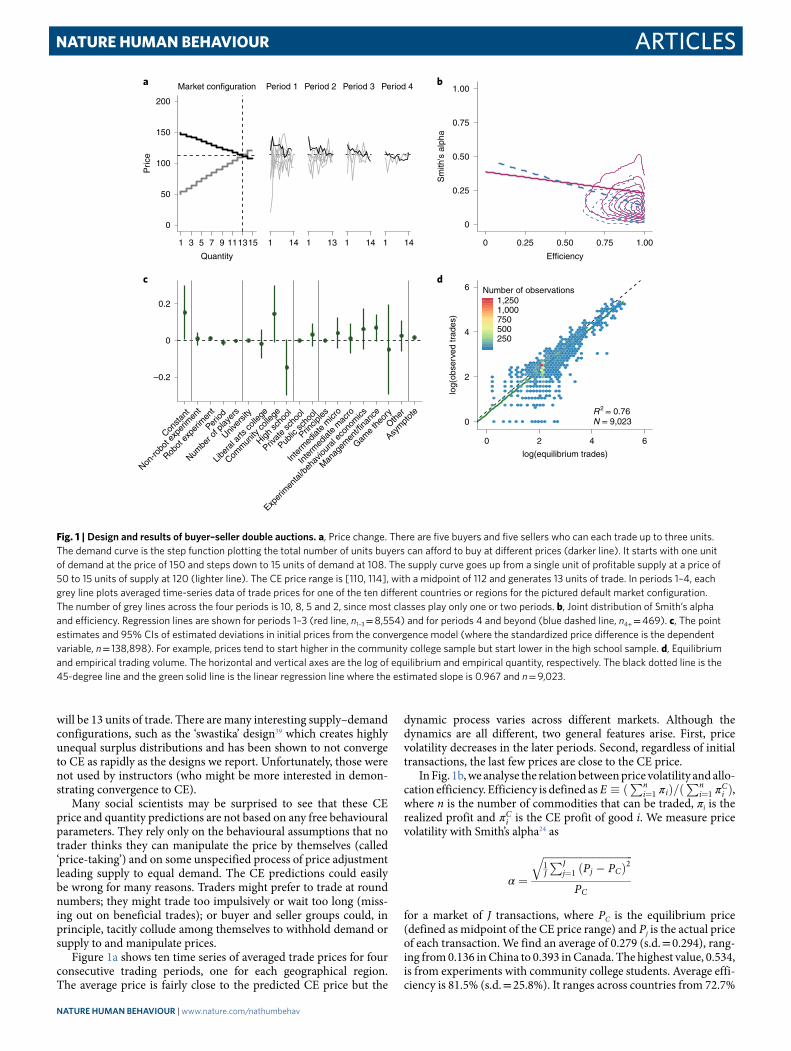
Figure 1a shows the most common supply–demand design in our dataset. It has five buyers and five sellers who can each trade up to three units, one unit at a time. The CE price range is [110, 114] with a midpoint of 112 and generates the prediction that there
NATurE HumAN BEHAvIour | www.nature.com/nathumbehav
ArticlesNature HumaN BeHavIOur
will be 13 units of trade. There are many interesting supply–demand configurations, such as the ‘swastika’ design39 which creates highly unequal surplus distributions and has been shown to not converge to CE as rapidly as the designs we report. Unfortunately, those were not used by instructors (who might be more interested in demon-strating convergence to CE).
Many social scientists may be surprised to see that these CE price and quantity predictions are not based on any free behavioural parameters. They rely only on the behavioural assumptions that no trader thinks they can manipulate the price by themselves (called ‘price-taking’) and on some unspecified process of price adjustment leading supply to equal demand. The CE predictions could easily be wrong for many reasons. Traders might prefer to trade at round numbers; they might trade too impulsively or wait too long (miss-ing out on beneficial trades); or buyer and seller groups could, in principle, tacitly collude among themselves to withhold demand or supply to and manipulate prices.
Figure 1a shows ten time series of averaged trade prices for four consecutive trading periods, one for each geographical region. The average price is fairly close to the predicted CE price but the
dynamic process varies across different markets. Although the dynamics are all different, two general features arise. First, price volatility decreases in the later periods. Second, regardless of initial transactions, the last few prices are close to the CE price.
In Fig. 1b, we analyse the relation between price volatility and allo-cation efficiency. Efficiency is defined as E ðPn
i¼1 πiÞ=ðPn
i¼1 πCi Þ
I,
where n is the number of commodities that can be traded, πi is the realized profit and πCi
I is the CE profit of good i. We measure price
volatility with Smith’s alpha24 as
α ¼
ffiffiffiffiffiffiffiffiffiffiffiffiffiffiffiffiffiffiffiffiffiffiffiffiffiffiffiffiffiffiffiffiffiffiffi1J
PJj¼1 ðPj � PCÞ2
q
PC
for a market of J transactions, where PC is the equilibrium price (defined as midpoint of the CE price range) and Pj is the actual price of each transaction. We find an average of 0.279 (s.d. = 0.294), rang-ing from 0.136 in China to 0.393 in Canada. The highest value, 0.534, is from experiments with community college students. Average effi-ciency is 81.5% (s.d. = 25.8%). It ranges across countries from 72.7%
0
50
100
150
200
1 3 5 7 9 111315
Quantity
Pric
e
Market configuration
1 14
Period 1
1 13
Period 2
1 14
Period 3
1 14
Period 4a
–0.2
0
0.2
Consta
nt
Non-ro
bot e
xper
imen
t
Robot
exp
erim
ent
Period
Numbe
r of p
layer
s
Univer
sity
Liber
al ar
ts co
llege
Comm
unity
colle
ge
High sc
hool
Privat
e sc
hool
Public
scho
ol
Princip
les
Inte
rmed
iate
micr
o
Inte
rmed
iate
mac
ro
Exper
imen
tal/b
ehav
ioura
l eco
nom
ics
Man
agem
ent/f
inanc
e
Game
theo
ryOth
er
Asym
ptot
e
c
0
0.25
0.50
0.75
1.00
0 0.25 0.50 0.75 1.00
Efficiency
Sm
ith's
alp
ha
b
R2 = 0.76N = 9,0230
2
4
6
0 2 4 6
log(equilibrium trades)lo
g(ob
serv
ed tr
ades
)
2505007501,0001,250
Number of observationsd
Fig. 1 | Design and results of buyer–seller double auctions. a, Price change. There are five buyers and five sellers who can each trade up to three units. The demand curve is the step function plotting the total number of units buyers can afford to buy at different prices (darker line). It starts with one unit of demand at the price of 150 and steps down to 15 units of demand at 108. The supply curve goes up from a single unit of profitable supply at a price of 50 to 15 units of supply at 120 (lighter line). The CE price range is [110, 114], with a midpoint of 112 and generates 13 units of trade. In periods 1–4, each grey line plots averaged time-series data of trade prices for one of the ten different countries or regions for the pictured default market configuration. The number of grey lines across the four periods is 10, 8, 5 and 2, since most classes play only one or two periods. b, Joint distribution of Smith’s alpha and efficiency. Regression lines are shown for periods 1–3 (red line, n1–3 = 8,554) and for periods 4 and beyond (blue dashed line, n4+ = 469). c, The point estimates and 95% CIs of estimated deviations in initial prices from the convergence model (where the standardized price difference is the dependent variable, n = 138,898). For example, prices tend to start higher in the community college sample but start lower in the high school sample. d, Equilibrium and empirical trading volume. The horizontal and vertical axes are the log of equilibrium and empirical quantity, respectively. The black dotted line is the 45-degree line and the green solid line is the linear regression line where the estimated slope is 0.967 and n = 9,023.
NATurE HumAN BEHAvIour | www.nature.com/nathumbehav

Articles Nature HumaN BeHavIOur
in England to 86.0% in Spain. Community college students achieve only 69.5%. The median efficiencies are higher, which indicates that some outlying low-efficiency periods are dragging down the means.
Conceptually, if the price fluctuates dramatically, it is possible that some traders who should not trade that unit in equilibrium can transact at a profit under extreme price levels. Either the buyer/seller on the other end of the trade is trading at a loss or this transactor will crowd out another who should trade in equilibrium, decreas-ing efficiency. Subsequently, there should be a negative correlation between Smith’s alpha and efficiency (Fig. 1b), although this can only be shown in large datasets with many markets. Indeed, the correlation coefficient is –0.071 (r(8552) = –0.071; P < 0.001; 95% confidence interval (CI) = [–0.092, –0.050]) for our data. When considering repeated markets after more than three periods of trad-ing (n = 469 from 317 markets), the correlation coefficient is larger, –0.409 (r(467) = –0.409; P < 0.001; 95% CI = [–0.482, –0.331]). This indicates that experience with the same supply–demand configura-tion helps players identify and exploit arbitrage opportunities dur-ing price fluctuations.
Fitting an exponential convergence model40 (Supplementary Results B.2) allows us to extrapolate and speculate what would hap-pen after 25 periods of trading. Smith’s alpha is predicted to drop from 0.206 to 0.086 but efficiency remains stable at about 92% even after 25 periods. These estimates are similar to those from promi-nent early experiments (see Methods).
Although the data show that most of the available surplus can be captured by the double auction, efficiency losses are still com-mon across markets. To analyse the sources of inefficiency, we adopt the same approach as Cason and Friedman41 and decompose the efficiency losses into two different types: transactions involving extra-marginal trades (EM-inefficiency) and profitable trades that are not realized (V-inefficiency). In our data, 47.4% of the losses are from extra-marginal trades and the rest are from unrealized profit-able trades. In Cason and Friedman41, 55.8–67.8% of the losses are from extra-marginal trades. This implies that both EM-inefficiency and V-inefficiency are prominent, although the higher rate of unrealized trades in our classroom data, compared to Cason and Friedman41, may be due to the lack of financial stakes or the gener-ally few trading periods.
To quantify the heterogeneity in the initial prices and the con-vergence of ending price within a period, we adopt the convergence model42:
yit ¼ ð1=tÞXiβ1 þ ð1� 1=tÞβ2 þ ϵit
where i indicates the particular period of market, t represents time as measured by the transaction order, Xi is a vector containing the information about that market period and β1 captures the origin of the possible dynamic process. Note that β2 is the asymptote of the dependent variable. As t becomes larger, the weight of β1 becomes smaller because 1/t approaches 0 while the weight of β2 increases as (1 − 1/t) approaches 1. We take the standardized price difference as the dependent variable (Fig. 1c and Supplementary Table 13). The standardized price difference is defined as δj = (Pj − PC)/PC, where PC is the equilibrium price and Pj is the actual price of each transaction with j = 1, …, J. Although the initial price is on average 15.3% higher than the equilibrium price with subtle heterogeneity, the final price converges to only 1.7% higher than the equilibrium price, within the range of –2.9–1.9% reported in Ketcham et al.43.
Figure 1d provides a scatterplot (in log-scale) for the actual observed quantity and the predicted equilibrium quantity within each of the market experiments. Each dot represents one experi-mental trading period. An ordinary least-squares regression line has a slope that is close to the identity trend line where the estimated slope is 0.967 (t(9,021) = 78.20; P < 0.001; 95% CI = [0.942, 0.991]) but with a significant downward shift of 10.0% (t(9,021) = –2.880;
P = 0.004; 95% CI = [–16.8%, –3.2%]). There is a little less trad-ing than predicted (which is common in early periods of previous incentivized laboratory experiments also). However, the amount of undertrading does not fall from early to late periods (Supplementary Results B.4). Smith24 also finds slightly less trading without mone-tary incentives and shows how real incentives and small trade com-missions induce subjects to bid up to their values or costs.
The CE predicted price and quantity are close to actual prices and quantities. However, it has long been mysterious how the psy-chology and dynamics of trading over real time actually lead to these market outcomes. Three prominent theories have been pro-posed for within-period price formation but have only been tested in quite small samples. In addition, Easley and Ledyard44 propose a theory for between-period price formation but also could not test it powerfully due to data limitations. Our data provide a better test of all these important theories.
The three within-period dynamic theories range widely over how strategically sophisticated players are assumed to be. From the most sophisticated to the least, one theory assumes Bayesian mutual adjustment of trading strategies in an incomplete informa-tion game (hereafter ‘Mutual Adjustment’, MA)45. A second theory simplifies by assuming traders do not strategize about other traders’ strategies (hereafter ‘Against Nature’, AN)46. The third theory posits ‘zero-intelligence’ (ZI) traders who pay no attention to price his-tory at all and just bid randomly (while not losing money)47. See Supplementary Results B.3 for details.
The three theories predict that the autocorrelation between suc-cessive price changes within a trading period should be zero, posi-tive or negative, respectively. The first two theories also predict a clear correlation between how extreme a trader’s values or costs are and when they trade. In the more sophisticated MA and AN theo-ries, buyers and sellers who have the most to earn are predicted to trade the earliest. This prediction corresponds to a negative correla-tion of value and trade order for buyers, and a positive correlation of cost and trade order for sellers.
Thus, all three theories can be tested by looking at autocorrela-tion of price changes and correlation of value/cost and trade order. Moreover, these theories also predict the source of any market inef-ficiency. MA and AN both predict that the only source of ineffi-ciency comes from the least-profitable trades not being executed (V-inefficiency). In contrast, ZI predicts that inefficiency can arise from the displacement of extra-marginal trades (EM-inefficiency).
Figure 2a,b show the distributions of Spearman’s rank correla-tion coefficients of the seller cost and order of trade and of the buyer value and order of trade. Since we need four transactions to calculate price-change autocorrelation, we are down to 8,492 market periods. The average rank-order correlation coefficient is ρbuyer = –0.539 (s.d. = 0.277) for buyers and ρseller = 0.518 (s.d. = 0.279) for sell-ers. Hence, unlike a previous study which finds lower values41, we find greater support for the two strategic theories45,46, although zero-intelligence theory also suggests that high-value buyers and low-cost sellers will transact slightly earlier.
Decomposing the sources of inefficiency, we find that about half of the losses (47.4%, s.d. = 42.0%) are from EM-inefficiency, suggesting that both sources are common. Furthermore, there is only 31.2% EM-inefficiency in the smallest markets (with six play-ers or fewer) consistent with the two strategic theories and 52.7% EM-inefficiency in the largest markets (of 36 players or more) con-sistent with ZI theory (Supplementary Results B.5).
Correlations in the trading order with values are also higher in magnitude in the smallest markets compared to the largest markets (around 0.67 versus 0.42; Supplementary Table 16). The more stra-tegic MA and AN theories do appear to fit better with fewer traders.
In addition, given the large volume of data, we are able to identify a decrease in the size of this correlation when comparing periods 1–3 with period 4 and beyond. In fact, buyer rank-order correlation
NATurE HumAN BEHAvIour | www.nature.com/nathumbehav

ArticlesNature HumaN BeHavIOur
shows a statistically significant drop from ρ1��3buyer ¼ �0:540I
to ρ4þbuyer ¼ �0:506I
(s.d. = 0.277 and 0.275, respectively; Kolmogorov–Smirnov test, KS = 0.0826, P = 0.006). Similarly, seller rank-order correlation shows a statistically significant decrease from ρ1��3seller ¼ 0:521I
to ρ4þseller ¼ 0:472I
(s.d. = 0.278 and 0.299, respec-tively; KS = 0.0867, P = 0.003). This provides large-scale evidence for the theory of between-period price formation developed in Easley and Ledyard44.
Traders also use the history of transactions in the previous period to form strategies in the current period, as described in the Easley and Ledyard model. Specifically, their model predicts that the trans-action prices in period t + 1 are bounded in the range Pt ; �Pt½
I where
PtI
and �PtI
are the minimum price and maximum price in period t, respectively. Easley and Ledyard analyse the data from eight experi-ments, finding 6.3% of the trades violate the prediction. Yet, we find 14.52% (s.d. = 35.2%) of the 48,621 transactions in our data fall out-side of the predicted price range. To put this into perspective, our price range is estimated to shrink each period by 9.25% of the stan-dardized price, starting from a standardized price range of [–0.233, 0.461] in period 2 and approaching zero by period 10. In contrast, the ZI simulation shows a constant range of [–0.425, 0.240], result-ing in 19.62% (s.d. = 39.71%) of ZI simulated transactions being outside the estimated price range of period 2.
Figure 2c plots price changes from one trade to the next against the lagged price changes. Similar to the inexperience sessions of Cason and Friedman41, there is a clear trade-by-trade negative auto-correlation, estimated to be –0.457 (r(120985) = –0.457; P < 0.001;
95% CI = [–0.461, –0.453]). These estimates are very close to the prediction of –0.50 from the zero-intelligence theory and far from the prediction of the two other theories.
Figure 2d reports all three correlations at once, showing three heatmaps to demonstrate the pairwise relationships between buyer rank-order correlation, seller rank-order correlation and price-change autocorrelation. Since there is no clear numerical pre-diction for zero-intelligence algorithm, we ran 10,000 simulations in the default market configuration to create a benchmark. Matching our data with the 95% confidence region of zero-intelligence simulations and two other theoretical predictions, we find much stronger support for zero-intelligence theory, compared to earlier evidence41,48. However, a non-negligible portion of our data falls outside of the simulated 95% confidence region and tends to be in the direction predicted by the two more sophisticated theories of price formation.
These results are similar in early and late periods (Supplementary Figs. 9 and 10). Coupled with the distributional shifts predicted by Easley and Ledyard’s price formation theory44, it appears that ZI explains dynamics within periods and Easley and Ledyard’s explains the adjustment between periods. However, in smaller markets the data move towards predictions of the more sophisticated theories (Supplementary Table 16).
Ultimatum games. The ultimatum game is one round of take-it-or-leave-it bargaining30,49,50. If all players selfishly care only about their own payoffs, responders should accept any positive
00.51.01.52.0
–1.0 –0.5 0 0.5 1.0Correlation coefficient (seller cost and transaction order)
Den
sity
Period 4+Period 1–3
a
00.51.01.52.0
–1.0 –0.5 0 0.5 1.0Correlation coefficient (buyer value and transaction order)
Den
sity
Period 4+Period 1–3
b
–4
–2
0
2
4
–4 –2 0 2 4Price change
Lagg
ed p
rice
chan
ge
5,000
10,000
Number ofobservations
c
–1.0
–0.5
0
0.5
1.0
–1.0 –0.5 0 0.5 1.0ρbuyer
ρ selle
r
ρ selle
r
ρ pric
e
–1.0
–0.5
0
0.5
1.0
–1.0 –0.5 0 0.5 1.0ρprice
–1.0
–0.5
0
0.5
1.0
–1.0 –0.5 0 0.5 1.0ρbuyer
d
Fig. 2 | Statistical analysis of trading dynamics. Two statistics can be used to test three hypotheses about trading dynamics: rank–order correlation and price change autocorrelation. a, The distribution of Spearman’s rank correlation coefficient between seller’s cost rank and transaction order. Each observation is one trading period: solid for periods 1–3 (n1–3 = 8,052) and hollow for period 4 and beyond (n4+ = 440). The average rank-order correlation coefficient is ρseller = 0.518 with s.d. = 0.279 (ρ1�� 3
seller ¼ 0:521I
and ρ4þseller ¼ 0:472I
). b, The distribution of Spearman’s rank correlation coefficient between buyer’s value rank and transaction order (solid, n1–3 = 8,052; hollow, n4+ = 440). The average rank–order correlation coefficient is ρbuyer = –0.539 with s.d. = 0.277 (ρ1�� 3
buyer ¼ �0:540I
and ρ4þbuyer ¼ �0:506I
). c, The trade-by-trade price change within a period, correlated with the lagged price change. The overall trade-by-trade price change autocorrelation ρprice = –0.457; the linear regression line has a slope of –0.491 (n = 120,987; t(120,985) = –69.20; P < 0.001; 95% CI = [–0.504, –0.477]). d, The heatmaps of ρbuyer, ρseller and market-level price change autocorrelation ρprice (with an average of –0.431, n = 8,492). Theoretical predictions are depicted in the heatmaps for MA (yellow), AN (green) and ZI (pink).
NATurE HumAN BEHAvIour | www.nature.com/nathumbehav

Articles Nature HumaN BeHavIOur
proposal offer (and maybe even zero). Proposers who anticipate that responders will take anything should offer the smallest amount (or zero). Nonetheless, as has been observed in previous studies, this extreme prediction is far from what people usually do. Some responders reject positive offers, even though they know they are giving up money and will get nothing. There does not appear to be strong learning over repeated plays of ultimatum games (even against the same partner) to accept offers in general51.
A prominent explanation for rejection of offers is that responders are willing to give up earnings to reduce disadvantageous inequality, which results if they get less than the proposer52,53. However, a dis-taste for inequality cannot be the sole explanation because respond-ers are less likely to reject small offers, which create inequality, when they are made by a computer or disinterested third-party (rather than by the proposer who benefits a human54). The latter rejections indicate negative reciprocity toward people whom responders think have treated them unfairly to help themselves55,56. Selfish proposers who anticipate responders’ rejections of small offers should make strategic offers that are large enough to avoid rejection. Proposers might also make large generous offers if they are altruistic, although most evidence suggests that proposers are avoiding rejection rather than being altruistic57,58.
The distribution of proposer offers in our data shows clear mul-timodal spikes at multiples of tens, most frequently at 50% (Fig. 3a). The acceptance rate of responders, depending on the offer amount, increases almost monotonically with the size of the proposal offer (except for a slight downward trend for those rare hyper-fair offers of >50%; Fig. 3b).
In these ultimatum game data there are several statistical fea-tures that are special about offers of exactly 50%. A piecewise linear
regression of acceptance probability as a function of offers, with a break at 50%, shows a highly significant discontinuous jump in acceptance at 50% in both the one-shot games and repeated games (one-shot 16.3%: t(10,505) = 10.84; P < 0.001; 95% CI = [13.3%, 19.2%]; repeated 26.2%: t(10,505) = 9.40; P < 0.001; 95% CI = [20.8%, 31.7%]). The jump is present in every country and robust to non-linear acceptance rates (Supplementary Table 3). The discontinu-ous drop immediately after 50% is insignificant in both one-shot games and repeated games with (one-shot 2.57%: t(10,505) = 1.32; P = 0.188; 95% CI = [–1.3%, 6.4%]; repeated 1.78%: t(10,505) = 0.59; P = 0.557, 95% CI = [–4.2%, 7.7%]), respectively, in contrast to ref. 59 who find equal-split offers treated differently in alternating- offer bargaining.
The MobLab platform also records how long it takes subjects to make decisions (their reaction times or RTs). The responders’ RTs indicate the special appeal of equal-split offers: there is a drastic drop in the time responders take to make a decision when they face an offer of 50%, say, compared to 49% (Fig. 3d and Supplementary Results A.4). For one-shot games, the responders’ average RT is 7.1 s when they are facing an exactly equal offer. RTs are slower, averag-ing 10.7 s when they are facing a near-equal offer of 49% (two-tailed t-test: t(1,572) = 7.379; P < 0.001).
The relative RT for acceptance (compared to rejection) also gets faster as offers increase above 40%. This difference in RT reverses as offers decrease below 35%; then rejection RTs are faster as offers fall. These relationships indicate that, at the population level, the responders’ RTs peaks near the offer size which they are indifferent between accepting and rejecting, and RTs fall when either accep-tance of higher offers or rejection of lower offers become more fre-quent. This consistency between the speed of RT and the strength of
0
0.05
0.10
0.15
0.20
0.25
0 25 50 75 100
Offer
Den
sity
One shotRepeated
a
0
0.25
0.50
0.75
1.00
0 25 50 75 100
Offer
Acc
epta
nce
rate
One shotRepeated
b
Baseline: principles of economics (40.04%)
–9
–6
–3
0
Inte
rmed
iate
micr
o
Other
Exper
imen
tal e
cono
mics
Man
agem
ent/f
inanc
e
Politic
al ec
onom
y
Game
theo
ry
Mar
gina
l effe
ct (
%)
c
0
4
8
12
16
0 25 50 75 100
Offer
Res
pond
er R
T (
s)
AcceptReject
d
Fig. 3 | offers, acceptance rates and reaction times in ultimatum game experiments. a, Proposal offers in one-shot (nO = 5,407) and repeated games (with a fixed partner protocol, nR = 5,100). b, The average acceptance rate for different proposal offer levels and a piecewise linear regression allowing a discontinuity at 50% (n = 10,507). The size of the dots represents the frequency of each offer amount. c, The point estimates and 95% CIs of estimated marginal effects of different classes on proposal offers with n = 10,507. The principles of economics is the reference group. d, The responders’ RTs in one-shot games. The locally weighted scatterplot smoothing estimation with 95% CI of responders’ RTs, conditional on acceptance (rejection) is shown in the blue (red) curve. n = 10,192 after excluding outliers (see Supplementary Result A.4).
NATurE HumAN BEHAvIour | www.nature.com/nathumbehav

ArticlesNature HumaN BeHavIOur
preference is consistent with other studies aimed at inferring prefer-ences from RTs60,61. Furthermore, our population-level result is con-sistent with Krajbich et al.62, although their simpler discrete-offer design is too coarse to detect the sharp drop at exactly 50%.
The frequency of exactly 50% splits, and the speed and jump in frequency of acceptance, is not consistent with typical models of inequity aversion or reciprocity. Those models assume smooth comparisons of own outcomes and inequality, so that giving 49% rather than 50%, for example, should lead to only a tiny difference in rejections rather than a big jump. However, models with social image concerns can produce equilibria with substantial concentra-tion around an exact 50–50 norm if there is a categorical social judgement about whether a person is exactly fair or nearly fair. These types of model are consistent with our data and are consis-tent with other data on dictator laboratory experiments63, the fre-quency of exactly equal bequests64 and equalized royalty-sharing in inventions (Kotha, Kim, Camerer and Lovallo, unpublished observations).
Our data also shows the effect of conducting experiments in dif-ferent student classes. Figure 3c shows the regression coefficients for class dummies when predicting proposal offers controlling for various configurations (Supplementary Results A.3). We find that only advanced elective classes in economics significantly reduce proposal offers (students in these classes are also likely to major in economics). In game theory and political economy classes, proposer offers are lower by >5% (from an average of 40.04%). In contrast, in experimental and behavioural economics and management/finance classes, proposal offers are lower by only 2–3.2%. Our results are consistent with ref. 65 who find lower charitable donation due to self-selection for students majoring in economics, not by ‘indoc-trination’ of non-majors in those classes. While our data cannot show whether more economics training reduces proposal offers because of self-selection or indoctrination, it, nevertheless, shows a correlation.
To investigate whether results vary by incentive scheme, we found the syllabi of as many classes as we could (58 out of 490 ses-sions of the ultimatum game). The incentives described in the syl-labi are of four types: no incentive, participation credit (of a required number of experiments regardless of outcome), course points and real money. The results do not show that the patterns of behaviour are significantly different across the incentive structures, although too few classes used real money incentives to draw any conclusions about the impact of monetary stakes (Supplementary Results A.6).
Heterogeneity. With data from around the globe, we are able to look into heterogeneity generated by geographical differences (see Fig. 5 for the distribution of observations). Specifically, we are inter-ested in whether there is country-level variation in proposal offers and acceptance rates in the ultimatum game, as well as in first- and last-transaction prices in buyer–seller double auctions. To control for the experience and environment, we only use the data from the first period of the default configuration in the following analysis.
Conceptually, we want to analyse how subject pools differ in our dataset. To quantify how an average player/market would vary across different regions, we focus on the variation of ‘true means’ in different countries, instead of the variation in each player/market’s performance. To achieve this goal, we treat each country’s dataset as a different ‘study’ (that estimates its country mean) and conduct meta-analysis.
Specifically, we calculate the I2 through the commonly used DerSimonian–Laird random-effects model66,67:
I2 ¼ Q� d:f :Q
� �´ 100%
where d.f. is the degree of freedom and Q is defined by the weighted sum-of-squares (of each country’s deviation from the true mean) weighted by the inverse-variance68:
I 2 = 86.61
25
30
35
40
Spain
China
US Midw
est
US Nor
th E
ast
Singap
ore
Englan
d
US Sou
th
Japa
n
Canad
a
US Wes
t
Overa
ll
Mea
n of
fer
aI 2 = 42.98
0.5
0.6
0.7
0.8
Spain
Englan
d
US Wes
t
Japa
n
China
Canad
a
US Sou
th
US Nor
th E
ast
US Midw
est
Singap
ore
Overa
ll
Unc
ondi
tiona
l acc
epta
nce
rate
bI 2 = 30.63
–2.0
–1.5
–1.0
–0.5
Englan
d
US Wes
t
Canad
aSpa
in
Japa
n
US Sou
th
US Nor
th E
ast
US Midw
est
China
Singap
ore
Overa
ll
Coe
ffici
ent o
f reg
ress
ion
dum
my
c
I 2 = 27.28–0.75
–0.50
–0.25
0
0.25
Spain
Singap
ore
US Sou
th
US Wes
t
Englan
d
US Nor
th E
ast
China
Canad
a
Japa
n
US Midw
est
Overa
ll
Mea
n of
sta
ndar
dize
dfir
st p
rice
d
I 2 = 18.16–0.25
0
0.25
US Sou
th
US Wes
t
Singap
ore
US Nor
th E
ast
Englan
dChin
a
Canad
a
US Midw
est
Japa
nSpa
in
Overa
ll
Mea
n of
sta
ndar
dize
dla
st p
rice
e
Fig. 4 | Cross-country heterogeneity (means and 95% CIs) in economic bargaining and market behaviour in ten regions. a, The proposal offer deviations for different countries/regions. b, Unconditional acceptance rates. c, Difference in acceptance rates (ultimatum game logit regression intercepts, controlling for offers). d,e, The first (d) and last (e) prices (standardized by equilibrium price) in different countries and regions. The overall means and 95% CIs are displayed in red. US, United States.
NATurE HumAN BEHAvIour | www.nature.com/nathumbehav

Articles Nature HumaN BeHavIOur
Q ¼XK
k¼1wk mk �
PKk¼1 wkmkPKk¼1 wk
" #2
; wk ¼1s2k
where mk and sk are the sample mean and its standard error of country k, and K is the number of countries. If there is no het-erogeneity across different countries, d.f. is the expected weighted sum-of-squares. Since Q is the observed weighted sum-of-squares, I2 represents the fraction of variation attributed to between-country instead of within-country heterogeneity where 25% is viewed a low level of heterogeneity, 50% a moderate amount and 75% a high amount67 (Supplementary Results C).
We find cross-country variation only for proposal offers in the ultimatum game, with 86.6% (95% CI = [77.31%, 92.10%]) of the heterogeneity coming from between-country heterogeneity. Figure 4a shows that, compared to the average offer of 35, students in Spain make significantly lower offers of 25–30, while students in Canada and the South/West United States make slightly more generous offers of 36–37. Since all ultimatum game observations from Spain come from game theory classes, which itself induces low proposal offers, we split the data and still find students in non-game theory classes have I2 = 57.0% (95% CI = [9.54%, 79.53%]), while those in game theory classes result in I2 = 74.0% (95% CI = [49.47%, 86.63%]), so moderate to high level of the heterogeneity is between-country. In contrast, conditional acceptance rates in the ultimatum game do not vary much across countries. Figure 4b,c show that only 43.0% (95% CI = [0.00%, 72.69%]) and 30.6% (95% CI = [0.00%, 66.85%]) of the heterogeneity stems from between-country variation, with no country yielding a significantly different acceptance rate, either conditional or unconditional.
One appealing hypothesis is that difference in social norms about what offers are acceptable reflect a shared understanding between proposers and responders. If so, the offer distributions and acceptance rates should shift together (for example, in a country where it is acceptable to offer less, offers should be lower and con-ditional acceptance rates should be higher). An early study by Roth, Prasnikar, Okuno-Fujiwara and Zamir69 reports evidence consistent with this shared-norm hypothesis in four countries but note that their shared-norm ‘conjecture must stand or fall on the repeatability and robustness of these results’. The rank-order correlation coeffi-cient between average proposal offers and conditional acceptance rates is –0.527 in our ten different countries/regions, which sup-ports the hypothesis.
Consistent with unproven but intuitively appealing folk wisdom, we do not observe heterogeneity differences on the scale of ultima-tum proposals in the double auction. Our results of the double auc-tion show little between-country difference in both initial and final transaction prices (Fig. 4d,e). In other words, we find little evidence that prices in double auctions are potentially influenced by cultural differences. Neither 95% CIs on the I2 estimates for final nor ini-tial prices overlap with the corresponding CI for initial ultimatum offers (Supplementary Results C). Using thousands of classroom experiments, we are able to demonstrate the reproducibility of the same robust results in the ultimatum game, as well as the universal effect of competition in the buyer–seller double auction.
DiscussionThis is a golden age of social science. Symbiotic growth in avail-able data, and in development of methods for learning more from more and better data, have created new discoveries. Our analysis
Number of observations in double auctionn = 9,023 (market × period)
Canada(1,664)
United Kingdom(320)
< 100100−500500−1,0001,000−1,5001,500−2,0002,000−2,5002,500−3,000
West(2,218)
Midwest(881)
South(2,547)
Northeast(1,038)
China(35) Japan
(248)
SingaporeSingapore(44)(44)
Number of observations in double auctionn = 10,507 (pair × period)
Canada(1,057)
United Kingdom(571)
Spain(562)
< 100100−500500−1,0001,000−1,5001,500−2,0002,000−2,5002,500−3,000
West(2,419)
Midwest(925)
South(2,970)
Northeast(1,431)
China(137) Japan
(209)
Singapore(226)
Singapore(226)
a
b
c
d
Spain(28)
Fig. 5 | Experimental interface and the number of observations. a, The buyer and the seller screens in buyer–seller centralized trading markets. b, The proposer’s and the responder’s screen in the ultimatum game. c,d, The geographical distribution of observations in buyer–seller double auctions (n = 9,023) and ultimatum bargaining games (n = 10,507). The number of observations in each country or region is in parentheses. Screenshots reproduced with permission from MobLab. Maps were created using R (https://www.r-project.org/) on a base world map obtained from a public domain Natural Earth (https://www.naturalearthdata.com/).
NATurE HumAN BEHAvIour | www.nature.com/nathumbehav

ArticlesNature HumaN BeHavIOur
demonstrates that experimental creation of two fundamental kinds of economic activity—outcomes in many-person buyer–seller trad-ing and two-person ultimatum bargaining—are closely reproduc-ible in a large sample of classroom experiments using the same platform-standardized protocol. The value of having more data is not only to identify the scope of larger-scale reproducibility but also, and more importantly, to see what we learn that is new. Our conclu-sions describe both.
Convergence to CE in the popular buyer–seller trading designs that are most often used, in particular, are highly replicable. This convergence is conventional wisdom among experimental econo-mists (though it may surprise other social scientists). However, evi-dence from a formal comparison of many datasets has been lacking. Our data performs such large-scale comparison.
The results from simple competitive buyer–seller trading appear to be as close to a culturally universal, highly reproducible outcome as one is likely to get in social science, for young adults in ‘WEIRD’ societies70. CE convergence in small markets should be consid-ered as reproducible as the kinds of experiments that are done in a college chemistry laboratory to demonstrate universal chemistry principles, which only fail if the test tubes are dirty. However, more research is needed to establish whether similar results also hold in non-WEIRD societies, as well as across small-scale societies and across the human life cycle, to adult psychopathology and cogni-tive deficit, and even to other species. It is also important to study designs in which equilibration is not so reliable39, although these are, unfortunately, rare in our Moblab data. It is perhaps notable also that these classroom experiments are much more replicable than in other domains of social sciences that have failed to replicate reliably in some cases, in a wave of recent studies2,3,71–73.
Variability across classroom groups in ultimatum games is consis-tent with the hypothesis that bargaining is more personal, and hence has more variable outcomes, than impersonal competitive market trading. This is not too surprising as local norms of fair sharing are expected to affect bargaining outcomes but not market trades. Indeed, games like these are now commonly used to study cross-cultural dif-ferences precisely because they are thought to reflect sharing norms and perhaps influences such as marketization and religion74–76.
In ultimatum game bargaining, three large differences occur for offers of exactly half (compared to offers slightly below or above one half). At equal offers, there is a sharp jump in offer frequency, a discontinuous jump in acceptance rates and a drop in reaction times by responders. The frequency of 50% offers has often been noted77 but the effects on acceptance rate and responder speed have not.
Another important observation made with substantial con-fidence is the regularity of dynamics within a trading period in buyer–seller trading markets. There is a robust association between value and cost magnitudes and trading order, and also a negative correlation between successive price changes close to –0.50. Earlier small-scale studies have been inspiring but have shown only very tentative evidence of these patterns. We reproduce those results with much more confidence. For example, the price-change auto-correlations are seen in every country and are extremely close in magnitude; they range from –0.459 to –0.415 across countries.
These two empirical facts, about value-trading correlations and price-change autocorrelations, are consistent with a simple theory of random zero-intelligence trading. However, that theory makes a lot of other counterfactual predictions—namely, it has no special scope for learning across periods, so the simple ZI model cannot explain the between-period convergence that other theories can explain44. So, there is room for improvement by adding ‘more intel-ligence’ to that theory. Our data provide raw evidence that can be immediately used to test any such theory.
Besides the advantages that come from the volume and vari-ety of data, the velocity of data accumulation is high. MobLab and other platforms are creating data every day, so results like ours can
be easily updated every few years. Improvements in openness and data-sharing are now being cheered on by journals, funding agen-cies and everyone else. The accumulation of reproducible knowl-edge will get better and better.
methodsMobLab is an online educational platform for conducting economics experiments. Research using their data is exempt under HHS New Common Rule 45 CFR 46.104(d)(3(i)) governing ‘benign’ behavioural interventions. Instructors sign up on the MobLab website (https://www.moblab.com/) and invite students to participate in experiments from a large menu. Instructors use the platform so that their students can participate personally in simple versions of the kinds of games and markets the students are reading about in textbooks. The buyer–seller market and ultimatum game are two of the most popular experiments. The popularity of these two games gives ample observations (nearly 10,000 plays of each) and wide geodemographic variation.
The sample sizes were not chosen by us; they were determined by the number of students participating in each instructor’s class and the number of instructors who chose to use each game. Moreover, each student’s role and group are randomized by the software right before every game. To maximize sampling and permit the most powerful inference, we selected two of the games most popular with instructors and acquired all sessions run on MobLab between 12 April 2013 and 16 November 2017, which is the longest time span for which data were available.
In every market session of the double auction, student players are divided randomly into two subgroups: buyers and sellers. Each buyer (seller) gets information about the private values (costs) of the goods that they can trade before entering the market (Fig. 5a). Values and costs are induced artificially78. For example, a buyer might be told that if they buy a unit they can redeem it for, say, US$3. A seller might be told they can keep the money they sell a unit for minus a cost of US$1. In those examples, the buyer and seller should trade at a price between US$1 and US$3; if they do trade they create a ‘surplus’ of US$2. A hypothetical demand curve is created by ranking how much buyers will pay (their redemption values) from high to low. The supply curve is a list of the prices sellers would sell units for, from low to high. The players can use a slider bar to post a bid to buy one unit of the good (or post an ask to sell), which is then displayed for all players to see. Players may also trade by clicking a button to buy or sell at the currently most favourable bid or ask price. To limit mistakes, if a player chooses a potential bid or ask that brings negative profit (based on their induced value or cost), the slider bar turns red as a warning. Instructors can specify any market configuration of values and costs they like. However, the default configuration is the most common setting (used in 36% of the markets). We have a total of 9,023 observations from 5,809 market periods for the double auction (Fig. 5c), after excluding one market session due to extremely low efficiency. Including this market session obviously affects the efficiency results but not the other results.
In each session of the ultimatum game, student players are randomly assigned to be a proposer or a responder. The proposer offers a share of a commonly known fixed amount (a ‘pie size’) to the responder. The responder can accept the offer or reject it; if it is rejected both players get zero (Fig. 5b). For each session, the instructor can specify the number of periods each pair plays together and the pie size. The most common pie size is the default setting, which is 100 units (used in 82% of pairs). The modal number of plays by each pair is one and the average is 1.615 and we have a total of 10,507 observations (Fig. 5d).
We examine the consistency of our results compare to previously published laboratory experimental studies43. Their Design I consists of four buyers and four sellers who each have a demand or supply of three units and repeatedly trade in the same continuous double-auction market for 25 periods. They report an efficiency level of 95.89% (in periods 7–9) and an asymptotic Smith’s alpha of 5.9%. In our data, these numbers are estimated to be 92.08% (in period 7) and 8.6% (in period 25, their last period).
A previous study69 explored differences in ultimatum games across four countries. Supplementary Results A.2 compares offer distributions and acceptance in their four countries and in our sample. The general patterns are similar but they do not detect a discontinuous jump in acceptance rate for 50% offers (the jump is only 4.5%).
Reporting Summary. Further information on research design is available in the Nature Research Reporting Summary linked to this article.
Data availabilityDouble auction and ultimatum game data can be found on the Open Science Framework https://osf.io/9mfws/.
Code availabilityCode for all analyses can be found on the Open Science Framework https://osf.io/9mfws/.
Received: 31 May 2019; Accepted: 24 June 2020; Published: xx xx xxxx
NATurE HumAN BEHAvIour | www.nature.com/nathumbehav

Articles Nature HumaN BeHavIOur
references 1. Open Science Collaboration. Estimating the reproducibility of psychological
science. Science 349, aac4716 (2015). 2. Camerer, C. F. et al. Evaluating replicability of laboratory experiments in
economics. Science 351, 1433–1436 (2016). 3. Camerer, C. F. et al. Evaluating the replicability of social science experiments
in Nature and Science between 2010 and 2015. Nat. Hum. Behav. 2, 637–644 (2018).
4. Zwaan, R. A., Etz, A., Lucas, R. E. & Donnellan, M. B. Making replication mainstream. Behav. Brain Sci. 41, e120 (2018).
5. Sanfey, A. G., Rilling, J. K., Aronson, J. A., Nystrom, L. E. & Cohen, J. D. The neural basis of economic decision-making in the ultimatum game. Science 300, 1755–1758 (2003).
6. Henrich, J. et al. Costly punishment across human societies. Science 312, 1767–1770 (2006).
7. Jensen, K., Call, J. & Tomasello, M. Chimpanzees are rational maximizers in an ultimatum game. Science 318, 107–109 (2007).
8. Hartley, C. & Fisher, S. Do children with autism spectrum disorder share fairly and reciprocally? J. Autism Dev. Disord. 48, 2714–2726 (2018).
9. O’Callaghan, C. et al. Fair play: social norm compliance failures in behavioural variant frontotemporal dementia. Brain 139, 204–216 (2015).
10. Morewedge, C. K., Krishnamurti, T. & Ariely, D. Focused on fairness: alcohol intoxication increases the costly rejection of inequitable rewards. J. Exp. Soc. Psychol. 50, 15–20 (2014).
11. Kirk, U., Downar, J. & Montague, P. R. Interoception drives increased rational decision-making in meditators playing the ultimatum game. Front. Neurosci. 5, 49 (2011).
12. Crockett, M. J., Clark, L., Tabibnia, G., Lieberman, M. D. & Robbins, T. W. Serotonin modulates behavioral reactions to unfairness. Science 320, 1739–1739 (2008).
13. Krajbich, I., Adolphs, R., Tranel, D., Denburg, N. L. & Camerer, C. F. Economic games quantify diminished sense of guilt in patients with damage to the prefrontal cortex. J. Neurosci. 29, 2188–2192 (2009).
14. Koenigs, M. & Tranel, D. Irrational economic decision-making after ventromedial prefrontal damage: evidence from the ultimatum game. J. Neurosci. 27, 951–956 (2007).
15. Dehaene, S. The Number Sense: How the Mind Creates Mathematics (Oxford Univ. Press, 2011).
16. Dehaene, S. & Mehler, J. Cross-linguistic regularities in the frequency of number words. Cognition 43, 1–29 (1992).
17. Frydman, C. & Jin, L. Efficient coding and risky choice. Preprint at SSRN https://doi.org/10.2139/ssrn.3270773 (2019).
18. Simon, H. A. Invariants of human behavior. Annu. Rev. Psychol. 41, 1–20 (1990). 19. Smith, V. L. The two faces of Adam Smith. South. Econ. J. 65, 2–19 (1998). 20. Smith, A. An Inquiry Into the Nature and Causes of the Wealth of Nations Vol.
1 (W. Strahan and T. Cadell, 1776). 21. Sobel, J. Generous actors, selfish actions: markets with other-regarding
preferences. Int. Rev. Econ. 56, 3–16 (2009). 22. Dufwenberg, M., Heidhues, P., Kirchsteiger, G., Riedel, F. & Sobel, J.
Other-regarding preferences in general equilibrium. Rev. Econ. Stud. 78, 613–639 (2011).
23. Chamberlin, E. H. An experimental imperfect market. J. Polit. Econ. 56, 95–108 (1948).
24. Smith, V. L. An experimental study of competitive market behavior. J. Polit. Econ. 70, 111–137 (1962).
25. Plott, C. R. & Smith, V. L. An experimental examination of two exchange institutions. Rev. Econ. Stud. 45, 133–153 (1978).
26. Smith, V. L. & Walker, J. M. Monetary rewards and decision cost in experimental economics. Econ. Inq. 31, 245–261 (1993).
27. Hertwig, R. & Ortmann, A. Experimental practices in economics: a methodo-logical challenge for psychologists? Behav. Brain Sci. 24, 383–403 (2001).
28. Camerer, C. F. & Hogarth, R. M. The effects of financial incentives in experiments: a review and capital–labor–production framework. J. Risk. Uncertain. 19, 7–42 (1999).
29. Tompkinson, P. & Bethwaite, J. The ultimatum game: raising the stakes. J. Econ. Behav. Organ. 27, 439–451 (1995).
30. Güth, W., Schmittberger, R. & Schwarze, B. An experimental analysis of ultimatum bargaining. J. Econ. Behav. Organ. 3, 367–388 (1982).
31. Tisserand, J.-C. et al. Ultimatum game: a meta-analysis of the past three decades of experimental research. In Proceedings of International Academic Conferences, 0802032 (International Institute of Social and Economic Sciences, 2014).
32. Holt, C.A. in Handbook of Experimental Economics Vol. 1 (eds Kagel, J. & Roth, A. E.) 349–443 (Princeton Univ. Press, 1995).
33. Davis, D.D. & Holt, C.A. Experimental Economics (Princeton Univ. Press, 1993). 34. Kagel, J. & Roth, A.E. (eds) Handbook of Experimental Economics Vol. 1
(Princeton Univ. Press, 1995). 35. Kagel, J., Roth, A.E. (eds) Handbook of Experimental Economics Vol. 2
(Princeton Univ. Press, 2015).
36. Plott, C.R. & Smith, V.L. (eds) Handbook of Experimental Economics Results Vol. 1 (North-Holland, 2008).
37. Kagel, J.H. in Handbook of Experimental Economics Vol. 1 (eds Kagel, J. & Roth, A. E.) 501–585 (Princeton Univ. Press, 1995).
38. Cason, T.N. & Friedman, D. in The Double Auction Market: Institutions, Theories, and Evidence (eds Friedman, D. & Rust, J.) 253–283 (Addison-Wesley, 1993).
39. Smith, V. L. Economics in the laboratory. J. Econ. Perspect. 8, 113–131 (1994). 40. Gjerstad, S. The competitive market paradox. J. Econ. Dynam. Control 31,
1753–1780 (2007). 41. Cason, T. N. & Friedman, D. Price formation in double auction markets.
J. Econ. Dynam. Control 20, 1307–1337 (1996). 42. Noussair, C. N., Plott, C. R. & Riezman, R. G. An experimental investigation
of the patterns of international trade. Am. Econ. Rev. 85, 462–491 (1995). 43. Ketcham, J., Smith, V. L. & Williams, A. W. A comparison of posted-offer and
double-auction pricing institutions. Rev. Econ. Stud. 51, 595–614 (1984). 44. Easley, D. & Ledyard, J.O. in The Double Auction Market: Institutions,
Theories, and Evidence (eds Friedman, D. & Rust, J.) 63–97 (Addison- Wesley, 1993).
45. Wilson, R.B. in Arrow and the Ascent of Modern Economic Theory (ed. Feiwel, G. R.) 375–414 (Springer, 1987).
46. Friedman, D. A simple testable model of double auction markets. J. Econ. Behav. Organ. 15, 47–70 (1991).
47. Gode, D. K. & Sunder, S. Allocative efficiency of markets with zero-intelligence traders: market as a partial substitute for individual rationality. J. Polit. Econ. 101, 119–137 (1993).
48. Cliff, D. & Bruten, J. Less than human: simple adaptive trading agents for CDA markets. IFAC Proc. Vol. 31, 117–122 (1998).
49. Camerer, C.F. Behavioral Game Theory: Experiments in Strategic Interaction (Princeton Univ. Press, 2003).
50. Oosterbeek, H., Sloof, R. & van de Kuilen, G. Cultural differences in ultimatum game experiments: evidence from a meta-analysis. Exp. Econ. 7, 171–188 (2004).
51. Cooper, D. J. & Dutcher, E. G. The dynamics of responder behavior in ultimatum games: a meta-study. Exp. Econ. 14, 519–546 (2011).
52. Fehr, E. & Schmidt, K. M. A theory of fairness, competition, and cooperation. Q. J. Econ. 114, 817–868 (1999).
53. Bolton, G. E. & Ockenfels, A. Erc: a theory of equity, reciprocity, and competition. Am. Econ. Rev. 90, 166–193 (2000).
54. Blount, S. When social outcomes aren’t fair: the effect of causal attributions on preferences. Organ. Behav. Hum. Decis. Process. 63, 131–144 (1995).
55. Rabin, M. Incorporating fairness into game theory and economics. Am. Econ. Rev. 83, 1281–1302 (1993).
56. Falk, A. & Fischbacher, U. A theory of reciprocity. Games Econ. Behav. 54, 293–315 (2006).
57. Forsythe, R., Horowitz, J. L., Savin, N. E. & Sefton, M. Fairness in simple bargaining experiments. Games Econ. Behav. 6, 347–369 (1994).
58. Levine, D. K. Modeling altruism and spitefulness in experiments. Rev. Econ. Dynam. 1, 593–622 (1998).
59. Backus, M., Blake, T., Larsen, B. & Tadelis, S. Sequential bargaining in the field: evidence from millions of online bargaining interactions.Q. J. Econ. 135, 1319–1361 (2020).
60. Chabris, C. F., Morris, C. L., Taubinsky, D., Laibson, D. & Schuldt, J. P. The allocation of time in decision-making. J. Eur. Econ. Assoc. 7, 628–637 (2009).
61. Konovalov, A. & Krajbich, I. Revealed strength of preference: inference from response times. Judgm. Decis. Mak. 14, 381–394 (2019).
62. Krajbich, I., Oud, B. & Fehr, E. Benefits of neuroeconomic modeling: new policy interventions and predictors of preference. Am. Econ. Rev. 104, 501–506 (2014).
63. Andreoni, J. & Bernheim, B. D. Social image and the 50–50 norm: a theoretical and experimental analysis of audience effects. Econometrica 77, 1607–1636 (2009).
64. Bernheim, B. D. & Severinov, S. Bequests as signals: an explanation for the equal division puzzle. J. Polit. Econ. 111, 733–764 (2003).
65. Bauman, Y. & Rose, E. Selection or indoctrination: why do economics students donate less than the rest? J. Econ. Behav. Organ. 79, 318–327 (2011).
66. DerSimonian, R. & Laird, N. Meta-analysis in clinical trials. Control. Clin. Trials 7, 177–188 (1986).
67. Higgins, J. P. T., Thompson, S. G., Deeks, J. J. & Altman, D. G. Measuring inconsistency in meta-analyses. BMJ 327, 557 (2003).
68. Higgins, J. P. T. & Thompson, S. G. Quantifying heterogeneity in a meta-analysis. Stat. Med. 21, 1539–1558 (2002).
69. Roth, A. E., Prasnikar, V., Okuno-Fujiwara, M. & Zamir, S. Bargaining and market behavior in Jerusalem, Ljubljana, Pittsburgh, and Tokyo: an experimental study. Am. Econ. Rev. 81, 1068–1095 (1991).
70. Henrich, J., Heine, S. J. & Norenzayan, A. The weirdest people in the world? Behav. Brain Sci. 33, 61–83 (2010).
71. Ebersole, C. R. et al. Many labs 3: evaluating participant pool quality across the academic semester via replication. J. Exp. Soc. Psychol. 67, 68–82 (2016).
NATurE HumAN BEHAvIour | www.nature.com/nathumbehav
ArticlesNature HumaN BeHavIOur
72. Klein, R. A. et al. Investigating variation in replicability: a many labs replication project. Soc. Psychol. 45, 142–152 (2014).
73. Klein, R. A. et al. Many labs 2: investigating variation in replicability across sample and setting. Adv. Methods Pract. Psychol. Sci. 1, 443–490 (2018).
74. Henrich, J. Does culture matter in economic behavior? Ultimatum game bargaining among the Machiguenga of the Peruvian Amazon. Am. Econ. Rev. 90, 973–979 (2000).
75. Henrich, J. et al. Markets, religion, community size, and the evolution of fairness and punishment. Science 327, 1480–1484 (2010).
76. Henrich, J. et al. Economic man in cross-cultural perspective: behavioral experiments in 15 small-scale societies. Behav. Brain Sci. 28, 795–815 (2005).
77. Camerer, C. F. & Thaler, R. H. Anomalies: ultimatums, dictators and manners. J. Econ. Perspect. 9, 209–219 (1995).
78. Smith, V. L. Experimental economics: induced value theory. Am. Econ. Rev. 66, 274–279 (1976).
AcknowledgementsT.I. was supported by Deutsche Forschungsgemeinschaft through CRC TRR 190. J.T.W. was supported by CRETA, National Taiwan University (NTU-107L900203 and MOST 107-3017-F-002-004) and the Ministry of Science and Technology of Taiwan (MOST 106-2628-H-002-001-MY4). C.F.C was supported by the Behavioral and Neuroeconomics Discovery Fund at Caltech (through the MacArthur Foundation Fellowship). The funders had no role in study design, data collection and analysis, decision to publish or preparation of the manuscript. We thank T. Cason, J. Duffy, D. Friedman, M. Hsu, M. O. Jackson, J. O. Ledyard, C. R. Plott and audiences at Bay Area Behavioral and Experimental Economics Workshop, the ESA North American Conference, Barcelona GSE Summer Forum (External Validity, Generalizability and Replicability of Economic Experiments), Chapman University and Caltech (Applied Microeconomics Lunch) for helpful feedback. We also thank the MobLab engineering team for technical assistance.
Author contributionsT.I., S.W.W. and C.F.C designed the research. P.L., A.L.B., T.I., J.T.W. and S.W.W. analysed the data. P.L., A.L.B., T.I., J.T.W., S.W.W. and C.F.C wrote the paper. All authors discussed the results and implications and commented on the manuscript.
Competing interestsThe data used were shared from MobLab, a for-profit startup educational platform. The data availability is an in-kind contribution to all authors (although note that the data are available for purposes of analysis reproduction and extended analyses). P.L. was employed by MobLab from December 2017 to December 2018 and compensated more than US$10,000 during the last 3 years. A.L.B. was a visiting senior economist at MobLab from 22 January 2018 to 20 July 2018 and compensated more than US$10,000. T.I. has no competing interests. J.T.W. was a visiting senior economist at MobLab from 25 June 2018 to 7 September 2018 and is the John O. Ledyard Endowed Chair Professor of Experimental Economics at National Taiwan University, funded by contributions of more than US$10,000 to the university endowment fund from MobLab. S.W.W. holds an ownership stake in MobLab as a cofounder. She was compensated more than US$10,000 in 2018–2019. C.F.C. is a Scientific Advisor to MobLab, a position with no compensation but with a small ownership stake instead.
Additional informationSupplementary information is available for this paper at https://doi.org/10.1038/s41562-020-0916-8.
Correspondence and requests for materials should be addressed to C.F.C.
Peer review information Primary Handling Editor: Aisha Bradshaw.
Reprints and permissions information is available at www.nature.com/reprints.
Publisher’s note Springer Nature remains neutral with regard to jurisdictional claims in published maps and institutional affiliations.
© The Author(s), under exclusive licence to Springer Nature Limited 2020
NATurE HumAN BEHAvIour | www.nature.com/nathumbehav