evidence of correlation between acoustic and …...evidence of correlation between acoustic and...
TRANSCRIPT

EVIDENCE OF CORRELATION BETWEEN ACOUSTIC AND VISUAL FEATURES OF SPEECH
J.P.Barker and F.Berthommier
Institut de la Communication ParEe, UPRESA CNRS No 5009, INPG, 46 Av. Fklix-Viallet F38041 Grenoble Cedex 1, FRANCE
Tel no: +33-(0)4.76.57.47.33 Fax: +33-(0)4.76.57.47.10 [email protected], [email protected]
ABSTRACT
This paper examines the degree of correlation between lip and jaw configuration and speech acoustics. The lip and jaw positions are characterised by a system of measure- ments taken from video images of the speaker’s face and profile, and the acoustics are represented using line spectral pair parameters and a measure of RMS energy. A correl- ation is found between the measured acoustic parameters and a linear estimate of the acoustics recovered from the visual data. This correlation exists despite the simplicity of the visual representation and is in rough agreement with correlations measured in earlier work by Yehia et al. using different techniques. However, analysis of the estimation errors suggests that the visual information, as paramet- erised in our experiment, offers only a weak constraint on the acoustics. Results are discussed from the perspective of models of early audio-visual integration.
1. INTRODUCTION
A recent study by Yehia, Rubin and Vatikiotis- Bateson [8] h as examined linear associations between vocal-tract configuration, facial behaviour and speech acoustics. Their results indicate that around 80% of the variance observed in the vocal-tract configuration can be estimated from the 3D position of a set of fixed points on the surface of the face. Furthermore, simple linear estimates derived from the face, are sufficient to determine between 72 and 85% of the variance ob- served in an RMS and line-spectral pair representation of the acoustics. These surprising results seem to sug- gest that knowledge on the formantic structure of the speech may be heavily constrained by visual informa- tion. The existence of such constraints would offer a mechanism for models of primitive audio-visual integ- ration as proposed in [l].
cognition. In particular, we are concerned with the question of whether linear estimates of the spectrum are sufficiently reliable to aid the segregation of a speech source from a competing noise source.
The current study closely follows that of Yehia et al. but differs in a number of important details. First, whereas the earlier study was based on the analysis of a single pair of sentences, the present work examines a corpus of isolated nonsense words having a VCVCV vowel-consonant structure. The systematic structure of the corpus allows the audio-visual correlations to be separately analysed for both consonants and vowels. Second, there is an important difference in the visual parameterisation. Yehia et al. employ OPTOTRAK parameters which measure the 3D coordinates of 12 markers fixed to the lower part of the speaker’s face. In contrast the present study employs 15 parameters which are extracted from video images through the application of ‘Chroma-Key’ processing. These para- meters are exclusively concerned with lip and jaw con- figuration.
The present study also extends the analysis of Yehia et al. by directly examining the estimation errors. The audio-visual associations were previously reported solely in terms of the correlation between the measured acoustics and the linear estimate recovered from the visual parameters. Although significant, these correl- ations say little about the size and distribution of the errors. Knowledge of the errors is important because it is the accuracy of the estimates that determines their practical value for robust audio-visual speech recog- nition. Also, the reliability of the estimates has dir- ect implications for models of audio-visual integration based on simple linear audio-visual associations.
This paper examines the association between facial be- 2. EXPERIMENTATION haviour and spectral envelope shape, focusing on the implications for audio-visual speech perception and re- An existing audio-visual speech corpus was employed
This work was supported by European Commission Network [a]. This corpus consists of VI CV&‘V~ sequences TMR ERBFMRXCT970150 (SPHEAR) uttered by a native French speaker. VI and Vz are
page 199 ICPhS99 San Francisco
taken from a set of 3 French vowels, [a, i, U] and C is one of the following 6 consonants, [b, j, I, r, ~1, x]. Each of the 54 possible nonsense words (3x3~6) of this form are spoken 10 times each.
2.1. Lip and Jaw Configuration
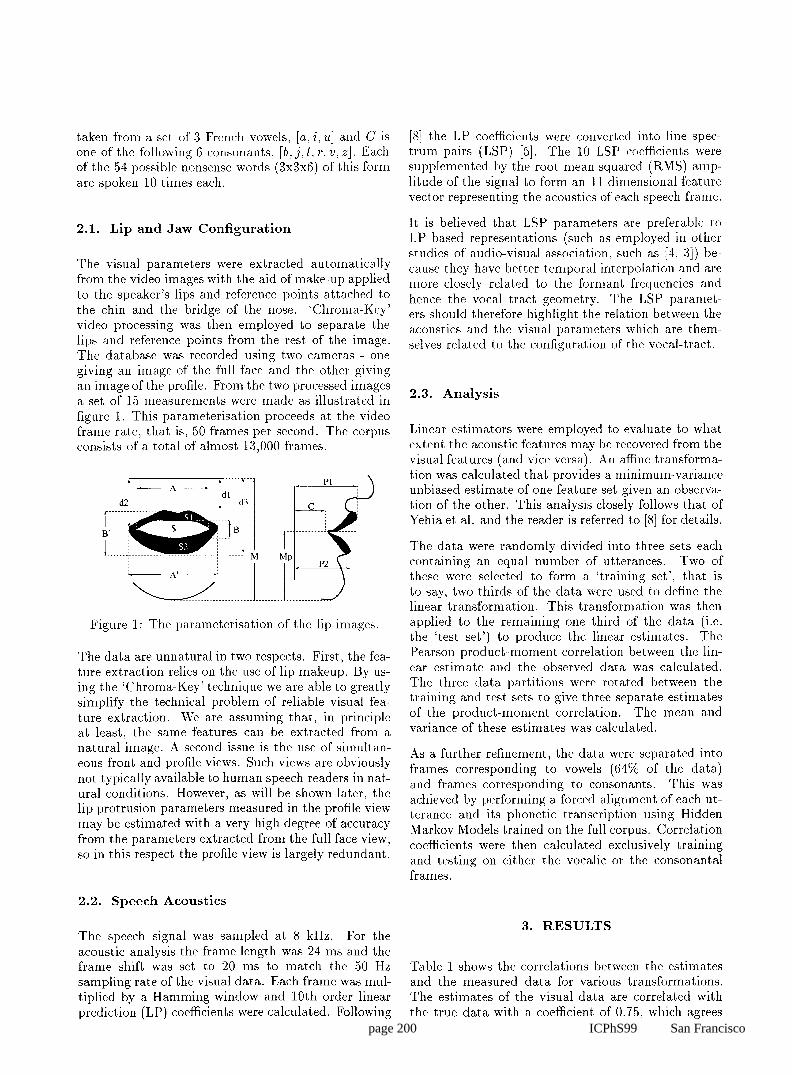
The visual parameters were extracted automatically from the video images with the aid of make-up applied to the speaker’s lips and reference points attached to the chin and the bridge of the nose. ‘Chroma-Key’ video processing was then employed to separate the lips and reference points from the rest of the image. The database was recorded using two cameras - one giving an image of the full face and the other giving an image of the profile. From the two processed images a set of 15 measurements were made as illustrated in figure 1. This parameterisation proceeds at the video frame rate, that is, 50 frames per second. The corpus consists of a total of almost 13,000 frames.
Pl I-
I
, --A’- I I I \ u _____ - ------ 1------___ I ____________ J Figure 1: The parameterisation of the lip images.
The data are unnatural in two respects. First, the fea- ture extraction relies on the use of lip makeup. By us- ing the ‘Chroma-Key’ technique we are able to greatly simplify the technical problem of reliable visual fea- ture extraction. We are assuming that, in principle at least, the same features can be extracted from a natural image. A second issue is the use of simultan- eous front and profile views. Such views are obviously not typically available to human speech readers in nat- ural conditions. However, as will be shown later, the lip protrusion parameters measured in the profile view may be estimated with a very high degree of accuracy from the parameters extracted from the full face view, so in this respect the profile view is largely redundant.
2.2. Speech Acoustics
The speech signal was sampled at 8 kHz. For the acoustic analysis the frame length was 24 ms and the frame shift was set to 20 ms to match the 50 Hz sampling rate of the visual data. Each frame was mul- tiplied by a Hamming window and 10th order linear prediction (LP) coefficients were calculated. Following
[8] the LP coefficients were converted into line spec- trum pairs (LSP) [5]. The 10 LSP coefficients were supplemented by the root mean squared (RMS) amp- litude of the signal to form an 11 dimensional feature vector representing the acoustics of each speech frame.
It is believed that LSP parameters are preferable to LP based representations (such as employed in other studies of audio-visual association, such as [4, 31) be- cause they have better temporal interpolation and are more closely related to the formant frequencies and hence the vocal tract geometry. The LSP paramet- ers should therefore highlight the relation between the acoustics and the visual parameters which are them- selves related to the configuration of the vocal-tract.
2.3. Analysis
Linear estimators were employed to evaluate to what extent the acoustic features may be recovered from the visual features (and vice versa). An affine transforma- tion was calculated that provides a minimum-variance unbiased estimate of one feature set given an observa- tion of the other. This analysis closely follows that of Yehia et al. and the reader is referred to [8] for details.
The data were randomly divided into three sets each containing an equal number of utterances. Two of these were selected to form a ‘training set’, that is to say, two thirds of the data were used to define the linear transformation. This transformation was then applied to the remaining one third of the data (i.e. the ‘test set’) to produce the linear estimates. The Pearson product-moment correlation between the lin- ear estimate and the observed data was calculated. The three data partitions were rotated between the training and test sets to give three separate estimates of the product-moment correlation. The mean and variance of these estimates was calculated.
As a further refinement, the data were separated into frames corresponding to vowels (64% of the data) and frames corresponding to consonants. This was achieved by performing a forced alignment of each ut- terance and its phonetic transcription using Hidden Markov Models trained on the full corpus. Correlation coefficients were then calculated exclusively training and testing on either the vocalic or the consonantal frames.
3. RESULTS
Table 1 shows the correlations between the estimates and the measured data for various transformations. The estimates of the visual data are correlated with the true data with a coefficient of 0.75, which agrees
page 200 ICPhS99 San Francisco

well with the figure of 0.72 reported by Yehia et al. using a different visual representation. Note also that the visual parameters can be more reliably reconstruc- ted during vowels than during consonants. As expec- ted, stronger correlations are achieved using the LSP parameterisation than the LP parameterisation.
Profile/Front 0.97 0.97 0.97 Front/Profile 0.88 0.90 0.85
Table 1: Estimation performance. Figures show the mean correlation between the estimates and the meas- ured data for various transformations. e.g. ‘LSP/Face’ is the correlation between the measured and estimated LSP data where the LSP data has been estimated from the measured lip motion data. (Standard deviations for all these figures are around 0.01).
When attempting the inverse mapping, that is, the re- construction of the acoustics from the visual lip data, the correlation is only 0.55. Correlations are stronger between the measured and reconstructed LSP para- meters than for the LP parameters, and again correl- ation is highest for vocalic intervals. The correlations are somewhat weaker than those measured by Yehia et al. of around 0.73 for the LSP parameters and 0.83 for the RMS energy. Possible reasons for this significant difference will be discussed later.
The last two rows of Table 1 illustrate the redundancy in the visual parameterisation. The visual parameters have been split into those that can be measured in the x-y plane of the front view and those measured in the z direction of the profile view. The front view paramet- ers have been used to estimate the profile parameters and vice versa. The correlation between measured and recovered profile parameters (C, Pl and P2) is 0.97. Remarkably, if the profile is estimated from the front view A and B parameters alone (see figure 1) the cor- relation remains high, 0.82. The ability to estimate lip protrusion accurately from a full face camera has po- tential practical application for automatic audio-visual speech recognition systems. However, it is uncertain to what extent this result will generalise across speak- ers and will extend to utterances of greater phonetic diversity.
Table 2 summarises the estimation errors. The figures show the variance of the estimation error expressed as a fraction of the variance of the data being estim- ated. Although the estimates and the measured data are fairly well correlated, the variance of the LP es- timation errors remains at 73% of the variance of the
Variance of estimation errors Estimate/Measure All Data Vowels Consonants
LSP/Face 0.69 0.66 0.70 LP/Face 0.73 0.70 0.75
RMS/Face 0.66 0.60 0.76
Table 2: The variance of the residuals expressed as a fraction of the variance of the signal being estimated. (Standard deviations are around 0.02).
LP data. Hence, the estimated spectra only weakly constrain the true spectra. Examination of the er- ror distributions for the LP parameters reveals them to be multimodal, i.e. clearly non-Gaussian. This is evidence that the linear estimates are essentially an in- adequate model of the true mapping. To the degree to which the vocal tract can be controlled independently of the lips and jaw several acoustic modes may exist with the same identical facial configurations. Accept- ing this, the distribution of LP values given the facial configuration will be multimodal and cannot therefore be meaningfully represented by a single valued estim- ate.
Table 3: Left: 95% confidence interval (CI) for the true RMS energy (arbitrary units) given various estim- ates of RMS energy (using the vocalic regions only). The final row shows the 95% CI for the unconditioned data. Right: The same analysis for the frequency of the 2nd LSP parameter.
As a rough assessment of the practical value of the lin- ear estimates, Table 3 gives an indication of the prob- abilistic constraint that the linear mapping places on the acoustics. The figures show the spread of the true values given a value for the linear estimate (or more precisely, given a value within a small window centred at the value shown in the table). The interval is that within which the true value will lie 95% of the time. The final row in each table shows this 95% confidence interval as measured over all the data i.e. the interval that can be estimated prior to forming the acoustic estimate. Table 3 (right) shows results of this analysis for the 2nd LSP parameter. Of the 10 estimated LSP parameters the 2nd was found to be the most highly correlated with the true value (correlation coefficient of 0.70). Nevertheless, it can be seen that the interval of uncertainty is not greatly reduced by conditioning on the acoustic estimate (compare the first three rows with the final row). The left hand side of the table shows results of the same analysis applied to the RMS energv estimates.
c
page 201 ICPhS99 San Francisco

4. DISCUSSION AND CONCLUSIONS
As noted earlier there are significant differences in the results of the present study and the earlier study of Yehia et al. Although both show equal recovery of the the visual representations from the acoustics, in the present work the acoustics are not as well estim- ated from the visual data. How can this difference be accounted for?
Yehia et al. represented the facial behaviour through the trajectories in 3D space of 12 markers attached to the face. A dimensional analysis of this data showed that 8 eigenvectors were required to account for 99% of the total variance of the data. In contrast, a similar analysis of the 15 dimensional visual feature repres- entation employed in the present study revealed that 99% of the variance could be accounted for using just 3 eigenvect ors. One reason for the lower dimensional- ity of our data is that the representation concentrates solely on capturing the behaviour of the lips and jaw while ignoring the rest of the face. However, there are doubtless subtle acoustic cues available in facial details which exist independently of lip and jaw con- figuration. For example, Vatikiotis-Bateson and Yehia report a strong correlation between small movements of the cheeks and the horizontal position of the tongue [6]. The ‘outer-face’ may also contribute to the estim- ation of RMS amplitude [7].
It is tempting to interpret the linear relationship uncovered between the facial configuration and the acoustics in terms of a model of production, i.e. to say that the degree to which the correlation exists is the degree to which the lip movements are responsible for the acoustic patterns. Such a relationship could be termed a ‘functional coupling’ [8]. Such logic is, however, misguided. A large part of the correlation may occur because all parts of the speech apparatus are being driven in a coordinated manner to achieve a common goal. Consider as an analogy someone play- ing the piano - the movements of either hand may be highly correlated but the movements of one are not caused by the movements of the other. It is impossible to tell from the present data to what extent the correl- ation is due to the control systems and to what extent it is due to the physical linkage between the face and the rest of the speech apparatus.
It is possible that through the use of a mapping from a visual representation to an estimate of the speech acoustics, the visual and auditory processing could be integrated at a very early stage. This is the tenet of models of audio-visual scene analysis (such as that suggested by Barker, Berthommier and Schwartz), in which visual information is employed alongside prim- itive acoustic cues to aid sound source segregation [l]. However, the success of such a scheme would depend
heavily on the reliability of the visual-acoustic map- ping. As shown here, for the case of a simple linear mapping, despite the correlation that exists between the observed and estimated acoustics, the estimation errors are such that the acoustics are only weakly con- strained. Whether or not such weak constraints can be of any practical value is an open question. Future work will address this question through the construc- tion of audio-visual recognition models making direct use of the findings reported here.
As a final point, note that the acoustic estimates have been recovered from the static facial configuration and make no use of dynamic visual features. Dynamic fea- tures have proved to be extremely significant in auto- matic audio-visual speech recognition studies, it might therefore be expected their use could lead to improved linear estimates.
Acknowledgemen
l to Gordon Ramsay for his ad, The authors are gratefu vice concerning LSP p; srameterisation and his helpful
analysis. comments on the data
5. REFERENCES
[l] J.P. Barker, F. Berthommier, and J.L. Schwartz. Is primitive av coherence an aid to segment the scene? In Proc. AVSP '98, Sydney, Australia, November 1998.
[2] C. Benoit, T. Lallouache, T Mohamadi, and C. Abry. A set of French visemes for visual speech synthesis. In G. Bailly and C. Benoit, editors, Talking machines: Theories, models and designs, pages 485-504. Elsevier, Amsterdam, 1992.
[3] L. Girin, G. Feng, and J.-L. Schwartz. Noisy speech enhancement by fusion of auditory and visual informa- tion: a study of vowel transitions. In Proc. Eurospeech '97, pages 2555-2558, Rhodes, Greece, September 1997.
[4] K.W. Grant and P.F. Seitz. The use of visible speech cues (speechreading) for directing auditory attention. In 135th Meeting of the Acoustical Society of America, Seattle, WA, June 1998.
[5] N. Sugamura and F. Itakura. Speech analysis and syn- thesis methods developed at ECL in NTT - from LPC 4 to LSP. Speech Communication, 5:199-215, 1986.
[6] E. Vatikiotis-Bateson, K.G. Munhall, Y. Kasahara, F. Garcia, and H. Yehia. Characterising audiovisual information during speech. In Proc. ICSLP ‘96, Phil- adelphia, PA, October 1996.
[7] E. Vatikiotis-Bateson and H. Yehia. Physiological mod- eling of facial motion during speech. volume 65, 1996.
[8] H. Yehia, P. R u b in, and E. Vatikiotis-Bateson. Quant- itative association of vocal-tract and facial behavior. Speech Communication, 26( 1):23-43, 1998.
page 202 ICPhS99 San Francisco