evidence for isolated evolution of deep-sea ciliate - biomed central
TRANSCRIPT

Stock et al. BMC Microbiology 2013, 13:150http://www.biomedcentral.com/1471-2180/13/150
RESEARCH ARTICLE Open Access
Evidence for isolated evolution of deep-sea ciliatecommunities through geological separation andenvironmental selectionAlexandra Stock1, Virginia Edgcomb2, William Orsi2, Sabine Filker1, Hans-Werner Breiner1, Michail M Yakimov3
and Thorsten Stoeck1*
Abstract
Background: Deep hypersaline anoxic basins (DHABs) are isolated habitats at the bottom of the easternMediterranean Sea, which originate from the ancient dissolution of Messinian evaporites. The different basins haverecruited their original biota from the same source, but their geological evolution eventually constituted sharpenvironmental barriers, restricting genetic exchange between the individual basins. Therefore, DHABs are uniquemodel systems to assess the effect of geological events and environmental conditions on the evolution anddiversification of protistan plankton. Here, we examine evidence for isolated evolution of unicellular eukaryoteprotistan plankton communities driven by geological separation and environmental selection. We specificallyfocused on ciliated protists as a major component of protistan DHAB plankton by pyrosequencing thehypervariable V4 fragment of the small subunit ribosomal RNA. Geospatial distributions and responses of marineciliates to differential hydrochemistries suggest strong physical and chemical barriers to dispersal that influence theevolution of this plankton group.
Results: Ciliate communities in the brines of four investigated DHABs are distinctively different from ciliatecommunities in the interfaces (haloclines) immediately above the brines. While the interface ciliate communitiesfrom different sites are relatively similar to each other, the brine ciliate communities are significantly differentbetween sites. We found no distance-decay relationship, and canonical correspondence analyses identified oxygenand sodium as most important hydrochemical parameters explaining the partitioning of diversity between interfaceand brine ciliate communities. However, none of the analyzed hydrochemical parameters explained the significantdifferences between brine ciliate communities in different basins.
Conclusions: Our data indicate a frequent genetic exchange in the deep-sea water above the brines. The “isolatedisland character” of the different brines, that resulted from geological events and contemporary environmentalconditions, create selective pressures driving evolutionary processes, and with time, lead to speciation and shapeprotistan community composition. We conclude that community assembly in DHABs is a mixture of isolatedevolution (as evidenced by small changes in V4 primary structure in some taxa) and species sorting (as indicated bythe regional absence/presence of individual taxon groups on high levels in taxonomic hierarchy).
Keywords: Ciliates, Hypersaline, Deep-sea anoxic basins, DHABs, Brine, Species sorting, Environmental filtering,Niche separation
* Correspondence: [email protected] of Kaiserslautern, School of Biology, Erwin-Schroedinger-Str. 14,D-67663 Kaiserslautern, GermanyFull list of author information is available at the end of the article
© 2013 Stock et al.; licensee BioMed Central Ltd. This is an Open Access article distributed under the terms of the CreativeCommons Attribution License (http://creativecommons.org/licenses/by/2.0), which permits unrestricted use, distribution, andreproduction in any medium, provided the original work is properly cited.
Stock et al. BMC Microbiology 2013, 13:150 Page 2 of 15http://www.biomedcentral.com/1471-2180/13/150
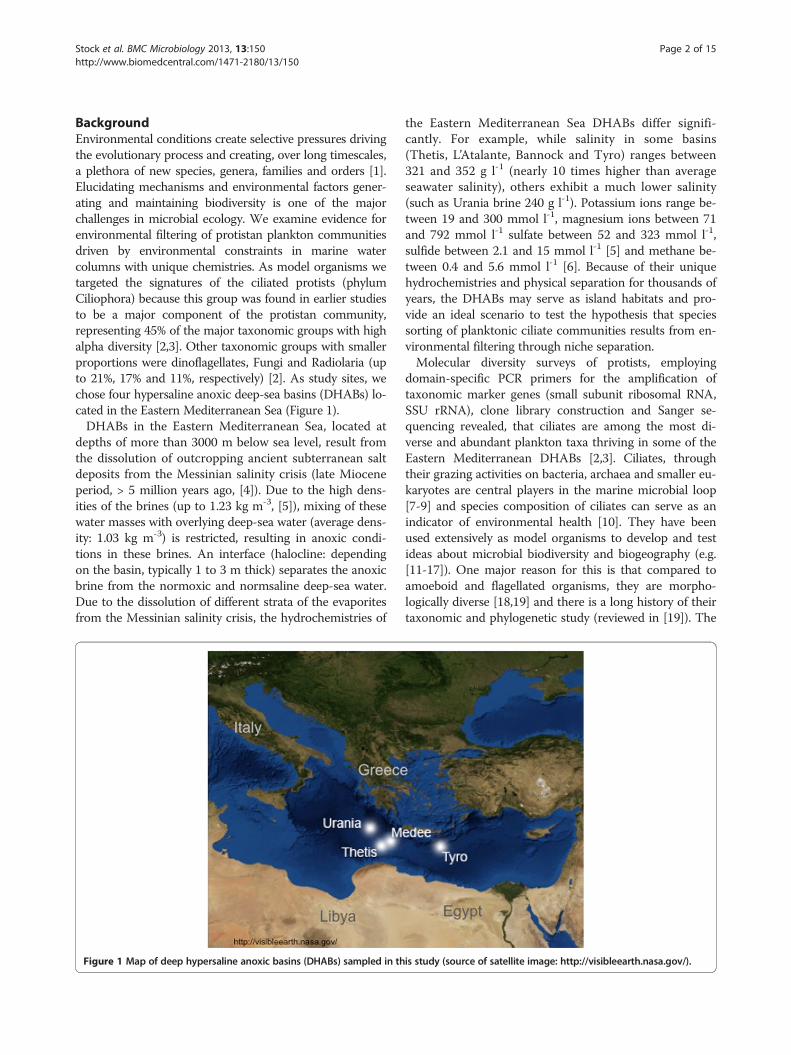
BackgroundEnvironmental conditions create selective pressures drivingthe evolutionary process and creating, over long timescales,a plethora of new species, genera, families and orders [1].Elucidating mechanisms and environmental factors gener-ating and maintaining biodiversity is one of the majorchallenges in microbial ecology. We examine evidence forenvironmental filtering of protistan plankton communitiesdriven by environmental constraints in marine watercolumns with unique chemistries. As model organisms wetargeted the signatures of the ciliated protists (phylumCiliophora) because this group was found in earlier studiesto be a major component of the protistan community,representing 45% of the major taxonomic groups with highalpha diversity [2,3]. Other taxonomic groups with smallerproportions were dinoflagellates, Fungi and Radiolaria (upto 21%, 17% and 11%, respectively) [2]. As study sites, wechose four hypersaline anoxic deep-sea basins (DHABs) lo-cated in the Eastern Mediterranean Sea (Figure 1).DHABs in the Eastern Mediterranean Sea, located at
depths of more than 3000 m below sea level, result fromthe dissolution of outcropping ancient subterranean saltdeposits from the Messinian salinity crisis (late Mioceneperiod, > 5 million years ago, [4]). Due to the high dens-ities of the brines (up to 1.23 kg m-3, [5]), mixing of thesewater masses with overlying deep-sea water (average dens-ity: 1.03 kg m-3) is restricted, resulting in anoxic condi-tions in these brines. An interface (halocline: dependingon the basin, typically 1 to 3 m thick) separates the anoxicbrine from the normoxic and normsaline deep-sea water.Due to the dissolution of different strata of the evaporitesfrom the Messinian salinity crisis, the hydrochemistries of
Figure 1 Map of deep hypersaline anoxic basins (DHABs) sampled in th
the Eastern Mediterranean Sea DHABs differ signifi-cantly. For example, while salinity in some basins(Thetis, L’Atalante, Bannock and Tyro) ranges between321 and 352 g l-1 (nearly 10 times higher than averageseawater salinity), others exhibit a much lower salinity(such as Urania brine 240 g l-1). Potassium ions range be-tween 19 and 300 mmol l-1, magnesium ions between 71and 792 mmol l-1 sulfate between 52 and 323 mmol l-1,sulfide between 2.1 and 15 mmol l-1 [5] and methane be-tween 0.4 and 5.6 mmol l-1 [6]. Because of their uniquehydrochemistries and physical separation for thousands ofyears, the DHABs may serve as island habitats and pro-vide an ideal scenario to test the hypothesis that speciessorting of planktonic ciliate communities results from en-vironmental filtering through niche separation.Molecular diversity surveys of protists, employing
domain-specific PCR primers for the amplification oftaxonomic marker genes (small subunit ribosomal RNA,SSU rRNA), clone library construction and Sanger se-quencing revealed, that ciliates are among the most di-verse and abundant plankton taxa thriving in some of theEastern Mediterranean DHABs [2,3]. Ciliates, throughtheir grazing activities on bacteria, archaea and smaller eu-karyotes are central players in the marine microbial loop[7-9] and species composition of ciliates can serve as anindicator of environmental health [10]. They have beenused extensively as model organisms to develop and testideas about microbial biodiversity and biogeography (e.g.[11-17]). One major reason for this is that compared toamoeboid and flagellated organisms, they are morpho-logically diverse [18,19] and there is a long history of theirtaxonomic and phylogenetic study (reviewed in [19]). The
is study (source of satellite image: http://visibleearth.nasa.gov/).

Table 1 Summary of ciliate V4 SSU rRNA amplicon datafor each sample including the ciliate cluster numbers at alevel of 95% cutoff
Number of V4-amplicons Number of ciliateclusters
Sample Before qualitycontrol
After qualitycontrol
Cutoff level 95%
Tyros IF 36093 35072 245
Tyros B 54885 50713 376
Thetis IF 60173 57937 205
Thetis B 33634 32663 441
Medee IF 42505 40911 152
Medee B 36297 34982 53
Urania IF 80650 79389 237
Urania B 47927 46345 551
Stock et al. BMC Microbiology 2013, 13:150 Page 3 of 15http://www.biomedcentral.com/1471-2180/13/150
extensive foundation of knowledge on ciliate species andtheir inferred relationships facilitates data evaluation andhypothesis testing for studies that aim to explore ciliatebiodiversity, evolution and biogeography.None of the previous taxon samplings of SSU rRNA
signatures in initial DHAB protistan diversity surveysreached saturation [2,3], as is generally the case incloning and Sanger sequencing-based strategies [20-24].Therefore, it was not possible to observe many patternsof diversity in previous studies of DHABs, nor was itpossible to perform comparative statistical analyses ofspecific taxa in the DHABs. In this study we applied ahigh-throughput next generation sequencing strategy(pyrosequencing) and a ciliate-specific primer set inorder to recover a comprehensive dataset on this targetgroup. The resulting data from deep sequencing enabledus to address basic ecological questions. Our first hy-pothesis was that the distinct chemistries of the differentbasins would drive species sorting in planktonic ciliatecommunities in the brines and interfaces of each basin.If this hypothesis is true, we would expect (i) thatinterface communities will differ decisively from brinecommunities (environmental filtering) and (ii) that cili-ate communities in interfaces are more similar to eachother than in the brines (isolated island character ofbrine basins). The brines of the different basins are iso-lated from one another due to the sharp density gradientthat exists between these hypersaline basins and overly-ing Mediterranean seawater. In contrast, exchange maybe possible between interface populations in differentDHABs since some exchange is possible between seawaterand the typically ca. 2 m-thick interfaces (haloclines). Oursecond hypothesis was that ciliate community compos-ition in the brines and interfaces of these four DHABs,separated by up to 500 km, would not be significantlyaffected by distance between basins. If this hypothesis istrue, we would expect no significant correlation betweenpairs of samples and geographic distance between therespective sampling sites, therefore, no isolation withdistance.
ResultsData overviewIn total, we obtained between 33,634 (sample Thetis brine)and 80,650 (sample Urania interface) V4-amplicons(Table 1). After quality filtering of the data (includingsingleton removal), between 32,663 (Thetis brine) and79,389 (Urania interface) ciliate V4-amplicons remainedfor further analyses (Table 1). The resulting number ofciliate OTUs called at 95% sequence similarity ranged be-tween 53 (Medee brine) and 551 (Urania brine). Afternormalization to the smallest dataset (32,663 amplicons)the resulting number of ciliate OTUs ranged between 12(Medee brine) and 322 (Thetis brine). Sampling saturation
curves are presented in Additional file 1: Figure S1. Theproportion of rare versus abundant ciliate taxa can befound in Additional file 2: Figure S2. Sequences havebeen deposited in the GenBank Short Read Archive[SRA061343].
Ciliate diversity in the DHABsHierarchical clustering of sampling sites based on Bray-Curtis distance (Figure 2a) identified two clusters, one ofwhich unites the brine ciliate communities of the basinsTyro (TB), Thetis (ThB) and Urania (UB), and, distantlyrelated to these brine communities, the ciliate commu-nity from Tyro interface (TIF). The parametric estimatorACE predicted highest ciliate richness in TIF (58.0,Table 2). Tyro brine, Thetis brine and Urania brineshared most ciliate amplicons. The Shannon index(Table 2) indicated the highest ciliate diversity in thesethree samples (Thetis brine 1.37; Tyro brine 1.48; Uraniabrine 1.73). The second cluster included the interfaceciliate communities from Thetis (ThIF), Urania (UIF)and Medee (MIF). The Medee brine (MB) ciliate com-munity was distinct from all other ciliate communitiesanalyzed in this study. The Shannon diversity index ofMedee brine was the lowest of all communities analyzed(0.14, Table 2), and also richness estimates were dis-tinctively lower than for all other samples (ACE = 16.9,Table 2).
Putative taxonomy of ciliate ampliconsThe V4-amplicons analyzed in this study were related toa total of 102 identified ciliate genera and one unclassifiedciliate taxon (Additional file 3: Table S1). The uniquecharacter of the Medee brine ciliate community can be in-ferred from Figure 2b, which displays the taxonomyassigned to the ciliate amplicons obtained from each sam-pling site. Medee brine was dominated by amplicons (n =33,961; 97% of all amplicons), which were all related to the

a b
Figure 2 Hierarchical clustering and taxonomic assignment based on ciliate V4 SSU rRNA-amplicons. (a) Hierarchical clustering (Bray-Curtis distance) of sampling sites based on ciliate community profiles in four DHAB halocline interfaces (IF) and brines (B). (b) Taxonomicassignment of ciliate V4 SSU rRNA-amplicons. In total, all amplicons could be assigned to 102 different ciliate genera (closest BLAST match inGenBank nr database) and one unclassified. In the legend of the figure we only show the taxa that are represented by at least 20% of allamplicons in at least one of the eight samples. For further details on taxonomic assignments we refer to Additional file 3: Table S1. M = Medee,T = Tyro, Th = Thetis, U = Urania.
Stock et al. BMC Microbiology 2013, 13:150 Page 4 of 15http://www.biomedcentral.com/1471-2180/13/150
genus Anoplophrya (Astomatida) as closest BLAST matchin NCBIs GenBank nr database. The sequence similaritiesof these amplicons to Anoplophrya ranged between 80and 89% (Additional file 4: Table S2). The remaining 1021ciliate amplicons from Medee brine were related to a fewother taxon groups belonging predominantly to thePeniculida (2.7%), other Astomatida (0.06%), and Pleu-ronematida (0.03%). Thetis brine and Tyro brine had arelatively similar ciliate community composition, both ofwhich were dominated by amplicons that have Strom-bidium as the closest BLAST match in the GenBanknucleotide database (64% and 45%, of all amplicons, re-spectively). Other abundant taxon groups shared by these
Table 2 Alpha diversity indices (data normalized to32,663 sequences in each sample) of ciliate communitiesin DHAB interfaces and brines
Shannon index ACE
Tyro interface 1.285 ± 0.002 58.0 ± 3.3
Tyro brine 1.477 ± 0.004 44.6 ± 3.5
Thetis interface 1.139 ± 0.004 42.4 ± 3.4
Thetis brine 1.370 44.3
Medee interface 1.067 ± 0.003 42.9 ± 2.0
Medee brine 0.142 ± 0.001 16.9 ± 1.2
Urania interface 0.895 ± 0.004 33.9 ± 6.5
Urania brine 1.730 ± 0.004 47.5 ± 3.0
two samples were Novistrombidium (30% in Tyro brineand 9% in Thetis brine), and Pseudotontonia (4% in Tyrobrine and 8% in Thetis brine). While Laboea accountedfor 11% of all amplicons in Thetis brine, this taxon groupwas absent in Tyro brine. A tintinnid ciliate taxon relatedto Salpingella as closest database relative occured exclu-sively in Tyro brine (4% of all amplicons), but not in The-tis (Additional file 3: Table S1). The ciliate communitycomposition in Urania brine was dissimilar to the brinesin Tyro and Thetis basins. One striking quantitative differ-ence was the high proportion of Pseudotontonia-relatedamplicons (40%) in Urania brine. However, while most ofthe relatively abundant taxon-groups were shared betweenthese three brine samples (but in different quantities),most qualitative differences between Tyro, Thetis andUrania brines were attributed to taxon groups with lowerabundances. Medee brine was distinct in its ciliate com-position from other brines.Tyro interface stood out from the other interface sam-
ples. The most significant difference was the occurrenceof 14,337 amplicons (41%), with Apocoleps (Prorodontida)as the best BLAST match. The proportion of amplicons inThetis, Urania and Medee interfaces related to this taxonwas less than 0.5%. Also the proportion of Strombidium-like amplicons in Tyro interface (40%) was decisivelyhigher compared to the other interfaces (4-21%). Thetisinterface and Urania interface had a very similar taxoncomposition, dominated by amplicons most closely related

-1.0 1.5
0.1-5.2
salinity
oxygen
sodium
sulfate
sulfide
MB
TB
ThB
UB
UIF
ThIF
TIF MIF
Na+ (mmol) 5300 3500 1368 850
Figure 3 Canonical correspondence analysis (CCA) of ciliate V4SSU rRNA- amplicon profiles for brines (B) and haloclineinterfaces (IF) of the different sampling sites. This CCA depictsthe best model in our CCAs, explaining 71.4% of the total variationwithin the community profiles with the first two axes accounting for41% of community composition variance. The first two canonicalaxes (most important synthetic gradients) explained 51% of thevariation of the species-environment relation. Sodium concentrationis significantly (positively) correlated with the second axis (p = 0.003).Bubble sizes correspond to Na+ concentration in each sample.M =Medee, T = Tyro, Th = Thetis, U = Urania.
Stock et al. BMC Microbiology 2013, 13:150 Page 5 of 15http://www.biomedcentral.com/1471-2180/13/150
to Pleuronema (Pleuronematida) (70% in UIF and 57% inThIF). This taxon was also highly represented in Medeeinterface (49%). The second most abundant taxon groupin Medee interface were clevelandellids, represented with43%. This taxon was underrepresented in the interfaces ofother basins (0.02% in UIF – 4% in ThIF).Four taxa occured in all eight samples analyzed (clos-
est BLAST matches: Pleuronema, Strombidium, Omega-strombidium, Apocoleps). Four taxa were exclusive to allinterfaces (Palgiopyliella, Cyclidium, Schizocalpytra,Isochonida). Interestingly, not a single taxon occuredexclusively in all brines simultaneously. However, 28taxon groups were absent from interfaces but present inat least one of the brines. The same number of taxongroups was absent from all brines but occured in at leastone of the interfaces. The majority of taxon groups hadabundances accounting for less than 5% of all ampliconsobtained within a sample.
Relating community patterns to environmental variablesWe used a Canonical Correspondence Analysis (CCA)to extract environmental gradients from the observedpartitioning of ciliate amplicon diversity. In the resultingordination diagram (Figure 3), environmental variableswith arrows close to the canonical axes may explain alarge proportion of the variation accounted for by thisaxis. The longer the arrow, the more variation may beexplained by this factor. The best model in our CCAexplained 71.4% of the total variation within the ciliateamplicon profiles with the first two axes (= two best syn-thetic gradients) accounting for 41.4% and the first twocanonical axes explaining 50.8% of the variation of thespecies-environment relation. Eigenvalues of axis 1 andaxis 2 were similar (0.388 and 0.349, respectively). Whileall interface samples (IF) were at the left part (negativescale) of axis 2, all brine samples were distributed alongits positive scale of values. Even though only sodium con-centration was significantly correlated with the secondaxis (p < 0.01) also oxygen concentration and salinity de-scribed the differential habitat preferences of the commu-nities distributed along the second canonical axis. Thus,these factors can be identified as main explainable envir-onmental selection factors for interface and brine ciliatecommunity composition (niche separation).The ciliate communities in the DHAB interfaces
showed only small variation along the first axis, whilebrine samples spread across a wider range of this firstaxis, with Medee brine and Thetis brine defining thelongest distance. None of the CCAs conducted found ameaningful correlation of this axis with any environ-mental variable that we have measured and testedexplaining this first axis. However, it must be a factorthat only separates niches for the brine communities,but not for interface communities.
Distance effect on DHAB ciliate community profilesDistance dependence was low (Figure 4), and very littleof the overall variability in ciliate community similaritywas accounted for by the regression model (R2 = 0.16). Acorrelation between distance and community similaritywas insignificant (p = 0.13, Pearson-rank correlation). Apermutation Mantel test between the geographic dis-tance and the Bray Curtis distance showed also a non-significant correlation (p = 0.178).
Fluorescent in situ hybridization and scanning electronmicroscopyScanning electron microscopy performed on samples col-lected from Urania halocline revealed abundant ciliates

Figure 4 Regression analyses of Bray-Curtis similarity between pairs of samples and the geographic distance between the respectivesampling sites. Only little of the overall variability in protistan community similarities was accounted for by the regression model (R2 = 0.16). APearson-rank correlation between distance and community similarity is insignificant (p = 0.13). Dotted lines represent 95% confidence intervals ofthe regression model.
Stock et al. BMC Microbiology 2013, 13:150 Page 6 of 15http://www.biomedcentral.com/1471-2180/13/150
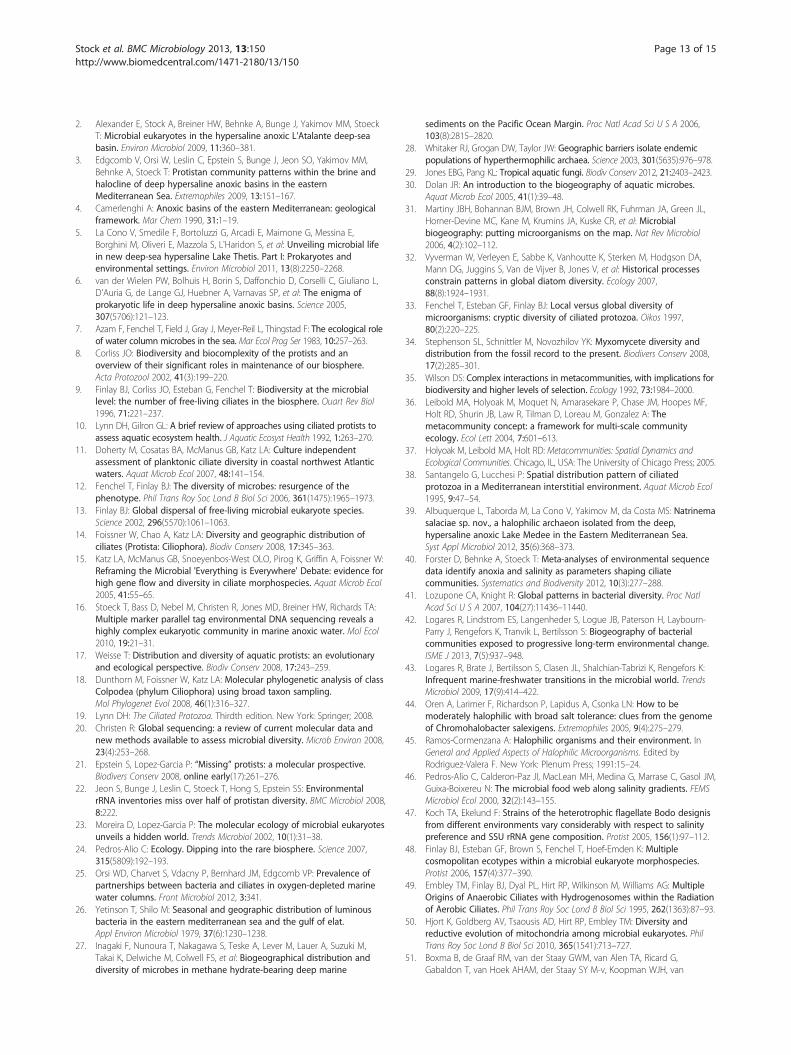
(95% scuticociliate morphotype) present at a concentra-tion of 9.7 (+/− 0.2) × 104 cells L-1), all of which hostedbacterial epibionts approximately 2–2.5 μm long that([25]; Figure 5). These results supported the decision tofocus on ciliates only in this work. SEM was notperformed on brine or interface samples from the otherbasins, however FISH hybridizations with the generaleukaryotic probe Euk1209 confirmed the presence ofciliates (with visible macro- and micro-nuclei) in Uraniabrine.
DiscussionDeep hypersaline anoxic basins (DHABs) in the EasternMediterranean Sea are ideally suited for testing the effectof historical contingencies on the evolution of protistcommunities. The distance between individual basins isvariable, and each basin is characterized by hydrochemicalgradients (interfaces to brines), and slightly different ori-gins, leading to differences in physicochemical factors ofthe brines and interfaces in each of the different basins.Due to the steep density gradients along the interfaces ofthese basins, there is little connectivity between basinbrines and overlying seawater, and therefore, betweenbasin brines. First insights into the ciliate communities inthe mesopelagic realm above the brine basins came from aSanger sequencing-based approach [3]. Because of therelatively small amount of data (four ciliate OTUs in themesopelagic reference and 10 in the brine) it is not a reli-able dataset for comparison to the high throughput se-quencing data from this study. However, the data from
that preliminary study did indicate a significant commu-nity shift between the water column and the basin brines.We assessed ciliate community structures in the interfacesand brines of several basins in order to determine thedegree to which these environmental barriers and basinchemistries influenced the ciliate plankton.The proportion of rare versus abundant ciliate taxa in
this study (Additional file 2: Figure S2) is comparable toprevious findings reporting protistan communities withfew abundant and many rare taxa [16,24]. Several mo-lecular diversity surveys over different spatial scales ran-ging from centimeters to tens of thousands of kilometershave supported distance-decay relationships (effect ofdistance on spatial interactions) for microbial organisms,including bacteria (e.g. [26,27]), archaea (e.g. [28]), fungi(e.g. [29]) and also protists (e.g. [30-32]). Even organismswith large population sizes and the potential to spreadglobally using spores, which were assumed to be cosmo-politan [13,33], show significant non-random spatial dis-tribution patterns [34]. However, in our study of ciliatecommunities in these DHABs, a similar distance-decayrelationship was not observed (insignificant correlationbetween Bray-Curtis and geographic distances in Pear-son correlation and Mantel test). A potential explanationcould be that the small number of compared locationsmay have masked true patterns. Alternatively, the pres-ence of a metacommunity [35] within the MediterraneanSea could cause the absence of a significant heterogeneousdistribution [36,37]. In limnic systems geographic distancehas been found to influence asymmetric latitudinal genus

a
b
Figure 5 Scanning electron microscopy (SEM) and fluorescentin situ hybridization (FISH) images of ciliates. a) SEM ofscuticociliate morphotype from Urania interface, EHT = 3 kV, SignalA = SE2, WD = 9.7 mm, Width = 15.99 μm, scale 1 μm, b) fusiformciliate from Urania interface, WD = 10 mm, Width = 91.74 μm, scale10 μm. a-b: with MBL, Biological Discovery in Woods Hole. c-d) FISHimages of ciliate morphotypes from Urania brine (general eukaryoticprobe EUK1209). Scale in c-d 5 μm.
Stock et al. BMC Microbiology 2013, 13:150 Page 7 of 15http://www.biomedcentral.com/1471-2180/13/150
richness patterns between 42° S and the pole [32]. How-ever, this seems to be a fundamental difference betweenmarine and “terrestrial” (land-locked) systems. Further-more, on a global scale, historical factors were significantlymore responsible for the geographic patterns in com-munity composition of diatoms than environmentalconditions [32]. In other marine studies ciliates showedvariations in taxonomic composition between closely re-lated samples, which were explained by environmentalfactors rather than distance [38]. Similarly, in our studygeographic distance could not explain the variationsobserved between the ciliate communities. Instead,
hydrochemistry explained some of the variation in ob-served ciliate community patterns, and there was astrong separation of halocline interface and brine com-munities (Figure 3). The DHAB interfaces are character-ized by extremely steep physicochemical gradients on asmall spatial scale typically less than a couple of meters(for example, only 70 cm in Medee, [39]). The concen-trations of salt and oxygen are the most prominent en-vironmental factors that change dramatically along theinterfaces into the brines. In a recent metadata-analysisof environmental sequence data, these two factors wereidentified as strong selection factors for ciliates [40].Also for bacterial communities, salt concentration emergedas the strongest factor influencing global distribution [41].Likewise, the bacterioplankton community composition incoastal Antarctic lakes was weakly related with geograph-ical distance, but strongly correlated with salinity [42]. Ac-cordingly, Logares et al. assumed that a long-term salinitychange ‘promoted the diversification of bacterioplanktoncommunities by modifying the composition of ancestralcommunities and by allowing the establishment of newtaxa’ [42]. Salinity shifts characterize a boundary which isone of the most difficult barriers to cross for organisms inall three domains of life [43]. While mechanisms to copewith high salt concentrations are relatively well studied inprokaryotes, they are still largely unknown in protists (withthe exception of the model algae Dunaliella salina [44]).While there is evidence that many protists have narrowranges of salt tolerance [45,46], some taxa are known tooccur under a wide range of salinities, from freshwater tohypersaline [47]. One example is the ciliate Cyclidiumglaucoma [48], which may explain the occurrence of someof the same phylotypes in haloclines and brines of specificDHABs. Other examples are likely to exist.In contrast, adaptations to anoxia in ciliates are well
known. Ciliates are one of the most successful eukaryotictaxon groups in hypoxic and anoxic habitats. In their longevolutionary history, they have acquired several strategiesthat allow for an anaerobic lifestyle, including hydro-genosomes [49,50], anaerobic mitochondria [51], and/orsymbiotic networks [52,53]. The high taxonomic diversityof anaerobe ciliates includes taxa such as Nyctotherus,Loxodes, Pleuronema, Strombidium, Trimyema, Cyclidiumand Metopus, some of which were also detected in ourgenetic diversity survey. Electron microscopy and fluores-cence in situ hybridization assays provide unbiased evi-dence that the genetic signatures we detected in ourrRNA-targeted gene survey can be assigned to ciliatesliving in the DHABs rather than reflecting ancient nucleicacids. (Figure 5, [25,54]). Taking advantage of phylotypesthat we detected exclusively in specific habitats andphylotypes that can be found in several habitats with dis-tinct hydrochemical characteristics, we may assume thatthe latter have a character of more generalist taxa

Stock et al. BMC Microbiology 2013, 13:150 Page 8 of 15http://www.biomedcentral.com/1471-2180/13/150
compared to the more locally restricted phylotypes. Thetotal number of observed taxon groups is 102 distrib-uted over eight different datasets (samples or habitats)(Additional file 1: Figure S1). In those eight samplesthere are 13 generalist taxonomic groups that appearedsimultaneously in at least six of the datasets. Only fourtaxonomic groups appeared in all of the eight datasets.Specialists, i.e. taxa that are restricted to a single uniquehabitat account for 34 different taxonomic groups. Thisresults in a specialist/generalist ratio of 8.5 to 1, indicat-ing a high specialization of taxa in the habitats understudy. However, there is a limitation to infer the autecol-ogy of specific evolutionary lineages based on sequencedata and microscopy evidence [25]. We do not make anyattempt to explain the presence or absence of specificphylotypes in individual samples, and we instead focusonly on community level ciliate diversity.Hydrochemical gradients have been identified as envir-
onmental barriers in previous protistan diversity surveysincluding the Cariaco basin [55], Framvaren Fjord [56],Mariager Fjord [57], Baltic Sea [58] and the Black Sea[59] and also stratified lakes [60]. Therefore, the cleardistinction of halocline ciliate communities from brinecommunities is not an unexpected result. However, it issurprising that the environmental variables we measuredhad a minor contribution to differences among the indi-vidual brine ciliate communities. In the CCA analyses(Figure 3) the different brine communities were spreadout along the y-axis. This axis, however, does not repre-sent an environmental gradient. This is surprising, con-sidering that different types of salts may have differentphysiological effects [61] and therefore, should requiredifferent adaptation strategies in halophiles. Basically, wecan assume two scenarios: first, for isolated evolution asdescribed in [62], the scenario starts with a seed taxon.After physical separation of the original habitat into twohabitats neutral mutations are changing the seed taxonin these habitats independently. These neutral mutationsare of minor nature considering the time scale of thebasins’ geological histories. From this event we wouldexpect similar taxon groups with only minor geneticchanges in both habitats. As mentioned above, eacheighth taxon recorded in our study (Additional file 3:Table S1) falls into this category. In the second scenario(environmental filtering) we have the same ‘seed bank’community for different basins. Through environmentalfiltering (different hydrochemistries of the basins) sometaxa may go extinct, others have the genomic potentialto adapt to some specific hydrochemistries, while othersare genomically equipped for adaptation to other envir-onmental conditions. In this case we would find taxa dif-fering on higher taxonomic (genetic) hierarchies. This isthe case for 34 of 102 detected taxon groups (Additionalfile 3: Table S1). We cannot rule out all environmental
factors from causing differences between the ciliate com-munities because we did not measure all possible envir-onmental factors, but only the hydrogeochemical factorsthat account for the most pronounced and obvious dif-ferences. This suggests that (1) other hydrochemical var-iables we did not measure are leading to this separation,or (2) that biotic interactions may explain some of the dif-ferences between brine ciliate communities. Even thoughinteractions of top-down and bottom-up factors in shap-ing community structures of aquatic microbes are stillpoorly understood [63] some well known biotic interac-tions could be considered. Such biotic interactions maybe, for example, parasitic relationships between organismslike amoeboid parasitic forms that can shape the compos-ition of cyanobacterial species in lakes (Rohrlack et al.,unpublished data). Furthermore, symbiotic relationshipsinclude ciliates, associated with epibiontic prokaryotes,were found to be the dominant eukaryotic morphotypesin the haloclines of DHABs in the Mediterranean Sea [25].Biotic interaction between protists and viruses are alsoknown and have been shown [64]. Viruses specificallyinfect protists, e.g. the Coccolithovirus and it’s host, thecalicifying haptophyte Emiliania huxleyi [65]. Addition-ally, viruses can also have an an indirect influence onprotists by infecting the bacteria on which the protistangrazers feed or protistan grazers can even feed directlyon viruses even though the carbon transfer to the highertrophic level is of minor importance [66]. Furthermore,different bacterioplankton communities can produce abottom-up control on grazing protists. Namely, thegrowth efficiency of protists can relate strongly to theavailable bacterial prey [63,67]. This is highly likely be-cause differences in bacterial community compositionin DHABs have been shown before [68,69]. That leadsto the assumption that different bacterial communitiessupport different phagotrophic protists that show strongpreferences for particular prey species [63,67,70,71] ormorphotypes [72,73]. Other possible explanations arefounder effects, which describe a genetic deviation of anisolated population or founder population (on an islandfor example) compared to the original population basedon a low number of alleles within the founders individ-uals [74], random effects or genetic drift is the changein the frequency of a gene in a population due to randomsampling [75] and random extinctions that describe whena gene causes its carriers to have a deviating fitness fromunity, its frequency will be determined by selection [76] indifferent basins. For protists in particular there is no litera-ture available on this topic to our knowledge. At last, theMonoplization Hypothesis by De Meester et al. [77] couldbe relevant to protist biogeography stating that a fastpopulation growth and local adaptation and colonizationof a new habitat result in the monopolization of resources,which yields a strong priority effect. The effect is even

Stock et al. BMC Microbiology 2013, 13:150 Page 9 of 15http://www.biomedcentral.com/1471-2180/13/150
enhanced when a locally adapted population can provide a‘large resting propagule bank’ as a strong buffer againstnew genotypes invading. This holds true especially forspecies that reproduce asexually and form resting stages.Even though mass effect and dispersal [78] cannot be
ruled out, these are unlikely alternatives to explain theobserved community patterns. The habitats of the watercolumn above the DHABs represent a potential sourcehabitat with ‘high quality’. In comparison, the narrowinterphase and the brine show ‘low quality’ conditionsbecause these habitats harbor high gradients of change,anoxia, high salt concentration up to saturation and there-fore require a high degree of physiological adaptation formicrobial colonization. Chances for highly specialized or-ganisms to cross environmental barriers outside theirhabitat and to disperse beyond their specific habitat arevery low. Evidence for this hypothesis comes, for example,from the very rare and infrequent dispersal of protists be-tween marine and freshwater habitats [43,79]. One possi-bility may be the dispersal of spores and/or cysts (restingstages), however, our knowledge about the number of cili-ates that can form such resting stages in nature is verylimited [80]. Furthermore, physical mechanisms of trans-port for resting stages between different basins are difficultto imagine, considering the lack of fluid flow, high density,and lack of animal vectors in the brines. In contrast, thisscenario may be more plausible for cysts/spores in halo-cline/interphase habitats. Physical transport of restingstages between haloclines at different basin sites could ex-plain the observed similarities in ciliate interphase com-munities (Figure 3).The deep basins in the eastern Mediterranean Sea may
have recruited their protistan seed communities from At-lantic Sea water during the Zenclean Flood (~5.3 mya),when the Strait of Gibraltar opened permanently andrefilled the mostly dried out Mediterranean Sea [81].Subsequently, due to the dissolution of evaporites and therise of anoxia in deep basins the water masses becamephysically separated from each other. Anoxia and hydro-chemistry likely exerted an increased pressure on the ori-ginal protistan communities. Species sorting may havebeen driven through environmental filtering [37,42,62,82].This is a predictable and fundamental process of com-munity assembly [83], that allows only those taxa withthe genomic and physiological potential to cope witheach specific set of environmental conditions. This hasbeen evidenced for recent ciliate communities [40]. Thenormsaline and normoxic deep-sea water separating thedifferent hypersaline anoxic basins from each other thenbecame an environmental barrier for most protists (withthe exception of cyst-forming taxa), with the consequencethat genetic exchange among the different brines was nolonger likely. Changes in the SSU are presumably neutral,therefore, these changes would be due to random
mutations. However, it is reasonable to assume thatchanges in the SSU rDNA are occurring in congruencywith whole genome changes and not independent of evo-lutionary genome processes. Evolution over geologicaltime may have resulted in significantly different ciliatecommunities in the brines. Divergence of species occur-ring in isolation through adaptive shifts that occurs incommon seed species populations has been demonstratedfor a number of taxa, including several macro- andmicroinvertebrates using molecular as well as taxonomicstudies [84-87]. Based on our data, it is not unreasonableto assume that protists are also subjected to such evolu-tionary processes. Our study strongly suggests that evo-lutionary time scales combined with physical andhydrochemical isolation can explain, in part, the ob-served evolutionary differences in the ciliate communi-ties in the different DHABs studied here.
ConclusionsThe data presented here suggests that ancient isolatedhabitats, like deep-sea brine lakes, which also occur inthe Red Sea [88] and the Gulf of Mexico [89] or habitatslike aquifers and cave systems will represent ‘hot spots’for the discovery of as-of-yet unstudied, possibly highlydivergent, and endemic microbial eukaryotes.
Financial competing interestsIn the past five years we did not receive reimbursements,fees, funding, or salary from an organization that may inany way gain or lose financially from the publication ofthis manuscript, either now or in the future. We do nothold any stocks or shares in an organization that may inany way gain or lose financially from the publication ofthis manuscript, either now or in the future. We neitherhold nor apply for any patents relating to the content ofthe manuscript. We did not receive reimbursements,fees, funding, or salary from an organization that holdsor has applied for patents relating to the content of themanuscript. We, the authors, do not have any other fi-nancial competing interests.
Non-financial competing interestsThere are no non-financial competing interests (polit-ical, personal, religious, ideological, academic, intellec-tual, commercial or any other) to declare in relation tothis manuscript.
MethodsSamplingThe seawater-brine interfaces (haloclines) of the DHABsTyro, Thetis, and Medee in the Mediterranean Sea weresampled on the cruise aboard the R/V Urania in 2009.Samples from the DHAB Urania were collected in 2009 onthe R/V Oceanus. Sampling sites are depicted in Figure 1

Stock et al. BMC Microbiology 2013, 13:150 Page 10 of 15http://www.biomedcentral.com/1471-2180/13/150
and coordinates with environmental data for each DHABhalocline and brine are provided in Table 3. The positionsof the interfaces were determined using a SBE911plusCTD (Sea-Bird Electronics, Bellevue, WA, USA) equippedwith an SBE43 oxygen sensor (Sea-Bird Electronics, USA).Samples were collected from the interface and brine ofeach basin using a rosette equipped with 12-L Niskinbottles. The salinity gradient from the top to the bottom ofindividual Niskin bottles was confirmed on board the shipusing a WTW portable sensor for conductivity, pH andtemperature (WTW, Weinheim, Germany). Water sampleswere collected from Niskin bottles into 50-L Nalgene bot-tles flushed with argon gas and 6–10 L water were filteredimmediately onto Durapore membranes (47 mm; 0.65 μm;Millipore, USA) under gentle vacuum (flow rate: ca. 50 ml/min) and under argon in the case of anoxic samples [2],followed by storage in RNAlater (Ambion, Applied Bio-systems, USA). According to Ambion’s RNAlater manual,the filters were stored at 4°C for 24 hours prior to freezingat −20°C until RNA extraction. RNA was used to ensurethat samples were not contaminated by settling DNA fromabove the investigated layers.
Environmental RNA Isolation, transcription and PCRamplification of ciliate SSU rRNAsThe method for the extraction and reverse transcriptionof environmental RNA (envRNA) from protistan plank-ton collected on membranes has been described in detailpreviously [2]. In short, total RNA was extracted usingQiagen’s AllPrep DNA/RNA Mini kit (Qiagen, Germany)according to the manufacturer’s instructions following achemo-mechanical cell disruption by bead-beating (45 s,30 Hz). Residual DNA was removed by DNase I (Qiagen)digestion. We conducted a PCR with the digested RNA toexclude the possibility of residual DNA in downstreamapplications (PCR protocol see below). The concentrationof extracted and purified RNA was determined spectro-photometrically using a Nanodrop ND-1000 UV–vis
Table 3 Coordinates, sampling depths and physico-chemicaldifferent DHABs under study
Coordinates(Long, Lat)
Depth (m) Salinitya (PSU) Conductivit(S/m)
MIF 22.312124 E, 34.19468 N 2924 70 7.7
TIF 26.21962 E, 33.524236 N 3327 67 7.8
ThIF 22.084368 E, 34.401134 N 3259 80 8.2
UIF 21.283252 E, 35.13528 N 3468 63 7.8
MB 22.312124 E, 34.19468 N 2950 320 16.7
TB 26.21962 E, 33.524236 N 3448 321 16.7
ThB 22.084368 E, 34.401134 N 3380 348 16.7
UB 21.283252 E, 35.13528 N 3493 240 15.6
M Medee, T Tyro, Th Thetis, U Urania. Data are from the literature and from this stuafrom [54]; bfrom [5].
spectrophotometer (Nanodrop Technologies, Wilmington,DE, USA). The integrity of the RNA was checked with anRNA 6000 picoassay on an Agilent 2100 Bioanalyzer(Agilent Technologies, Germany). To minimize extractionbias, total RNA from three individual filters (eachrepresenting 6-10 L water) per depth and sampling sitewere extracted. Total RNA was then reverse transcribedinto cDNA using Qiagen’s QuantiTect Reverse Transcrip-tion kit and with random primers provided with the kitaccording to the manufacturer’s instructions. After tran-scription of each individual sample, the three replicatetranscribed products of each depth/sampling site werepooled and subjected to SSU cDNA amplification. First,amplification with a ciliate specific primer set (Table 4)was performed to filter specifically the ciliate SSU rRNAfrom the env cDNA. The PCR reaction included 50–100 ng of template cDNA in a 50 μl-reaction, 1 U ofPhusion High-Fidelity DNA polymerase (Finzymes), 1×Phusion HF Buffer, 200 μM of each deoxynucleotide tri-phosphate, and 0.5 μM of each oligonucleotide primer.The PCR protocol amplifying ca. 700 bp-long gene frag-ments consisted of an initial denaturation (30 s at 98°C)followed by 30 identical amplification cycles (denatur-ation at 98°C for 10 s, annealing at 59°C for 10 s and ex-tension at 72°C for 30 s), and a final extension at 72°Cfor 10 min. Subsequently, the purified (Qiagen’sMiniElute kit) PCR products from the first reactionwere subjected to a second PCR, which employedeukaryote-specific primers for the amplification of thehypervariable V4 region ([16]; Table 4). The PCR proto-col started with 10 identical amplification cycles at anannealing temperature of 57°C where only the forwardprimer would operate, followed by 25 cycles with a pri-mer annealing at 49°C where both forward and reverseV4 primers would amplify [16]. The resulting PCRamplicons (ca. 480 bp) were excised from the gel usingQiagen’s Gel extraction kit. Gel extraction eliminatesunspecific shorter fragments, invisible on a gel, in the
data of the brines (B) and halocline interfaces (IF) of the
ya Oxygena
(ml/l)Na+ (mmol) Mg2+ (mmol) SO4
2- (mmol) HS- (mmol)
0.5 847 161 41 n.a.
0.5 1111 15 11 0.07
0.68 1368 174 76 0.11
1.22 876 79 42 0.66
0 4818 792 201 2.9
0 5300b 71b 53b 2.1b
0 4760b 604b 265b 2.1b
0 3505b 315b 107b 15
dy (measured as described in [5]). n.a. not available.

Table 4 Primer sets used in this study for the specific amplification of ciliate V4-SSU rRNA fragments using a two-step(nested) PCR reaction
Primer Primer sequences Reference
1. Reaction: PCR ciliate specific primers
Cil F 5′-TGGTAGTGTATTGGACWACCA-3′ [105]
Cil R1 5′-TCTGATCGTCTTTGATCCCTT-3′ [105]
Cil R2 5′-TCTRATCGTCTTTGATCCCCTA-3′ [105]
Cil R3 5′-TCTGATTGTCTTTGATCCCCT-3′ [105]
2. Reaction: PCR hyper variable V4-region
Linker sequences Key MID Primer Primer sequences Reference
5′-CGTATCGCCTCCCTCGCGCCA TCAG MID TAReuk454FWD1 5′-CCAGCASCYGCGGTAATTCC-3′ [16]
5′-CGTATCGCCTCCCTCGCGCCA TCAG MID TAReukREV3 5′-ACTTTCGTTCTTGATYRA-3′ [16]
Stock et al. BMC Microbiology 2013, 13:150 Page 11 of 15http://www.biomedcentral.com/1471-2180/13/150
final amplicon library. The integrity and length of purifiedamplicons was determined with a DNA 500 LabChip onan Agilent 2100 Bioanalyzer.
Pyrosequencing and sequence data processingThe DNA sequencing of the V4-amplicons was conductedby Engencore (University of South Carolina, USA) usingRoche’s Titanium chemistry. One half plate was sequencedwith the eight different samples with individual MIDs. Thenumber of amplicons obtained after sequencing rangedbetween 33,634 (Thetis brine) and 80,650 (Urania inter-face) sequences.For sequence data quality control and processing, we
used the program JAguc [90]. All tags that met any ofthe following conditions were considered as “low qual-ity” and removed from further analyses: sequences <200nucleotides, sequences containing an inaccurate calibra-tion key, incomplete or erroneous forward and reverseprimer sequences, presence of an ambiguity code. Se-quences were then clustered. A cluster included sequencesthat shared at least 95% similarity in their primary struc-tures. This conservative cluster threshold was chosen, be-cause it accounts for sequencing errors and for intraspecificvariability in the hypervariable SSU rDNAV4 region of cili-ates [91,92]. Single singletons (unique amplicons after 95%clustering that occurred exclusively in only one of the eightsamples) were removed from downstream analyses as theyare most likely erroneous sequencing products [91,93].
Taxonomic assignmentWe assigned taxonomy to each amplicon by conductingBLASTn searches implemented in JAguc (using parame-ters -m 7 -r 5 -q −4 -G 8 -E 6 -b 50) of each unique tagagainst a local installation of NCBI’s nucleotide database(nr/nt, release 187). Only unique tags with a best BLASThit of at least 80% sequence similarity were assigned to ataxonomic category. The remaining tags were assignedto an artificial category “others”. This information wasstored in JAguc’s database. We only assigned taxonomic
labels to the genus level, because taxon assignments onlower taxonomic levels become inaccurate and biased dueto the relatively limited sequence information provided inshort amplicons [92]. Taxonomy of ciliates follows thecompendium “The Ciliated Protozoa” by D. Lynn [19].
Statistical analyses of ciliate amplicon profilesTo assess the ciliate diversity within a particular sample(alpha-diversity, [94]), we normalized the data (to thesmallest number of sequences: 32,663 sequences werepicked randomly 10,000 times in each of the sampleswith the software R [95]). We used the Shannon index(combining richness and relative abundance; [96]) andthe non-parametric richness estimator ACE [97] ascalculated with R [95]. The partitioning of diversitybetween communities (beta-diversity) was calculatedwith the Bray-Curtis index, using the software EstimateSv.8 [98], and then translated into distance matrixes(1 minus Bray-Curtis index value) for UPGMA clusteranalyses. Bray-Curtis similarity index is a modified ver-sion of the Sørensen index, which considers abundancedistribution (also known as the Sørensen abundanceIndex or the quantitative Sørensen index [99,100].To assess an effect of distance on community similar-
ities, Jaccard and Chao-Sørensen indices were plottedagainst distance data among individual sample sites in aPearson-rank correlation using the Statistica softwarepackage. A Student’s t-test for paired samples was usedfor significance testing. A Mantel test between the geo-graphic distance and the Bray Curtis distance matriceswas conducted to evaluate the significance of the correl-ation coefficient between geographic and genetic distance.The Mantel test was conducted using the software add-infor Microsoft Excel XLSTAT (www.xlstat.com) with 10000permutations. Geographical distances were calculated viathe subtraction of different depths on a single geographicalposition, which resulted in the altitude difference withinthe same basin. For the calculation of the 2-dimensionalgreat-circle distance between two points on a sphere from

Stock et al. BMC Microbiology 2013, 13:150 Page 12 of 15http://www.biomedcentral.com/1471-2180/13/150
their longitudes and latitudes (same depth) the haversineformula [101] was implemented in the script as providedby Chris Veness (2002–2011) at http://www.movable-type.co.uk/scripts/latlong.html.A canonical correspondence analysis (CCA) of quantita-
tive amplicon profiles was conducted to describe the rela-tionships between ciliate community composition patternsand underlying environmental gradients, which shapethese diversity patterns. Data were log-transformed [102]and unconstrained permutations (n = 499) were run undera reduced model. Monte Carlo significance tests of firstordination axes and of all canonical axes together wereperformed. Initially, all available environmental variables(see above) were included in the model. In order to de-velop a robust model explaining as much variance aspossible while avoiding multi-colinearity, individual var-iables were removed in a step-wise manner. We usedthe Canoco software (Microcomputer Power, Ithaca,NY, USA) for the ordination analysis.
Scanning electron microscopy (SEM) preparation andenumeration of ciliatesWe used SEM to visualize ciliate morphotypes and toamend the molecular diversity survey with imaginganalyses. We followed the method for SEM described in[25,103]. In short, fixed samples were filtered onto 0.4-μmpolycarbonate Transwell membrane filters (Corning,USA) and washed with 1X PBS (pH 7.4) that were takenthrough a dehydration series and fixed with 100% hexa-methyldisilizane (Electron Microscopy Sciences, Hatfield,Pennsylvania) before air-drying. Transwell filters were notexposed to air at any point during the protocol, until thefinal step to prevent collapse of fixed protists. Filters wereattached to a carbon adhesive tab and mounted on a SEMspecimen holder. Mounted specimens were then sputtercoated with 10–15 nm of gold and palladium (60:40) usinga Tousimis Samsputter 2A and visualized with a HitachiS4800 scanning electron microscope. A minimum of 50microscopic fields (0.5 × 1.0 mm) were observed to countciliates in each of the samples, and ciliates were countedon at least three different filters.
Fluorescence in situ hybridizationIn order to evaluate the relative abundance of ciliates aspart of the protistan assemblages we used fluorescence insitu hybridization with a specific oligonucleotide probe.FISH followed the protocol of [103]. In short, 100–150 mlof paraformaldehyde-fixed (2% final concentration) sea-water was filtered onto 0.65 μm filters and frozen at −20°C.Filters were thawed, and cut into small triangles before thehybridization step and ~20 μl of pre-heated 0.2% metaphoragarose were pipetted onto filters. After the metaphor agar-ose had dried, filter pieces were transferred to 0.5 ml steriletubes containing the hybridization mix. All hybridizations
were carried out using the universal eukaryotic FISH probeEuk1209 [104] with 40% formamide for 2 hours at 46°C.After the hybridization step, filter pieces were incubated at48°C in preheated washing buffer for 10 minutes in sterile50 ml tubes. Filter pieces were then washed with distilledwater and placed into sterile 0.5 ml tubes containing DAPI(2 μg/ml) and incubated for 5 minutes in the dark. Filterpieces were then washed with sterile water and incubatedfor 2 minutes in 70% ethanol, followed by a 2-minute washwith 100% ethanol. Filters were air dried and mountedon glass slides with a Citifluor/Vectashield mix (4:1) toprevent bleaching. Cells were enumerated under epi-fluorescence using a Zeiss Axioplan 2 microscope andphotographed with a Hamamatsu digital camera.
Additional files
Additional file 1: Figure S1. Rarefaction curves of V4 SSU rRNA-amplicons that were assigned to ciliate genera for all eight samples.
Additional file 2: Figure S2. Proportion of rare versus abundant ciliatetaxa. The number of detected taxa is opposed to the number of ciliateV4 SSU rRNA amplicons.
Additional file 3: Table S1. Number of ciliate V4 SSU rRNA-ampliconsin each sample assigned to described ciliate genera. The assigned genusrepresents the best BLAST hit of assigned amplicons to NCBIs GenBanknucleotide database 187.
Additional file 4: Table S2. Keyplayer ciliate taxa with minimum andmaximum sequence similarity to known species. Sequence similaritiesfrom Genbank BLASTn.
Competing interestsThe authors declared that they have no competing interests.
Author’ contributionsAS, VE and TS contributed to project design, collection of data, analysis ofdata, and drafting of manuscript. WO contributed to drafting the revisedmanuscript and as well as SF, HWB and MY contributed to collection andanalysis of data. All authors have read and approved the final version of thismanuscript.
AcknowledgementsThe authors would like to thank Dr. Maria Pachiadaki, Dr. Matthias Engel andMelanie Müller for assistance with sample collection during the R/V Uraniacruise, and the captains and crew of the R/V Urania and R/V Oceanus fortheir tireless assistance with sample collection. We thank Dominik Forster forhelp with R. This work was funded by NSF grants OCE-0849578 and OCE-1061774 to VE and support from Carl Zeiss fellowship to AS and from theDeutsche Forschungsgemeinschaft (grants STO414/3-2 and STO414/7-1) toTS.
Author details1University of Kaiserslautern, School of Biology, Erwin-Schroedinger-Str. 14,D-67663 Kaiserslautern, Germany. 2Department of Geology and Geophysics,Woods Hole Oceanographic Institution, Woods Hole, MA 02543, USA.3Institute for Coastal Marine Environment, IAMC-CNR, Spianata S. Raineri, 86,98122 Messina, Italy.
Received: 27 November 2012 Accepted: 15 May 2013Published: 8 July 2013
References1. Ovreas L, Curtis TP: Microbial diversity and ecology. In Biological Diversity:
frontiers in measurement and assessment. Edited by Magurran AE, McGill BJ.Oxford: Oxford University Press; 2011:221–236.
Stock et al. BMC Microbiology 2013, 13:150 Page 13 of 15http://www.biomedcentral.com/1471-2180/13/150
2. Alexander E, Stock A, Breiner HW, Behnke A, Bunge J, Yakimov MM, StoeckT: Microbial eukaryotes in the hypersaline anoxic L'Atalante deep-seabasin. Environ Microbiol 2009, 11:360–381.
3. Edgcomb V, Orsi W, Leslin C, Epstein S, Bunge J, Jeon SO, Yakimov MM,Behnke A, Stoeck T: Protistan community patterns within the brine andhalocline of deep hypersaline anoxic basins in the easternMediterranean Sea. Extremophiles 2009, 13:151–167.
4. Camerlenghi A: Anoxic basins of the eastern Mediterranean: geologicalframework. Mar Chem 1990, 31:1–19.
5. La Cono V, Smedile F, Bortoluzzi G, Arcadi E, Maimone G, Messina E,Borghini M, Oliveri E, Mazzola S, L'Haridon S, et al: Unveiling microbial lifein new deep-sea hypersaline Lake Thetis. Part I: Prokaryotes andenvironmental settings. Environ Microbiol 2011, 13(8):2250–2268.
6. van der Wielen PW, Bolhuis H, Borin S, Daffonchio D, Corselli C, Giuliano L,D'Auria G, de Lange GJ, Huebner A, Varnavas SP, et al: The enigma ofprokaryotic life in deep hypersaline anoxic basins. Science 2005,307(5706):121–123.
7. Azam F, Fenchel T, Field J, Gray J, Meyer-Reil L, Thingstad F: The ecological roleof water column microbes in the sea. Mar Ecol Prog Ser 1983, 10:257–263.
8. Corliss JO: Biodiversity and biocomplexity of the protists and anoverview of their significant roles in maintenance of our biosphere.Acta Protozool 2002, 41(3):199–220.
9. Finlay BJ, Corliss JO, Esteban G, Fenchel T: Biodiversity at the microbiallevel: the number of free-living ciliates in the biosphere. Ouart Rev Biol1996, 71:221–237.
10. Lynn DH, Gilron GL: A brief review of approaches using ciliated protists toassess aquatic ecosystem health. J Aquatic Ecosyst Health 1992, 1:263–270.
11. Doherty M, Cosatas BA, McManus GB, Katz LA: Culture independentassessment of planktonic ciliate diversity in coastal northwest Atlanticwaters. Aquat Microb Ecol 2007, 48:141–154.
12. Fenchel T, Finlay BJ: The diversity of microbes: resurgence of thephenotype. Phil Trans Roy Soc Lond B Biol Sci 2006, 361(1475):1965–1973.
13. Finlay BJ: Global dispersal of free-living microbial eukaryote species.Science 2002, 296(5570):1061–1063.
14. Foissner W, Chao A, Katz LA: Diversity and geographic distribution ofciliates (Protista: Ciliophora). Biodiv Conserv 2008, 17:345–363.
15. Katz LA, McManus GB, Snoeyenbos-West OLO, Pirog K, Griffin A, Foissner W:Reframing the Microbial 'Everything is Everywhere' Debate: evidence forhigh gene flow and diversity in ciliate morphospecies. Aquat Microb Ecol2005, 41:55–65.
16. Stoeck T, Bass D, Nebel M, Christen R, Jones MD, Breiner HW, Richards TA:Multiple marker parallel tag environmental DNA sequencing reveals ahighly complex eukaryotic community in marine anoxic water. Mol Ecol2010, 19:21–31.
17. Weisse T: Distribution and diversity of aquatic protists: an evolutionaryand ecological perspective. Biodiv Conserv 2008, 17:243–259.
18. Dunthorn M, Foissner W, Katz LA: Molecular phylogenetic analysis of classColpodea (phylum Ciliophora) using broad taxon sampling.Mol Phylogenet Evol 2008, 46(1):316–327.
19. Lynn DH: The Ciliated Protozoa. Thirdth edition. New York: Springer; 2008.20. Christen R: Global sequencing: a review of current molecular data and
new methods available to assess microbial diversity. Microb Environ 2008,23(4):253–268.
21. Epstein S, Lopez-Garcia P: “Missing” protists: a molecular prospective.Biodivers Conserv 2008, online early(17):261–276.
22. Jeon S, Bunge J, Leslin C, Stoeck T, Hong S, Epstein SS: EnvironmentalrRNA inventories miss over half of protistan diversity. BMC Microbiol 2008,8:222.
23. Moreira D, Lopez-Garcia P: The molecular ecology of microbial eukaryotesunveils a hidden world. Trends Microbiol 2002, 10(1):31–38.
24. Pedros-Alio C: Ecology. Dipping into the rare biosphere. Science 2007,315(5809):192–193.
25. Orsi WD, Charvet S, Vdacny P, Bernhard JM, Edgcomb VP: Prevalence ofpartnerships between bacteria and ciliates in oxygen-depleted marinewater columns. Front Microbiol 2012, 3:341.
26. Yetinson T, Shilo M: Seasonal and geographic distribution of luminousbacteria in the eastern mediterranean sea and the gulf of elat.Appl Environ Microbiol 1979, 37(6):1230–1238.
27. Inagaki F, Nunoura T, Nakagawa S, Teske A, Lever M, Lauer A, Suzuki M,Takai K, Delwiche M, Colwell FS, et al: Biogeographical distribution anddiversity of microbes in methane hydrate-bearing deep marine
sediments on the Pacific Ocean Margin. Proc Natl Acad Sci U S A 2006,103(8):2815–2820.
28. Whitaker RJ, Grogan DW, Taylor JW: Geographic barriers isolate endemicpopulations of hyperthermophilic archaea. Science 2003, 301(5635):976–978.
29. Jones EBG, Pang KL: Tropical aquatic fungi. Biodiv Conserv 2012, 21:2403–2423.30. Dolan JR: An introduction to the biogeography of aquatic microbes.
Aquat Microb Ecol 2005, 41(1):39–48.31. Martiny JBH, Bohannan BJM, Brown JH, Colwell RK, Fuhrman JA, Green JL,
Horner-Devine MC, Kane M, Krumins JA, Kuske CR, et al: Microbialbiogeography: putting microorganisms on the map. Nat Rev Microbiol2006, 4(2):102–112.
32. Vyverman W, Verleyen E, Sabbe K, Vanhoutte K, Sterken M, Hodgson DA,Mann DG, Juggins S, Van de Vijver B, Jones V, et al: Historical processesconstrain patterns in global diatom diversity. Ecology 2007,88(8):1924–1931.
33. Fenchel T, Esteban GF, Finlay BJ: Local versus global diversity ofmicroorganisms: cryptic diversity of ciliated protozoa. Oikos 1997,80(2):220–225.
34. Stephenson SL, Schnittler M, Novozhilov YK: Myxomycete diversity anddistribution from the fossil record to the present. Biodivers Conserv 2008,17(2):285–301.
35. Wilson DS: Complex interactions in metacommunities, with implications forbiodiversity and higher levels of selection. Ecology 1992, 73:1984–2000.
36. Leibold MA, Holyoak M, Moquet N, Amarasekare P, Chase JM, Hoopes MF,Holt RD, Shurin JB, Law R, Tilman D, Loreau M, Gonzalez A: Themetacommunity concept: a framework for multi-scale communityecology. Ecol Lett 2004, 7:601–613.
37. Holyoak M, Leibold MA, Holt RD: Metacommunities: Spatial Dynamics andEcological Communities. Chicago, IL, USA: The University of Chicago Press; 2005.
38. Santangelo G, Lucchesi P: Spatial distribution pattern of ciliatedprotozoa in a Mediterranean interstitial environment. Aquat Microb Ecol1995, 9:47–54.
39. Albuquerque L, Taborda M, La Cono V, Yakimov M, da Costa MS: Natrinemasalaciae sp. nov., a halophilic archaeon isolated from the deep,hypersaline anoxic Lake Medee in the Eastern Mediterranean Sea.Syst Appl Microbiol 2012, 35(6):368–373.
40. Forster D, Behnke A, Stoeck T: Meta-analyses of environmental sequencedata identify anoxia and salinity as parameters shaping ciliatecommunities. Systematics and Biodiversity 2012, 10(3):277–288.
41. Lozupone CA, Knight R: Global patterns in bacterial diversity. Proc NatlAcad Sci U S A 2007, 104(27):11436–11440.
42. Logares R, Lindstrom ES, Langenheder S, Logue JB, Paterson H, Laybourn-Parry J, Rengefors K, Tranvik L, Bertilsson S: Biogeography of bacterialcommunities exposed to progressive long-term environmental change.ISME J 2013, 7(5):937–948.
43. Logares R, Brate J, Bertilsson S, Clasen JL, Shalchian-Tabrizi K, Rengefors K:Infrequent marine-freshwater transitions in the microbial world. TrendsMicrobiol 2009, 17(9):414–422.
44. Oren A, Larimer F, Richardson P, Lapidus A, Csonka LN: How to bemoderately halophilic with broad salt tolerance: clues from the genomeof Chromohalobacter salexigens. Extremophiles 2005, 9(4):275–279.
45. Ramos-Cormenzana A: Halophilic organisms and their environment. InGeneral and Applied Aspects of Halophilic Microorganisms. Edited byRodriguez-Valera F. New York: Plenum Press; 1991:15–24.
46. Pedros-Alio C, Calderon-Paz JI, MacLean MH, Medina G, Marrase C, Gasol JM,Guixa-Boixereu N: The microbial food web along salinity gradients. FEMSMicrobiol Ecol 2000, 32(2):143–155.
47. Koch TA, Ekelund F: Strains of the heterotrophic flagellate Bodo designisfrom different environments vary considerably with respect to salinitypreference and SSU rRNA gene composition. Protist 2005, 156(1):97–112.
48. Finlay BJ, Esteban GF, Brown S, Fenchel T, Hoef-Emden K: Multiplecosmopolitan ecotypes within a microbial eukaryote morphospecies.Protist 2006, 157(4):377–390.
49. Embley TM, Finlay BJ, Dyal PL, Hirt RP, Wilkinson M, Williams AG: MultipleOrigins of Anaerobic Ciliates with Hydrogenosomes within the Radiationof Aerobic Ciliates. Phil Trans Roy Soc Lond B Biol Sci 1995, 262(1363):87–93.
50. Hjort K, Goldberg AV, Tsaousis AD, Hirt RP, Embley TM: Diversity andreductive evolution of mitochondria among microbial eukaryotes. PhilTrans Roy Soc Lond B Biol Sci 2010, 365(1541):713–727.
51. Boxma B, de Graaf RM, van der Staay GWM, van Alen TA, Ricard G,Gabaldon T, van Hoek AHAM, der Staay SY M-v, Koopman WJH, van

Stock et al. BMC Microbiology 2013, 13:150 Page 14 of 15http://www.biomedcentral.com/1471-2180/13/150
Hellemond JJ, et al: An anaerobic mitochondrion that produceshydrogen. Nature 2005, 434(7029):74–79.
52. Fenchel T, Perry T, Thane A: Anaerobiosis and symbiosis with bacteria infree-living ciliates. J Eukaryot Microbiol 1977, 24:154–163.
53. van Hoek AH, van Alen TA, Sprakel VS, Leunissen JA, Brigge T, Vogels GD,Hackstein JH: Multiple acquisition of methanogenic archaeal symbiontsby anaerobic ciliates. Mol Biol Evol 2000, 17(2):251–258.
54. Edgcomb V, Orsi W, Breiner HW, Stock A, Filker S, Yakimov MM, Stoeck T:Novel active kinetoplastids associated with hypersaline anoxic basins inthe Eastern Mediterranean deep-sea. Deep-Sea Res I 2011, 58:1040–1048.
55. Stoeck T, Taylor GT, Epstein SS: Novel eukaryotes from the permanentlyanoxic Cariaco Basin (Caribbean Sea). Appl Environ Microbiol 2003,69(9):5656–5663.
56. Behnke A, Bunge J, Barger K, Breiner HW, Alla V, Stoeck T: Microeukaryotecommunity patterns along an O2/H2S gradient in a supersulfidic anoxicFjord (Framvaren, Norway). Appl Environ Microbiol 2006, 72(5):3626–3636.
57. Zuendorf A, Behnke A, Bunge J, Barger K, Stoeck T: Diversity estimates ofmicroeukaryotes below the chemocline of the anoxic Mariager Fjord,Denmark. FEMS Microbiol Ecol 2006, 58:476–491.
58. Stock A, Jurgens K, Bunge J, Stoeck T: Protistan diversity in suboxic andanoxic waters of the Gotland Deep (Baltic Sea) as revealed by 18S rRNAclone libraries. Aquat Microb Ecol 2009, 55(3):267–284.
59. Wylezich C, Jurgens K: Protist diversity in suboxic and sulfidic waters ofthe Black Sea. Environ Microbiol 2011, 13(11):2939–2956.
60. Casamayor EO, Garcia-Cantizano J, Pedros-Alio C: Carbon dioxide fixationin the dark by photosynthetic bacteria in sulfide-rich stratified lakes withoxic-anoxic interfaces. Limnol Oceanogr 2008, 53(4):1193–1203.
61. Oren A: Thermodynamic limits to microbial life at high saltconcentrations. Environ Microbiol 2011, 13(8):1908–1923.
62. Rengefors K, Logares R, Laybourn-Parry J: Polar lakes may act as ecologicalislands to aquatic protists. Mol Ecol 2012, 21(13):3200–3209.
63. Pernthaler J: Predation on prokaryotes in the water column and itsecological implications. Nat Rev Microbiol 2005, 3(7):537–546.
64. Yoon HS, Price DC, Stepanauskas R, Rajah VD, Sieracki ME, Wilson WH, Yang EC,Duffy S, Bhattacharya D: Single-cell genomics reveals organismal interactionsin uncultivated marine protists. Science 2011, 332(6030):714–717.
65. Coolen MJ: 7000 years of Emiliania huxleyi viruses in the Black Sea.Science 2011, 333(6041):451–452.
66. Miki T, Jacquet S: Complex interactions in the microbial world:underexplored key links between viruses, bacteria and protozoangrazers in aquatic environments. Aquat Microb Ecol 2008, 51(2):195–208.
67. Verity PG: Feeding in planktonic protozoans, evidence for non-randomacquisition of prey. J Protozool 1991, 38:69–76.
68. Yakimov MM, Giuliano L, Cappello S, Denaro R, Golyshin PN: Microbialcommunity of a hydrothermal mud vent underneath the deep-seaanoxic brine lake Urania (eastern Mediterranean). Orig Life Evol Biosph2007, 37(2):177–188.
69. Yakimov MM, La Cono V, Denaro R, D'Auria G, Decembrini F, Timmis KN,Golyshin PN, Giuliano L: Primary producing prokaryotic communities ofbrine, interface and seawater above the halocline of deep anoxic lakeL'Atalante, Eastern Mediterranean Sea. ISME J 2007, 1(8):743–755.
70. Beardsley C, Pernthaler J, Wosniok W, Amann R: Are Readily CulturableBacteria in Coastal North Sea Waters Suppressed by Selective GrazingMortality? Appl Environ Microbiol 2003, 69(5):2624–2630.
71. Matz C, Boenigk J, Arndt H, Jurgens K: Role of bacterial phenotypic traitsin selective feeding of the heterotrophic nanoflagellate Spumella sp.Aquat Microb Ecol 2002, 27(2):137–148.
72. Gonzalez JM, Sherr EB, Sherr BF: Size-Selective Grazing on Bacteria byNatural Assemblages of Estuarine Flagellates and Ciliates. Appl EnvironMicrobiol 1990, 56(3):583–589.
73. Simek K, Vrba J, Hartman P: Size-Selective Feeding by Cyclidium Sp onBacterioplankton and Various Sizes of Cultured Bacteria. FEMS MicrobiolEcol 1994, 14(2):157–167.
74. James JW: The founder effect and response to artificial selection.Genet Res 1970, 16(3):241–250.
75. Masel J: Genetic drift. Curr Biol 2011, 21(20):R837–R838.76. Fisher RA: The genetical theory of natural selection. Oxford: The Clarendon
Press; 1930.77. De Meester L, Gómez A, Okamura B, Schwenk K: The Monopolization
Hypothesis and the dispersal–gene flow paradox in aquatic organisms.Acta Oecol 2002, 23:121–135.
78. Urban MC, Leibold MA, Amarasekare P, De Meester L, Gomulkiewicz R,Hochberg ME, Klausmeier CA, Loeuille N, de Mazancourt C, Norberg J, et al:The evolutionary ecology of metacommunities. Trends Ecol Evol 2008,23(6):311–317.
79. Brate J, Logares R, Berney C, Ree DK, Klaveness D, Jakobsen KS, Shalchian-Tabrizi K: Freshwater Perkinsea and marine-freshwater colonizationsrevealed by pyrosequencing and phylogeny of environmental rDNA.ISME J 2010, 4(9):1144–1153.
80. Foissner W: Biogeography and dispersal of micro-organisms: A reviewemphasizing protists. Acta Protozool 2006, 45(2):111–136.
81. Garcia-Castellanos D, Estrada F, Jimenez-Munt I, Gorini C, Fernandez M,Verges J, De Vicente R: Catastrophic flood of the Mediterranean after theMessinian salinity crisis. Nature 2009, 462(7274):778–U796.
82. Whittaker RH: Classification of natural communities. Bot Rev 1962,28:1–239.
83. Lebrija-Trejos E, Perez-Garcia EA, Meave JA, Bongers F, Poorter L: Functionaltraits and environmental filtering drive community assembly in aspecies-rich tropical system. Ecology 2010, 91(2):386–398.
84. Humphreys WF, Watts CHS, Cooper SJB, Leijs R: Groundwater estuaries ofsalt lakes: buried pools of endemic biodiversity on the western plateau,Australia (vol 626, pg 79, 2009). Hydrobiologia 2009, 632(1):377.
85. Juan C, Guzik MT, Jaume D, Cooper SJ: Evolution in caves: Darwin's'wrecks of ancient life' in the molecular era. Mol Ecol 2010,19(18):3865–3880.
86. Leijs R, van Nes EH, Watts CH, Cooper SJB, Humphreys WF, Hogendoorn K:Evolution of Blind Beetles in Isolated Aquifers: a Test of AlternativeModes of Speciation. PLoS One 2012, 7(3):e34260.
87. Leys R, Watts CH, Cooper SJ, Humphreys WF: Evolution of subterraneandiving beetles (Coleoptera: Dytiscidae: Hydroporini, Bidessini) in the aridzone of Australia. Evolution 2003, 57(12):2819–2834.
88. Degens ET, Ross AT: Hot Brines and Recent Heavy Metal Deposits in the RedSea. A Geochemical and Geophysical Account. Berlin/Heidelberg/New York:Springer; 1969.
89. Shokes RF, Trabant PK, Presley BJ, Reid DF: Anoxic, hypersaline basin in thenorthern gulf of Mexico. Science 1977, 196(4297):1443–1446.
90. Nebel ME, Wild S, Holzhauser M, Huttenberger L, Reitzig R, Sperber M,Stoeck T: JAGUC–a software package for environmental diversityanalyses. J Bioinform Comput Biol 2011, 9(6):749–773.
91. Behnke A, Engel M, Christen R, Nebel M, Klein RR, Stoeck T: Depicting moreaccurate pictures of protistan community complexity usingpyrosequencing of hypervariable SSU rRNA gene regions.Environ Microbiol 2011, 13(2):340–349.
92. Dunthorn M, Klier J, Bunge J, Stoeck T: Comparing the Hyper-Variable V4and V9 Regions of the Small Subunit rDNA for Assessment of CiliateEnvironmental Diversity. J Eukaryot Microbiol 2012, 59(2):185–187.
93. Kunin V, Engelbrektson A, Ochman H, Hugenholtz P: Wrinkles in the rarebiosphere: pyrosequencing errors can lead to artificial inflation ofdiversity estimates. Environ Microbiol 2010, 12(1):118–123.
94. Whittaker RH: Evolution and measurements of species diversity.Taxon 1972, 21:213–251.
95. Team RC: R: A language and environment for statistical computing. Vienna,Austria: R Foundation for Statistical Computing; 2012. http://www.R-project.org/. ISBN 3-900051-07-0.
96. Shannon CE: A mathematical theory of communication. The Bell SystemTechnical Journal 1948, 27:379–423. 623–656.
97. Chao A, Lee SM, Jeng SL: Estimating population size for capture-recapture data when capture probabilities vary by time and individualanimal. Biometrics 1992, 48(1):201–216.
98. Colwell RK: EstimateS: Statistical estimation of species richness and sharedspecies from samples. Version 8.2. User's Guide and application; 2009. http://viceroy.eeb.uconn.edu/estimates.
99. Bray RJ, Curtis JT: An ordination of the upland forest communities ofsouthern Wisconsin. Ecol Monogr 1957, 27:325–349.
100. Magurran AE: Measuring biological diversity. Oxford: Blackwell Publishing; 2004.101. Sinnott RW: Virtues of the Haversine. Sky Telescope 1984, 68:1–159.102. Grant A, Ogilvie LA: Terminal restriction fragment length polymorphism data
analysis. Appl Environ Microbiol 2003, 69(10):6342. author reply 6342–6343.103. Edgcomb V, Leadbeater ER, Bourland W, Beaudoin D, Bernhard JM:
Structured multiple endosymbiosis of bacteria and archaea in a ciliatefrom marine sediments: a survival mechanism in low oxygen, sulfidicsediments? Front Microb Physiol Metabol 2011, 2:55.

Stock et al. BMC Microbiology 2013, 13:150 Page 15 of 15http://www.biomedcentral.com/1471-2180/13/150
104. Stoeck T, Fowle WH, Epstein SS: Methodology of protistan discovery: fromrRNA detection to quality scanning electron microscope images.Appl Environ Microbiol 2003, 69(11):6856–6863.
105. Lara E, Berney C, Harms H, Chatzinotas A: Cultivation-independent analysisreveals a shift in ciliate 18S rRNA gene diversity in a polycyclic aromatichydrocarbon-polluted soil. FEMS Microbiol Ecol 2007, 62(3):365–373.
doi:10.1186/1471-2180-13-150Cite this article as: Stock et al.: Evidence for isolated evolution of deep-sea ciliate communities through geological separation andenvironmental selection. BMC Microbiology 2013 13:150.
Submit your next manuscript to BioMed Centraland take full advantage of:
• Convenient online submission
• Thorough peer review
• No space constraints or color figure charges
• Immediate publication on acceptance
• Inclusion in PubMed, CAS, Scopus and Google Scholar
• Research which is freely available for redistribution
Submit your manuscript at www.biomedcentral.com/submit