every man for himself: gender, norms and survival in maritime
TRANSCRIPT

Department of EconomicsWorking Paper 2012:8
Every man for himselfGender, Norms and Survival in Maritime Disasters
Mikael Elinder and Oscar Erixson

Department of Economics Working paper 2012:8Uppsala University April 2012P.O. Box 513 ISSN 1653-6975 SE-751 20 UppsalaSwedenFax: +46 18 471 14 78
Every man for himselfGender, Norms and Survival in Maritime Disasters
Mikael Elinder and Oscar Erixson
Papers in the Working Paper Series are published on internet in PDF formats. Download from http://www.nek.uu.se or from S-WoPEC http://swopec.hhs.se/uunewp/

1
Every man for himself
Gender, Norms and Survival in Maritime Disasters*
Mikael Elinder, Oscar Erixson
April 10, 2012
Abstract
Since the sinking of the Titanic, there has been a widespread belief that the social norm of
‘women and children first’ gives women a survival advantage over men in maritime disasters,
and that captains and crew give priority to passengers. We analyze a database of 18 maritime
disasters spanning three centuries, covering the fate of over 15,000 individuals of more than
30 nationalities. Our results provide a new picture of maritime disasters. Women have a
distinct survival disadvantage compared to men. Captains and crew survive at a significantly
higher rate than passengers. We also find that the captain has the power to enforce normative
behavior, that the gender gap in survival rates has declined, that women have a larger
disadvantage in British shipwrecks, and that there seems to be no association between
duration of a disaster and the impact of social norms. Taken together, our findings show that
behavior in life-and-death situation is best captured by the expression ‘Every man for
himself’.
Key words: Social norms, Disaster, Women and children first, Mortality, High stakes
JEL Codes: C70, D63, D81, J16
Mikael Elinder: Uppsala Center for Fiscal Studies, Department of Economics, Uppsala
University and the Research Institute of Industrial Economics (IFN), Stockholm
Oscar Erixson: Uppsala Center for Fiscal Studies, Department of Economics, Uppsala
University
Corresponding author: Mikael Elinder, Department of Economics, Uppsala University, P.O.
Box 513, SE-751 20 Uppsala, Sweden, email: [email protected], phone: +46 18 471
15 65, fax: +46 18 471 14 78
*We would like to thank Niclas Berggren, Che-Yuan Liang, Henry Ohlsson, Erik Spector,
Benno Torgler, Daniel Waldenström, as well as seminar participants at Department of
Economics, Uppsala University, IFN; Stockholm, for valuable comments and suggestions.
We are grateful to Sebastian Escobar for excellent research assistance. Financial support from
the Jan Wallander and Tom Hedelius Foundations and the Swedish Council for Working Life
and Social Research is gratefully acknowledged.
2
Introduction
On April 15, 2012, a century has passed since RMS Titanic sank in the North Atlantic
Ocean. The Titanic disaster has generated immense public and scholarly interest, and as one
of the most extensively covered events in history obtained an almost mythological status. The
evacuation of the Titanic serves as the prime example of chivalry at sea. Men stood back,
while women and children were given priority to board the lifeboats. In the end, 70% of the
women and children were saved compared to only 20% of the men (Hall, 1986). The social
norm of saving ‘women and children first’ (WCF) in shipwrecks has often been referred to as
the ‘unwritten law of the sea’.
It is well known that social norms of fairness and cooperation influence human
behavior in a wide range of situations.1 For instance, charitable giving, and donation of blood
and organs is widespread (Andreoni, 2006; List, 2011; Thorne, 2006). Men and women are,
however, subject to different norms of helping behavior (Eagly and Crowley, 1986). Men are
in general expected to help people in emergencies, while women are, to a higher degree
expected to engage in care over the long-term. The expectation of men to display chivalry and
heroism in maritime disasters can be seen as an archetypal example of gender differences in
norms of helping behavior. Men displaying extreme altruism in disasters contrast the picture
of men being more selfish than women.2
Rational individuals, whether with self-regarding or other-regarding preferences,
compare the benefits and costs of helping. When helping substantially increases the risk of
dying, it would be rational for most individuals to save themselves rather than helping others.
This cost-benefit logic is fundamental in economic models of human behavior, including
models in which individuals choose to comply with or violate social norms for instance by
committing crimes (Becker, 1968).
Maritime disasters provide a valuable context in which it is possible to empirically
investigate how people act and organize behavior in life-and-death situations and, in
particular, if norms of helping behavior are being upheld. However, so far, only the
shipwrecks of the Titanic and the Lusitania have been analyzed with respect to gender and
survival (Folkesson, 2005; Frey et al., 2010, 2011; Gleicher and Stevans, 2004; Hall, 1986). It
has been concluded that the men on board the Titanic followed the norm of WCF (Frey et al.,
2010, 2011). Based on a comparison of the Titanic and the Lusitania (where the former sank
in 160 and the latter in less than 20 minutes) a conjecture has been suggested to the effect that
norm compliance is more pronounced in disasters that evolve slowly (Frey et al., 2010, 2011).
Do women normally have a survival advantage in maritime disasters, or was the
evacuation of the Titanic an exception? What situational and cultural conditions determine
who survives and who dies? And what role does the captain play?
To address these questions, we have compiled and analyzed a database of 18 maritime
disasters over the period 1852–2011. Starting from the list Some Notable Shipwrecks since
1854, published in the 140th
Edition of The World Almanac and the Book of Facts (Joyce,
2007), we have selected shipwrecks involving passenger ships, that have occurred in times of
peace, and for which there are passenger and crew list containing information on the gender
of survivors and decedents separately. We have added data for one shipwreck occurring
before 1854, HMS Birkenhead (1852), since the Birkenhead is often referred to as giving rise
to the expression ‘women and children first’. Data for two shipwrecks that have taken place
after year 2006 are added: MS Princess of the Stars (2008) and MV Bulgaria (2011). Despite
1 See for instance Elster (1989) and Ostrom (2000).
2 For a review of the literature on gender differences in experiments see Croson and Gneezy (2009).

3
it being a wartime disaster we also include data from Lusitania (1915) in the sample as it has
been investigated in previous research. Our data cover the fate of over 15,000 passengers and
crew members of more than 30 different nationalities. Table 1 gives an overview of the
shipwrecks in the database. For details about selection of shipwrecks, see Appendix A, and
for details of each disaster, see Appendix B.
Six hypotheses are tested. The first and main hypothesis (H1) is that women have a
survival advantage over men in maritime disasters. Previous research on the Titanic has
found, in line with the notion of WCF, that women have a survival advantage over men. There
are, however, several reasons to believe that men have better survival prospects than women,
if they do not engage in self-sacrificing helping behavior. The most important argument
would be that men are physically stronger than women. In the evacuation of a sinking ship,
success is typically determined by the ability to move fast through corridors and stairs, which
is often made difficult by heavy list, congestion and debris. Other traits that may enhance
survival prospects, such as aggressiveness, competitiveness and swimming ability, are also
more prevalent in men (Croson and Gneezy, 2009; Mazur and Booth, 1998; Niederle and
Vesterlund, 2007; Taylor et al., 2000) while for example resistance to cold water (McArdle et
al., 1984; Mcardle et al., 1992; Rivers, 1982) may benefit either sex. Accordingly, if men try
to save themselves, we expect women to have a relative survival disadvantage. On the other
hand, if men comply with the norm of WCF, we would expect women to have a survival
advantage over men. Evidence from the Lusitania disaster indicate no statistically significant
difference in survival rates between men and women (Frey et al., 2010, 2011).
Table 1: Maritime disasters from 1852 to 2011. Duration refers to the time period between the first
indication of distress and the sinking. Quick (Slow) implies that the time period was shorter (longer)
than 30 minutes. WCF order indicates if the captain gave the WCF order.
Name of ship Year
Cause of
disaster Water Nationality Duration
WCF:
order Casualties Survivors
HMS Birkenhead 1852 Grounding Indian Ocean, RSA British Quick Yes 365 191
SS Arctic 1854 Collision North Atlantic, CAN US Slow Yes 227 41
SS Golden Gate 1862 Fire Pacific Ocean, MEX US Slow No 206 172
SS Northfleet 1873 Collision English Channel, UK British Quick Yes 287 80
RMS Atlantic 1873 Grounding North Atlantic, CAN British Slow No 538 330
SS Princess Alice 1878 Collision River Thames, UK British Quick No 697 140
SS Norge 1904 Grounding North Atlantic, UK Danish Quick No 635 160
RMS Titanic 1912 Collision North Atlantic, CAN British Slow Yes 1,496 712
RMS Empress of Ireland 1914 Collision St Lawrence River, CAN British Quick No 983 465
RMS Lusitania 1915 Torpedoed North Atlantic, UK British Quick Yes 1,190 768
SS Principessa Mafalda 1927 Technical Atlantic Ocean, BRZ Italian Slow No 309 877
SS Vestris 1928 Weather Atlantic Ocean, USA British Slow No 125 183
SS Morro Castle 1934 Fire Atlantic Ocean, USA US Slow No 130 412
MV Princess Victoria 1953 Weather North Channel, UK British Slow No 135 44
SS Admiral Nakhimov 1986 Collision Black Sea, UKR Russian Quick No 423 820
MS Estonia 1994 Technical Baltic Sea, FIN Estonian Slow No 852 137
MS Princess of the Stars 2008 Weather Philippine Sea, PHI Philippine Slow Unknown 791 59
MV Bulgaria 2011 Weather Volga, RUS Russian Quick Unknown 110 76

4
As a second hypothesis (H2), we posit that crew members have a survival
disadvantage over passengers. According to maritime conventions, it is the duty of crew
members – and in particular the captain – to conduct a safe evacuation of the ship
(International Maritime Organization, 2004). If the crew follow procedures and leave the ship
after the passengers, we expect them to suffer a survival disadvantage compared to
passengers. Yet, crew members are familiar with the ship, often have emergency training and
are likely to receive early information about the severity of the situation. We, therefore,
expect them to have a relative survival advantage if they try to save themselves rather than
assisting the passengers. Evidence from the Titanic suggests that crew members indeed have a
significant survival advantage over passengers (Frey et al., 2011).
The third hypothesis (H3) is that women fare better in shipwrecks, in which the
captain orders WCF, than when no such orders are given. The potentially important role of the
captain has largely been overseen in previous studies. Evidence of people helping each other
is not necessarily evidence of other-regarding preferences or social norms governing
behavior. It has been shown, both theoretically and experimentally, that people who would
not otherwise do so, may comply with a social norm if violation is threatened with
punishment (Fehr and Fischbacher, 2003, 2004; Fehr and Schmidt, 1999). Unlike other types
of catastrophes, e.g. earthquakes, tsunamis and terrorist attacks, a maritime disaster is
characterized by the presence of a well-defined leader. On board a ship, the captain is the
commanding officer with the supreme power to give and enforce orders. In the evacuation of
the Titanic, the captain ordered ‘women and children first’ (Great Britain. Commissioner of
Wrecks, 1912) and officers were reported to have shot at men who disobeyed the order
(Chapman, 2001). The situation on the Titanic resonates with the situation in a Third-Party
Punishment Game (TPPG), in which threat of punishment is necessary for self-regarding
players to transfer resources to others (Fehr and Fischbacher, 2004). Similar to the TPPG, in
which punishment is costly, the WCF order comes at a cost for the captain, because with the
order he agrees to remain on board the ship until all women and children have been rescued.
When the captain does not order priority to women, the situation resembles the allocation
problem of a standard Dictator Game (Forsythe et al., 1994; Kahneman et al., 1986), in which
self-regarding players comply with norms only if the cost of the social stigma of violation
exceeds the cost of compliance.
While norms vary over time and space, it has been a grand challenge for scientists to
understand when, where or how norms develop, strengthen or wane (Camerer and Fehr, 2006;
Henrich et al., 2001; Ostrom et al., 1992). It is possible that chivalry at sea was a common
phenomenon in the 19th
and early 20th
century and that the fates of women were determined
by men. With the rise of more gender-equal societies, however, women may have become
more capable of surviving on their own. For instance, improved swimming skills as well as
less restrictive clothing may have increased the survival prospects of women. World War I
has been seen as a paradigmatic shift in the general view of manliness and the role of women
in society (Delap, 2006). The fourth hypothesis (H4) is that the survival difference between
men and women is lower after World War I.
Helping behaviors differ between cultures (Henrich et al., 2001). Such differences
may be present in maritime disasters involving ships with passengers and crew of different
nationalities. Previous research on gender differences in survival has focused solely on British
shipwrecks. Chivalry at sea has been seen as a defining characteristic of Britishness (Delap,
2006). If the expected stigma of norm violation is more severe for British men than for men of
other nationalities, we expect higher compliance with the WCF norm on board British ships.
The captains are British on all British ships in our sample, likewise crew and passengers are
dominated by Brits on these ships. Our fifth hypothesis (H5) is that women have a greater

5
survival advantage over men in maritime disasters involving British ships, than in shipwrecks
of other nationalities.
It has also been suggested that time is of critical importance for norms to guide
behavior (Frey et al., 2011). When a ship sinks quickly, human actions are driven by
hormonal reactions, such as a rapid increase of adrenaline, and selfish behavior should
dominate. Evidence in favor of this argument rests on a comparison of the Titanic and the
Lusitania disaster. The Titanic sank in 160 minutes while the Lusitania sank in less than 20
minutes. The sixth and final hypothesis (H6) is that the gender difference in survival rates is
smaller when a ship sinks in less than 30 minutes, than if it takes longer.
Data
Because the hypotheses have been derived mainly from evidence from the Titanic
disaster (and to some extent from the Lusitania), we focus on the 16 previously uninvestigated
shipwrecks, data that we label as our main sample (MS). We denote the full sample including
all shipwrecks in our data FS. Figure 1 displays that, in the MS, crew members have the
highest survival rate, followed by captains and male passengers, while the lowest survival
rates are observed for women and children.3 This pattern stands in sharp contrast to the
pattern observed for the Titanic, suggesting that evidence from the Titanic is not
representative of maritime disasters in general.
Figure 1. Survival rates of passengers and crew (survival rates of children is only available
for 9 shipwrecks in MS).
3 See Appendix C for a description of the data underlying Figure 1.
0
10
20
30
40
50
60
70
80
Crew Captain PassengerMale
PassengerFemale
PassengerChildren
Surv
ival
rat
e in
%
Crew and Passenger Categories
MS
Titanic

6
Method
We test the hypotheses (H1–H6) by estimating linear probability models. We analyze
the shipwrecks both individually and jointly. Individual analyses of the shipwrecks only allow
us to test H1 and H2. The advantage of these tests, however, is that they are methodologically
comparable to previous tests conducted on data from the Titanic and the Lusitania. The joint
analyses of all shipwrecks make it possible to control for shipwreck specific circumstances
and to test all 6 hypotheses. The unit of analysis is the individual passenger or crew member.
The dependent variable (Survival) is binary and equals one if the person survived the disaster
and zero if the person died. The independent variable of main interest is the binary variable
Female (females=1, males=0). A positive (negative) coefficient implies that women have a
higher (lower) survival rate than men. Crew status is indicated by the binary variable Crew
(crew=1, passengers=0). For further details on coding and data sources, see Appendix A.
Results
In the separate analyses, of all of the shipwrecks (FS), we regress Survival on Female.
In addition, we also control for Crew and other individual-level characteristics as well as
estimate the coefficients with probit models (Detailed results available in Appendix C, Table
C3). If women are given preferential treatment, we expect their survival rate to be at least as
high as that of men (H1). We find that women have a survival advantage (p<0.01) over men,
in only 2 out of the 18 disasters: the Birkenhead and the Titanic. Notably, the wreck of the
Birkenhead in 1852 gave rise to the notion of WCF; a notion that became widespread first
after the sinking of the Titanic (Delap, 2006). For 11 of the shipwrecks, we find that women
have a survival disadvantage compared to men (p<0.01). For the 5 remaining shipwrecks we
find no clear evidence of survival differences between men and women. If crew members try
to save themselves rather than assisting the passengers, we expect them to have a survival
advantage over passengers (H2). Indeed, we find that crew members have a relative survival
advantage (p<0.01) in 9 out of the 18 disasters. For the 9 remaining shipwrecks we find no
clear evidence of survival differences between crew and passengers.
To take full advantage of the data, we present results from analyses, including all
shipwrecks of the MS, in each regression. To control for unobservable differences that vary
between the ships, but affect everybody on board each ship equally, such as the severity of the
disaster, we augment the regressions with shipwreck specific effects. For results of samples
including the Titanic and the Lusitania, see Appendix C.
Table 2 reports tests of each of the 6 hypotheses conducted in separate regressions, as
well as together in one regression. We find that the survival rate of women is 16.7 percentage
points lower than, or about half of (17.8% vs. 34.5%), that of men. The results also show that
crew members are 18.7 percentage points more likely to survive than passengers. The finding
that women have a survival disadvantage compared to men, and that crew members have a
survival advantage over passengers, holds even with the inclusion of data from the Titanic and
the Lusitania.
We find some evidence that the survival rate of women is higher when the captain
orders WCF, compared to when no such order has been given. Since the WCF order was
given only on 5 ships, including the Titanic and the Lusitania, MS is not ideal for testing this
hypothesis. Nevertheless, the joint, and most reliable, test of the six hypotheses indicates that
the survival rate of women is 7.3 percentage points higher in shipwrecks in which the order
has been given. The result is strengthened when the Titanic and Lusitania are included in the
analysis.

7
The survival rates of both men and women are higher in shipwrecks occurring after
WWI. The gender gap in survival has decreased by about one-third compared to before WWI.
This finding holds even with the inclusion of data from the Lusitania and the Titanic.
In contrast to the hypothesis, women fare worse, not better, in shipwrecks involving
British ships. On average, the survival rate of women on board British ships is 13.9–15.3
percentage points lower than in disasters involving ships of other nationalities. This finding
holds even with the inclusion of data from the Lusitania and the Titanic. We note that the
WCF order is given more often on board British ships. However, even when controlling for if
the WCF order has been given, we find a larger survival disadvantage for women on British
dominated ships.
Finally, the results give no support for the hypothesis that the gender difference in
survival rates is smaller when a ship sinks in less than 30 minutes than when the disaster
evolves more slowly. Women have a disadvantage independently of whether the ship sinks
quickly or slowly.
Table 2. Linear probability models for survival. Coefficients are followed by p-values, based
on robust standard errors, in parentheses. All models include shipwreck specific fixed effects.
Main hypothesis tested
H1 H2 H3* H4* H5* H6* H1–H6*
Female
-0.167
(<0.001)
-0.126
(<0.001)
-0.151
(<0.001)
-0.195
(<0.001)
-0.093
(<0.001)
-0.145
(<0.001)
-0.151
(<0.001)
Crew
0.187
(<0.001)
0.157
(<0.001)
0.158
(<0.001)
0.159
(<0.001)
0.157
(<0.001)
0.160
(<0.001)
Female
interacted with:
0.019
(0.477)
0.072
(0.016)
WCF order
Post WWI
0.085
(<0.001)
0.053
(0.071)
British ship
-0.153
(<0.001)
-0.139
(<0.001)
Quick
-0.009
(0.663)
0.032
(0.195)
Constant
0.346
(<0.001)
0.325
(<0.001)
0.244
(<0.001)
0.329
(<0.001)
0.435
(<0.001)
0.179
(<0.001)
0.457
(<0.001)
Observations; R2 10,978 10,976 10,976 10,976 10,976 10,976 10,976
R-squared 0.249 0.270 0.242 0.244 0.247 0.242 0.247
*These regressions also include the binary indicators which the female variable is interacted with. Since WCF
order, Post WWI, Quick, and British ship do not vary within ships, observations in these regressions are
weighted by the inverse of the number of individuals on board the ship to give all ships equal weight. Complete
regression results, as well as results based on unweighted regressions, and regressions including the Titanic and
the Lusitania can be found in Appendix C, Table C4–C11.
8
Discussion
Our results provide new insights about human behavior in life-and-death situations.
By investigating a new and much larger sample of maritime disasters than has previously
been done, we show that women have a substantially lower survival rate than men. That
women fare worse than men has been documented also for natural disasters (Frankenberg et
al., 2011; Ikeda, 1995; MacDonald, 2005; Neumayer and Plümper, 2007; Oxfam
International, 2005). We also find that crew members have a higher survival rate than
passengers and that only 7 out of 16 captains went down with their ship. Children appear to
have the lowest survival rate. Moreover, we shed light on some common perceptions of how
situational and cultural conditions affect the survival of women. Most notably, we find that it
seems as if it is the policy of the captain, rather than the moral sentiments of men, that
determines if women are given preferential treatment in shipwrecks. This suggests an
important role for leaders in disasters. Preferences of leaders seem to have affected survival
patterns also in the evacuations of civilians during the Balkan Wars (Carpenter, 2003).
Moreover, we find that the gender gap in survival rates has decreased since WWI. This
supports previous findings that higher status of women in society improves their relative
survival rates in disasters (Neumayer and Plümper, 2007). We also show that women fare
worse, rather than better, in maritime disasters involving British ships. This contrasts with the
notion of British men being more gallant than men of other nationalities. Finally, in contrast
to previous studies, we find no association between duration of the disaster and the influence
of social norms. Based on our analysis, it becomes evident that the sinking of the Titanic was
exceptional in many ways and that what happened on the Titanic seems to have spurred
misconceptions about human behavior in disasters.

9
References
Andreoni, J., 2006. Chapter 18 Philanthropy, in: Kolm, S.-C., Ythier, J.M. (Eds.), Handbook
on the Economics of Giving, Reciprocity and Altruism. Elsevier, pp. 1201-1269.
Becker, G.S., 1968. Crime and Punishment: An Economic Approach. Journal of Political
Economy 76, 169-217.
Camerer, C.F., Fehr, E., 2006. When does "economic man" dominate social behavior?
Science 311, 47-52.
Carpenter, R.C., 2003. 'Women and Children First': Gender, Norms, and Humanitarian
Evacuation in the Balkans 1991-95. International Organization 57, 661-694.
Chapman, E., 2001. Gunshots on the Titanic.
Croson, R., Gneezy, U., 2009. Gender Differences in Preferences. Journal of Economic
Literature 47, 448-474.
Delap, L., 2006. 'Thus Does Man Prove His Fitness to Be the Master of Things': Shipwrecks,
Chivalry and Masculinities in Nineteenth- and Twentieth-Century Britain. Cultural and Social
History 3, 45-74.
Eagly, A.H., Crowley, M., 1986. Gender and Helping Behavior: A Meta-Analytic Review of
the Social Psychological Literature. [Review]. Psychological Bulletin 100, 283-308.
Elster, J., 1989. Social Norms and Economic Theory. The Journal of Economic Perspectives
3, 99-117.
Fehr, E., Fischbacher, U., 2003. The nature of human altruism. Nature 425, 785-791.
Fehr, E., Fischbacher, U., 2004. Third-party punishment and social norms. Evolution and
Human Behavior 25, 63-87.
Fehr, E., Schmidt, K.M., 1999. A Theory of Fairness, Competition, and Cooperation. The
Quarterly Journal of Economics 114, 817-868.
Folkesson, P., 2005. Katastrofer och män: Explorativa undersökningar av ett komplext
förhållande, Institutionen för socialt arbete. Göteborgs universitet, p. 243.
Forsythe, R., Horowitz, J.L., Savin, N.E., Sefton, M., 1994. Fairness in Simple Bargaining
Experiments. Games and Economic Behavior 6, 347-369.
Frankenberg, E., Gillespie, T., Preston, S., Sikoki, B., Thomas, D., 2011. Mortality, The
Family and The Indian Ocean Tsunami*. The Economic Journal 121, F162-F182.
Frey, B.S., Savage, D.A., Torgler, B., 2010. Interaction of natural survival instincts and
internalized social norms exploring the Titanic and Lusitania disasters. Proceedings of the
National Academy of Sciences of the United States of America 107, 4862-4865.
Frey, B.S., Savage, D.A., Torgler, B., 2011. Behavior under Extreme Conditions:
TheTitanicDisaster. Journal of Economic Perspectives 25, 209-222.
Gleicher, D., Stevans, L.K., 2004. Who Survived Titanic? A Logistic Regression Analysis.
International Journal of Maritime History 16, 61-94
Great Britain. Commissioner of Wrecks, 1912. Formal investigation into the loss of the S.S.
"Titanic": evidence, appendices, and index. H.M.S.O.
Hall, W., 1986. Social class and survival on the S.S. Titanic. Social Science & Medicine 22,
687-690.

10
Henrich, J., Boyd, R., Bowles, S., Camerer, C., Fehr, E., Gintis, H., McElreath, R., 2001. In
Search of Homo Economicus: Behavioral Experiments in 15 Small-Scale Societies. The
American Economic Review 91, 73-78.
Ikeda, K., 1995. Gender Differences in Human Loss and Vulnerability in Natural Disasters: A
Case Study from Bangladesh. Indian Journal of Gender Studies 2, 171-193.
International Maritime Organization, 2004. SOLAS: consolidated edition, 2004 : consolidated
text of the International Convention for the Safety of Life at Sea, 1974, and its Protocol of
1988 : articles, annexes and certificates : incorporating all amendments in effect from 1
January 2004. International Maritime Organization.
Joyce, C.A., 2007. The World Almanac and Book of Facts 2008. World Almanac Books.
Kahneman, D., Knetsch, J.L., Thaler, R., 1986. Fairness as a Constraint on Profit Seeking:
Entitlements in the Market. The American Economic Review 76, 728-741.
List, J.A., 2011. The Market for Charitable Giving. Journal of Economic Perspectives 25,
157-180.
MacDonald, R., 2005. How Women Were Affected by the Tsunami: A Perspective from
Oxfam. PLoS Med 2, e178.
Mazur, A., Booth, A., 1998. Testosterone and dominance in men. Behavioral and Brain
Sciences 21, 353-363.
McArdle, W.D., Magel, J.R., Gergley, T.J., Spina, R.J., Toner, M.M., 1984. Thermal
adjustment to cold-water exposure in resting men and women. Journal of Applied Physiology
56, 1565-1571.
Mcardle, W.D., Toner, M.M., Magel, J.R., Spina, R.J., Pandolf, K.B., 1992. Thermal
Responses of Men and Women during Cold-Water Immersion - Influence of Exercise
Intensity. European Journal of Applied Physiology and Occupational Physiology 65, 265-270.
Neumayer, E., Plümper, T., 2007. The Gendered Nature of Natural Disasters: The Impact of
Catastrophic Events on the Gender Gap in Life Expectancy, 1981-2002. Annals of the
Association of American Geographers 97, 551-566.
Niederle, M., Vesterlund, L., 2007. Do Women Shy Away From Competition? Do Men
Compete Too Much? The Quarterly Journal of Economics 122, 1067-1101.
Ostrom, E., 2000. Collective Action and the Evolution of Social Norms. The Journal of
Economic Perspectives 14, 137-158.
Ostrom, E., Walker, J., Gardner, R., 1992. Covenants With and Without a Sword: Self-
Governance is Possible. The American Political Science Review 86, 404-417.
Oxfam International, 2005. The tsunami’s impact on women, Briefing Note. Oxfam
International, Oxford, U.K.
Rivers, J.P.W., 1982. Women and Children Last - an Essay on Sex-Discrimination in
Disasters. Disasters 6, 256-267.
Taylor, S.E., Klein, L.C., Lewis, B.P., Gruenewald, T.L., Gurung, R.A.R., Updegraff, J.A.,
2000. Biobehavioral responses to stress in females: Tend-and-befriend, not fight-or-flight.
Psychological Review 107, 411-429.
Thorne, E.D., 2006. Chapter 20 The Economics of organ transplantation, in: Kolm, S.-C.,
Ythier, J.M. (Eds.), Handbook on the Economics of Giving, Reciprocity and Altruism.
Elsevier, pp. 1335-1370.

1
Appendix to
Every man for himself! Gender, norms and survival in maritime disasters
April 2, 2012
Mikael Elinder: Uppsala Center for Fiscal Studies, Department of Economics, Uppsala
University and the Research Institute of Industrial Economics (IFN), Stockholm
Oscar Erixson: Uppsala Center for Fiscal Studies, Department of Economics, Uppsala
University
Corresponding author: Mikael Elinder, Department of Economics, Uppsala University, P.O.
Box 513, SE-751 20 Uppsala, Sweden, email: [email protected], phone: +46 18 471
15 65, fax: +46 18 471 14 78
2
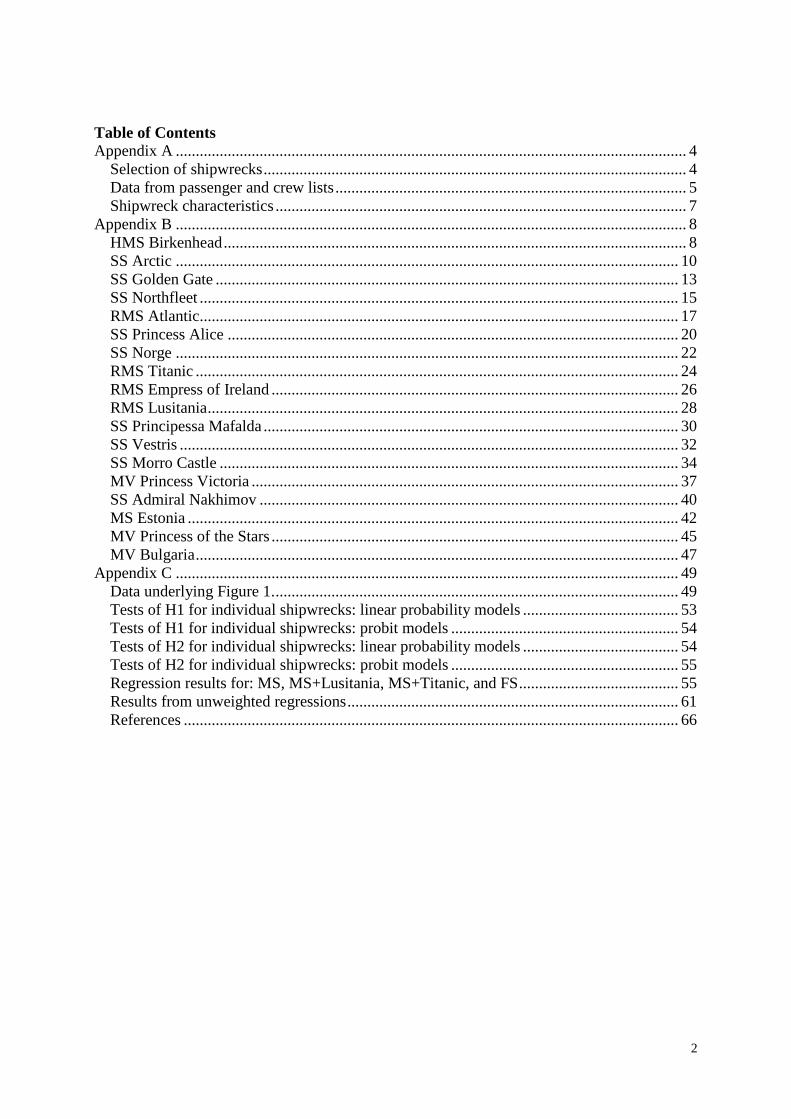
Table of Contents Appendix A ................................................................................................................................ 4
Selection of shipwrecks .......................................................................................................... 4 Data from passenger and crew lists ........................................................................................ 5 Shipwreck characteristics ....................................................................................................... 7
Appendix B ................................................................................................................................ 8 HMS Birkenhead .................................................................................................................... 8
SS Arctic .............................................................................................................................. 10 SS Golden Gate .................................................................................................................... 13 SS Northfleet ........................................................................................................................ 15
RMS Atlantic ........................................................................................................................ 17 SS Princess Alice ................................................................................................................. 20 SS Norge .............................................................................................................................. 22 RMS Titanic ......................................................................................................................... 24 RMS Empress of Ireland ...................................................................................................... 26
RMS Lusitania ...................................................................................................................... 28 SS Principessa Mafalda ........................................................................................................ 30 SS Vestris ............................................................................................................................. 32
SS Morro Castle ................................................................................................................... 34 MV Princess Victoria ........................................................................................................... 37 SS Admiral Nakhimov ......................................................................................................... 40
MS Estonia ........................................................................................................................... 42
MV Princess of the Stars ...................................................................................................... 45 MV Bulgaria ......................................................................................................................... 47
Appendix C .............................................................................................................................. 49
Data underlying Figure 1. ..................................................................................................... 49 Tests of H1 for individual shipwrecks: linear probability models ....................................... 53
Tests of H1 for individual shipwrecks: probit models ......................................................... 54 Tests of H2 for individual shipwrecks: linear probability models ....................................... 54 Tests of H2 for individual shipwrecks: probit models ......................................................... 55 Regression results for: MS, MS+Lusitania, MS+Titanic, and FS ........................................ 55
Results from unweighted regressions ................................................................................... 61
References ............................................................................................................................ 66

3
List of Tables
Table A1: Availability of individual level data ...................................................................... 6 Table B1: Survival patterns in the HMS Birkenhead disaster .......................................... 10 Table B2: Survival patterns in the SS Arctic disaster ........................................................ 12
Table B3: Survival patterns in the SS Golden Gate disaster ............................................. 14 Table B4: Survival patterns in the SS Northfleet disaster ................................................. 16 Table B5: Survival patterns in the SS Atlantic disaster ..................................................... 19 Table B6: Survival patterns in the SS Princess Alice disaster ........................................... 21 Table B7: Survival patterns in the SS Norge disaster ......................................................... 23
Table B8: Survival patterns in the RMS Titanic disaster .................................................. 25 Table B9: Survival patterns in the SS Empress of Ireland disaster .................................. 27
Table B10: Survival patterns in the RMS Lusitania disaster ............................................ 29 Table B11: Survival patterns in the SS Principessa Mafalda disaster .............................. 31 Table B12: Survival patterns in the SS Vestris disaster ..................................................... 33 Table B13: Survival patterns in the SS Morro Castle disaster .......................................... 36 Table B14: Survival patterns in the SS Princess Victoria disaster ................................... 39
Table B15: Survival patterns in the MS Admiral Nakhimov disaster .............................. 41 Table B16: Survival patterns in the MS Estonia disaster ................................................... 44 Table B17: Survival patterns in the SS Princess of the Stars disaster .............................. 46 Table B18: Survival patterns in the MV Bulgaria disaster ................................................ 48
Table C1: Casualty statistics of MS ...................................................................................... 50 Table C2: Casualty statistics of the Titanic ......................................................................... 51
Table C3: Regression results for each shipwreck in FS ..................................................... 52 Table C4: Regression results for MS .................................................................................... 57
Table C5: Regression results for MS augmented with the Lusitania ................................ 58 Table C6: Regression results for MS augmented with the Titanic .................................... 59 Table C7: Regression results for FS ..................................................................................... 60
Table C8: Results from unweighted regressions on MS ..................................................... 62 Table C9: Results from unweighted regressions on MS augmented with the Lusitania . 63
Table C10: Results from unweighted regressions on MS augmented with the Titanic ... 64 Table C11: Results from unweighted regressions on FS .................................................... 65
4
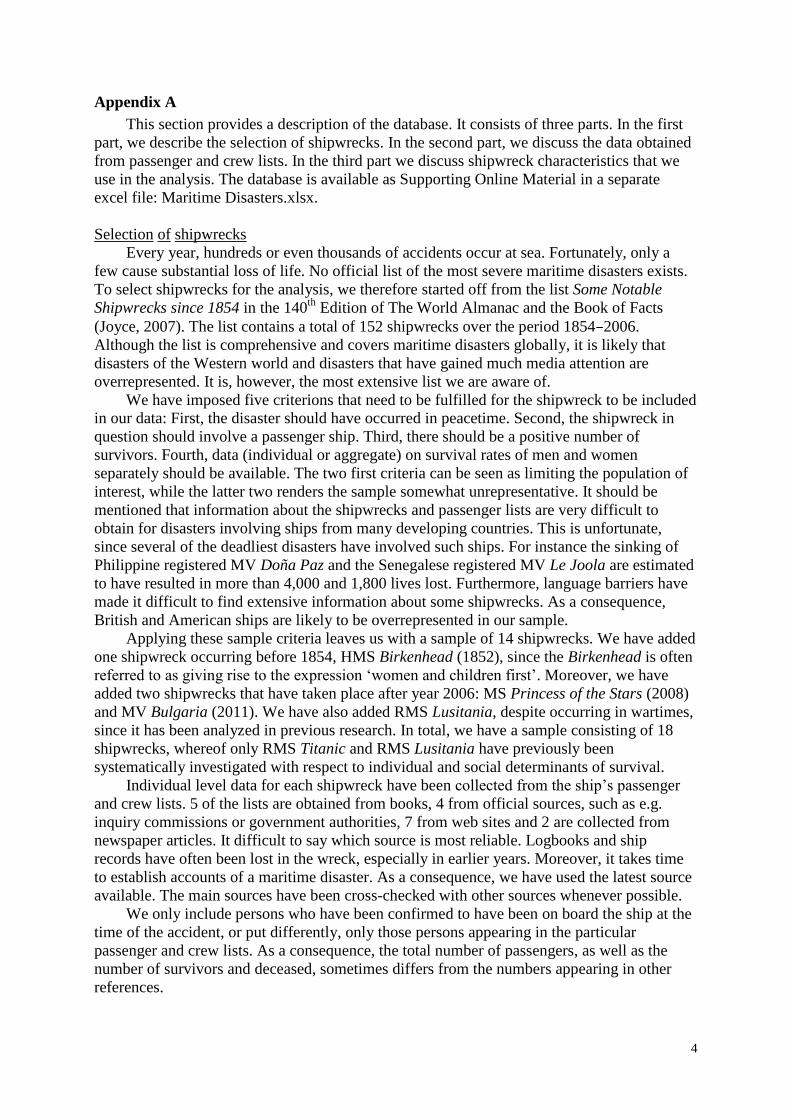
Appendix A
This section provides a description of the database. It consists of three parts. In the first
part, we describe the selection of shipwrecks. In the second part, we discuss the data obtained
from passenger and crew lists. In the third part we discuss shipwreck characteristics that we
use in the analysis. The database is available as Supporting Online Material in a separate
excel file: Maritime Disasters.xlsx.
Selection of shipwrecks
Every year, hundreds or even thousands of accidents occur at sea. Fortunately, only a
few cause substantial loss of life. No official list of the most severe maritime disasters exists.
To select shipwrecks for the analysis, we therefore started off from the list Some Notable
Shipwrecks since 1854 in the 140th
Edition of The World Almanac and the Book of Facts
(Joyce, 2007). The list contains a total of 152 shipwrecks over the period 1854–2006.
Although the list is comprehensive and covers maritime disasters globally, it is likely that
disasters of the Western world and disasters that have gained much media attention are
overrepresented. It is, however, the most extensive list we are aware of.
We have imposed five criterions that need to be fulfilled for the shipwreck to be included
in our data: First, the disaster should have occurred in peacetime. Second, the shipwreck in
question should involve a passenger ship. Third, there should be a positive number of
survivors. Fourth, data (individual or aggregate) on survival rates of men and women
separately should be available. The two first criteria can be seen as limiting the population of
interest, while the latter two renders the sample somewhat unrepresentative. It should be
mentioned that information about the shipwrecks and passenger lists are very difficult to
obtain for disasters involving ships from many developing countries. This is unfortunate,
since several of the deadliest disasters have involved such ships. For instance the sinking of
Philippine registered MV Doña Paz and the Senegalese registered MV Le Joola are estimated
to have resulted in more than 4,000 and 1,800 lives lost. Furthermore, language barriers have
made it difficult to find extensive information about some shipwrecks. As a consequence,
British and American ships are likely to be overrepresented in our sample.
Applying these sample criteria leaves us with a sample of 14 shipwrecks. We have added
one shipwreck occurring before 1854, HMS Birkenhead (1852), since the Birkenhead is often
referred to as giving rise to the expression ‘women and children first’. Moreover, we have
added two shipwrecks that have taken place after year 2006: MS Princess of the Stars (2008)
and MV Bulgaria (2011). We have also added RMS Lusitania, despite occurring in wartimes,
since it has been analyzed in previous research. In total, we have a sample consisting of 18
shipwrecks, whereof only RMS Titanic and RMS Lusitania have previously been
systematically investigated with respect to individual and social determinants of survival.
Individual level data for each shipwreck have been collected from the ship’s passenger
and crew lists. 5 of the lists are obtained from books, 4 from official sources, such as e.g.
inquiry commissions or government authorities, 7 from web sites and 2 are collected from
newspaper articles. It difficult to say which source is most reliable. Logbooks and ship
records have often been lost in the wreck, especially in earlier years. Moreover, it takes time
to establish accounts of a maritime disaster. As a consequence, we have used the latest source
available. The main sources have been cross-checked with other sources whenever possible.
We only include persons who have been confirmed to have been on board the ship at the
time of the accident, or put differently, only those persons appearing in the particular
passenger and crew lists. As a consequence, the total number of passengers, as well as the
number of survivors and deceased, sometimes differs from the numbers appearing in other
references.

5
We have individual level data for 17 of the shipwrecks. For the Admiral Nakhimov there
are aggregate data on the number of male and female passengers and crew. Accordingly, we
use the aggregate statistics to construct individual level data.
Data from passenger and crew lists
Below follows details about how the variables obtained from passenger and crew lists are
coded and for which shipwrecks they are available. Table A1shows which variables that are
available for each shipwreck.
Survival. Some passenger lists discriminate between deceased and missing persons. In
the majority of cases ‘missing’ implies that the body has not been recovered, but that the
person is presumed dead. For our analysis we have grouped the two categories and created a
dummy variable that takes the value one (=1) if the individual survived the disaster and zero
(=0) if the individual died (either confirmed dead or missing). We have compared our
statistics with the casualty figures appearing in other sources and can conclude that there are
only minor discrepancies.
Female. Gender is the individual characteristic of primary interest to us. Only a few
passenger lists provide explicit information about the gender of the persons on board the ship.
For most ships we have used the individual’s name to determine gender. When there are
uncertainties regarding the gender associated with a particular name we have used online
name dictionaries that provide information on the origin of the name and informative statistics
on whether it is typically a male name or a female name. In some passenger lists, especially
those dating back to the 19th
century, the classification is simplified by the presence of gender
based prefixes such as MRS (if married female), MISS (if unmarried female) or MR (if adult
male). Professional titles such as e.g. Dr, Professor, Stewardess, Captain, etc., have also been
helpful for determining the gender of passengers and crew members. We have been unable to
determine the gender of some individuals as they are stated with initials instead of forenames
in the passenger manifests. This appears primarily for shipwrecks in the 19th
century. Other
difficulties come from misspellings in transcription of names. This occurs especially among
East European emigrants travelling on American or British ships. The observations, which
remained inconclusive after applying the above methods, were left out from the empirical
analysis. In many cases, we cannot discriminate between women and girls or men and boys.
Hence, we use the terms female and male. Gender enters our empirical analyses as a binary
variable Female, taking the value one (=1) for females (women and girls) and zero (=0) for
males (men and boys).
Age. 9 passenger lists contain information on age. In some cases it seems as if the
availability is systematic. For example, the emigrant ships tend to have more extensive
documentation of the age of the first class (saloon) passengers than the third class (steerage)
passengers. For two of the ships (the Estonia and the Bulgaria) age is not given explicitly but
in the form of year-of-birth. We have then calculated age as the year of the disaster minus the
person’s year-of-birth. Age enters the empirical specifications in the form of categorical
variables, namely: persons younger than 16 (<16); persons 16–50 years old (16–50); and
persons older than 50 (>50), with 16–50 being the reference group. Similar age groups have
been used in previous studies (Frey et al., 2010, 2011). 2 passenger lists (the Golden Gate and
the Vestris) do not contain information on age but make a distinction between adults and
children. We create a dummy variable Child which equals one (=1) if the person is child and
zero (=0) if adult. When we analyze children explicitly we denote persons younger than 16 as
children.

6
Table A1: Availability of individual level data
Ship/Variable Survival Gender Age Crew Passenger class Nationality Companionship
HMS Birkenhead X X
X
SS Arctic X X
X
X
SS Golden Gate X X X1 X X
X
SS Northfleet X X X X
SS Atlantic X X
X X
SS Princess Alice X X X
2 X
SS Norge X X X X X X
RMS Titanic X X X X X
RMS Empress of Ireland X X
X X
RMS Lusitania X X X X X X
SS Principessa Malfalda X X X
3 X X
SS Vestris X X X
4 X
SS Morro Castle X X
X X
X
MV Princess Victoria X X X5 X
X
SS Admiral Nakhimov
a X X
X
MS Estonia X X X X
X
MV Princess of the Stars X X
X
MV Bulgaria X X X X
Notes. aData are compiled from aggregate statistics.
1No information on age. Only indicator for whether the individual is a child or adult
2 Some
individuals are marked as children in the passenger list. 3The data are incomplete for the crew.
4Children are indicated, but some uncertainty
remains about the exact number. 5 Some individuals are marked as children in the passenger list.

7
Crew. All the passenger lists we have gathered provide some sort of indictor of whether
listed persons are passengers or members of the crew. In some passenger lists there is more
detailed information about the crew such as e.g. in which department (i.e., deck, engineering,
or steward) the crew members worked, and in some cases even the specific title. The amount,
quality and type of crew characteristics vary substantially between the ships. We therefore
treat the crew as a homogenous entity. For most shipwrecks the great majority of crew
members are men. This implies that the information on crew membership is not only
important in the test of H2 but also that crew membership is an important control variable in
the other tests as well. Accordingly, we have constructed a binary variable Crew taking the
value one (=1) for crew members and zero (=0) for passengers. The captain is included in the
crew.
Passenger Class. 8 passenger lists, especially those dating back in time, separate
passengers into different classes: often first class, second class and third class, or saloon (first
class) and steerage (second and third class). We have constructed three dummy variables:
First class (Saloon); Second class; and Third class (Steerage), each taking the value one (=1)
if the passenger belongs to the particular class and zero (=0) otherwise.
Nationality. 4 passenger lists contain information on the nationalities of the passengers
and crew members. We create dummy variables for each nationality. These take the value one
(=1) if the passenger, or crew member, is of the particular nationality and zero (=0) otherwise.
Companionship. 3 passenger lists provide some sort of indicator of the social
relationships between the passengers, e.g. information on whether people were married or
whether they shared cabins. We create a dummy variable Companionship which takes the
value one (=1) if the individual traveled in a group and zero (=0) otherwise.
Shipwreck characteristics
We complement the data obtained from the passenger and crew lists with shipwreck
specific characteristics. The information underlying these variables has been collected from
the key references for each shipwreck, and whenever possible crosschecked against
alternative sources.
WCF order. We have searched the shipwreck accounts for evidence of whether the
captain, or any other officer, gave the order ‘Women and children first’ at some point during
the evacuation. For 5 of the shipwrecks we have found supporting evidence of the order while
for 9 cases there is no indication of the order been given. For 2 shipwrecks (the Princess of
the Stars and the Bulgaria) we cannot conclude whether such orders were given or not. For
the empirical analysis we create a dummy variable WCF order equal to one (=1) if the order
was given and zero (=0) otherwise.
Post WWI. The sample spans the period 1852–2011. For the empirical analysis we
define a dummy variable, Post WWI, which equals one (=1) if the disaster took place after
World War I and zero (=0) if it took place before, or during the war. The only shipwreck in
our sample that took place during World War I is the Lusitania disaster in 1915. The first
shipwreck after the World War I, in our sample, is the Principessa Mafalda in 1927.
British ship. Refers to the country in which the ship was registered at the time of the
accident. In all cases, but three (the Titanic, the Empress of Ireland and the Estonia), there is
an exact match between the ship’s flag and the nationality of the ship owner. Also, all
captains have the same nationality as their respective ship. In the empirical analysis we
discriminate between British ships and vessels of other nationalities. There are 8 British ships
in FS. We create a dummy variable (=1) if the ship is British and (=0) otherwise.
Quick. We define sinking time as the time period between the first indication of distress
and the sinking. For ease of interpretation we classify the disasters into two categories:
‘Quick’ and ‘Slow’. A disaster is defined as ‘Quick’ if the time period is shorter than 30

8
minutes and ‘Slow’ if the time period is longer than 30 minutes. 8 disasters in FS are quick
according to our definition. In the econometrical specifications we include a dummy variable
Quick, which equals one (=1) if the disaster was quick and zero (=0) if it was slow.
Appendix B
Here we give a general description of each shipwreck, including information on things
such as: the nationality of the ship, the crew and the passengers, the year, the date, the time,
and the water in which each shipwreck took place. We also provide an account of the course
of events of the disaster, together with an estimate of the length of the time between the first
serious indication of danger and the actual sinking. It is important to remember that a
maritime disaster does not end with the foundering but rather that it continues until the final
survivor is rescued. We have therefore tried to find information on when rescue ships arrived
at the wreck site and for how long the rescue mission continued. A special emphasis is placed
on how the passengers and the ship’s officers and crew behaved while the disaster was
unfolding and immediately thereafter. We have also spent much time to cover the captain’s
role in the evacuation process and in particular, if he gave and enforced orders that women
and children were to be given priority. The technical causes underlying the accident are often
well-documented with the help of logbooks and for more recent shipwrecks, black box
recorders and communication transcripts. However, to ascertain the facts regarding how the
passengers and crew behaved during the disaster there is often only one source available—the
testimonies of those who survived. It should therefore be noted that the subjective nature of
some of the reports may give a biased portrayal of the course of events. Nevertheless, we
think that witness reports, especially those appearing in reports from inquiry commissions,
contributes to a deeper understanding of the shipwreck.
HMS Birkenhead
This description of the Birkenhead disaster is largely based on A Deathless Story
(Addison and Matthews, 1906).
In the early morning of February 26, 1852 the British troopship HMS Birkenhead was
wrecked at Danger Point outside Cape Town, South Africa. According to the records, 445 of
the 638 people on board died (Addison and Matthews, 1906).
On her final voyage Birkenhead was transporting troops from the United Kingdom to the
8th Xhosa War in South Africa. Along the sail from United Kingdom were some of the
officers' wives and families. Although most of them disembarked in Simonstown twenty
civilians continued the voyage towards the final destination, Algoa Bay outside Port Elisabeth
(Addison and Matthews, 1906). The weather was calm and sight clear. These conditions had,
however, a devastating consequence for the Birkenhead. At 2 AM it struck an underwater
rock that was clearly visible in rough seas, but was not immediately apparent in calmer
conditions.
Immediately after the grounding Commander Salmond ordered the anchor to be dropped
and the engines to be set in reverse to back the ship of the rock. However, the sea had quickly
flooded the engine room and lower compartments, drowning 100 of the soldiers who were
still in their berths. To save the ship, the commander ordered some of the men to the pumps,
while the rest were assembled on the poop deck in order to raise the forward part of the ship.
The Birkenhead did not carry enough lifeboats for all the passengers. At order soldiers
tried to launch those available. However, one was immediately swamped and another could
not be launched due to poor maintenance(Addison and Matthews, 1906). The three remaining
lifeboats were filled with the women and children and rowed toward the shore. Lieutenant-
9
Colonel Seton, who was in charge of all military personnel, recognized that rushing the
lifeboats would risk swamping them and endanger the women and children. He ordered his
men to maintain discipline and to stand fast, allowing the women and children to board the
boats safely. A survivor reports that, Lieutenant-Colonel Seton, drew his sword to keep the
way free for the women and children (Addison and Matthews, 1906). All 13 children and 7
women onboard were saved. The accounts of the soldiers' chivalry and courage gave rise to
the ‘women and children first’ protocol.
Ten minutes after the first impact, during the attempt to get the ship off the rock, the
Birkenhead took another strike, this time beneath the engine room, tearing open her bottom
(Addison and Matthews, 1906). The ship instantly broke in two just aft of the mainmast and
the ship’s bow sank at once. The stern section, however, remained afloat for a few minutes,
before sinking. About 20 minutes after striking the rock, the Birkenhead had disappeared from
the surface. At this time, the soldiers had been given the order to abandon the ship. Some of
them managed to swim the 3 kilometers to shore, while others stayed afloat by hanging on to
debris from the wreck. Most of the men, however, drowned. In the morning after the incident
a schooner discovered two of the lifeboats. In the afternoon it arrived at the scene of the
disaster. At that time 40 people were still clinging to the rigging, the only part of the ship
remaining above the surface.
Most of the victims died from drowning as they did not manage to swim to the shore.
Some unfortunate died as the funnel collapsed and landed over them. According to the
accounts, 40 of the survivors had climbed the rigging, 76 had escaped in lifeboats, 9 escaped
in the gig and 68 had reached the shore swimming or floating on debris(Addison and
Matthews, 1906).
Neither Commander Salmond nor Lieutenant-Colonel Seton survived the disaster
(Addison and Matthews, 1906).
The lists of military personnel and the civilian crew members and passengers were lost
with the ship. The data for the Birkenhead has been collected from the passenger list provided
in the book The Drums of the Birkenhead (Bevan, 1989). To our knowledge this is the only
passenger list available for the Birkenhead. One caveat, however, is that it contains only 556
names, that is 137 fewer than what is reported in other sources (Addison and Matthews,
1906). The explanation for the discrepancy is that the record keeping was poor and that a
large number of crew members remained unidentified. Since we need to have information
about the names of the persons on board to determine their gender we use the data source at
hand. Table B1 summarizes the data with respect to characteristics of survivors and
decedents. According to the data, 191 of the persons on board the ship at the time of the
wreckage survived and 365 perished. As noted previously, all women and children were
saved. This compares to a survival rate of the male passengers of about one-third. Moreover,
we have information on who belonged to the crew, and who belonged to the military
contingent. Although it may be the case that some of those in latter group had sailed with, or
served on, the Birkenhead before and thus, had equally good knowledge about rescue
equipment and escape ways as the crew members, we chose to categorize them, as well as all
the women, as passengers. We note that the crew had a clear survival advantage over the
passengers—the survival probabilities are 82.8% and 28.2% respectively. According to the
historical records on the shipwreck there were 13 children onboard the Birkenhead.
Unfortunately, the passenger list lacks information on age. We do not have information about
the nationality of the people onboard. However, since the Birkenhead was a British troopship
it is reasonable to assume that her entire complement was of British nationality.

10
Table B1: Survival patterns in the HMS Birkenhead disaster
Survivors Deceased Total
Overall 191 (34.4) 365 (65.6) 556
Gender
Women 7 (100) 0 (0) 7
Men 184 (33.5) 365 (66.5) 549
Traveler status
Passengers 138 (28.2) 352 (71.8) 490
Crew 53 (82.8) 11 (17.2) 64
Notes. Survival rates in parentheses
SS Arctic
The main source of this description is The Sea Shall Embrace Them(Shaw, 2003).
The American ocean liner SS Arctic left Liverpool for New York on September 21, 1854
with a complement of 233 passengers and 175 crewmembers. The second class passengers
were mainly immigrants of British, French and German origin. The ship was built four years
earlier and was one of the most modern ships of its time.
At noon on September 27, the Arctic steamed at full speed along the shores of New
Foundland, Canada. A heavy fog made the sight limited and the Arctic came on a collision
course with the French steamer SS Vesta. The outlook discovered the Vesta too late, and the
collision was inevitable. The crew on board the Arctic believed that the ship was intact and
directed their attention to the French steamer, which seemed to be sinking. One of the Arctic’s
lifeboats was lowered to pick up passengers from the Vesta. Soon, however, it became
apparent that the Arctic took in water. Several attempts were made to seal the leak, but they
were all unsuccessful. Instead, the captain ordered the engines set in full speed, in an attempt
to reach the safety of the shore. However, the high speed just caused more water to enter the
ship. There is no exact sinking time, but several hours had passed from the collision until the
ship eventually sank.
The evacuation did not begin directly after the collision, as Captain Luce tried to keep
the ship afloat and reach shore. It became evident that this was not possible and that no ships
were coming to rescue. Captain Luce ordered the lifeboats to be launched. It should be noted
that the lifeboat capacity was insufficient to carry all passengers (Shaw, 2003). Women and
children were ordered to board the boats first (Shaw, 2003). The evacuation was disorganized
and the attempts to calm passengers failed. The lifeboats were soon filled with crew members.
The captain threatened disobedience with violence, but he hesitated to enforce his orders
(Shaw, 2003). After the crew had left in the lifeboats, the passengers left behind started to
build a raft. Several did not manage to escape in time and went down with the ship. The water
temperature was about 7 degrees Celsius (Shaw, 2003), and hypothermia soon weakened the
powers of those struggling to keep afloat. Captain Luce was reported to have stayed with the
ship until it sank, but managed to survive on a piece of debris and was picked up two days
after the accident.
As several hours passed between the impact and the sinking, most passengers managed
to reach the deck. The main determinant of survival seems to have been success in obtaining a
seat in a lifeboat. All the women and children on board died and most of the survivors were
crew members. The tragic irony is that the Vesta did not sink, and if the ship had stayed at the
location of the collision, most of its passengers could have been saved.

11
The data are obtained from The New York Daily Times(The New York Daily Times,
1854). Some passengers did not have their names written out; only an initial was given. We
are thus unable to determine the gender of these 78 individuals. Consequently they are
omitted from the empirical analysis, but it should be noted that all of them but one died.
Descriptive statistics of the sample are presented in Table B2. The overall survival rate was
15.3%. As noted earlier all women on board died. This compares to a survival rate of men of
19.9%. The data discriminates between crew members and passengers. We note that he
survival rate of passenger is higher than that of the crew, 20.5% vs. 11.3%. The data also
contain information about whether people traveled alone or as part of a group. People who
traveled alone had a survival rate of 18.8%, whereas the corresponding number for people
traveling in group was 2.8%.

12
Table B2: Survival patterns in the SS Arctic disaster
Survivors Deceased Total
Overall 41 (15.3) 227 (84.7) 268
Gender
Women 0 (0) 62 (100) 62
Men 41 (19.9) 165 (80.1) 206
Traveler status
Passengers 17 (11.3) 134 (88.7) 151
Crew 24 (20.5) 93 (79.5) 117
Companionship
In group 2 (2.8) 69 (97.2) 71
Alone 15 (18.8) 65 (81.2) 80
Notes. Survival rates in parentheses
13
SS Golden Gate
There literature on the sinking of SS Golden Gate is scarce. This description is derived
from several contemporary articles in the New York Times. It should be noted that they are
quite polemic. Some of them try to blame the Pacific Steamship Company for the disaster,
whereas others are published in their defense. Hence, great care with details has been taken
and the description is somewhat brief.
The SS Golden Gate left San Francisco for Panama July 27, 1862. According to the New
York Times (The New York Times, 1862a) there were a complement of 95 first class
passengers, 147 second class and steerage passengers, and 95 crew members on board. About
30 of them were children and 35 were women. There is no account on the general reason why
the passengers travelled. Onboard the ship was also a treasure worth 1,400,000 $4(The New
York Times, 1862a).
At 4.45 PM, July 27, when the ship was a few miles off Manzanilla, Mexico, a fire broke
out. Intents were immediately made to extinguish it, but to no avail. The fire spread quickly
and after 30 minutes the upper deck fell (The New York Times, 1862c). Meanwhile, the
captain had changed the course, intending to beach the ship. At 5.30 PM it grounded almost
300 meters from shore and was evacuated (The New York Times, 1862b).
By this time several lifeboats had already burnt in their tackles and others capsized at
launch. A few boats appear to have been successfully launched, but there are no reports on the
number of people who managed to get into them. Because of the calm sea and the temperate
water a total of 100 persons managed to swim the shore (The New York Times, 1862a).
There are no exact accounts on the original number of lifeboats. Ships at this time were
not required to carry sufficient lifeboats for all its passengers. However, the Golden Gate had
capacity to carry nearly 900 hundred passengers, but held only one third of that at the time of
the disaster. According to the New York Times (The New York Times, 1862d) there were 8 to
12 lifeboats with a capacity of several hundred passengers. Thus we cannot conclude whether
this was enough to carry all on board. It should be noted that there were several complaints
made to the press regarding the life-saving apparatus.
The captain survived the disaster. In his account of it he does not mention that he ordered
priority to women and children (The New York Times, 1862b). We therefore find it unlikely
that any such orders were given.
There is no exact list of the ship’s complement. The passenger list was on the ship at the
time of the disaster and was lost. The data are compiled from the list of survivors and victims
in several contemporary newspapers by Andrew Czernek (Golden Gate Resource, 2011). We
note that the numbers differ slightly from the ones stated in The New York Times (The New
York Times, 1862a). The data give us information on gender, age groups (child/adult),
passenger class and traveler status. We were unable to determine the gender of 20 children
and 2 servants. These were excluded from the analyses. Table B3 presents descriptive
statistics. We note that men survived to a greater extent than women, 50% compared to
36.4%. The survival rates of passengers and crew, 38.4% and 65.7% respectively, indicates
that the latter group had an advantage in survival. Further, adults had higher survival rates
than children, 46.9% vs. 28.6%. Second class passengers survived to a greater extent than
others, and people traveling as part of a social entity had lower survival than people who
traveled alone.
4 Its value in 2010 was between 2.5 and 3.5 billion dollars

14
Table B3: Survival patterns in the SS Golden Gate disaster
Survivors Deceased Total
Overall 172 (45.5) 206 (54.5) 378
Gender
Women 16 (36.4) 28 (63.6) 44
Men 156 (50) 156 (50) 312
Traveler status
Passengers 107 (38.4) 172 (61.6) 279
Crew 65 (65.7) 34 (34.3) 99
Class
1st 28 (37.8) 46 (62.2) 74
2nd 28 (50) 28 (50) 56
3rd 51 (34.2) 98 (65.8) 149
Companionship
In group 18 (36.7) 31 (63.3) 49
Alone 154 (50.2) 153 (49.8) 307
Age groups
Children 8 (28.6) 20 (71.4) 28
Adult 164 (46.9) 186 (53.1) 350
Notes. Survival rates in parentheses

15
SS Northfleet
This is a summary of the description in The Loss of the Ship Northfleet (Society for
Promoting Christian Knowledge, 1873).
The Northfleet was a full rigged British passenger ship operating the route between
Britain and Australia. On January 13, 1873, it left London for Hobart Town, Tasmania. There
were 344 passengers on board, besides the 37 crewmembers (Society for Promoting Christian
Knowledge, 1873). Most of the passengers were emigrants and railroad construction workers.
At 10.30 PM, on January 22, when the Northfleet was on anchor outside Dungeness, UK,
waiting for a storm to abate, it was rammed by the Spanish steamer Murillo. The steamer cut
through the Northfleet’s hull amidships on the starboard side and the ship immediately began
to take in water. Attempts were made to seal the leak but too much water had entered the ship
and it sank about 30 minutes after the collision (Society for Promoting Christian Knowledge,
1873).
The Northfleet tried to contact the steamer, but to no avail. The Murillo is reported to
have left the scene in an attempt to escape its responsibility of the accident. Instead the
captain sent up signal rockets to inform nearby ships about the situation. Several ships were in
the area, but because of the strong winds and the heavy seas, only a few came to assistance.
The captain initiated the evacuation immediately after the leak was discovered. He
ordered women and children to be saved first (Society for Promoting Christian Knowledge,
1873). However, panic broke out and the order was not followed. Men are reported to have
rushed to the lifeboats. In an attempt to impede this, the captain threatened to enforce his
order with violence. One man who disobeyed the order, was shot in his leg (Society for
Promoting Christian Knowledge, 1873). According to the reports most people reached the
boat deck (Society for Promoting Christian Knowledge, 1873) However, the Northfleet did
not carry lifeboats for all its passengers (although the inquiry concluded that they were
sufficient enough to meet up with the regulations) and because of the limited time not all of
those that were available were launched. Consequently, many people drowned when the ship
vanished. It seems like most of those who survived did so because they had the strength to
climb up the rigging, and stay there until they were picked up by the assisting ships.
The captain did not survive the disaster. His wife was however put in the first lifeboat
that left the ship and was one of the two adult female survivors.
The passenger list from the Northfleet has been obtained from the book The Loss of the
ship “Northfleet”(Society for Promoting Christian Knowledge, 1873). Four observations have
been dropped because of missing data on first name, leaving us with a sample of 367
individuals; it is notable that this number differs from the one given at other parts of the book.
The overall survival rate in this sample is 21.8%. The corresponding survival rates for men
and women are 26.6% and 3.9% respectively. We see that passengers and crew had about an
equal chance of surviving the shipwreck. It should be noted though that the survival rate of
the crew is based on 29 observations only (eight of the crewmembers stated at other parts of
the book appears to be missing in this data). Moreover, we see that decedents are on average
younger than survivors and that adults (Age>16) are more than five times as likely to survive
as children. These statistics are presented in Table B4.

16
Table B4: Survival patterns in the SS Northfleet disaster
Survivors Deceased Total
Overall 80 (21.8) 287 (78.2) 367
Gender
Women 3 (3.9) 74 (96.1) 77
Men 77 (26.6) 213 (73.4) 290
Traveler status
Passengers 74 (21.9) 264 (78.1) 338
Crew 6 (20.7) 23 (79.3) 29
Age 25.4 22.7 23.3
Age groups
Age<16 2 (3.6) 54 (96.4) 56
Age>16 72 (25.5) 210 (74.5) 282
Notes. Survival rates in parentheses

17
RMS Atlantic
This description is based on the accounts given in SS Atlantic: The White Star Line’s first
disaster at sea (Cochkanoff and Chaulk, 2009).
In the early morning April 1, 1873, en route from Liverpool to New York, the
transatlantic ocean liner RMS Atlantic struck an underwater rock and sank off the coast of
Nova Scotia, Canada. It carried 811 passengers and 141 crewmembers, of which 538 died
(Cochkanoff and Chaulk, 2009).
The Atlantic was owned by the White Star Line and was one of the most modern ships at
the time. It was operating both as a luxurious ocean liner and as mode of transportation for
European emigrants. Similar to other ocean liners the saloon passengers were accommodated
on the ship’s upper decks, whereas the emigrants berthed below deck, with the families placed
in the amidships compartments and the single women and men (and crew) separated into the
stern and bow quarters, respectively.
The Atlantic faced rough weather on its voyage. This caused the ship to consume more
coal than usual. Captain Williams was afraid that the supply would be insufficient for the sail
to New York, and decided to make port at Halifax, Nova Scotia, to replenish the supplies.
When approaching Halifax, the Atlantic had drifted off course and was closer to the shore
than the captain and his officers had estimated. A combination of high waves and haze
(Cochkanoff and Chaulk, 2009) made it difficult for the watchmen to spot breakers. At
3:10 AM the Atlantic struck an underwater rock—Marr's Head—in full speed, which was
maintained in spite of the weather (Cochkanoff and Chaulk, 2009). The ship was quickly
flooded and ten minutes after the grounding it lurched on its side. However, the ship did not
sink immediately but remained in this position for several days.
Most of the passengers woke up by the impact. Some of them remained under deck, not
realizing the severity of the situation, but soon found themselves trapped. Officers and crew
immediately rushed to the deck in an attempt to launch the ship’s lifeboats. The total lifeboat
capacity was 500 persons (Cochkanoff and Chaulk, 2009). However, some of the lifeboats
were washed away whereas others were smashed against the hull when the ship capsized.
According to witness accounts, people panicked when they realized that the end was coming.
The tumultuous situation worsened by the fact that many of the emigrant passengers did not
speak English. According to the records, the crew had to use violence to prevent the large
crowds of passengers from entering the endangered lifeboats.
Despite the prolonged sinking many passengers perished in the shipwreck because they
were unable to reach the boat deck. The single women, in the stern compartments, drowned as
the water flooded their beds. The families suffered a similar fate in the amidships
compartments. It has been estimated that only two or three families and not a single woman
from the steerage made it to the boat deck (Cochkanoff and Chaulk, 2009). The bow
compartments on the other hand were not flooded immediately. This gave the single men an
advantage as they had more time to escape. Some people sought safety in the ship’s rigging
which remained partly over the surface. Others managed to get ashore by climbing the ropes
that had been spanned between the wreck and a nearby islet. However, the majority drowned
when they tried to swim in the frigid water. When local residents of the nearby fishing village
were notified about the accident, they immediately went out to rescue survivors from the islet
and the rig. The final survivor on the wreck was rescued at around 9 AM, six hours after the
grounding.
The loss of the Atlantic called into question the actions of the captain. However,
according to witness testimonies he had remained calm throughout the disaster; he directed
people to move towards the safer bow and instructed them how to overcome hypothermia
(Cochkanoff and Chaulk, 2009). He also remained on the wreck and made sure that
everybody who was still alive made it to shore. We have found no indications of the captain

18
ordering ‘women and children first’. He was finally picked up by a boat (Cochkanoff and
Chaulk, 2009).
The inquiry was praising Captain Williams’s leadership and his brave efforts in helping
to save lives after the ship struck (Cochkanoff and Chaulk, 2009). The inquiry did, however,
suspend William’s master license for two years.
The data are collected from Cochkanoff and Chaulk (Cochkanoff and Chaulk, 2009). It
includes information on gender, class (saloon and steerage), as well as information on
passengers and the crew. Several sources report that there were around 180 children on board
the Atlantic (Cochkanoff and Chaulk, 2009). Unfortunately we do not have information on
age and thus we are unable to account for this in the empirical analysis. We have been unable
to determine the gender of 80 persons, who were stated in the lists as unknown, or only with
last names. We know however that all of them were steerage passengers and that forty of
them survived the disaster. For another 4 individuals we do not have data on whether they
died or survived in the accident. Excluding these 84 observations leaves as with a sample of
868 observations. Table B5 presents the number of survivors and deceased, together with the
corresponding survival rates (in parentheses) for a set of different sub-groups (men, women,
passengers, crew, saloon, steerage). In total, 330 persons survived the disaster. This
corresponds to a survival probability of 38%. We note that there were more men than women
on board the ship. None of the 235 women survived the disaster. Atlantic had a crew of 80 at
her final voyage.5 The crew survived to a higher extent than the passengers: the survival rates
were 32.6% and 91.3%. Moreover, we note that the saloon passengers had a higher survival
rate than the steerage passengers (44.1% vs. 32.1%).
5 Only two of the crew members were females.

19
Table B5: Survival patterns in the SS Atlantic disaster
Survivors Deceased Total
Overall 330 (38) 538 (62) 868
Gender
Women 0 (0) 235 (100) 235
Men 330 (54.7) 303 (45.3) 603
Traveler status
Passengers 257 (32.6) 531 (67.4) 788
Crew 73 (91.3) 7 (8.7) 80
Class
Saloon 15 (44.1) 19 (55.9) 34
Steerage 242 (32.1) 512 (67.9) 754
Notes. Survival rates in parentheses
20
SS Princess Alice
This text is a summary of the information given on www.portcities.uk.org (Portcities
UK, 2011), a webpage containing archive material concerning British port cities, and various
contemporary newspaper articles.
On September 3, 1878, the London Steam Company owned SS Princess Alice, was on
her normal route on the River Thames, UK, from London Bridge to Gravesend. The Princess
Alice left Gravesend at 6 PM, carrying approximately 800 passengers and 40 crewmembers.
Most of the passengers were making a daytrip to the Rosherville Gardens in Gravesend. There
were many children on board. At passing the Tripcock Point on the river Thames, the
Princess Alice met the collier steamer Bywell Castle. There was no rule on how ships on the
Thames should pass each other at the time. The Bywell Castle tried to pass astern, but the
captain of the Princess Alice got confused and skewed the ship, thereby placing it in Bywell
Castle’s intended course. As a response the captain of the Bywell Castle reversed the engines,
but the collision was inevitable. The Princess Alice was hit amidships and split in two. It sank
within 4 minutes, the time being 7.40 PM. The Bywell Castle did not sink and immediately
commenced the rescue operation, which was assisted by people from the shore.
There are scarce reports of the evacuation of the ship. What is known is that Princess
Alice did not carry enough lifeboats for all its passengers and that it was not enough time to
launch those that were available. Most people fell or jumped into the water. Few could swim
at this time. Swimming was further made difficult by the polluted water, which was thick by
sewage from a nearby industry. In addition, the darkness of the evening made it difficult for
rescuers to find people in the water. According to the Bywell Castle’s logbook the weather
was slightly hazy(The New York Times, 1878), which may also have reduced visibility. The
survivors had either managed to reach the ropes thrown from the Bywell Castle or were
fortunate enough to be picked up by other assisting boats.
There are no explicit reports on the actions of the captain but some witnesses report that
they did not hear any orders given by him after the collision (Manchester Guardian, 1878). It
is thus unlikely that he ordered priority to women and children. The inquiry, following the
disaster, blamed the captain for the collision. He did not survive.
The data are obtained from http://www.alsbury.co.uk/princessalice/alice0.htm (Princess
Alice Resource, 2011), and contains all persons connected to the disaster, i.e. also witnesses,
relatives and rescue helpers. We only included those specified as either passengers or crew.
The data give us information on gender and age. 58 persons were deleted because of missing
data on gender, 37 of theme survived. There were 5 female crew members onboard the
Princess Alice, of who none survived. Descriptive statistics are presented in Table B6.
According to the data, the overall survival rate was 16.7%. The survival rate of men was 22%,
whereas the rate of women was12.4%. The survival rate of crew was 33.3% while it was only
16% for passengers. Children seem to have had lower survival rate than adults. However, we
lack age data for 259 individuals.

21
Table B6: Survival patterns in the SS Princess Alice disaster
Survivors Deceased Total
Overall 140 (16.7) 697 (83.3) 837
Gender
Women 57 (12.4) 403 (87.6) 460
Men 83 (22) 294 (78) 377
Traveler status
Passengers 128 (16) 673 (84) 801
Crew 12 (33.3) 24 (66.7) 36
Age 27.6 28.4 28.3
Age groups
<16 4 (2.6) 147 (97.4) 151
16-50 21 (5.9) 337 (94.1) 358
>50 4 (5.8) 65 (94.2) 69
Notes. Survival rates in parentheses

22
SS Norge
The information in this description is based on Titanic’s Predecessor – The SS Norge
disaster (Sebak, 2004).
The SS Norge was a Danish emigrant ship built in 1880. On June 22, 1904, the Norge
left Copenhagen, Denmark for New York. After calls in Norwegian ports, the captain sat
course for the final destination. On board the ship were 727 passengers and 68 crewmembers.
The passengers were Scandinavian and Jewish emigrants who, with a few exceptions,
travelled in the steerage compartments. The weather in the North Atlantic was favorable and
in an attempt to save time Captain Gundel decided to take the quicker route, south of Helen’s
Reef, which is located in the mid-Atlantic, west of the British Islands. However, the captain
had underestimated the currents and the ship had drifted straight toward the perilous reef. At
7.45 AM June 28, SS Norge ran aground on an underwater rock.
At first, it seemed like the impact on the ship’s hull was minor. To avoid further damage,
the captain decided to reverse the ship off the rock. By doing so, however, he allowed large
amounts of water to flood through the broken hull. The ship immediately slanted forwards
which in turn left the aft propeller above the surface. The captain realized that the ship was
doomed and ordered evacuation. According to the records there had been no safety drills
onboard the ship for three years and as a consequence, some crew members did not know
which lifeboats they were supposed to attend. Directions from the crew were given in Danish
and other Scandinavian languages. Although this supposedly caused some confusion among
the Russian emigrants, we have found no indications of a widespread panic among the
passengers. Instead the officers managed to keep the order and there are several stories of
people helping each other.
The Norge carried lifeboats for 251 persons, i.e. sufficient for only about one third of the
people on board (Sebak, 2004). According to the records, the captain ordered that women and
children were to be given priority to those that were available (Sebak, 2004). We have,
however, found no indications of the order being enforced by the captain or any of his
officers. It seems like the list made it difficult to lower the boats. One lifeboat is reported to
have been severely damaged and almost all of its passengers vanished in the sea. However,
before the Norge went down, only 20 minutes after the grounding, at least 5 of the 8 lifeboats
had been successfully launched (Sebak, 2004).
It appears as if most people managed to reach the deck. However, the ones, who did not
reach a lifeboat were, given the distance to land and the fact that no ships came to its
assistance, left to a certain death. Some of the lifeboats drifted for several days before they
were picked up. One of them had reached as far as the Faroe Islands.
The captain survived the disaster (Sebak, 2004) and the prosecution following the
disaster granted him for his good seamanship, and especially his ability to keep the passengers
calm throughout the evacuation.
The data are obtained from Titanic’s Predecessor – The SS Norge disaster (Sebak,
2004). It gives us information on gender, age, and if the person was a crew member or
passenger, as well as and nationality. As shown in Table B7 the overall survival rate was
20.1%. Men had higher survival rate than women, 29.1% and 19.9%. The crew appears to
have had a survival advantage over passengers, with a survival rate of 33.8% compared to
18.8% for the passengers. The age category 16-50 survived to a larger extent than other
members of the complement. Danish passengers survived to a higher degree than passengers
of other nationalities.

23
Table B7: Survival patterns in the SS Norge disaster
Survivors Deceased Total
Overall 160 (20.1) 635 (79.9) 795
Gender
Women 37 (9.9) 336 (90.1) 373
Men 123 (29.1) 299 (70.9) 422
Traveler status
Passengers 137 (18.8) 590 (81.2) 727
Crew 23 (33.8) 45 (66.2) 68
Age 22.7 21 21.3
Age groups
<16 30 (11.5) 230 (88.5) 260
16-50 129 (25.6) 374 (74.4) 503
>50 1 (3.1) 31 (96.9) 32
Nationality
Danish 35 (27.6) 92 (32.4) 127
Others 125 (18.7) 543 (81.3) 668
Notes. Survival rates in parentheses

24
RMS Titanic
This description is based on the accounts given in the British inquiry following the
disaster(Great Britain. Commissioner of Wrecks, 1912).
The Titanic was owned by the White Star Line and was the most modern ship of its time.
It sank on its maiden voyage in what is one of the world’s most well-known disasters.
RMS Titanic left Southampton April 10, 1912, bound for New York, under command of
Master E. C. Smith. According to the inquiry, there were 885 crewmembers and 1,316
passengers on board(Great Britain. Commissioner of Wrecks, 1912). The majority of them
travelled in third class and was mostly made up by emigrants of British or Scandinavian
origin.
The ship travelled the southern winter route in order to avoid icebergs. However,
icebergs were not uncommon in these waters and on April 12, the Titanic received several ice
warnings from other ships in the area. In spite of the warnings, the captain did not reduce the
speed nor change the course. The inquiry gives him no blame for this as it was common to
rely on the lookouts under such conditions(Great Britain. Commissioner of Wrecks, 1912).
At 11 PM, the same day, the lookout saw an iceberg straight ahead. The bridge was
informed and, to avoid collision, the ship skewed and engines were set in reverse. This was
not sufficient and the iceberg tore up the hull on the Titanic’s starboard side. To avoid
sinking, the doors between the watertight compartments were closed before the collision, but
the damage exposed six of the compartments to the sea. This implied that the ship was
doomed to sink, and it eventually foundered at 2.20 AM, April 15.
The severity of the situation was not immediately realized, but at 12 AM the captain
ordered the lifeboats to be prepared. There were 20 lifeboats on board, with a capacity of
1,178 persons, i.e. less than the ship’s complement. The captain gave specific orders that
women and children were to be prioritized. At 12.15 AM the first lifeboat left the ship. The
inquiry concludes that there were no lack of discipline at this stage of the evacuation, but that
it was disorganized (Great Britain. Commissioner of Wrecks, 1912). It is notable that there
had been no safety drills prior to the disaster and that most of the lifeboats were not filled to
capacity when they left the ship.
The ship sank bow first, and as the sinking proceeded it became increasingly difficult to
move. It was especially difficult for the third class passengers, who could only reach deck by
first moving towards the stern. Further, all lifeboats were placed on the deck to which,
normally, only first class passengers had access. According to the inquiry 712 persons were
saved. About 650 of these were saved from the lifeboats(Great Britain. Commissioner of
Wrecks, 1912).
The first call for assistance was sent out at 12.15 AM. Several ships answered, but few
were in the vicinity. The first ship to arrive was the Carpathia at 4 AM. The ship picked up
people from the lifeboats and searched for survivors. However, few had managed to sustain in
the near freezing water. The captain did not survive the disaster.
The data are obtained from the Encyclopedia Titanica(Encyclopedia Titanica, 2012). It
contains information on gender, nationality, age, and if the person was a crewmember or
passenger. According to the data, the overall survival rate was 32.2%. Women had a quite
remarkable survival advantage over men, 73.3% compared to 20.7%. First class passengers
had ha survival rate of 62%, second class 41.8 % and third class 25.4%. Children had a higher
survival rate than adults. There are no great differences in average age of survivors and
deceased. Table B8 presents descriptive statistics.

25
Table B8: Survival patterns in the RMS Titanic disaster
Survivors Deceased Total
Overall 712 (32.2) 1496 (67.8) 2208
Gender
Women 356 (73.3) 130 (26.7) 486
Men 356 (20.7) 1366 (79.3) 1722
Traveler status
Passengers 500 (38) 817 (62) 1317
Crew 212 (23.8) 679 (76.2) 891
Class
1st 201 (62) 123 (38) 324
2nd 119 (41.8) 166 (58.2) 285
3rd 180 (25.4) 528 (74.6) 708
Age 29.3 30.2 29.9
Age groups
<16 68 (50.4) 67 (49.6) 135
16-50 606 (31.1) 1341 (68.9) 1947
>50 38 (32.8) 78 (67.2) 116
Notes. Survival rates in parentheses
26
RMS Empress of Ireland
This text is a summary of several sources, mostly the Empress of Ireland – The story of
an Edwardian Ocean Liner (Grout, 2002) and articles from Encyclopedia Titanica
(Encyclopedia Titanica, 2001).
The Canadian ocean liner RMS Empress of Ireland was owned by the Canadian Pacific
Railway Company. On May 29, 1914, en route from Quebec to Liverpool, the latter being its
port of registry, the Empress of Ireland collided with the Norwegian coal freighter SS
Storstad. On board were 1,017 passengers and 431 crewmembers.
The collision occurred at approximately 2.00 AM , and was the result of both captains
failing to maintain their bearings in the heavy fog. The Storstad, which was later found guilty
of ramming the Empress of Ireland, was badly damaged but did not sink. The Empress of
Ireland on the other hand took in large amounts of water and sank in 14 minutes
(Encyclopedia Titanica, 2001). Captain Kendall immediately ordered a distress call to be
transmitted and the lifeboats to be launched. There were 64 lifeboats with a total capacity of
1,948 passengers (Grout, 2002). However, a heavy starboard list resulted in only nine of them
being launched successfully (Encyclopedia Titanica, 2001). These were filled with occupants
of the upper deck cabins that had quickly made it out onto the boat deck. Most of the
occupants in the lower compartments drowned in their cabins. Several people were thrown off
the boat by the impact and others jumped off in desperate attempts to save themselves
(Encyclopedia Titanica, 2001; Grout, 2002). Some of them were picked up by the crew of SS
Storstad, whereas most of them drowned. Other ships arrived at the wrecksite two hours after
the sinking. By that time there were no survivors left.
There are scarce reports on the acting of the passengers and the crew. It is notable that
the survival rate of crew members is much higher than the passenger’s. However, the official
inquiry speaks of no selfishness or cowardice of the crew; instead this is to be explained by
the fact that Captain Kendall ordered ‘all hands on deck’ when he realized that the collision
was inevitable. This gave the crew a significant advantage over the sleeping
passengers(Grout, 2002).
We have not found any indication that the captain gave specific orders to prioritize
women and children. Captain Kendall survived the disaster. He was thrown off the bridge as
the ship capsized but managed to reach a lifeboat (Encyclopedia Titanica, 2001).
The data are collected from the ‘Final Journey "Passenger & Crew List " of the Empress
of Ireland’ published by the Canadian Pacific Railway Company in 1914 (Empress of Ireland
Resource, 2004). The dataset contains information on the names of the passengers, together
with information on who died and who survived. It also contains information on the crew as
wells as information about which class the passengers traveled in.6 The gender of the
passengers and crew members has been inferred from their names. We are unable to
determine the gender of 35 individuals. These are excluded from the empirical analysis.
The Empress of Ireland had an overall capacity of 1,580 passengers and crew members.
According to this data there were 1,448 persons on board the ship, of whom 983 perished. Of
the 465 survivors, 420 were men and 45 women. The corresponding survival probabilities are
40% and 11.3% for men and women, respectively. Table B8 reveals that the crew members
had a substantially higher survival probability than the passengers (59.4% vs. 20.6%). We
also note that passengers traveling in first class had higher chance of survival than the second
and third class passengers, who had about equal survival rates.
6 The dataset contains information on nationality only for the first and second class passengers. Since third class
passengers and crew constitute the majority of the people on board the Empress of Ireland we do not make use
of this data in the empirical analysis.
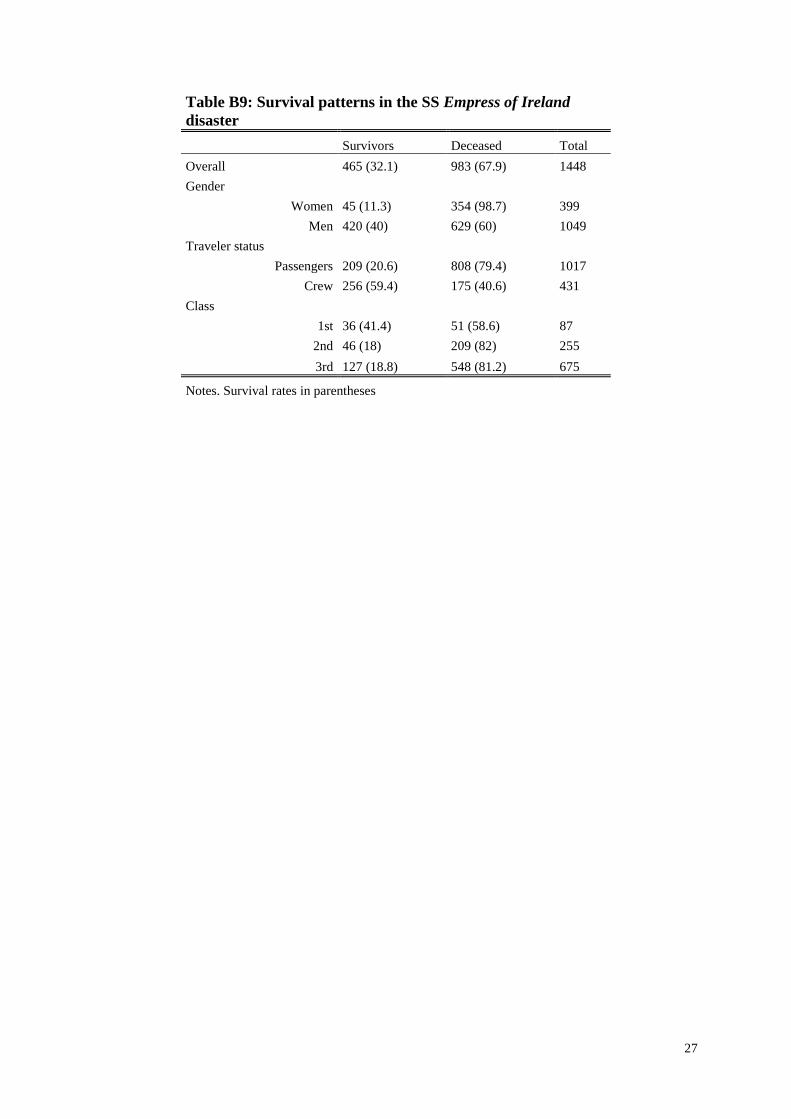
27
Table B9: Survival patterns in the SS Empress of Ireland
disaster
Survivors Deceased Total
Overall 465 (32.1) 983 (67.9) 1448
Gender
Women 45 (11.3) 354 (98.7) 399
Men 420 (40) 629 (60) 1049
Traveler status
Passengers 209 (20.6) 808 (79.4) 1017
Crew 256 (59.4) 175 (40.6) 431
Class
1st 36 (41.4) 51 (58.6) 87
2nd 46 (18) 209 (82) 255
3rd 127 (18.8) 548 (81.2) 675
Notes. Survival rates in parentheses

28
RMS Lusitania
Most of this description is a summary of the reports found in the Mersey inquiry
following the disaster(British Commisioner of Wrecks, 2012).
RMS Lusitania was a British passenger ship owned by the Cunard Steamship Company.
It left New York on May 1, 1915, for its final voyage, heading for Liverpool. On board were
702 crew members and 1,257 passengers. The great majority consisted of British and
Canadian British passengers. About 150 passengers were children.
On May 7, the Lusitania entered the so called Danger zone. England was at this time
engaged in WWI. Germany had declared that all ships traveling in this zone, was liable to
attack. As a measure of precaution the captain had ordered extra lookouts and all lifeboats to
be prepared. At 2.10 PM an officer spotted two torpedoes, which were fired from a German
submarine. They hit the ship almost simultaneously, amidships on starboard side. The ship
took a heavy starboard list and foundered within 20 minutes.
The captain immediately ordered all to reach for the lifeboats. The total lifeboat capacity
was 2,605 persons. However, there were several difficulties in launching the lifeboats due to
the limited time, the heavy list and the fact that the ship did not stop.
Accounts give that the evacuation was characterized by confusion rather than panic.
Critique on the crew’s behavior was heard afterwards, stating that their acting was
disorganized. The passengers received conflicting instructions on what to do and several
believed that the ships was not sinking. Other reports tell of passengers trying to help in the
launching of the lifeboats, but the Mersey inquiry states that their inexperience caused them to
do more harm than good.
The report does not give satisfactory accounts on how people died and survived in the
disaster. Because of the short sinking time it is reasonable to believe that many passengers
were trapped inside the ship as it foundered. Several were swept down by the whirlpool
created by the sinking ship(Lusitania Resource, 2012).
The captain ordered women and children to be saved first. We have however, not found
any indications of this order to being enforced. The captain remained on the bridge until the
end, but did survive the disaster.
The data are obtained from http://www.rmslusitania.info/ (Lusitania Resource, 2012).
They contain information on passenger and crew status as well as class, age, and nationality.
There were three presumed German spies in the stowaway which are missing from our
analysis as their gender cannot be determined from the passenger manifest. Besides this the
data differ only slightly from the accounts given by other sources (Grout, 2002). Table B10
show the descriptive statistics of the sample. The overall survival rate was 39.2%. Men and
women had more or less equal survival rates (40% vs. 37.1%). Likewise the difference
between crewmembers and passengers was relatively small. People aged 16–50 appears to
have had a survival advantage over children and older adults. Nationality seems to be
unrelated to survival rates.

29
Table B10: Survival patterns in the RMS Lusitania disaster
Survivors Deceased Total
Overall 768 (39.2) 1190 (60.8) 1958
Gender
Women 192 (37.1) 326 (62.9) 518
Men 576 (40) 864 (60) 1440
Traveler status
Passengers 476 (37.7) 788 (62.3) 1264
Crew 292 (42.1) 402 (57.9) 694
Class
1st 113 (39) 177 (61) 290
2nd 229 (38.1) 372 (61.9) 601
3rd 134 (35.9) 239 (64.1) 373
Age 31.5 32.5 32.1
Age groups
<16 48 (32.2) 101 (67.8) 149
16-50 444 (43.9) 567 (56.1) 1011
>50 36 (28.3) 91 (71.7) 127
Nationality
British 646 (39.7) 981 (60.3) 1627
US 72 (36.4) 126 (63.6) 198
Others 50 (37.6) 83 (62.4) 133
Notes. Survival rates in parentheses

30
SS Principessa Mafalda
This description is based on the accounts of the disaster summarized by Christopher
Ecclestone (Principessa Mafalda Resource, 2010). Ecclestone gathered the information from
contemporary Argentinian newspaper articles on the disaster.
The ocean liner SS Principessa Mafalda left Genoa for Buenos Aires October 18, 1927.
On board were 288 crew members and 971 passengers. Most of the passengers were
emigrants of Italian, East European and Syrian origin. The ship was reported to be in bad
condition and it stopped several times during the voyage. On October 25, the ship was 70
kilometers off the coast of Brazil, close to the Abrolhos Islands. In the afternoon the propeller
shaft broke. This caused the propeller to gauge into the ship’s stern tearing up a big hole,
through which water begun to enter. Attempts were made to seal the leak, but to no avail. The
sinking was slow and the ship did not founder until midnight, about 4 hours and 20 minutes
later.
Shortly after the ship started to take in water a distress call was sent out. There were
several nearby ships and the first of them arrived at the scene at 5 PM. Accounts of the
evacuation describe it as chaotic. Passengers were reported to loot and fight over valuables.
As Italian law forbade officers to carry guns, there were no means to impede this.
As the disaster occurred after the sinking of the Titanic it is reasonable to believe that the
Pricipessa Mafalda did carry enough lifeboats. However, it was reported that the lifeboats
were in bad condition and that some were not possible to launch. Several of the lifeboats were
swamped and others collapsed. Complaints were also made about the crew not helping the
passengers. In the first lifeboat to leave, 40 out of 42 people were reported to be crew
members and after they had reached the assisting ships, they did not return to pick up more
passengers. The sea was relatively calm and temperate and many of the survivors reached the
assisting ships swimming.
Given the prolonged sinking time, one would expect all passengers to have had a chance
to reach the deck. However, it was reported that debris and the list made it difficult to move
within the ship.
There are no indication of Captain Gulli giving orders to prioritize women and children
and he did not survive the disaster. There was no official blame given to the captain, but
complaints of nonchalant acting were reported. Accounts tell that several first class
passengers stayed with him and did not bother to reach for the lifeboats.
The data were compiled by C. Ecclestone from several contemporary Argentinian
newspapers (Principessa Mafalda Resource, 2010). According to the data the Principessa
Mafalda carried 1,186 passengers and crew members. This number differs from the one stated
above, because a group of Syrian passengers have been excluded. We decided to exclude
them from the analysis because of substantial uncertainty in the records of survivors from this
group. Table B11 presents the descriptive statistics. The overall survival rate in the sample is
73.9 percent. The survival rates of women and men were 73.3% and 74.1%, respectively. The
passengers had a lower survival rate than the crew. Interestingly, we note that the relationship
between class and survival is the opposite of what we have found for most other shipwrecks.
The survival rate for first class passengers was 48.2%, compared to 72.2% for third class
passengers.
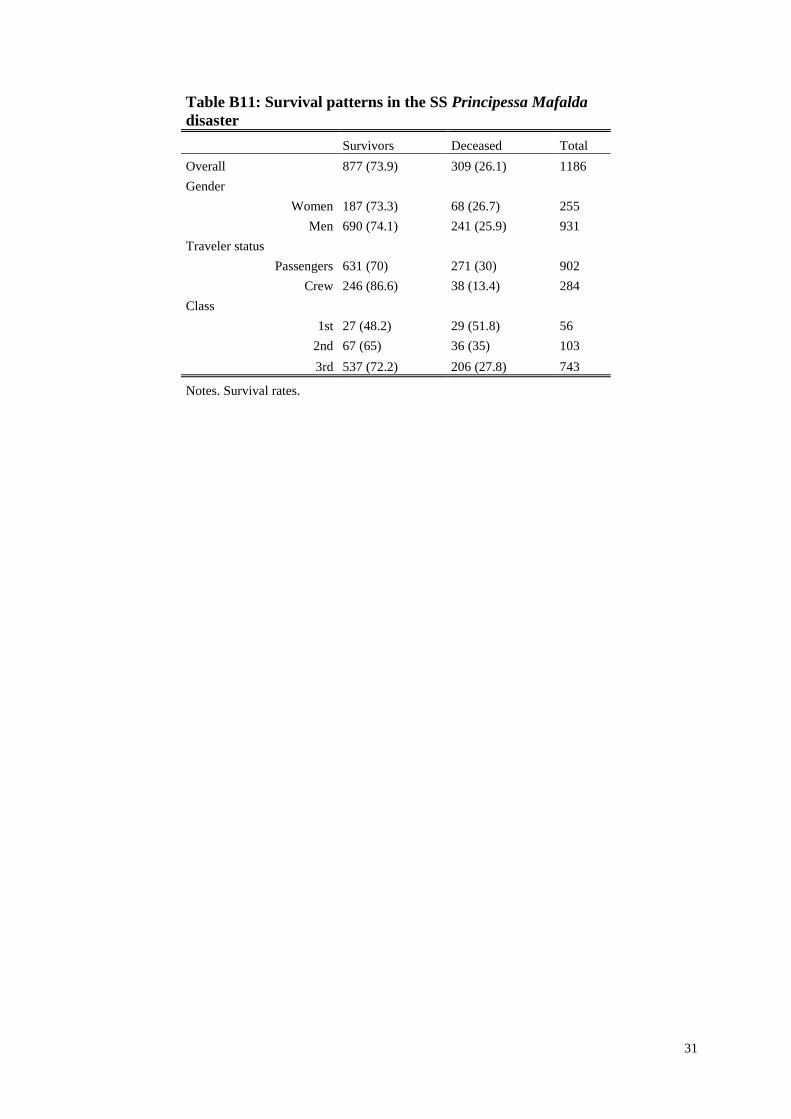
31
Table B11: Survival patterns in the SS Principessa Mafalda
disaster
Survivors Deceased Total
Overall 877 (73.9) 309 (26.1) 1186
Gender
Women 187 (73.3) 68 (26.7) 255
Men 690 (74.1) 241 (25.9) 931
Traveler status
Passengers 631 (70) 271 (30) 902
Crew 246 (86.6) 38 (13.4) 284
Class
1st 27 (48.2) 29 (51.8) 56
2nd 67 (65) 36 (35) 103
3rd 537 (72.2) 206 (27.8) 743
Notes. Survival rates.

32
SS Vestris
The following description of the last voyage of the SS Vestris is based on the report
found in the official inquiry of the disaster (Aspinall and Great Britain. Board of Trade,
1929).
The British owned passenger cargo ship SS Vestris left New York at 3.45 PM November
10, 1928, for its normal route to Barbados and South American ports. According to the
inquiry there were 128 passengers and 198 crew members on board the ship.
According to reports from eyewitnesses, the ship left port with a slight starboard list
(Aspinall and Great Britain. Board of Trade, 1929). The inquiry concludes that, because of
overloading, the ship was tender and did not have the freeboard required by regulations. In the
early morning of November 11, members of the crew recognized that water had begun to
enter the ship. In addition, rough weather conditions, with squalls of possibly hurricane force
and heavy sea caused the improperly stored cargo to shift to the starboard side, which in turn,
tilted the ship further. In an attempt to straighten the ship up the crew began to empty the
water tanks and pump out the entering sea water, but to no avail. At 8.37 AM the captain sent
out the first general call, followed up by a distress call two hours later. According to the
inquiry commission the captain should have called for assistance at a much earlier stage.
About 5 hours later, at 2 PM, the Vestris foundered off the coast of Virginia, US.
The captain and the crew started the evacuation of the ship at 10 AM. Records show that
women and children were separated from the men and placed in different lifeboats. There are,
however, no reports of any explicit order to prioritize women and children. The weather
conditions in combination with the heavy list made it difficult to launch these boats. One was
damaged and sunk when it reached the surface, whereas the other two were left hanging on
the side of the ship when it went down. As a consequence, none of the 12 children, and only 8
of the 33 women survived (the two women of the crew not included) the shipwreck. The first
rescue ships arrived at the scene several hours after the sinking and picked up eight lifeboats.
There are no reports of them picking up anyone from the water.
Surviving passengers have described the evacuation as disorganized. Complaints were
made by the passengers, to the press, about the crew securing the best life boats for
themselves (Baltimore News, 1928).
The captain did not survive the disaster. The inquiry commission concludes that he had
no responsibility for the incorrect loading of cargo but that more lives could have been spared
if he had sent out the distress call, and initiated the evacuation, earlier.
The passenger data are compiled from the New York Times list of missing, confirmed
dead and surviving passengers, published November 25, 1928(The New York Times, 1928).
The report of the inquiry commission was established later in time, probably causing the
discrepancy between the numbers presented below and those appearing in the aggregate
statistics reported by the inquiry.
The list contains a total of 328 persons, for whom we have either first name, last name or
both. Moreover, there is information on who belonged to the crew. We have deleted 20
observations for which we lack information on the first name. The number differs slightly (2
individuals) from the one given in the official inquiry. Table B12 presents the descriptive
statistics of the sample. The overall survival rate is about 59 percent. The survival rates for
men and women are 64.8% and 24.4% respectively, indicating that women had a clear
survival disadvantage compared to men. Likewise, we note that crew members were much
more likely to survive the disaster than the passengers.7 As noted previously, none of the
children survived. This compares to a survival rate of adults of 61.8%.
7 There are 3 female crew members in the passenger list, of who all died.

33
Table B12: Survival patterns in the SS Vestris disaster
Survivors Deceased Total
Overall 183 (59.4) 125 (40.6) 308
Gender
Women 10 (24.4) 31 (75.6) 41
Men 173 (64.8) 94 (35.2) 267
Traveler status
Passengers 46 (40.7) 67 (59.3) 113
Crew 137 (70.3) 58 (29.7) 195
Age groups
Children 0 (0) 12 (100) 12
Adults 183 (61.8) 113 (38.2)
Notes. Survival rates in parentheses

34
SS Morro Castle
The following description of the sinking of SS Morro Castle is based on When the
dancing stopped by Brian Hicks (Hicks, 2008).
The Ward Lines’ SS Morro Castle left Havana for its return to New York on September
5, 1934. According to Hicks there were 318 passengers and 231 crew members on board
(Hicks, 2008). The ship was built four years earlier and was one of the most modern ships of
the American East Cost. Most of the passengers did the travel as a holiday trip and they were
not divided into classes in such distinct ways as on transatlantic emigrant ships (Hicks, 2008).
On the evening of the last day at sea Captain Wilmott died as a result of a heart attack
(Hicks, 2008). First officer Warms replaced him as Master of the ship. At 2.45 AM September
8, a passenger reported what he thought to be smoke and the fire was soon discovered (Hicks,
2008). The fire had started in the foremost part of the ship. Acting Captain Warms did not
realize its true scale and tried to continue the trip towards New York. The course and the
speed of the ship fanned the fire which spread quickly. The crew attempted to extinguish the
fire but to no avail. At 4.00 AM the hoses were abandoned and evacuation begun.
The evacuation is described as disorganized especially with respect to behavior of the
crew. Captain Wilmott’s death had caused confusion in the order of ranks among them and no
distress call was sent out until 3.24 AM (Hicks, 2008). There is no indication of acting
Captain Warms ordering women and children to be saved first. It should also be noted that
because of low wages and hardships, the moral among the crew was low.
The lifeboat capacity was 2,000 persons. However, the fires location caused it to cut off
all access to the A-deck were they were placed. Further, some of the crew members had left
the ship in lifeboats even before the evacuation begun. The passengers gathered at the stern of
the ship, this being the place furthest away from the fire. Most of the survivors jumped into
the water and were picked up by assisting ships, which arrived at approximately 5 AM. The
water temperature was 21 degrees Celsius (Hicks, 2008), but the rescue operation was made
difficult by the rough seas. Also, the life vests injured several passengers who had not been
informed of the danger of jumping into the water with them put on. Drowning seems to have
been the most common cause of death. Many people were trapped in their cabins and killed
by the fire.
Acting Captain Warms and most of the ship’s officers survived the disaster. They were
among the last survivors to leave the ship. The ship never sank. It drifted ashore at Asbury
Park, New Jersey.
The data for the Morro Castle are collected from the passenger list appearing in Morro
Castle: the forgotten voices, by Jim Kalufus(Encyclopedia Titanica, 2004). The list is
primarily based on the Ward Line ticketing and cabin lists and contains the names of
passengers known to have been on board the Morro Castle at the time of the accident. The
figures on numbers of passengers and crew differ slightly from the numbers given by
Hicks(Hicks, 2008). We are unable to determine the gender of 4 individuals. These are
excluded from the empirical analysis.
Table B13 shows that the overall survival rate of the 542 people onboard the ship is 76%.
This is high relative to the other disasters investigated in this survey. The survival probability
of women is only slightly lower than that of men: 74.6% vs. 76.8%. Likewise, the difference
in survival between passengers and crew is small relative to those for the other disasters in our
survey. We note that passengers traveling in the company of family and friends had a slightly
higher chance of survival than passengers traveling alone. Information on travel
companionship is inferred from cabin data. The individual is treated as being part of a group if
this is stated in the list or she shared cabin with someone, either spouse or other.
The Morro Castle had passenger cabins distributed on four decks (A, C-E). The
passenger list contains information on which deck people resided. However, there seems to be
35
no systematic deck-survival pattern onboard the Morro Castle. A-deck passengers, which
occupied the cabins placed in the uppermost part of the ship, have the lowest survival rate
(47.4%) whereas people on the C and D decks had the highest (75.8 and 75.7%).

36
Table B13: Survival patterns in the SS Morro Castle disaster
Survivors Deceased Total
Overall 412 (76) 130 (24) 542
Gender
Women 147 (74.6) 50 (25.4) 197
Men 265 (76.8) 80 (23.2) 345
Traveler status
Passengers 226 (71.1) 92 (28.9) 318
Crew 186 (83) 38 (17) 224
Companionship
In group 118 (72.4) 45 (27.6) 163
Alone 108 (69.7) 47 (30.3) 155
Deck
A 9 (47.4) 10 (52.6) 19
C 119 (75.8) 38 (24.2) 157
D 76 (75.7) 27 (24.3) 103
E 22 (56.4) 17 (43.6) 39
Notes. Survival rates in parentheses

37
MV Princess Victoria
This is a summary of the description of the disaster found in Death in the North Channel
(Cameron, 2002).
During a severe windstorm on 31 January 1953, the roll-on, roll-off (RORO) ferry
Princes Victoria sank in the North Channel en route from Scotland to Northern Ireland with a
loss of 135 lives.
The vessel left Stranraer (Scotland) for its regular, 20 miles sail to Larne (Northern
Ireland) at 07:45 AM. On board the ship were 128 passengers, mainly traveling in business or
on vacation, and 51 crewmembers. The captain, James Ferguson, who had served as master
on ferries in the North Channel for 17 years, had decided to put to sea despite the fact that
gale warnings (winds of 75-80 mph) had been issued throughout the night before the
departure. After leaving the calmer waters of the Scottish inland sea, Princess Victoria sat a
westward course that exposed the ship to the high seas in the North Channel. A series of huge
waves damaged the stern doors. The crew struggled to seal the doors but they were too badly
broken. Sea water quickly flooded the car deck and the vessel took on a sharp list to starboard.
Captain Ferguson made an attempt to prevent more water from entering the ship by going in
reverse back to the Scottish mainland. But because of inability to use the bow rudder, this
proved impossible and the ship was forced to continue its trip towards Northern Ireland.
Captain Ferguson managed to sail the stricken vessel for four hours through the storm.
However, at 2 PM the ship capsized and sank
When the captain realized that the capsizing was unavoidable he ordered the passengers
to reach for the port side deck. However, the 60 degree list made it difficult for people to
move and the crew had to rig lines by which people could climb up the deck. The list also
made it difficult to lower the lifeboats. There were five of them with a capacity of 1,440
persons, but only three were launched and one was smashed against the hull. All its
occupants, mostly women and children, were thrown into the water.
It appears as if most passengers managed to reach the deck. Several of the survivors were
standing on the portside deck. When the ship lurched on its side, they managed to haul
themselves over to the ship’s side, an act demanding strength and agility. With the ship’s side
serving as floor they could reach the lifeboats that were gathered at the stern (Cameron,
2002). The less fortunate passengers fell off the deck as the list increased. The weather made
it difficult to reach people in the water from the lifeboats and they were soon pulled down by
the heavy sea or succumbed to hypothermia and drowned.
Witness accounts tell that Captain Ferguson did no attempts to save himself. There is no
indication that he gave the order ‘women and children first’. The captain had tried to calm the
passengers, and the evacuation is not to be described as disorganized. Instead there are several
descriptions of passengers and crew helping each other to reach the deck and the lifeboats.
The Princess Victoria asked for urgent assistant forty-five minutes after the stern doors
were damaged. Although the coast guard had continuous radio contact with the Pricipessa
Mafalda, it was difficult for them to locate the ship. Consequently, it took almost one and a
half hour before the first rescue ship arrived at the wreck site. The extreme weather conditions
made it very difficult to locate and pick up survivors from the water, which was 4 degrees
Celsius (Cameron, 2002). In total, 44 persons had been recovered when the rescue operation
was called off in the early evening. Notably, none of the women and children on board the
ship was among the survivors.
We have obtained individual level data from the passenger and crew manifest provided
in the Death in the North Channel: The loss of the Princess Victoria (Cameron, 2002).
According to the records there were 179 people on board the ship. This data are summarized
in Table B14. We have information on the city of residence of the passengers and crew
members. Accordingly, we can determine their nationality. Passengers from Northern Ireland,

38
Scotland and England had survival rates of 78.4%, 72.5% and 66.7% respectively. As
mentioned all women on board died. The crew had a lower survival rate than passengers (20%
vs. 26.4%).

39
Table B14: Survival patterns in the SS Princess Victoria
disaster
Survivors Deceased Total
Overall 44 (24.6) 135 (75.4) 179
Gender
Women 0 (0) 31 (100) 31
Men 44 (29.3) 104 (70.7) 148
Traveler status
Passengers 34 (26.4) 95 (73.6) 129
Crew 10 (20) 40 (80) 50
Age groups
Children 0 (0) 5 (100) 5
Adults 44 (25.3) 130 (74.7) 174
Nationality
Northern Ireland 24 (21.6) 87 (78.4) 111
Scotland 11 (27.5) 29 (72.5) 40
England 7 (33.3) 14 (66.7) 21
Ireland 0 (0) 5 (100) 5
Wales 2 (100) 0 (0) 2
Notes. Survival rates in parentheses

40
SS Admiral Nakhimov
This text is based on the thorough description given by Andrey Leonov, who has
conducted impressive research on the disaster (Admiral Nakhimov Resource, 2012).
The SS Admiral Nakhimov was a passenger liner of the German Weimar Republic,
before it became a Soviet passenger ship. On the day of the disaster the ship left Novorossiysk
by the Black Sea for the resort town Sochi with 888 passengers and 346 crew members on
board. Soon after the departure, the ship's pilot noticed that they were on a collision course
with the bulk carrier Pyotr Vasev.
The pilot radioed a warning to the Pyotr Vasev but its captain neither slowed down nor
changed course. Captain Markov of the Admiral Nakhimov, was convinced that the freighter
would pass without incident and retired to his cabin, leaving his second mate in charge. At
11:10 PM it became clear that the freighter headed directly for the ship and both ships
immediately set their engines in reverse, but the collision was inevitable and a few minutes
later Pyotr Vasev rammed into Admiral Nakhimov’s starboard side.
Water flooded into a large hole in the hull and through the open cabin windows. Admiral
Nakhimov took on a starboard list. Electricity shot down immediately after the collision and
left the ship in darkness. Many passengers had gone to bed by this time and those who woke
up by the collision found themselves lost in the dark. The situation was worsened by the hard
list which made it difficult to move. Although many of the crew members had worked on
board Admiral Nakhimov for a long time and had been trained in evacuation, the quickness of
the accident resulted in only one lifeboat and 8 out 24 life rafts being launched. With little
time to escape, passengers as well as crew members jumped into the water. Although the
water temperature was 24 degrees Celsius, the fuel oil leaking out from the engine room made
objects slippery and people had a difficulties staying afloat. Survivors give different reports
on the situation: some were trying to save the life of others, while some were seen trying to
save themselves at the expense of others.
Seven minutes after the collision the Admiral Nakhimov leaned over on her starboard
side and sank. Ten minutes later 64 ships, including Pyotr Vasev which had not been badly
damaged, and 20 helicopters came to rescue.
The only order given by the captain was to evacuate the ship. Hence there were no order
to prioritize women and children. Captain Markov survived the disaster and was sentenced to
15 years prison for misconduct.
The data are obtained from the work of Andrey Leonov (Admiral Nakhimov Resource,
2012). Aggregate survival statistics, for men and women separately, are available for both
passengers and crew. Table B15 summarizes the data. The overall survival rate was 66%. For
men it was 69%, whereas for women it was 63.5%. Crew members appear to have had an
advantage over passengers as their survival rates were 81.5% and 60% respectively.
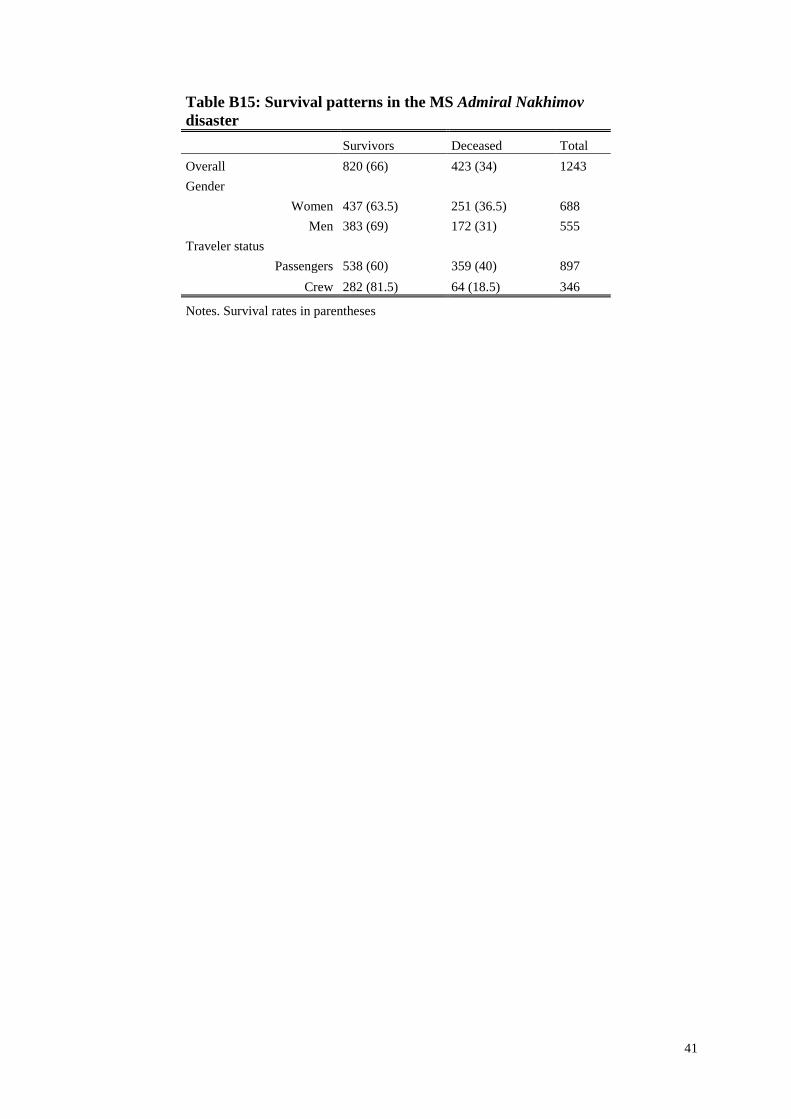
41
Table B15: Survival patterns in the MS Admiral Nakhimov
disaster
Survivors Deceased Total
Overall 820 (66) 423 (34) 1243
Gender
Women 437 (63.5) 251 (36.5) 688
Men 383 (69) 172 (31) 555
Traveler status
Passengers 538 (60) 359 (40) 897
Crew 282 (81.5) 64 (18.5) 346
Notes. Survival rates in parentheses

42
MS Estonia
The description of the sinking is based on the official report established by the Joint
Accident Investigation Commission of Estonia, Finland, and Sweden (The Joint Accident
Investigation Commision of Estonia Finland and Sweden, 1997).
MS Estonia departed Tallin, Estonia, on the evening of September 27, 1994 with a
scheduled arrival in Stockholm, Sweden, the following morning. It carried 989 people,
whereof 821 were passengers, who travelled to Sweden on a business trip or enjoyed a
holiday cruise.
The ship was investigated and found to be in good condition just before the departure.
The weather was bad, with poor visibility in combination with high seas (waves between 4
and 6 meters) and strong winds (up to 25 m/s). At 00.55 AM passengers and crew members
have reported hearing a loud bang from the bow. The sound continued for about 20 minutes,
with concurrent shakings and vibrations. The front bow visor had been ripped off by the
power of the waves and enormous amounts of water entered the cargo deck. The Estonia’s
lower compartments were quickly flooded and it took on a heavy starboard list. A few
minutes later several alarms were heard on the ship and about the same time the commando
bridge sent out a Mayday message asking for urgent assistance. Half an hour later, at 1.50
AM, it sank. From the first serious indications that something was wrong it took nearly one
hour before the Estonia disappeared from the radar screens.
When it became apparent to people on board that there was an emergency situation, they
tried to reach the boat deck. However, as time elapsed and the list increased it became very
difficult to move inside the ship. According to witnesses’ reports, the situation inside the ship
was tumultuous. People were panicking, loose objects were flying around, and the narrow
corridors were blocked by debris making it practically impossible to move safely. It has been
estimated that about 300 persons managed to reach the boat deck, whereas the great majority
seems to have been stuck inside the ship (The Joint Accident Investigation Commision of
Estonia Finland and Sweden, 1997). Those who reached the outer deck fell or jumped into the
water. Because of the list in combination with the strong winds only 3 out of the Estonia’s 10
lifeboats were successfully launched. Instead, passengers and crew members tried to launch
the inflatable life rafts. The lifeboats and life rafts had a combined capacity of 1,575 persons.
Because of the late hour people were poorly dressed, many wearing only underwear. The
water temperature was between 10 and 12 degrees Celsius at the time of the sinking. Many
people drowned as they were unable to get up into a life raft. The first ship came to rescue at
2.12 AM – about 20 minutes after the sinking. However, the rough weather made it very
difficult to pick up survivors and the persons who were still alive had to spend several hours
in the life rafts. People suffered from severe hypothermia and those who were unable to hold
on to the rafts were washed overboard. Nevertheless, witness accounts tell that some persons
helped others to get up from the water into the life rafts, despite an obvious risk to their own
lives.
Several ships and helicopters assisted in the rescue operation during the night and the
following day. The last survivors were found at around 8.00 AM, 7 hours after the sinking. In
the end, only 137 persons had survived the disaster.
The evacuation of the Estonia was not orderly organized. There is little information
about the captain’s whereabouts during the accident. We know that his body has not been
recovered but there are no records about his particular role in the evacuation. Neither witness
reports nor any other sources indicate that he ordered “women and children first”.
Unfortunately, there is limited information about the behavior of the crew during the disaster.
There are, however, some witness reports of crew members assisting in the unloading of
lifeboats.

43
The data originate from the official list as of October 29, 1996, established by the
Investigation Division at the Swedish National Bureau of Investigation (Utredningsroteln vid
Rikskriminalpolisen) and have been provided to us by the National Archives and the Regional
State Archives of Sweden (Riksarkivet). The data contain information on passenger/crew
status, as well as information on gender, nationality and age. As indicated in Table B16, men
had a survival rate of 22% compared to 5.4% for women. Among the different nationalities,
the Swedish passengers had the lowest survival rate. The crew appears to have had an
advantage as their survival rate was 20.2%, compared to 12.3% for passengers. Individuals in
age group 16–50 had higher survival rate than children and older adults.

44
Table B16: Survival patterns in the MS Estonia disaster
Survivors Deceased Total
Overall 137 (13.9) 852 (86.1) 989
Gender
Women 26 (5.4) 459 (94.6) 485
Men 111(22) 393 (78) 504
Traveler status
Passengers 98 (12.3) 698 (87.7) 796
Crew 39 (20.2) 154 (78.8) 193
Age 39.2 46.4 44.7
Age groups
<16 2 (12.5) 14 (87.5) 16
16-50 121 (19.9) 486 (80.1) 607
50+ 14 (3.8) 352 (96.2) 366
Nationality
Swedish 49 (8.9) 501 (91.1) 550
Estonian 64 (18.6) 280 (81.4) 344
Others 24 (25.3) 71 (74.7) 95
Notes. Survival rates in parenthesis
45
MV Princess of the Stars
We have not been able to find an official report on the sinking of the MV Princess of the
Stars. Instead, this description is based on various newspaper articles about the disaster.
The Philippine passenger ship MV Princess of the Stars was owned by the Sulpicio
Lines. It left Manila, Philippines, for Cebu City, on June 20, 2008. Reports on the number of
passengers vary. According to the ship’s manifest there were 626 passengers and 121 crew
members, later reports tell of a complement totaling 850 people (BBC, 2008). We have no
information on whether people travelled as a holiday trip or as a pure means of transportation.
On June 21, the ship encountered a typhoon and at 12.30 PM it sent out a distress call
telling that its engines were malfunctioning. After this radio contact, the ship was lost (BBC,
2008). The ship ran aground, because of the weather conditions, and capsized soon afterwards
(The Guardian, 2008a). The ship did not sink entirely; its bow was visible for several days.
There are scarce accounts on the evacuation. According to the report from one witness
people were ordered to abandon the ship. The ship tilted and it became difficult to move on
the rain soaked deck, especially for older people and children (BBC, 2008). There were big
problems in launching the lifeboats. Several of them flipped over by the heavy wind. Many
passengers chose to jump off the ship instead, but they had to struggle with the heavy sea and
most of them drowned (The Guardian, 2008a). We have no information on whether there
were enough lifeboats, but there is no mentioning of them being insufficient in the reports
following the disaster, neither was the ship overloaded. We therefore find it likely that the
ship had enough lifeboats. The weather also reduced the possibilities to reach shore in life
rafts. Many people were washed off the rafts by the huge waves. It appears to have been
difficult to reach the deck. Divers who investigated the wreck have found many passengers
trapped inside the ship (The Guardian, 2008a). Because of the weather, no rescue ship arrived
until 24 hours after the sinking.
We have not found any reports on the acting of the passengers, the crew or the captain.
Thus, we do not know whether the captain gave order to prioritize women and children. We
know, however, the captain did not survive the disaster.
The weather was the main cause of the sinking. It was reported that the typhoon had
wind gusts of 150 km/hour at its peak. The heavy rain diminished visibility and passengers
reported that, though at noon, it was dark (The Guardian, 2008b). The prosecution following
the disaster concluded that the blame was to put on the shipowner, the Sulpicio Line, for
allowing its ship to sail despite the typhoon warnings.
The data are collected from the list published by the Sulpicio Lines and the Philippine
Coast Guard (Sulpicio Lines, 2008).8 The data contain the names of the surviving and
deceased passengers and crew members. According to the records there were 850 people
onboard the ship at the time of the accident. An overall survival rate of only 6.9% indicates
that the wreckage of the Princess of the Stars was a very deadly disaster. We have determined
the gender of those on board using information about their names. We lack information on the
first name of 6 individuals however. Consequently, we omit them from the empirical analysis.
Regarding the gender specific survival rates we note that women have about four times lower
probability of survival than the men and that the passengers had a higher chance of survival
than crew members. Table B17 presents descriptive statistics.
8 The Sulpicio Line’s homepage is no longer available but the data are obtainable from the reference cited.

46
Table B17: Survival patterns in the SS Princess of the Stars
disaster
Survivors Deceased Total
Overall 59 (6.9) 791 (93.1) 850
Gender
Women 8 (2.4) 320 (97.6) 328
Men 51 (9.8) 471 (90.2) 522
Traveler status
Passengers 54 (7.3) 685 (92.7) 739
Crew 5 (4.5) 106 (95.5) 111
Notes. Survival rates in parentheses

47
MV Bulgaria
This description is composed by information from several news articles on the sinking of
the MV Bulgaria.
The Russian river cruise ship Bulgaria left Bolgar, Russia, heading towards Kazan on the
Volga River, on July 10, 2011. On board were 36 crewmembers and 154 passengers, of which
52 were younger than 16 years old. This was in violation with the safety requirements which
only allowed 120 passengers on board the Bulgaria (Rianovosti, 2011b). It was reported that
one engine was out of order and that the ship listed when it left port.
Six hours after its departure the Bulgaria encountered stormy weather, with thunder and
wind gusts of 70 km/h (Rianovosti, 2011b). When the captain tried to turn the ferry around
water rushed through the open portholes. The list increased and eventually Bulgaria capsized
and sank at 1.58 PM. Reports on the sinking time vary between 2 and 8 minutes (Rianovosti,
2011a, b).
There are scarce reports on the evacuation of the ship. The lifeboat capacity was 196
people, which was enough to carry the complement on board. However, because of the short
sinking time, it is unlikely that all lifeboats were launched. According to witnesses no alarm
informed the passengers of the danger. The electric power shut down before minutes before
the incident which may explain this. This may also be the reason for the failure to send a
distress call (Lenta, 2011). Divers found several passengers inside the ship, an indication of
them not having time to reach the deck. Also, most of the children were at a venue in the
ship’s music room, many without their parents (Rianovosti, 2011a). This may explain the high
death toll in this passenger category.
Most of the survivors were rescued by a nearby ship. There were several ships passing
by, which for some reason did not stop to assist the sinking ship (Rianovosti, 2011c). The
captain did not survive the disaster (Rianovosti, 2011d) and we have not found any indication
of him giving order to prioritize women and children. However, as there are such scarce
reports on his action we do not conclude that he did not.
The cause of the accident was determined to be the ship’s poor condition (Portnews,
2011). Following the disaster, charges were pressed against the inspector who examined the
ship before it left port, and against the ship owner (Rianovosti, 2011b).
Individual level data on the passengers and crew members on board the Bulgaria have
been collected from the official list established by the Ministry of the Russian Federation for
Civil Defense, Emergencies and Elimination of Consequences of Natural disasters (Emercom,
2011). Table B18 shows that the overall survival rate was 40.9%. In addition to information
on whether the individuals survived or died in the disaster, the dataset includes the names of
the passenger and crew members together with information on their date-of-birth. This allows
us to determine gender and age. We lack information on date-of-birth for 18 individuals. We
note that there were more women than men on board the Bulgaria at the time of the accident,
108 and 78 respectively. Regarding the gender specific survival rates we see that women had
a survival rate of 26.9%, while that of men was 60.3%. Moreover, we note that the crew
members were more than two times as likely to survive the shipwreck as the passengers. The
survivors are about 3 years younger than the deceased, on average.

48
Table B18: Survival patterns in the MV Bulgaria disaster
Survivors Deceased Total
Overall 76 (40.9) 110 (59.1) 186
Gender
Women 29 (26.9) 79 (73.1) 108
Men 47 (60.3) 31 (39.7) 78
Traveler status
Passengers 52 (33.8) 102 (66.2) 154
Crew 24 (75) 8 (25) 32
Age 28.6 31.9 30.5
Age groups
<16 16 (30.8) 36 (69.2) 52
16-50 47 (53.4) 41 (46.6) 88
50+ 8 (27.6) 21 (72.4) 29
Notes. Survival rates in parentheses

49
Appendix C
In this section we present more detailed results than we provide in the main text. We also
discuss results from supplementary analyses intended to show the robustness of the
conclusions presented in the main text.
Data underlying Figure 1.
Here we present the statistics that are used to construct Fig 1, in the main text. Table C1
displays the casualty statistics for MS. Note that the information about children is based on 9
shipwrecks only. This means that, for these 9 shipwrecks, the sub-groups Men and Women
exclude boys and girls. For the remaining 7 shipwrecks, however, boys and girls are included
in Men and Women.
Table C3 shows the casualty statistics for the Titanic disaster.

50
Table C1: Casualty statistics of MS
Survivors Deceased Total
Passengers
Men 1,802 (37.4) 3,010 (62.6) 4,812
Women 849 (26.7) 2,335 (73.3) 3,184
Children 95 (15.3) 526 (84.7) 621
Crew 1,441 (61.1) 918 (38.9) 2,359
Captain 7 (43.8) 9 (76.2) 16
Notes. Survival rates are in parentheses. Crew also includes captains.
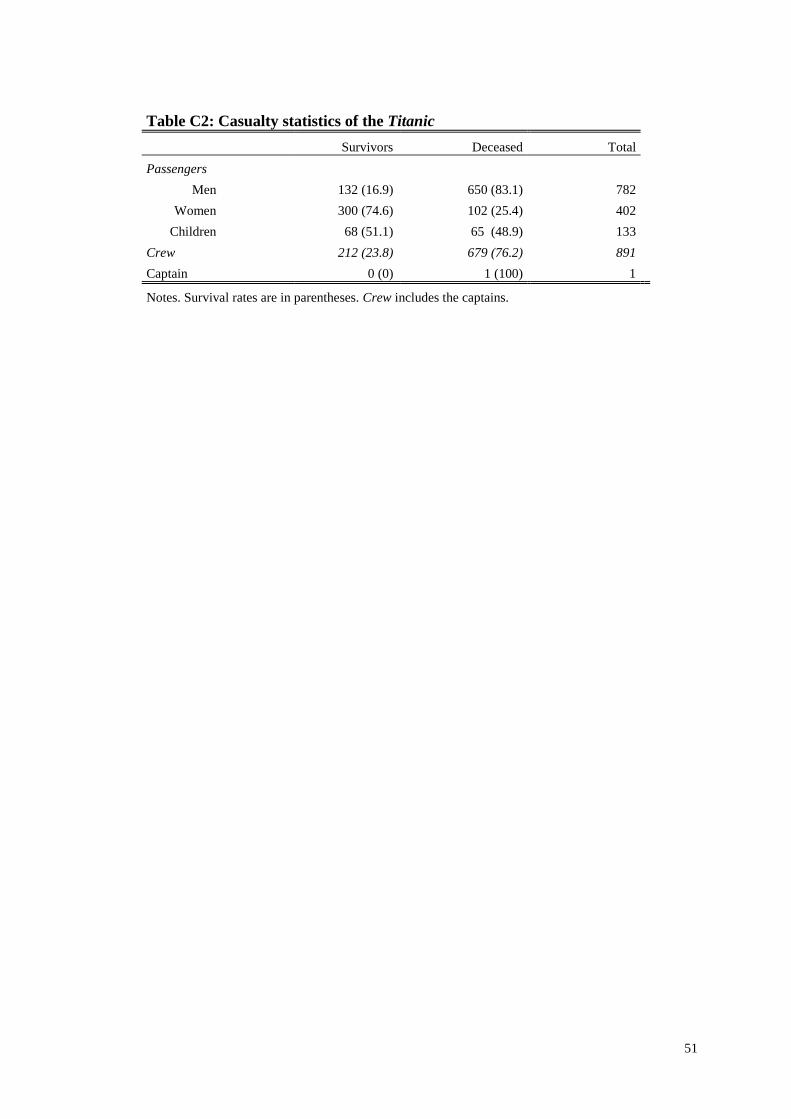
51
Table C2: Casualty statistics of the Titanic
Survivors Deceased Total
Passengers
Men 132 (16.9) 650 (83.1) 782
Women 300 (74.6) 102 (25.4) 402
Children 68 (51.1) 65 (48.9) 133
Crew 212 (23.8) 679 (76.2) 891
Captain 0 (0) 1 (100) 1
Notes. Survival rates are in parentheses. Crew includes the captains.

52
Table C3: Regression results for each shipwreck in FS
Shipwreck
Estimates of the coefficient for Female Estimates of the coefficient for Crew
N LPM Probit LPM Probit
(1) (2) (3) (4) (5) (6) (7) (8) (9) (10) (11) (12)
HMS Birkenhead 0.665 0.729
n.a. n.a. n.a. n.a. 0.546 0.557
n.a. 0.561 0.567
n.a. 547-554
(<0.001) (<0.001) (<0.001) (<0.001) (<0.001) (<0.001)
SS Arctic -0.199 -0.188 -0.168
n.a. n.a. n.a. 0.093 0.021 -0.034 0.090 0.022 -0.059
206-268
(<0.001) (<0.001) (<0.001) (0.043) (0.697) (0.589) (0.039) (0.697) (0.325)
SS Golden Gate -0.136 -0.075 -0.120 -0.139 -0.079 -0.141 0.240 0.229 0.295 0.245 0.234 0.303
356
(0.082) (0.334) (0.136) (0.091) (0.343) (0.124) (<0.001) (<0.001) (<0.001) (<0.001) (<0.001) (<0.001)
SS Northfleet -0.227 -0.233 -0.184 -0.312 -0.317 -0.244 -0.012 -0.065
n.a. -0.012 -0.058
n.a. 338-367
(<0.001) (<0.001) (<0.001) (<0.001) (<0.001) (<0.001) (0.879) (0.419) (0.880) (0.446)
RMS Atlantic -0.521 -0.469 -0.469
n.a. n.a. n.a. 0.586 0.460 0.465 0.692 0.640 0.648
633-868
(<0.001) (<0.001) (<0.001) (<0.001) (<0.001) (<0.001) (<0.001) (<0.001) (<0.001)
SS Princess Alice -0.096 -0.087 -0.032 -0.095 -0.086 -0.032 0.174 0.136 0.082 0.141 0.103 0.041
578-837
(<0.001) (0.001) (0.076) (<0.001) (0.001) (0.047) (0.030) (0.085) (0.233) (0.011) (0.059) (0.158)
SS Norge -0.192 -0.183 -0.180 -0.197 -0.190 -0.181 0.150 0.062 0.026 0.130 0.047 0.018
795
(<0.001) (<0.001) (<0.001) (<0.001) (<0.001) (<0.001) (0.012) (0.314) (0.716) (0.005) (0.304) (0.745)
RMS Titanic 0.526 0.542 0.499 0.506 0.526 0.527 -0.142 0.035 0.141 -0.145 0.042 0.192
2198-2208
(<0.001) (<0.001) (<0.001) (<0.001) (<0.001) (<0.001) (<0.001) (0.067) (<0.001) (<0.001) (0.069) (<0.001)
RMS Empress of Ireland -0.288 -0.165 -0.171 -0.335 -0.215 -0.229 0.388 0.330 0.354 0.372 0.303 0.332
1448
(<0.001) (<0.001) (<0.001) (<0.001) (<0.001) (<0.001) (<0.001) (<0.001) (<0.001) (<0.001) (<0.001) (<0.001)
RMS Lusitania -0.029 -0.013 -0.028 -0.023 -0.013 -0.029 0.044 0.040 0.034 0.044 0.039 0.035
1287-1958
(0.238) (0.633) (0.346) (0.240) (0.634) (0.343) (0.057) (0.114) (0.465) (0.056) (0.114) (0.458)
SS Principessa Mafalda -0.008 0.036 0.053 -0.008 0.034 0.05 0.167 0.175 0.154 0.187 0.195 0.175
1186
(0.803) (0.270) (0.105) (0.802) (0.284) (0.119) (<0.001) (<0.001) (<0.001) (<0.001) (<0.001) (<0.001)
SS Vestris -0.404 -0.269 -0.254 -0.416 -0.287 -0.287 0.295 0.209 0.168 0.296 0.214 0.161
296-308
(<0.001) (0.002) (0.002) (<0.001) (0.003) (0.004) (<0.001) (0.002) (0.012) (<0.001) (0.001) (0.016)
SS Morro Castle -0.022 0.079 0.073 -0.022 0.071 0.068 0.12 0.166 0.308 0.123 0.163 0.281
542
(0.569) (0.121) (0.148) (0.566) (0.121) (0.142) (0.001) (0.001) (0.001) (0.001) (<0.001) (<0.001)
MV Princess Victoria -0.297 -0.311 -0.332
n.a. n.a. n.a. -0.064 -0.095 -0.134 -0.066 -0.112 -0.176
148-179
(<0.001) (<0.001) (<0.001) (0.358) (0.169) (0.075) (0.373) (0.185) (0.092)
SS Admiral Nakhimov -0.055 0.002
n.a. -0.055 -0.001
n.a. 0.215 0.216
n.a. 0.234 0.234
n.a. 1243
(0.041) (0.933) (0.042) (0.972) (<0.001) (<0.001) (<0.001) (<0.001)
MS Estonia -0.167 -0.172 -0.161 -0.166 -0.171 -0.150 0.079 0.094 0.034 0.071 0.083 0.031
989
(<0.001) (<0.001) (<0.001) (<0.001) (<0.001) (<0.001) (0.012) (0.002) (0.351) (0.006) (0.001) (0.203)
MS Princess of the Stars -0.073 -0.085
n.a. -0.080 -0.087
n.a. -0.028 -0.061
n.a. -0.032 -0.053
n.a. 850
(<0.001) (<0.001) (<0.001) (<0.001) (0.201) (0.012) (0.269) (0.041)
MV Bulgaria -0.334 -0.257 -0.216 -0.339 -0.271 -0.231 0.412 0.300 0.514 0.425 0.322
n.a. 148-186
(<0.001) (0.001) (0.006) (<0.001) (0.001) (0.005) (<0.001) (0.002) (<0.001) (<0.001) (0.003)
Notes. p-value, based on robust standard errors, in parentheses below the coefficient (marginal effect). N refers
to the number of observations over which the models have been estimated. N varies within some shipwrecks.
This is because, for some shipwrecks, the information underlying the regressor(s) is not available for everybody
in the shipwreck.

53
Tests of H1 for individual shipwrecks: linear probability models
In this section we provide additional support to the discussion surrounding the separate
analyses of the shipwrecks of FS in the main text. In all models, the dependent variable is
Survival.
Table C3, column 1–3, reports the coefficient for Female from a set of linear probability
models (LPM). These models serve as tests of the hypothesis (H1): that women have a
survival advantage over men in maritime disasters. The baseline model (Model 1) is:
. The subscript i indicate that the variables are estimated
at the individual level. We estimate Model 1 separately for each shipwreck.
Column 1 shows the regression estimates of , which we denote . We note that is
negative and statistically significant (p<0.01) for 11 of the 18 shipwrecks. In the case of both
the Admiral Nakhimov and the Golden Gate, is negative but the corresponding p-values are
somewhat higher. In three cases is statistically insignificant (p>0.10). And in two cases
(the Titanic and the Birkenhead) is statistically significant (p<0.01) and positive.
Next, we augment Model 1 with the variable Crew. The results, reported in column 2, do
not change much; becomes negative and statistically significant (p<0.01) for the Admiral
Nakhimov in addition to the previously 11 shipwrecks. Also, remains statistically
significant (p<0.01) and positive for the Birkenhead and the Titanic.
Next, we further augment Model 1 with more control variables. Physical strength and
mobility are likely to be important determinants of survival in a shipwreck. Unfortunately,
there is no information on these attributes available for any of the shipwrecks. It is however
reasonable to assume that young adults are stronger and more mobile than older adults and
children, which in turn may give them a relative survival advantage. Consequently, we would
like to control for age in the regressions. We have individual level information on age (or
child/adult) for 12 of the shipwrecks. For the Principessa Mafalada we lack information on
age for the crew and therefore do not control for age in the regression. Likewise, we do not
control for age in the regression for the Princess Victoria. Model 3 for these shipwrecks is
accordingly augmented with the age controls <16 and >50 (16–50 being the reference group),
or with Child (Adult being the reference group). Persons in these shipwrecks, for whom we
lack information on age, are omitted from the regressions.
Nationality is another individual characteristic that may have an impact on peoples’
chances of surviving in shipwrecks. For example, passengers belonging to the same
nationality as the crew may have an advantage in the evacuation because of shared language.
Information on the nationality of passengers and crew is available for 4 shipwrecks. We
augment Model 3 for these cases with nationality dummies, equal to one (=1) if the
passenger/crew member belong to the particular nationality and zero (=0) otherwise.
Another individual characteristic that may correlate with survival is passenger class. First
and second class cabins are often located further up in the ship, close to the lifeboats, while
third class compartments are often located at the lower decks, away from the lifeboats. Also,
in the case of a collision, or grounding, the ship’s hull, beneath, or just above, the water level
often takes the initial strike with the consequence that third class compartments are flooded
quicker than the first and second class decks. Previous studies on the loss of the Titanic and
the Lusitania report that first and second class passengers had a significantly better chance to
survive than third class passengers (Frey et al., 2011; Hall, 1986). For the 8 shipwrecks, for
which we have information on passenger class, we augment Model 3 with a set of dummy
variables for class: First class (Saloon) and Second class (Third class (Steerage) being the
reference group). The variables take the value one (=1) if the passenger belong to the
passenger class and zero (=0) otherwise.
We further augment Model 1 with a dummy variable Companionship, for the 3
shipwrecks for which the information is available. The social attachment model of human

54
behavior in disasters (Mawson, 2005) predicts that the presence of familiar persons affect
peoples’ perceptions of, and responses to, danger. A general finding is that people want to
keep proximity to attachment figures, such as family and friends (Becker and Eagly, 2004).
Accordingly, we may see differences survival probabilities between persons traveling alone
and those traveling as a part of a social entity. It is, however, not obvious whether the effect of
traveling with family or friends on survival probability is positive or negative. On the one
hand, the social attachment model suggest that group membership could act as a constraint on
survival if the member is slowed down by the search for and help directed to weaker
members. On the other hand a social entity can provide information and physical help which
in turn may increase the survival chances among its members.
Column 3 reports the results from Model 1 augmented with Crew as well as the
additional control variables (see Table A1). The set of control variables differ between the
shipwrecks, according to what which variables that are available for each shipwreck (see
Table A1). For three shipwrecks (Birkenhead, Admiral Nakhimov, Princess of the Stars) we
lack any regressors other than Female and Crew. Accordingly, the cells in column 3 are
denoted by n.a. (not available) for these shipwrecks.
The results in column 3 are similar in terms of statistical significance to those in column
2. In one case (the Princess Alice), and the corresponding p-value increase substantially
(p<0.076).
Tests of H1 for individual shipwrecks: probit models
Next, we show that our results are insensitive to the choice between the linear probability
model and the (non-linear) probit model, which has been used in previous studies of the
Titanic and the Lusitania. We estimate probit models (Model 2) of the form: ( ), where is the cumulative standard normal distribution
function.
The ’s are obtained using a Maximum Likelihood estimator. However, for ease of
interpretation, as well as to make the results comparable with the results from the linear
models we present the marginal effects. The impact of a change in a regressor on the
dependent variable is calculated with the finite difference method (Cameron and Trivedi,
2005). Table C3, column 4–6, reports the marginal effects for Crew from models augmented
with the same control variables as for the linear probability model. One caveat with the probit
model is that it falls short when all or no women survive. This is the case for four shipwrecks:
the Birkenhead (all of the women on board survived), the Arctic, the Princess Victoria, and
the Atlantic (all women perished). Accordingly, the cells corresponding to these shipwrecks
are denoted n.a. (not available). We note that the probit results with respect to Female are very similar in terms of
statistical significance to those obtained from the linear models. Likewise, the marginal
effects are similar in size to the ’s in column 1–3.
Tests of H2 for individual shipwrecks: linear probability models
The hypothesis that crew members have a survival advantage over passengers (H2) is
tested using the same approach as we used to test for gender differences. Table C3, column 7–
9, reports the coefficient for Crew from a set of linear probability models (LPM). We start by
estimating the following model (Model 3): . is the
estimate of . Table C3 shows that is statistically significant (p<0.01) and positive for 9
of the 18 shipwrecks. In four cases is positive, but p-values slightly higher (p<0.05). These
results show that, being a crew member, compared to a passenger, is associated with higher
probability of survival. This is in line with the hypothesis that the crew members have

55
informational advantages over the passengers, e.g. in knowledge about escape routes. In fact,
Titanic is the only shipwreck where is statistically significant (p<0.01) and negative.
To control for the influence of gender on the relationship between crew membership and
survival we augment the Model 3 with Female (this model is equivalent to Model 1
augmented with Crew). The results are reported in column 8, and are very similar to those in
column 7. However, for the Titanic, the coefficient changes sign. The p-value increases
somewhat for the Princess Alice. For the Norge and the Lusitania the p-values increase and
becomes statistically insignificant at conventional levels (p>0.1), when we control for
Female. Noteworthy, is negative (p=0.012) for the Princess of the Stars, when we control
for Female, suggesting that crew members have a survival disadvantage compared to
passengers.
We continue by estimating Model 3 with additional individual level controls. The results
are presented in column 9. The general conclusion from this exercise is that the inclusion of
additional controls does not change the precision of the s. One exception is the Titanic, for
which increases and becomes statistically significant (p<0.01).
Tests of H2 for individual shipwrecks: probit models
Next, we switch to a probit model of the form: ( ). We denote this model: Model 4. We augment the model in the same way as before. The
results are reported in column 10–12. We can conclude that the probit results are similar to the
results from the linear model in terms of statistical significance. The marginal effects are also
very similar to the corresponding coefficient estimates in column 7–9.
Regression results for: MS, MS+Lusitania, MS+Titanic, and FS
This section supports the results reported in Table 2 in the main text. We also show how
the results change when we augment MS with the data from the Lusitania and the Titanic
separately, and together (FS). Moreover, we report the regression results from a set of
unweighted models. Table C4–C7 report the results.
Table C4 reports the full results of Table 2 in the main text. The results in table C5–C7
follow the same logic as in Table C4.
The results in column 1 are generated by the following model (Model 5): . The subscript i indicates that the variable is measured at the
individual level. is a vector of shipwreck specific effects, which is included as a control for
unobservable differences that vary between the ships but do not vary between persons within
the ship. We let denote the regression estimate of . The results in column 2 are generated by the model (Model 6):
. We let denote the regression estimate of . Column 3–6 reports the separate tests of the hypotheses H3–H6, and column 7 reports
the joint test. The results are generated by the model (Model 7): ( ) . In the separate tests of H3–H6
(column 3–6) is a dummy: WCF, Post WWI, British ship, or Quick. is the
interaction between the hypothesis specific dummy variable and Female. In the joint test is
a vector including all hypothesis specific dummies (i.e. WCF, Post WWI, British ship, Quick).
and are the regression estimates of and . Table C5 displays the regression results when we augment MS with the Lusitania data.
We note that the results are largely similar to those for MS. Taken together; not much happens
when we add the Lusitania to MS. We note, however, that the coefficient for WCF*Female
becomes statistically significant.

56
Table C6 displays the results when we augment MS with the Titanic data. A few things
happen. The gender gap, and the crew-passenger gap decrease and p-values increase
marginally. The result that the WCF order benfits women is strengthened, compared to for the
MS. Otherwise, we find only minor changes in size or significance of the coefficients.
Table C7 presents the regression results for FS, i.e., the sample including data on all 18
shipwrecks. We note that our previous findings with respect to Female and Crew hold also for
this sample: the coefficients on Female and Crew are negative (p<0.001) and positive
(p<0.001), respectively. Regarding the results of the separate tests of H3–H6, we see that they
differ somewhat from those obtained for MS. The most notable discrepancy is that
Quick*Female is negative (p<0.01) and negative (p<0.10) in the separate and joints tests,
respectively. Another discrepancy is that Post WWI*Female is negative and statistically
insignificant on conventional levels (p>0.10) in table C7. In the joint test (column 7) it is
however similar to Post WWI*Female for MS (joint test) in terms of sign and p-value.
Likewise, British*Female is statistically insignificant (p>0.10), negative, in the separate test
(column 5) and statistically significant (p=0.01) negative in the joint test.
We can conclude that our findings in the main text i.e., that women have a distinct
survival disadvantage compared to men and that captains and crew survive at a significantly
higher rate than passengers, are robust to the inclusion of data from the Titanic and the
Lusitania. Although our findings with respect to the separate tests of H3–H6 are somewhat
sensitive to the inclusion of Lusitania and the Titanic the joint, and most reliable, tests of the
6 hypotheses is highly robust.

57
Table C4: Regression results for MS
(1) (2) (3) (4) (5) (6) (7)
VARIABLES Model Model Model Model Model Model Model
Female -0.167 -0.126 -0.151 -0.195 -0.093 -0.145 -0.151
(0.008) (0.009) (0.011) (0.013) (0.014) (0.013) (0.029)
(<0.001) (<0.001) (<0.001) (<0.001) (<0.001) (<0.001) (<0.001)
Crew
0.187 0.157 0.158 0.159 0.157 0.160
(0.011) (0.014) (0.014) (0.014) (0.014) (0.014)
(<0.001) (<0.001) (<0.001) (<0.001) (<0.001) (<0.001)
WCF
0.085
0.027
(0.024)
(0.026)
(0.001)
(0.295)
WCF*Female
0.019
0.072
(0.026)
(0.030)
(0.477)
(0.016)
Post WWI
0.116
0.092
(0.041)
(0.028)
(0.004)
(0.001)
Post WWI*Female
0.085
0.053
(0.019)
(0.029)
(<0.001)
(0.071)
British
-0.106
-0.025
(0.041)
(0.028)
(0.009)
(0.367)
British*Female
-0.153
-0.139
(0.019)
(0.024)
(<0.001)
(<0.001)
Quick
0.149 -0.131
(0.024) (0.029)
(<0.001) (<0.001)
Quick*Female
-0.009 0.032
(0.020) (0.025)
(0.663) (0.195)
Constant 0.346 0.325 0.244 0.329 0.435 0.179 0.457
(0.020) (0.020) (0.015) (0.020) (0.036) (0.014) (0.027)
(<0.001) (<0.001) (<0.001) (<0.001) (<0.001) (<0.001) (<0.001)
Observations 10,978 10,976 10,976 10,976 10,976 10,976 10,976
R-squared 0.249 0.270 0.242 0.244 0.247 0.242 0.247
Notes. Robust standard errors and p-value in parentheses below the coefficient. Model 1-7
include controls for shipwreck specific fixed effects. Observations in regressions of model 3-7
are weighted by the inverse of the number of individuals on board the ship.

58
Table C5: Regression results for MS augmented with the Lusitania
(1) (2) (3) (4) (5) (6) (7)
VARIABLES Model Model Model Model Model Model Model
Female -0.147 -0.109 -0.154 -0.169 -0.097 -0.148 -0.181
(0.008) (0.008) (0.011) (0.012) (0.014) (0.013) (0.028)
(<0.001) (<0.001) (<0.001) (<0.001) (<0.001) (<0.001) (<0.001)
Crew
0.153 0.147 0.146 0.146 0.145 0.149
(0.010) (0.013) (0.013) (0.013) (0.013) (0.013)
(<0.001) (<0.001) (<0.001) (<0.001) (<0.001) (<0.001)
WCF
0.083
0.033
(0.024)
(0.026)
(0.001)
(0.191)
WCF*Female
0.077
0.148
(0.021)
(0.023)
(<0.001)
(<0.001)
Post WWI
0.119
0.295
(0.041)
(0.032)
(0.003)
(<0.001)
Post WWI*Female
0.056
0.071
(0.019)
(0.028)
(0.003)
(0.013)
British
-0.109
0.173
(0.041)
(0.028)
(0.007)
(<0.001)
British*Female
-0.110
-0.116
(0.018)
(0.023)
(<0.001)
(<0.001)
Quick
0.147 0.060
(0.024) (0.030)
(<0.001) (0.043)
Quick*Female
0.015 0.052
(0.019) (0.024)
(0.412) (0.031)
Constant 0.345 0.329 0.245 0.330 0.440 0.183 0.062
(0.020) (0.020) (0.015) (0.020) (0.036) (0.014) (0.035)
(<0.001) (<0.001) (<0.001) (<0.001) (<0.001) (<0.001) (0.079)
Observations 12,936 12,934 12,934 12,934 12,934 12,934 12,934
R-squared 0.209 0.224 0.227 0.226 0.228 0.226 0.231
Notes. Robust standard errors and p-value in parentheses below the coefficient. Model 1-7
include controls for shipwreck specific fixed effects. Observations in regressions of model 3-7
are weighted by the inverse of the number of individuals on board the ship.
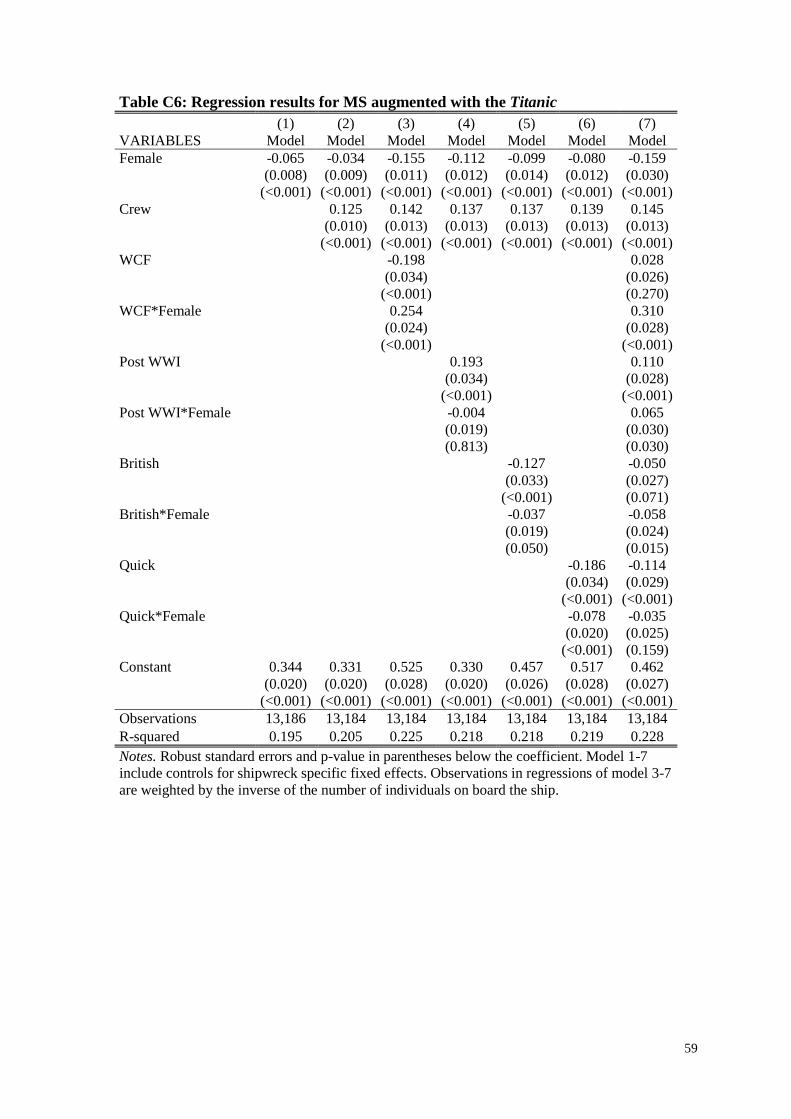
59
Table C6: Regression results for MS augmented with the Titanic
(1) (2) (3) (4) (5) (6) (7)
VARIABLES Model Model Model Model Model Model Model
Female -0.065 -0.034 -0.155 -0.112 -0.099 -0.080 -0.159
(0.008) (0.009) (0.011) (0.012) (0.014) (0.012) (0.030)
(<0.001) (<0.001) (<0.001) (<0.001) (<0.001) (<0.001) (<0.001)
Crew
0.125 0.142 0.137 0.137 0.139 0.145
(0.010) (0.013) (0.013) (0.013) (0.013) (0.013)
(<0.001) (<0.001) (<0.001) (<0.001) (<0.001) (<0.001)
WCF
-0.198
0.028
(0.034)
(0.026)
(<0.001)
(0.270)
WCF*Female
0.254
0.310
(0.024)
(0.028)
(<0.001)
(<0.001)
Post WWI
0.193
0.110
(0.034)
(0.028)
(<0.001)
(<0.001)
Post WWI*Female
-0.004
0.065
(0.019)
(0.030)
(0.813)
(0.030)
British
-0.127
-0.050
(0.033)
(0.027)
(<0.001)
(0.071)
British*Female
-0.037
-0.058
(0.019)
(0.024)
(0.050)
(0.015)
Quick
-0.186 -0.114
(0.034) (0.029)
(<0.001) (<0.001)
Quick*Female
-0.078 -0.035
(0.020) (0.025)
(<0.001) (0.159)
Constant 0.344 0.331 0.525 0.330 0.457 0.517 0.462
(0.020) (0.020) (0.028) (0.020) (0.026) (0.028) (0.027)
(<0.001) (<0.001) (<0.001) (<0.001) (<0.001) (<0.001) (<0.001)
Observations 13,186 13,184 13,184 13,184 13,184 13,184 13,184
R-squared 0.195 0.205 0.225 0.218 0.218 0.219 0.228
Notes. Robust standard errors and p-value in parentheses below the coefficient. Model 1-7
include controls for shipwreck specific fixed effects. Observations in regressions of model 3-7
are weighted by the inverse of the number of individuals on board the ship.

60
Table C7: Regression results for FS
(1) (2) (3) (4) (5) (6) (7)
VARIABLES Model Model Model Model Model Model Model
Female -0.061 -0.030 -0.156 -0.098 -0.101 -0.083 -0.157
(0.008) (0.008) (0.011) (0.011) (0.014) (0.012) (0.028)
(<0.001) (<0.001) (<0.001) (<0.001) (<0.001) (<0.001) (<0.001)
Crew
0.111 0.135 0.128 0.128 0.129 0.138
(0.009) (0.012) (0.012) (0.012) (0.012) (0.012)
(<0.001) (<0.001) (<0.001) (<0.001) (<0.001) (<0.001)
WCF
0.081
0.027
(0.024)
(0.026)
(0.001)
(0.286)
WCF*Female
0.235
0.300
(0.020)
(0.023)
(<0.001)
(<0.001)
Post WWI
0.124
0.328
(0.041)
(0.032)
(0.002)
(<0.001)
Post WWI*Female
-0.020
0.062
(0.018)
(0.029)
(0.273)
(0.032)
British
-0.114
0.167
(0.041)
(0.028)
(0.005)
(<0.001)
British*Female
-0.015
-0.060
(0.018)
(0.023)
(0.405)
(0.010)
Quick
0.178 0.101
(0.024) (0.029)
(<0.001) (<0.001)
Quick*Female
-0.054 -0.038
(0.019) (0.023)
(0.004) (0.097)
Constant 0.344 0.332 0.247 0.331 0.445 0.154 0.032
(0.020) (0.020) (0.015) (0.020) (0.036) (0.013) (0.035)
(<0.001) (<0.001) (<0.001) (<0.001) (<0.001) (<0.001) (0.360)
Observations 15,144 15,142 15,142 15,142 15,142 15,142 15,142
R-squared 0.169 0.178 0.212 0.205 0.205 0.205 0.214
Notes. Robust standard errors and p-value in parentheses below the coefficient. Model 1-7
include controls for shipwreck specific fixed effects. Observations in regressions of model 3-7
are weighted by the inverse of the number of individuals on board the ship.
61
Results from unweighted regressions
In table C8 we present the results of the separate tests of H3–H6, as well as the results of
the joint tests, from models estimated without sample weights. Since the results column H1
and H2 in Table 2 in the main text are generated without sample weights we omit them in this
analysis. From column 1 we can see that the coefficient on WCF*Female is similar in sign,
size, and p-value to its equivalent in Table 2. This is the case also for the joint test (column 7).
In fact, the p-value for WCF*Female is smaller than the corresponding p-value in Table 2
(<0.001 vs. 0.016). Regarding Post WWI*Female (column 2) we note that the coefficient is,
still, positive (p<0.001) but almost twice as large as the corresponding coefficient in Table 2
(p<0.001). The coefficient obtained in joint test (column 7) is also relatively large.
Noteworthy is that the p-value is smaller than the corresponding p-value in Table 2.
Moreover, we note that the coefficient on British*Female (p<0.001) in column 3 is
marginally larger than the corresponding coefficient in Table 2 (p<0.001). This finding
remains also for the joint test.
The coefficients on Quick*Female (columns 4 and 7) are, similarly to their equivalents
in Table 2, statistically insignificant on all conventional levels (p>0.10).
Table C9–C11 report the results from unweighted regressions for the MS+Lusitania,
MS+Titanic, and the FS. We note that these results are very similar to the results in Table C5–
C7. The most notable differences are that the coefficient for Quick*Female vary in terms of
sign, size and significance. Furthermore the significance of the coefficient for British*Female
is somewhat sensitive to the inclusion of the Titanic.
We can conclude that the results in Table 2 are not particularly sensitive to omission of
sample weights.

62
Table C8: Results from unweighted regressions on MS
(1) (2) (3) (4) (5)
VARIABLES Model Model Model Model Model
Female -0.127 -0.210 -0.062 -0.131 -0.216
(0.009) (0.012) (0.011) (0.011) (0.026)
(<0.001) (<0.001) (<0.001) (<0.001) (<0.001)
Crew 0.187 0.188 0.187 0.187 0.189
(0.011) (0.011) (0.011) (0.011) (0.011)
(<0.001) (<0.001) (<0.001) (<0.001) (<0.001)
WCF 0.109
0.039
(0.038)
(0.033)
(0.004)
(0.245)
WCF*Female 0.017
0.114
(0.030)
(0.032)
(0.574)
(<0.001)
Post WWI
-0.123
0.123
(0.039)
(0.041)
(0.001)
(0.003)
Post WWI*Female
0.157
0.138
(0.016)
(0.026)
(<0.001)
(<0.001)
British
0.240
0.048
(0.030)
(0.030)
(<0.001)
(0.108)
British*Female
-0.178
-0.117
(0.016)
(0.023)
(<0.001)
(<0.001)
Quick
0.108 0.182
(0.038) (0.030)
(0.005) (<0.001)
Quick*Female
0.009 0.104
(0.016) (0.019)
(0.564) (<0.001)
Constant 0.216 0.326 0.086 0.216 0.056
(0.033) (0.020) (0.023) (0.033) (0.035)
(<0.001) (<0.001) (<0.001) (<0.001) (0.110)
Observations 10,976 10,976 10,976 10,976 10,976
R-squared 0.270 0.275 0.276 0.270 0.279
Notes. Robust standard errors and p-value in parentheses below the
coefficient. Model 1-5 include controls for shipwreck specific fixed
effects.
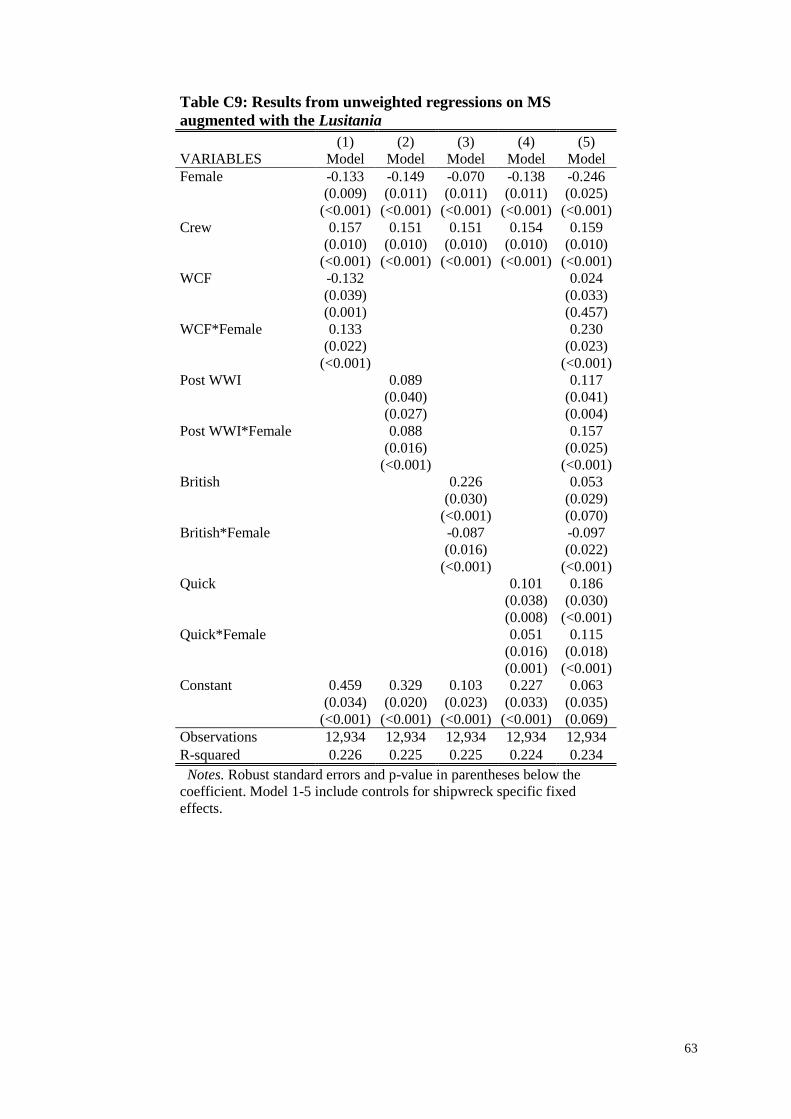
63
Table C9: Results from unweighted regressions on MS
augmented with the Lusitania
(1) (2) (3) (4) (5)
VARIABLES Model Model Model Model Model
Female -0.133 -0.149 -0.070 -0.138 -0.246
(0.009) (0.011) (0.011) (0.011) (0.025)
(<0.001) (<0.001) (<0.001) (<0.001) (<0.001)
Crew 0.157 0.151 0.151 0.154 0.159
(0.010) (0.010) (0.010) (0.010) (0.010)
(<0.001) (<0.001) (<0.001) (<0.001) (<0.001)
WCF -0.132
0.024
(0.039)
(0.033)
(0.001)
(0.457)
WCF*Female 0.133
0.230
(0.022)
(0.023)
(<0.001)
(<0.001)
Post WWI
0.089
0.117
(0.040)
(0.041)
(0.027)
(0.004)
Post WWI*Female
0.088
0.157
(0.016)
(0.025)
(<0.001)
(<0.001)
British
0.226
0.053
(0.030)
(0.029)
(<0.001)
(0.070)
British*Female
-0.087
-0.097
(0.016)
(0.022)
(<0.001)
(<0.001)
Quick
0.101 0.186
(0.038) (0.030)
(0.008) (<0.001)
Quick*Female
0.051 0.115
(0.016) (0.018)
(0.001) (<0.001)
Constant 0.459 0.329 0.103 0.227 0.063
(0.034) (0.020) (0.023) (0.033) (0.035)
(<0.001) (<0.001) (<0.001) (<0.001) (0.069)
Observations 12,934 12,934 12,934 12,934 12,934
R-squared 0.226 0.225 0.225 0.224 0.234
Notes. Robust standard errors and p-value in parentheses below the
coefficient. Model 1-5 include controls for shipwreck specific fixed
effects.

64
Table C10: Results from unweighted regressions on MS
augmented with the Titanic
(1) (2) (3) (4) (5)
VARIABLES Model Model Model Model Model
Female -0.135 -0.004 -0.075 0.044 -0.231
(0.009) (0.012) (0.011) (0.012) (0.028)
(<0.001) (0.718) (<0.001) (<0.001) (<0.001)
Crew 0.147 0.126 0.128 0.128 0.148
(0.010) (0.010) (0.010) (0.010) (0.009)
(<0.001) (<0.001) (<0.001) (<0.001) (<0.001)
WCF 0.094
-0.207
(0.038)
(0.021)
(0.013)
(<0.001)
WCF*Female 0.562
0.671
(0.022)
(0.027)
(<0.001)
(<0.001)
Post WWI
0.096
-0.215
(0.040)
(0.037)
(0.018)
(<0.001)
Post WWI*Female
-0.063
0.164
(0.017)
(0.027)
(<0.001)
(<0.001)
British
-0.100
0.240
(0.040)
(0.022)
(0.013)
(<0.001)
British*Female
0.092
-0.018
(0.017)
(0.024)
(<0.001)
(0.463)
Quick
0.129 0.095
(0.039) (0.020)
(0.001) (<0.001)
Quick*Female
-0.179 0.017
(0.017) (0.020)
(<0.001) (0.386)
Constant 0.228 0.330 0.430 0.202 0.194
(0.032) (0.020) (0.035) (0.033) (0.022)
(<0.001) (<0.001) (<0.001) (<0.001) (<0.001)
Observations 13,184 13,184 13,184 13,184 13,184
R-squared 0.246 0.206 0.207 0.212 0.251
Notes. Robust standard errors and p-value in parentheses below the
coefficient. Model 1-5 include controls for shipwreck specific fixed
effects.

65
Table C11: Results from unweighted regressions on FS
(1) (2) (3) (4) (5)
VARIABLES Model Model Model Model Model
Female -0.139 -0.003 -0.078 0.039 -0.115
(0.009) (0.011) (0.011) (0.012) (0.026)
(<0.001) (0.798) (<0.001) (0.001) (<0.001)
Crew 0.130 0.112 0.114 0.111 0.131
(0.009) (0.009) (0.009) (0.009) (0.009)
(<0.001) (<0.001) (<0.001) (<0.001) (<0.001)
WCF 0.093
-0.001
(0.038)
(0.033)
(0.014)
(0.969)
WCF*Female 0.387
0.467
(0.019)
(0.021)
(<0.001)
(<0.001)
Post WWI
-0.105
0.173
(0.038)
(0.040)
(0.006)
(<0.001)
Post WWI*Female
-0.068
0.082
(0.016)
(0.026)
(<0.001)
(0.002)
British
-0.103
0.036
(0.040)
(0.029)
(0.011)
(0.227)
British*Female
0.092
-0.053
(0.016)
(0.023)
(<0.001)
(0.022)
Quick
0.125 0.277
(0.039) (0.029)
(0.001) (<0.001)
Quick*Female
-0.138 -0.104
(0.016) (0.017)
(<0.001) (<0.001)
Constant 0.234 0.332 0.434 0.208 0.016
(0.032) (0.020) (0.035) (0.033) (0.035)
(<0.001) (<0.001) (<0.001) (<0.001) (0.645)
Observations 15,142 15,142 15,142 15,142 15,142
R-squared 0.203 0.179 0.179 0.182 0.210
Notes. Robust standard errors and p-value in parentheses below the
coefficient. Model 1-5 include controls for shipwreck specific fixed
effects.

66
References
Addison, A.C., Matthews, W.H., 1906. A deathless story of the "Birkenhead" and its heroes:
being the only full and authentic account of the famous shipwreck extant, founded on
collected official, documentary, and personal evidence, and containing the narratives and lives
of actors in the most glorious ocean tragedy in history. Hutchinson & Co., London.
Admiral Nakhimov Resource, 2012. Website. http://admiral-nakhimov.net.ru/. Last accessed
2012-2002-2019.
Aspinall, B.C., Great Britain. Board of Trade, 1929. Shipping casualties: Loss of the
steamship "Vestris". H.M.S.O.
Baltimore News, 1928. Crew of Vestris took best boats, says witness, Baltimore News.
BBC, 2008. Website. http://news.bbc.co.uk/2/hi/asia-pacific/7467696.stm. Last Accessed
2012-2002-2015.
Becker, S.W., Eagly, A.H., 2004. The heroism of women and men. Am Psychol 59, 163-178.
Bevan, D., 1989. Drums of the Birkenhead. London Stamp Exchange, London.
British Commisioner of Wrecks, 2012. "Official transcript of the British wreck commisioner's
inquiry".
Cameron, C.A., Trivedi, P.K., 2005. Microeconometrics: Methods And Applications.
Cambridge University Press.
Cameron, S., 2002. Death in the North Channel: the loss of the Princess Victoria, January
1953. Colourpoint Books, Newtonard N. Ireland.
Cochkanoff, G., Chaulk, B., 2009. SS Atlantic: The White Star Line's First Disaster at Sea.
Goose Lane Editions, Fredricton Canada.
Emercom, 2011. Website. www.mchs.gov.ru/upload/Spiskieng.docx. Last accessed 2012-
2001-2020.
Empress of Ireland Resource, 2004. Website. http://www.sea-
viewdiving.com/shipwreck_info/empress_home/passengerindex.htm. Last accessed 2012-
2001-2026.
Encyclopedia Titanica, 2001. Website. http://www.encyclopedia-titanica.org/empress-of-
ireland.html. Last accessed 2012-2001-2020.
Encyclopedia Titanica, 2004. Website. http://www.encyclopedia-titanica.org/morro-castle-
the-forgotten-voices.html. Last accessed 2012-2001-2014.
Encyclopedia Titanica, 2012. Website, http://www.encyclopedia-
titanica.org/titanic_passenger_list/. Last accessed 2012-2001-2016.
Frey, B.S., Savage, D.A., Torgler, B., 2010. Interaction of natural survival instincts and
internalized social norms exploring the Titanic and Lusitania disasters. Proceedings of the
National Academy of Sciences of the United States of America 107, 4862-4865.
Frey, B.S., Savage, D.A., Torgler, B., 2011. Behavior under Extreme Conditions:
TheTitanicDisaster. Journal of Economic Perspectives 25, 209-222.
Golden Gate Resource, 2011. Website.
http://freepages.misc.rootsweb.ancestry.com/~ssgoldengate/. Last accessed 2012-2002-2005.

67
Great Britain. Commissioner of Wrecks, 1912. Formal investigation into the loss of the S.S.
"Titanic": evidence, appendices, and index. H.M.S.O.
Grout, D., 2002. "Empress of Ireland: The Story of an Edwardian Liner". Tempus Pub Ltd,
Stroud U.K.
Hall, W., 1986. Social class and survival on the S.S. Titanic. Social Science & Medicine 22,
687-690.
Hicks, B., 2008. When the Dancing Stopped: The Real Story of the Morro Castle Disaster and
Its Deadly Wake. Simon & Schuster, New York.
Joyce, C.A., 2007. The World Almanac and Book of Facts 2008. World Almanac Books.
Lenta, 2011. Website. http://lenta.ru/news/2011/07/12/bulgaria1/ Last accessed 2012-2001-
2029.
Lusitania Resource, 2012. Website. http://www.rmslusitania.info/. Last accessed 2012-2002-
2019
Manchester Guardian, 1878. The Thames collision: The adjourned inquest, Manchester
Guardian.
Mawson, A.R., 2005. Understanding mass panic and other collective responses to threat and
disaster. Psychiatry 68, 95-113.
Portcities UK, 2011. Website.
http://www.portcities.org.uk/london/server/show/ConNarrative.101/chapterId/2199/The-
Princess-Alice-tragedy.html. Last accessed 2012-2002-2003.
Portnews, 2011. Website. http://en.portnews.ru/news/30057/. Last accessed 2012-2002-2029.
Princess Alice Resource, 2011. Website. http://www.alsbury.co.uk/princessalice/alice0.htm.
Last accessed 2012-2002-2003.
Principessa Mafalda Resource, 2010. Website.
https://sites.google.com/site/mafaldasinking/home. Last accessed 2012-2002-2003.
Rianovosti, 2011a. Website. http://en.beta.rian.ru/infographics/20110714/165190650.html.
Last accessed 2012-2002-2014.
Rianovosti, 2011b. Website. http://en.beta.rian.ru/russia/20110711/165133506.html. Last
accessed 2012-2002-2015.
Rianovosti, 2011c. Website. http://en.beta.rian.ru/russia/20110711/165139086.html Last
accessed 2012-2002-2015.
Rianovosti, 2011d. Website. http://en.beta.rian.ru/russia/20110719/165285223.html Last
accessed 2012-2002-2015.
Sebak, P.K., 2004. Titanic's Predecessor: The S/S Norge Disaster of 1904. Seaward,
Laksevaag Norway.
Shaw, D.W., 2003. The Sea Shall Embrace Them: The Tragic Story of the Steamship Arctic.
Simon & Schuster.
Society for Promoting Christian Knowledge, 1873. The loss of the "Northfleet". Society for
Promoting Christian Knowledge, London.
Sulpicio Lines, 2008. Website. http://dyab-cebu.blogspot.com/2008/06/mv-princess-of-stars-
passngers-manifest_24.html. Last accessed 2012-2002-2020.
68
The Guardian, 2008a. Website.
http://www.guardian.co.uk/world/2008/jun/22/philippines.naturaldisasters?INTCMP=ILCNE
TTXT3487. Last accessed 2012-2002-2009.
The Guardian, 2008b. Website. http://www.guardian.co.uk/world/2008/jun/24/philippines.
Last accessed 2012-2002-2010.
The Joint Accident Investigation Commision of Estonia Finland and Sweden, 1997. Final
report on the capsizing on 28 September 1994 in the Baltic Sea of the RO-RO passenger
vessel MV Estonia, in: Estonia, T.G.o.t.R.o. (Ed.).
The New York Daily Times, 1854. Narratives of the Survivors: Intense Suffering at Sea, The
New York Daily Times, New York.
The New York Times, 1862a. Burning of the Golden Gate, The New York Times.
The New York Times, 1862b. The Golden Gate disaster, The New York Times.
The New York Times, 1862c. The loss of the Golden Gate - Lifesaving precautions not
deficient, The New York Times, New York.
The New York Times, 1862d. Terrible disaster on the Pacific, The New York Times.
The New York Times, 1878. Log of the steamer Bywell Castle, The New York Times.
The New York Times, 1928. List of Rescued and Missing, The New York Times.
WORKING PAPERS*
Editor: Nils Gottfries
2010:27 Olof Åslund, Per-Anders Edin, Peter Fredriksson and Hans Grönqvist, Peers,
neighborhoods and immigrant student achievement - evidence from a
placement policy. 42 pp.
2011:1 Matz Dahlberg, Karin Edmark and Heléne Lundqvist, Ethnic Diversity and
Preferences for Redistribution. 43 pp.
2011:2 Haishan Yu, The EU ETS and Firm Profits: An Ex-post Analysis for
Swedish Energy Firms. 19 pp.
2011:3 Edward Palmer, Generic NDC - Equilibrium, Valuation and Risk Sharing
with and without NDC Bonds. 40 pp.
2011:4 Susanne Ek and Bertil Holmlund, Part-Time Unemployment and Optimal
Unemployment Insurance. 32 pp.
2011:5 Mikael Elinder, Oscar Erixson and Henry Ohlsson, Carnegie visits Nobel:
Do inheritances affect labor and capital income? 34 pp.
2011:6 Jan Södersten and Tobias Lindhe, The Norwegian Shareholder Tax
Reconsidered. 23 pp.
2011:7 Jesper Roine and Daniel Waldenström, On the Role of Capital Gains in
Swedish Income Inequality. 29 pp.
2011:8 Niklas Bengtsson and Per Engström, Control and Efficiency in the Nonprofit
Sector Evidence from a Randomized Policy Experiment. 24 pp.
2011:9 Ranjula Bali Swain and Adel Varghese, Delivery Mechanisms and Impact of
Training through Microfinance. 20 pp.
2011:10 Matz Dahlberg, Eva Mörk and Pilar Sorribas-Navarro, Do Politicians’
Preferences Matter for Voters’ Voting Decisions? 28 pp.
2011:11 Jonas Kolsrud, Consumption Smoothing during Unemployment. 45 pp.
2011:12 Mikael Bask and João Madeira, The Increased Importance of Asset Price
Misalignments for Business Cycle Dynamics. 32 pp.
2011:13 Katarina Nordblom and Jovan Zamac, Endogenous Norm Formation Over
the LifeCycle – The Case of Tax Evasion. 30 pp.
2011:14 Jan Pettersson, Instead of Bowling Alone? Unretirement of Old-Age
Pensioners. 41 pp.
* A list of papers in this series from earlier years will be sent on request by the department.

2011:15 Adrian Adermon and Magnus Gustavsson, Job Polarization and Task-Biased
Technological Change: Sweden, 1975–2005. 33 pp.
2011:16 Mikael Bask, A Case for Interest Rate Inertia in Monetary Policy. 33 pp.
2011:17 Per Engström, Katarina Nordblom, Annika Persson and Henry Ohlsson, Loss
evasion and tax aversion. 43 pp.
2011:18 Mikael Lindahl, Mårten Palme, Sofia Sandgren Massih and Anna Sjögren,
Transmission of Human Capital across Four Generations: Intergenerational
Correlations and a Test of the Becker-Tomes Model. 27 pp.
2011:19 Stefan Eriksson and Karolina Stadin, The Determinants of Hiring in Local
Labor Markets: The Role of Demand and Supply Factors. 33 pp.
2011:20 Krzysztof Karbownik and Michał Myck, Mommies’ Girls Get Dresses,
Daddies’ Boys Get Toys. Gender Preferences in Poland and their
Implications. 49 pp.
2011:21 Hans A Holter, Accounting for Cross-Country Differences in
Intergenerational Earnings Persistence: The Impact of Taxation and Public
Education Expenditure. 56 pp.
2012:1 Stefan Hochguertel and Henry Ohlsson, Who is at the top? Wealth mobility
over the life cycle. 52 pp.
2012:2 Susanne Ek, Unemployment benefits or taxes: How should policy makers
redistribute income over the business cycle? 30 pp.
2012:3 Karin Edmark, Che-Yuan Liang, Eva Mörk and Håkan Selin, Evaluation of
the Swedish earned income tax credit. 39 pp.
2012:4 Simona Bejenariu and Andreea Mitrut, Save Some, Lose Some: Biological
Consequences of an Unexpected Wage Cut. 67 pp.
2012:5 Pedro Carneiro and Rita Ginja, Long Term Impacts of Compensatory
Preschool on Health and Behavior: Evidence from Head Start. 82 pp.
2012:6 Magnus Carlsson and Stefan Eriksson, Do Reported Attitudes towards
Immigrants Predict Ethnic Discrimination? 23 pp.
2012:7 Mikael Bask and Christian R. Proaño, Optimal Monetary Policy under
Learning in a New Keynesian Model with Cost Channel and Inflation Inertia.
25 pp.
2012:8 Mikael Elinder and Oscar Erixson, Every man for himself. Gender, Norms
and Survival in Maritime Disasters. 78 pp.
See also working papers published by the Office of Labour Market Policy Evaluation
http://www.ifau.se/ ISSN 1653-6975