event-related single-shot volumetric functional magnetic
TRANSCRIPT
www.elsevier.com/locate/ynimg
NeuroImage 42 (2008) 230–247Event-related single-shot volumetric functional magnetic resonanceinverse imaging of visual processing
Fa-Hsuan Lin,a,b,⁎ Thomas Witzel,c Joseph B. Mandeville,a Jonathan R. Polimeni,a
Thomas A. Zeffiro,d Douglas N. Greve,a Graham Wiggins,a
Lawrence L. Wald,a and John W. Belliveaua
a MGH-HST Athinoula A. Martinos Center for Biomedical Imaging, Charlestown, MA, USAb Institute of Biomedical Engineering, National Taiwan University, Taipei, Taiwanc Harvard-MIT Divisions of Health Sciences and Technology, Cambridge, MA, USAd Neural Systems Group, Massachusetts General Hospital, Charlestown, MA, USA
Received 12 September 2007; revised 1 April 2008; accepted 6 April 2008Available online 23 April 2008
Developments inmulti-channel radio-frequency (RF) coil array technologyhave enabled functional magnetic resonance imaging (fMRI) with higherdegrees of spatial and temporal resolution. While modest improvement intemporal acceleration has been achieved by increasing the number of RFcoils, the maximum attainable acceleration in parallel MRI acqisition isintrinsically limited only by the amount of independent spatial informationin the combined array channels. Since the geometric configuration of alarge-nMRIhead coil array is similar to thatused inEEGelectrodeorMEGSQUID sensor arrays, the source localization algorithms used in MEG orEEG source imaging can be extended to also process MRI coil array data,resulting in greatly improved temporal resolution by minimizing k-spacetraversal during signal acquisition. Using a novel approach, we acquiremulti-channel MRI head coil array data and then apply inversereconstruction methods to obtain volumetric fMRI estimates of bloodoxygenation level dependent (BOLD) contrast at unprecedented whole-brain acquisition rates of 100 ms. We call this combination of techniquesmagnetic resonance Inverse Imaging (InI), amethod that provides estimatesof dynamic spatially-resolved signal change that can be used to constructstatisticalmaps of task-related brain activity.Wedemonstrate the sensitivityand inter-subject reliability of volumetric InI using an event-related designto probe the hemodynamic signal modulations in primary visual cortex.Robust results from both single subject and group analyses demonstrate thesensitivity and feasibility of using volumetric InI in high temporal resolutioninvestigations of human brain function.© 2008 Elsevier Inc. All rights reserved.
Keywords: Event-related; fMRI; Inverse imaging; InI; Visual; MRI;Neuroimaging
⁎ Corresponding author. MGH-HST Athinoula A. Martinos Center Room2301, Bldg. 149 13th St., CharlestownMA 02129, USA. Fax: +1 617 726 7422.
E-mail address: [email protected] (F.-H. Lin).Available online on ScienceDirect (www.sciencedirect.com).
1053-8119/$ - see front matter © 2008 Elsevier Inc. All rights reserved.doi:10.1016/j.neuroimage.2008.04.179
Introduction
Hemodynamically based fMRI (Belliveau et al., 1991; Belliveauet al., 1990; Kwong et al., 1992; Ogawa et al., 1990) is typicallylimited to a temporal sampling period of 2 to 4 s if whole-braincoverage is desired. Most fMRI data acquisition methods employ anEPI technique that utilizes many phase-encoding steps and multipleread-out gradients. Consequently, this reliance on gradient encodingresults in long image acquisition times and relatively loud acousticnoise related to the requisite rapid gradient switching. Here, wedemonstrate the use of a novel volumetric imaging method, calledInverse Imaging (InI), which uses minimal phase encoding toachieve an order-of-magnitude improvement in BOLD-contrasttemporal resolution. Its minimal dependence on encoding gradientsallows extremely short image acquisition times, with an associatedtrade-off involving somewhat reduced and spatially-varying spatialresolution.
The temporal resolution of MRI is limited by the time required totraverse k-space during signal acquisition. The collection of vol-umetricMRI data continues until the completion of k-space traversalin multiple 2D k-spaces or in a single 3D k-space. Classical gradient-echo or spin-echo image acquisition methods collect data from onek-space line during each excitation. Thus the total acquisition timefor traditional 3D MRI data acquisition is the product of the numberof slices and the number of phase-encoding steps. In contrast togradient-echo or spin-echo imaging, both echo-planar imaging (EPI)(Mansfield, 1977) and spiral imaging (Blum et al., 1987) utilize fastgradient switching to achieve 2D k-space traversal in a single RFexcitation. With current state-of-the-art EPI or spiral imagingtechniques, one 2D single-slice image can be collected inapproximately 80 ms, allowing whole head coverage with 3 mmisotropic resolution in 2 to 4 s. Small improvements in temporalresolution can be achieved by optimizing k-space sampling schemes
231F.-H. Lin et al. / NeuroImage 42 (2008) 230–247
and reconstruction methods: e.g., instead of completing the k-spacetraversal for every measurement, MRI data acquisition can be ac-celerated by coordinated alterations of in k-space trajectories andtheir associated image reconstruction algorithms, as in partial-kspace sampling (McGibney et al., 1993). Alternatively, a prioriinformation-based methods can improve the temporal resolution ofMR dynamic measurements (Tsao et al., 2001).
Recently, parallel imaging methods have been introduced toreconstruct images using spatial information derived simultaneouslyfrom multiple coil array channels. The techniques employed in-clude k-space SMASH (Sodickson and Manning, 1997), k-spaceGRAPPA (Griswold et al., 2002) and image-domain SENSE(Pruessmann et al., 1999), all of which share a similar theore-tical background (Sodickson and McKenzie, 2001). While paral-lel MRI can accelerate data acquisition rates by reducing totalk-space traversal at the cost of reduced signal-to-noise ratio(SNR), the resulting net acceleration rate is limited both by thenumber of array coils and the specific phase-encoding schemeemployed.
Prior information can be incorporated by combining EPI withparallelMR imaging (Golay et al., 2000; Preibisch et al., 2003; Schmidtet al., 2005; Weiger et al., 2002), resulting in fMRI detection sensitivityimprovements with sensitivity encoded parallel MRI techniques (Linet al., 2005). Prior-informed parallel MRI has been explored using afixed regularization parameterwith empirical singular value decomposi-tion truncation (King, 2001; Sodickson, 2000). Incorporation of priorinformation can suppress noise amplification in parallel MRIreconstruction (Lin et al., 2002, 2005, 2004; Tsao et al., 2002) andtraditional parallel MRI has been used to solve under-determined ill-posed problems (Katscher and Manke, 2002; Tsao et al., 2003).However, either only minor acceleration has been achieved (4-foldacceleration using a 2-channel array in cardiac imaging) (Katscher andManke, 2002), or the reconstruction process has depended onincorporation of low-resolution prior image information (Tsao et al.,2003, 2005).
More extreme accelerations in MRI acquisition rates have beenachieved by reconstructing each image from a single echo. Forexample, single-echo-acquisition (SEA) was achieved using adedicated 64-channel linear planar array that eliminated phaseencoding, instead using the spatial information obtained from anarray of long and parallel coils. This planar pair element designproved to be crucial for achieving well-localized field sensitivitypatterns (McDougall and Wright, 2005). In other work, Hennigdeveloped the one-voxel-one-coil (OVOC) MR-encephalographytechnique, obtaining a reconstructed image by computing theproduct of a full FOV reference scan and the acceleratedacquisition scan where traditional phase and frequency encodingcan be selectively omitted. This approach uses simultaneous multi-channel acquisition with multiple small receiver coils sampled suchthat the signal received by each coil is read out separately. Theeffective voxel size observed by each receiver channel isdetermined by the sensitive volume of the corresponding coilelement and the source spatial distribution is estimated byconstrained reconstruction using images from each separate coilas references (Hennig et al., 2007). A similar reconstruction al-gorithm termed HYPR was also proposed in the context of MRangiography (Mistretta et al., 2006). Nevertheless, none of theseapproaches explicitly formulate the relationship between the spatialinformation contained in the different channels of a RF coil arraywith full gradient encoding or with minimal gradient encoding. Nordo they provide algorithms to estimate the significance of task-
related signal changes that would allow dynamic statisticalinferences to be made from a highly temporally resolved data set.
Mathematically, the maximum acceleration possible with parallelMRI acquisition is limited by the available independent spatialinformation encoded by the coil array elements. This limit manifestsitself as a problem in solving an over-determined linear system.Increasing the number of channels can thus increase MRI samplingrates. To this end, dense head coil arrays consisting of 16 (Bodurkaet al., 2004; de Zwart et al., 2002, 2004), 23, 32 and 90 elements(Wiggins et al., 2005a,b) have been constructed in support of a rangeof parallel acquisition applications. In addition, a dedicated 64-channel linear planar array has been developed to achieve 64-foldacceleration (McDougall and Wright, 2005). Notably, the geometricconfiguration of our 32-channel head array is remarkably similar tothat used for electrode and super-conducting quantum interference(SQUID) sensor arrays in modern EEG and MEG systems(Hamalainen et al., 1993). While the MEG sensors detect magneticfields generated by neural currents (Hamalainen et al., 1993), MRIdetects oscillating electromagnetic fields from magnetization preces-sion (Haacke, 1999). In addition, while MEG derives all of its spatialinformation from the geometry of the detectors, current acceleratedMRI methods still rely heavily on gradient encoding.
We have generalized parallel MRI reconstruction techniques toexceed the limitations encountered when utilizing an under-determined linear system by introducing single-shot volumetricMR Inverse Imaging (InI), an approach that employs an over-determined linear system in order to achieve dramatically reducedacquisition times. We demonstrate the use of single-shotvolumetric InI in supporting dynamic spatially-resolved statisticalinference in a functional neuroimaging experiment. Inspired byMEG and EEG source localization techniques, we use a general-ization of prior-informed parallel MRI (Lin et al., 2005, 2004) andan adaptation of MEG reconstruction methods to MRI, to reducethe whole-brain sampling time by minimizing the k-space traversaltime. Rather than relying on gradient encoding, InI derives spatialinformation by solving the inverse problem utilizing informationfrom all array channels. Thus, given the constraint imposed by theneed to use echo times (TE) that are optimal for BOLD-contrast,InI can complete k-space traversal and acquire sufficient data forwhole-brain image reconstruction in under 100 ms. Although wehave previously shown the feasibility of a 2D InI implementation(Lin et al., 2006a), we now demonstrate its application tofunctional imaging studies employing 3D whole-brain coverageand event-related designs (Rosen et al., 1998). Event-related fMRIis a widely utilized neuroimaging method to study not only spatialbut also temporal characteristics of hemodynamic changessecondary to neuronal events. Compared to the classical block-design fMRI, the timing information available in the event-relatedfMRI allows for the study of both transient and steady states ofcerebrovascular responses. This experimental technique mitigatesthe difficulty of potential bias originating from the context orhistory of previous stimuli events. Event-related fMRI also enablesthe analysis of data using post-hoc categorization (Wagner et al.,1998). Some experimental designs, such as “odd-ball” experi-ments, can only be implemented using event-related fMRI ratherthan block-design (Friston, 2007). All reasons described aboveencouraged us to study the feasibility of 3D InI acquisition andreconstruction using event-related fMRI designs.
The principal novelty of our method is its combination of adense coil array with a linear estimation approach, allowing thetransition from a largely gradient encoded to a largely detector
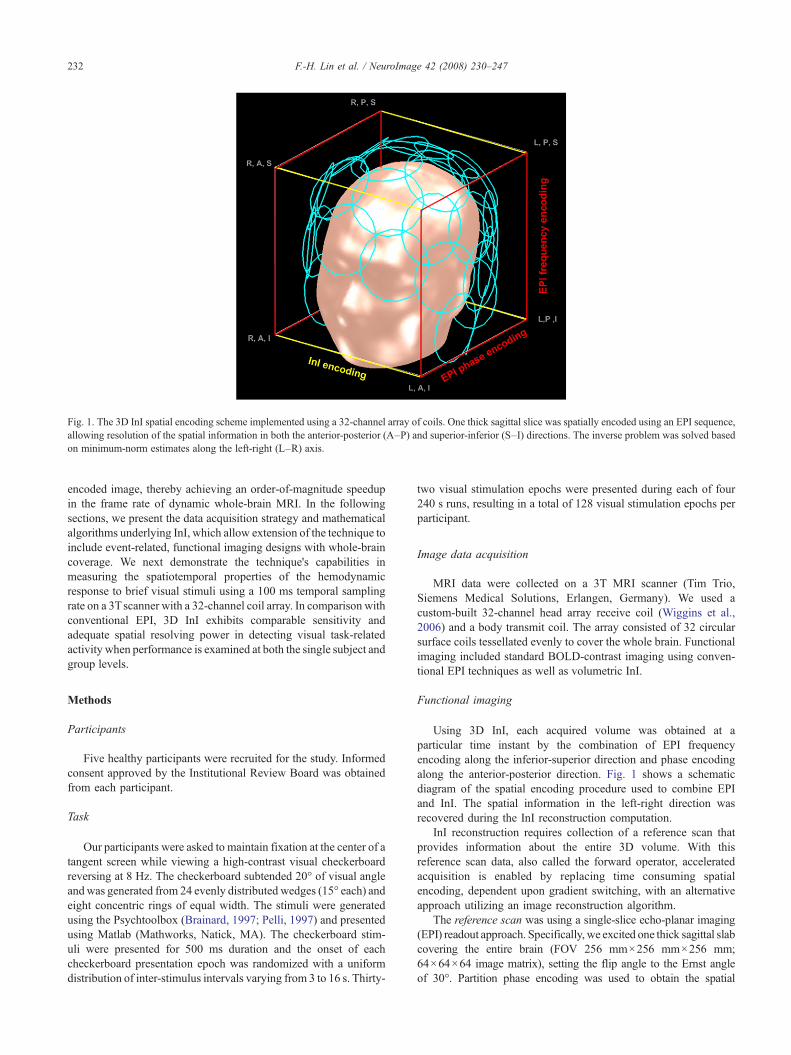
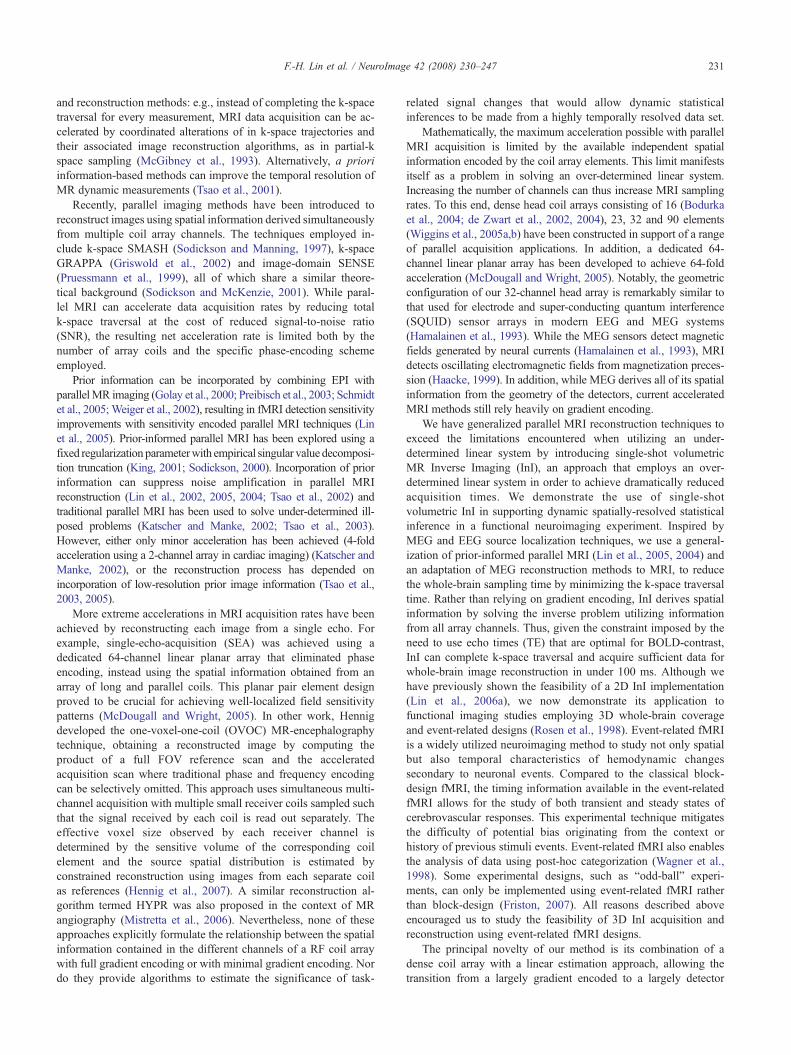
Fig. 1. The 3D InI spatial encoding scheme implemented using a 32-channel array of coils. One thick sagittal slice was spatially encoded using an EPI sequence,allowing resolution of the spatial information in both the anterior-posterior (A–P) and superior-inferior (S–I) directions. The inverse problem was solved basedon minimum-norm estimates along the left-right (L–R) axis.
232 F.-H. Lin et al. / NeuroImage 42 (2008) 230–247
encoded image, thereby achieving an order-of-magnitude speedupin the frame rate of dynamic whole-brain MRI. In the followingsections, we present the data acquisition strategy and mathematicalalgorithms underlying InI, which allow extension of the technique toinclude event-related, functional imaging designs with whole-braincoverage. We next demonstrate the technique's capabilities inmeasuring the spatiotemporal properties of the hemodynamicresponse to brief visual stimuli using a 100 ms temporal samplingrate on a 3Tscanner with a 32-channel coil array. In comparison withconventional EPI, 3D InI exhibits comparable sensitivity andadequate spatial resolving power in detecting visual task-relatedactivity when performance is examined at both the single subject andgroup levels.
Methods
Participants
Five healthy participants were recruited for the study. Informedconsent approved by the Institutional Review Board was obtainedfrom each participant.
Task
Our participants were asked to maintain fixation at the center of atangent screen while viewing a high-contrast visual checkerboardreversing at 8 Hz. The checkerboard subtended 20° of visual angleandwas generated from 24 evenly distributed wedges (15° each) andeight concentric rings of equal width. The stimuli were generatedusing the Psychtoolbox (Brainard, 1997; Pelli, 1997) and presentedusing Matlab (Mathworks, Natick, MA). The checkerboard stim-uli were presented for 500 ms duration and the onset of eachcheckerboard presentation epoch was randomized with a uniformdistribution of inter-stimulus intervals varying from 3 to 16 s. Thirty-
two visual stimulation epochs were presented during each of four240 s runs, resulting in a total of 128 visual stimulation epochs perparticipant.
Image data acquisition
MRI data were collected on a 3T MRI scanner (Tim Trio,Siemens Medical Solutions, Erlangen, Germany). We used acustom-built 32-channel head array receive coil (Wiggins et al.,2006) and a body transmit coil. The array consisted of 32 circularsurface coils tessellated evenly to cover the whole brain. Functionalimaging included standard BOLD-contrast imaging using conven-tional EPI techniques as well as volumetric InI.
Functional imaging
Using 3D InI, each acquired volume was obtained at aparticular time instant by the combination of EPI frequencyencoding along the inferior-superior direction and phase encodingalong the anterior-posterior direction. Fig. 1 shows a schematicdiagram of the spatial encoding procedure used to combine EPIand InI. The spatial information in the left-right direction wasrecovered during the InI reconstruction computation.
InI reconstruction requires collection of a reference scan thatprovides information about the entire 3D volume. With thisreference scan data, also called the forward operator, acceleratedacquisition is enabled by replacing time consuming spatialencoding, dependent upon gradient switching, with an alternativeapproach utilizing an image reconstruction algorithm.
The reference scan was using a single-slice echo-planar imaging(EPI) readout approach. Specifically, we excited one thick sagittal slabcovering the entire brain (FOV 256 mm×256 mm×256 mm;64×64×64 image matrix), setting the flip angle to the Ernst angleof 30°. Partition phase encoding was used to obtain the spatial
233F.-H. Lin et al. / NeuroImage 42 (2008) 230–247
information along the left-right axis (inter-aural line). The EPI readouthad frequency and phase encoding along the superior-inferior andanterior-posterior axes respectively. We used 100 ms TR, 30 ms TE,2604 Hz bandwidth and a 10 s total acquisition time for the referencescan.
InI functional data acquisition used the same volumeprescription, TR, TE, flip angle, and bandwidth as the referencescan. The principal difference was that the partition phase encodingwas removed. The full volume was excited, and the spins werespatially encoded by a single-slice EPI acquisition. This resulted ina projection image along the left-right direction. The InIreconstruction algorithm, described in the next section, was thenused to estimate the spatial information along the x–y axis. In eachrun, we collected 2,400 measurements after collecting 32measurements in order to reach the longitudinal magnetizationsteady state. A total of four runs of data were acquired from eachparticipant.
To validate the InI functional results, conventional EPI data, usingconventional BOLD-contrast detection methods, were also collectedusing identical stimulus and presentation paradigm timing. EPIfunctional data acquisition used TE=30ms, TR=2 s, flip angle=90°,FOV=220 mm, 24 slices, slice thickness=4 mm with 20% gap).
Structural imaging
In addition to the EPI and InI functional data, anatomical MRIdata for each participant were obtained in the same session using ahigh-resolution T1-weighted 3D sequence (MPRAGE, TR/TE/flip=2530 ms/3.49 ms/7°, partition thickness=1.33 mm, ma-trix=256×256, 128 partitions, FOV=21 cm×21 cm). Using thesedata, the location of the gray–white matter boundary was estimatedwith an automatic segmentation algorithm to yield a triangulatedmesh model with approximate 340,000 vertices (Dale et al., 1999;Fischl et al., 2001, 1999). The spatial registration between the EPIdata or InI reconstructed data and the anatomical data was done byusing SPM5 (http://www.fil.ion.ucl.ac.uk/spm/), estimating a 12-parameter rigid body transformation between the EPI mean imageand volumetric InI reference scan and MPRAGE anatomical study.Note that the accelerated InI acquisition data were not spatiallyregistered using this tool. The registration matrix was subsequentlyapplied to each time instant of the EPI or InI hemodynamicestimates, to transform the neural activity estimates for eachfunctional run to an inflated cortical surface space (Dale et al.,1999; Fischl et al., 1999). The transformed results were alsospatially smoothed with a 3D Gaussian kernel with 10 mm full-width-half-maximum (FWHM).
Image reconstruction
Both reference scans and InI scans use EPI read-out, whichdemonstrate classical Nyquist ghost artifacts in the phase-encodingdirection (anterior–posterior direction in our implementation). Tocorrect this artifact and to make consistent measurements betweenreference and InI scans, we applied the same phase correctionalgorithm in each reference (with partition encoding) and InI(without partition encoding) image at all channels of the coil array.Specifically, 64 interleave EPI read-outs were acquired in thefrequency encoding direction (superior–inferior direction) withoutphase-encoding blips to estimate the k-space shift between evenand odd echoes along the frequency encoding direction. This echo-shifting was then corrected by appending a compensation phase to
the even echoes to avoid N/2 Nyquist ghosting. The InI acquisitionand reference scans were processed using 2D and 3D fast Fouriertransformations from the k-space domain to the image domain,respectively. The reference scan in each channel of the coil arraywas synthetically averaged across partitions to simulate the InIacquisitions by making projection images along the partitionencoding direction in each channel of the coil array, such that
dSIMitr� �
, the simulated InI acquisition at locationtq and channel i,
is calculated as
dSIMitr� � ¼X
tq
Aitq� � ð1Þ
Here tq represents the spatial location indices across differentpartition phase-encoding steps with the same frequency and phase-encoding numbers, indicated by the spatial index tr , and Ai
tq� �
represents the reference scan image from location tq and channel i.These simulated data were compared with the InI acquisition ateach time instant to separately investigate the phase differencebetween the simulated InI projection image from the reference scanand the acquired InI projection image at each time instant. Theglobal phase difference, θi(t), for channel i at time instant t, is givenby
hi tð Þ ¼ BXtr
di tr ;t� �
=dSIMitr� �� � !
ð2Þ
where di tr ; t� �
represents the signal from the InI acquisition withspatial location tr , time t and channel i of the coil array. Phaseinformation is important in the subsequent InI reconstruction sincephase may change dramatically over continuous scans as a result ofscanner instabilities such as gradient coil heating. We corrected thisdiscrepancy in phase between the actual accelerated InI acquisitionand the simulated InI acquisition from the reference scan by sub-tracting θi(t) for different channel and time instant separately.
After pre-processing the whole time series in the InI projectionacquisitions, now we estimated the hemodynamic response function(HRF) in each projection image across all channels of the coil array.This effort reduces the size of data in the time-domain dramaticallywithout affecting the subsequent image-domain reconstruction.From a list of the stimulus onset times, we constructed a vector tqwith entries containing a one indicating the occurrence of stimuliduring each 500 ms stimulation period, and all other entriescontaining zeros. A contrast matrix D was constructed from theconvolution between the tq vector and the hemodynamic responsefunction H,
D ¼ tq � H ð3Þ
where � denotes the linear convolution.We used a finite-impulse response (FIR) basis for the HRF and
thus H is a discrete delta function with different delays indicating theHRF at a specific time instant. Specifically,Hmodeled a HRF of 30 sduration with a 6 s pre-stimulus baseline of 100 ms TR. Thus H is anidentity matrix of dimension 300 (i.e., nh=300). In addition to thephase drift θi(t), we appended the design matrixDwith two confoundvectors within each run to account for linear drift and constantconfounds. Additionally, we also included a time series from themeanof the magnitude projection image in each channel as a confoundvector attempting to explain potential physiological noise sources(respiration and cardic pulse). The estimation of GLM coefficients for
234 F.-H. Lin et al. / NeuroImage 42 (2008) 230–247
channel i and time instant τ of the InI acquisition was computed byleast square fitting
bitr ;s� � ¼ DHD
� ��1DHdi tr ;t
� �;s ¼ 1: : :nh; ð4Þ
where the superscript H indicates the transpose and complexconjugate. HRF estimation, hi tr ;s
� �, was then extracted from entries
of the bitr ;s� �
vector corresponding to the FIR basis function whileall other contributions corresponding to confounding vectors werediscarded in the subsequent analysis.
The minimum-norm estimate (MNE) provided the recon-structed image x tq; s
� �of 3D volumetric index tq and time index
τ, which can be expressed as
x tq; s� � ¼ A tr
� �HA tr� �
A tr� �Hþk tr
� �C
� ��1h tr ; s� �
¼ WMNEtr� �
h tr ; s� � ð5Þ
where C is the noise covariance matrix of the array, k tr� �
is theregularization parameter, andWMNE
tr� �
is the inverse operator for theInI location index tr . A tr
� �and h tr ;s
� �indicate the vertically
concatenated Aitq� �
and hi tr ; s� �
at spatial indextr and time index τacross all channels in the coil array. The regularization parameter wascalculated from a pre-defined signal-to-noise ratio (SNR) as
k tr� � ¼ Tr Cð Þ=Tr A tr
� �HA tr� �H� �
=SNR2 ð6Þ
Here Tr(•) indicates the trace of the matrix. This choice ofregularization parameter followed our original 2D InI reconstructionalgorithm and was inspired by the analogy between InI reconstruc-tion (Lin et al., 2006a) and distributed source modeling in MEG(Lin et al., 2006b). We used SNR=5 in this study. This choiceof SNR was derived from our previous InI study (Lin et al.,2006a). The sensitivity of MNE reconstruction in InI wasinvestigated in our previous study, which showed that theregularization parameter affects InI reconstructions moderately for±10 fold changes. Our choice of regularization parameter was withinthat range.
Statistical modeling
InI dataTo allow statistical inference from the results of the InI time-
series reconstruction, we estimated the noise in the baseline by
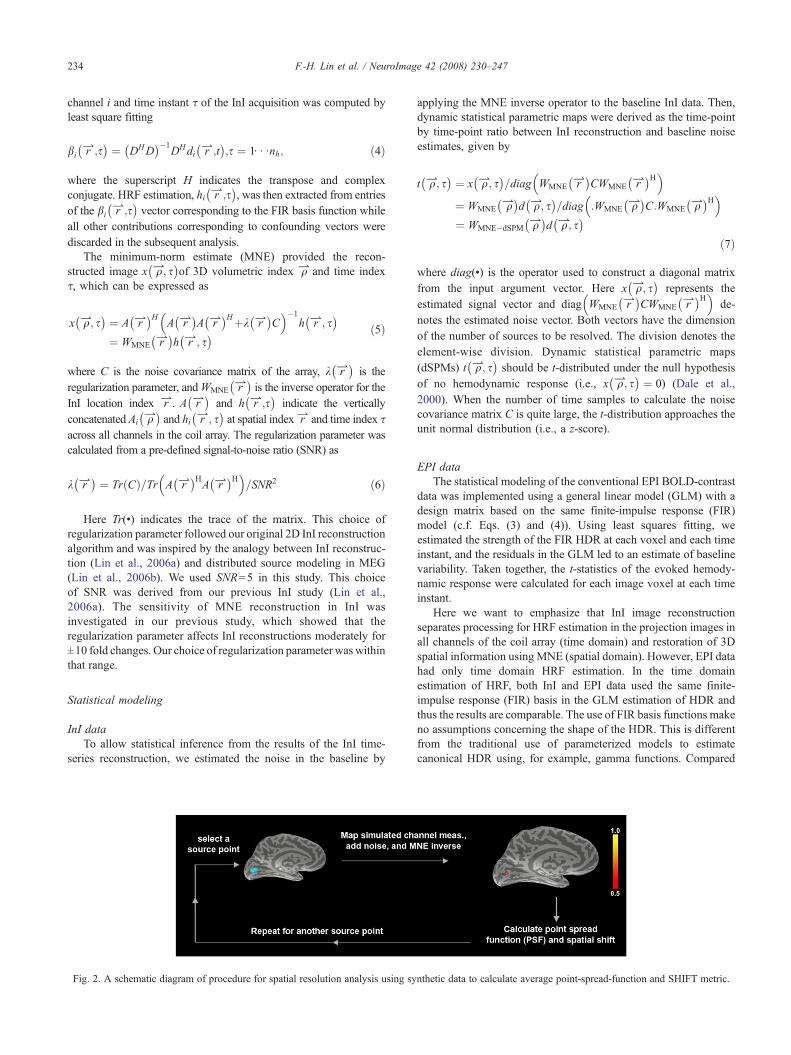
Fig. 2. A schematic diagram of procedure for spatial resolution analysis using sy
applying the MNE inverse operator to the baseline InI data. Then,dynamic statistical parametric maps were derived as the time-pointby time-point ratio between InI reconstruction and baseline noiseestimates, given by
t tq; s� � ¼ x tq; s
� �=diag WMNE
tr� �
CWMNEtr� �H� �
¼ WMNEtq� �
d tq; s� �
=diag :WMNEtq� �
C:WMNEtq� �H� �
¼ WMNE�dSPMtq� �
d tq; s� �
ð7Þ
where diag(•) is the operator used to construct a diagonal matrixfrom the input argument vector. Here x tq; s
� �represents the
estimated signal vector and diag WMNEtr� �
CWMNEtr� �H� �
de-notes the estimated noise vector. Both vectors have the dimensionof the number of sources to be resolved. The division denotes theelement-wise division. Dynamic statistical parametric maps(dSPMs) t tq; s
� �should be t-distributed under the null hypothesis
of no hemodynamic response (i.e., x tq; s� � ¼ 0) (Dale et al.,
2000). When the number of time samples to calculate the noisecovariance matrix C is quite large, the t-distribution approaches theunit normal distribution (i.e., a z-score).
EPI dataThe statistical modeling of the conventional EPI BOLD-contrast
data was implemented using a general linear model (GLM) with adesign matrix based on the same finite-impulse response (FIR)model (c.f. Eqs. (3) and (4)). Using least squares fitting, weestimated the strength of the FIR HDR at each voxel and each timeinstant, and the residuals in the GLM led to an estimate of baselinevariability. Taken together, the t-statistics of the evoked hemody-namic response were calculated for each image voxel at each timeinstant.
Here we want to emphasize that InI image reconstructionseparates processing for HRF estimation in the projection images inall channels of the coil array (time domain) and restoration of 3Dspatial information using MNE (spatial domain). However, EPI datahad only time domain HRF estimation. In the time domainestimation of HRF, both InI and EPI data used the same finite-impulse response (FIR) basis in the GLM estimation of HDR andthus the results are comparable. The use of FIR basis functions makeno assumptions concerning the shape of the HDR. This is differentfrom the traditional use of parameterized models to estimatecanonical HDR using, for example, gamma functions. Compared
nthetic data to calculate average point-spread-function and SHIFT metric.
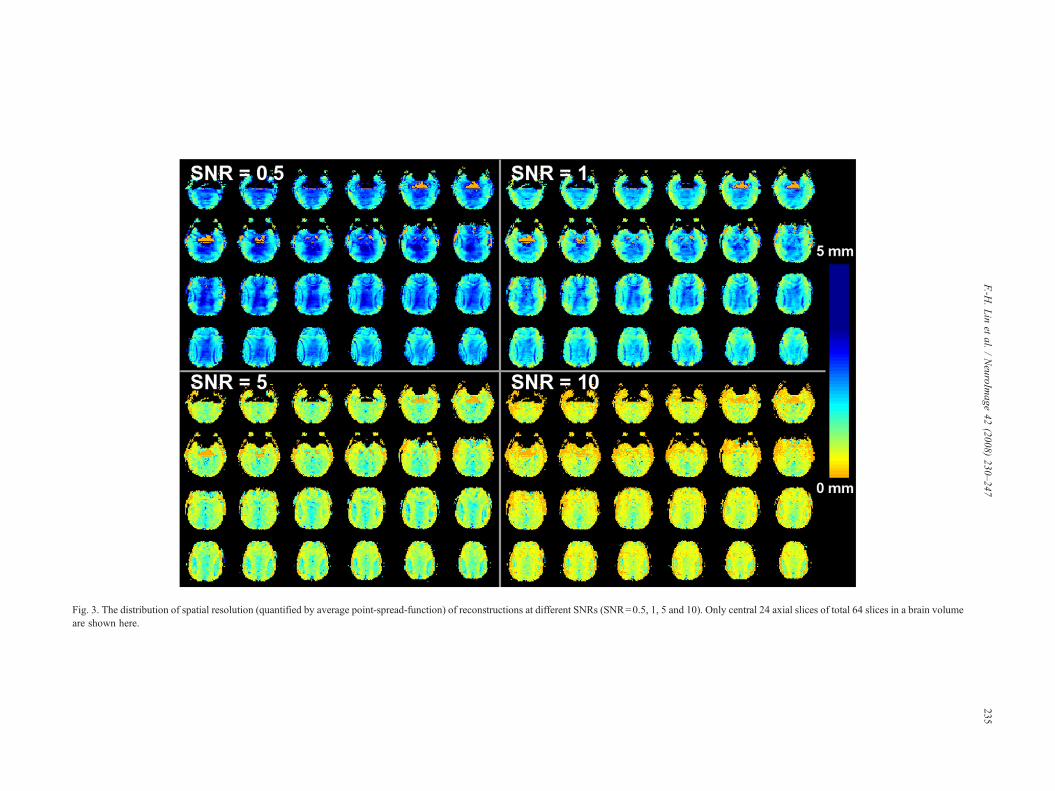
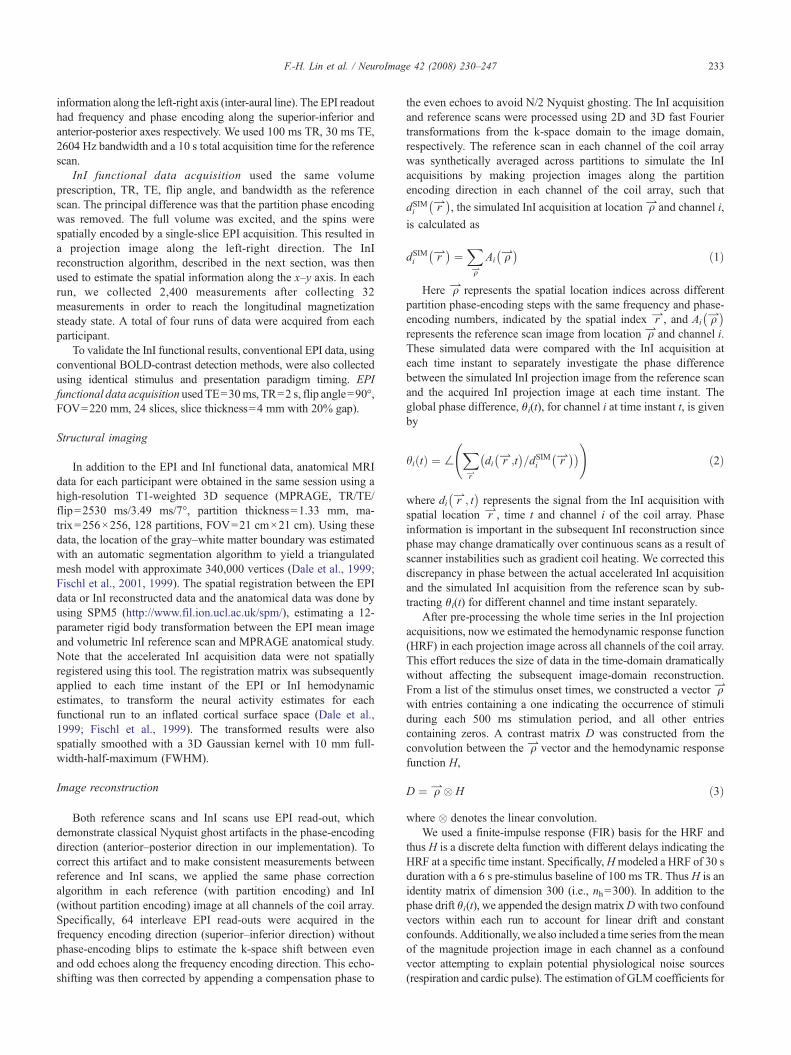
Fig. 3. The distribution of spatial resolution (quantified by average point-spread-function) of reconstructions at different SNRs (SNR=0.5, 1, 5 and 10). Only central 24 axial slices of total 64 slices in a brain volumeare shown here.
235F.-H
.Lin
etal.
/NeuroIm
age42
(2008)230–247

Table 1The average (avg.) and standard deviation (std.) of average point-spread-function (aPSF) and SHIFT metrics for MNE-dSPM at different SNRs
aPSF SHIFT
SNR avg. (mm) std. (mm) avg. (mm) std. (mm)
0.1 26.87 9.94 25.69 15.460.5 11.00 3.76 6.56 4.351 8.64 3.42 4.54 3.375 4.66 2.54 2.24 1.8910 2.98 2.18 1.52 1.4950 0.15 0.58 0.09 0.36100 0.01 0.13 0.01 0.09
236 F.-H. Lin et al. / NeuroImage 42 (2008) 230–247
to traditional EPI reconstruction, the only additional processing inInI reconstruction is theMNE in the spatial domain to convert the 2Dprojected images into 3D volumetric images.
To compare the similarity of InI and EPI reconstructions, InIdSPMs of t-statistic maps were averaged between 3–7 s afterstimulus onset. The center of mass of this temporally averagedt-statistic map from the InI TInI tq
� �and EPI t-statistics maps
TEPI tq� �
were calculated separately:
tqInI ¼Ptq
TInI tq� �tq=X
tq
TInI tq� �
tqEPI¼Xtq
TEPI tq� �tq=X
tq
TEPI tq� �
g ¼ jj tqInI �tqEPI jj
ð8Þ
Here ||•|| denotes the Euclidean norm.
Spatial resolution analysis
We performed numerical simulations to evaluate the spatialresolution and localization accuracy of our InI reconstructions. Thereference data for the forward operator is represented by A tq
� �and
noise covariance matrix is represented by C. The simulationprocedure started from creating a source vector x tr
� �, with tr set
to unit activity and other locations set to zero. We then estimatedthe idealized measurements from all coil array channels bycomputing the product of the forward operator A tq
� �and x tr
� �.
s tr� � ¼ A tq
� �x tq� � ð9Þ
We created 100 realizations of synthetic noise with spatialcoloring according to the noise covariance matrix:
n tr� � ¼ UCS
1=2C e tr� � ð10Þ
where e tr� �
is the noise vector with complex values following aGaussian distribution of zero mean and unit variance. UC and SCare the singular vectors and singular values of the noise covariancematrix. At a specified SNR, the noise n tr
� �was scaled and
subsequently added to s tr� �
to generate the synthetic measure-ments d tr
� �:
d tr� � ¼ s tr
� �þ 1SNR
ffiffiffiffiffiffiffiffiffiffiffiffiffiffiffiffiffiffiffiffiffiffiffiffiffiffiffiffiffiffimax js tr
� �j2� �Tr SCð Þ
vuutn tr� � ð11Þ
Then we followed Eq. (5) to obtain the data covariance matrix,the inverse operator, and the noise normalized inverse operator:
tx̂MNEtq� � ¼ WMNE
tq� �
d tr� �
tx̂ MNE�dSPMtq� � ¼ WMNE�dSPM
tq� �
d tr� � ð12Þ
The InI reconstruction obtained with this procedure isequivalent to the point spread function of the simulated sourcex tq� �
. Both txMNEtq� �
and tx̂ MNE�dSPMtq� �
were scaled to amaximum of 1.
Similar to procedures used in MEG/EEG source analysis (Daleet al., 2000; Liu et al., 1998, 2002), we estimated the average point-
spread-function (aPSF) at each location to quantify the spatial spread ofthe reconstruction:
aPSFMNEtq� � ¼
Pi;ipq jdi tq
� �xiMNEj
l
aPSFMNE�dSPMtq� � ¼
Pi;ipq jdi tq
� �xiMNE�dSPMj
l
ð13Þ
where jdi tq� �j indicates the distance between source location i and
source location tq . xMNEi (or xMNE-−dSPM
i ) represents vector entries inthe InI reconstruction⇀x̂MNE
tq� �
(or tx̂ MNE�dSPMtq� �
) exceeding 0.5and l is the number of voxels to be spatially resolved by the InIreconstructions. This procedure allows estimation of the full-width-half-maximum (FWHM) of the point-spread-function. A 3D map of thespatial distribution of the average point-spread-function, aPSF, for eitherMNE or MNE-dSPM estimates can be obtained by repeating thecalculation across the whole source space, sampling the 256×256×256 mm FOVat a 4 mm isotropic spatial resolution.
Since InI is an intrinsically ill-posed inverse problem, thereconstructed image may not reflect the original spatial distribu-tion of the magnetizations contributing to the actual measure-ments. Thus analysis of localization accuracy concerning thediscrepancy between the reconstructed sources and the originalsources is desirable. Quantification of localization accuracy wasdone by calculating the shift between the center of mass of the InIreconstruction and the simulated source:
SHIFTMNEtq� � ¼ j Pi;i pq
tx̂MNEtq� �
xiMNE
� ��tq j
SHIFTMNE�dSPMtq� � ¼ j Pi;i pq
tx̂MNE�dSPMtq� �
xiMNE�dSPM
� ��tq jð14Þ
A 3D SHIFT metric map for MNE and MNE-dSPM wasgenerated in each simulation. Since the inverse operators dependon the SNR (and the measurement data), the SNRs wereparametrically varied from 0.1 to 100. Fig. 2 illustrates theprocedure of spatial resolution analysis using simulations. Theimplementation of the image reconstruction and statistical analysisprocedures were done with Matlab.
Results
Spatial resolution analysis of simulated datasets
Spatial resolutionFig. 3 shows the spatial distribution of aPSF at different SNRs
(SNR=0.5, 1, 5, and 10). We observed global reductions in the

Fig. 4. The distribution of localization accuracy (quantified by the SHIFT metric) of reconstructions at different SNRs (SNR=0.5, 1, 5 and 10). Only central 24 axial slices of total 64 slices in a brain volume areshown here.
237F.-H
.Lin
etal.
/NeuroIm
age42
(2008)230–247
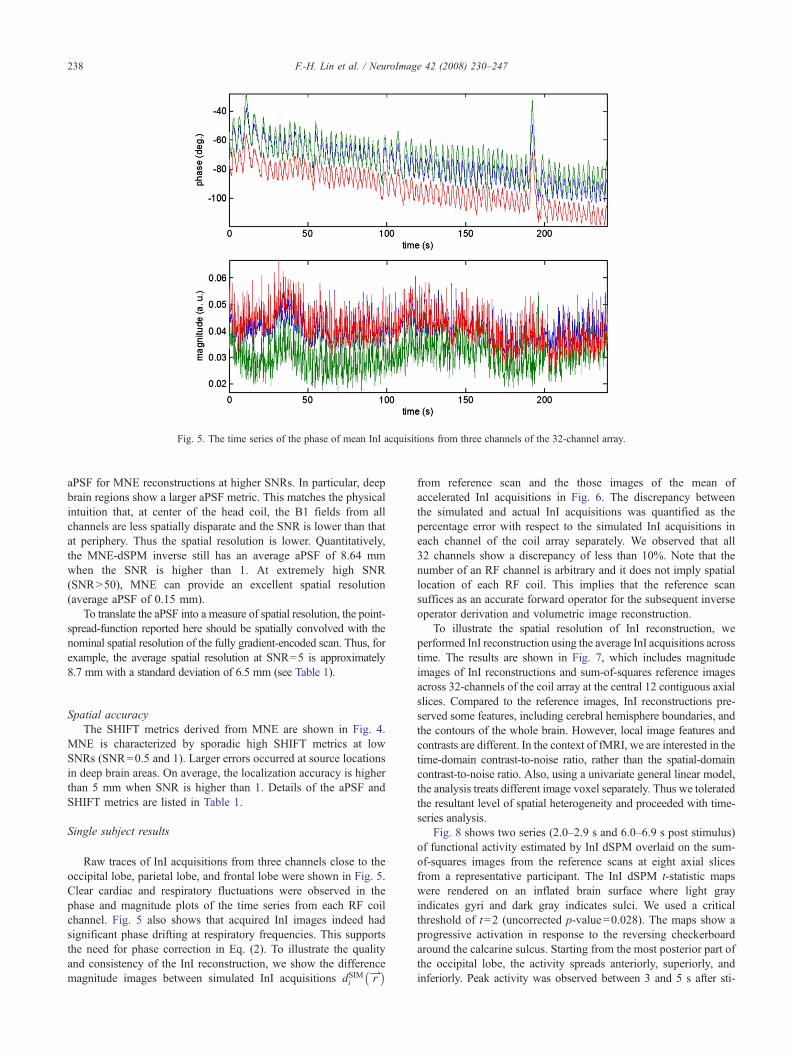
Fig. 5. The time series of the phase of mean InI acquisitions from three channels of the 32-channel array.
238 F.-H. Lin et al. / NeuroImage 42 (2008) 230–247
aPSF for MNE reconstructions at higher SNRs. In particular, deepbrain regions show a larger aPSF metric. This matches the physicalintuition that, at center of the head coil, the B1 fields from allchannels are less spatially disparate and the SNR is lower than thatat periphery. Thus the spatial resolution is lower. Quantitatively,the MNE-dSPM inverse still has an average aPSF of 8.64 mmwhen the SNR is higher than 1. At extremely high SNR(SNRN50), MNE can provide an excellent spatial resolution(average aPSF of 0.15 mm).
To translate the aPSF into a measure of spatial resolution, the point-spread-function reported here should be spatially convolved with thenominal spatial resolution of the fully gradient-encoded scan. Thus, forexample, the average spatial resolution at SNR=5 is approximately8.7 mm with a standard deviation of 6.5 mm (see Table 1).
Spatial accuracyThe SHIFT metrics derived from MNE are shown in Fig. 4.
MNE is characterized by sporadic high SHIFT metrics at lowSNRs (SNR=0.5 and 1). Larger errors occurred at source locationsin deep brain areas. On average, the localization accuracy is higherthan 5 mm when SNR is higher than 1. Details of the aPSF andSHIFT metrics are listed in Table 1.
Single subject results
Raw traces of InI acquisitions from three channels close to theoccipital lobe, parietal lobe, and frontal lobe were shown in Fig. 5.Clear cardiac and respiratory fluctuations were observed in thephase and magnitude plots of the time series from each RF coilchannel. Fig. 5 also shows that acquired InI images indeed hadsignificant phase drifting at respiratory frequencies. This supportsthe need for phase correction in Eq. (2). To illustrate the qualityand consistency of the InI reconstruction, we show the differencemagnitude images between simulated InI acquisitions dSIMi
tr� �
from reference scan and the those images of the mean ofaccelerated InI acquisitions in Fig. 6. The discrepancy betweenthe simulated and actual InI acquisitions was quantified as thepercentage error with respect to the simulated InI acquisitions ineach channel of the coil array separately. We observed that all32 channels show a discrepancy of less than 10%. Note that thenumber of an RF channel is arbitrary and it does not imply spatiallocation of each RF coil. This implies that the reference scansuffices as an accurate forward operator for the subsequent inverseoperator derivation and volumetric image reconstruction.
To illustrate the spatial resolution of InI reconstruction, weperformed InI reconstruction using the average InI acquisitions acrosstime. The results are shown in Fig. 7, which includes magnitudeimages of InI reconstructions and sum-of-squares reference imagesacross 32-channels of the coil array at the central 12 contiguous axialslices. Compared to the reference images, InI reconstructions pre-served some features, including cerebral hemisphere boundaries, andthe contours of the whole brain. However, local image features andcontrasts are different. In the context of fMRI, we are interested in thetime-domain contrast-to-noise ratio, rather than the spatial-domaincontrast-to-noise ratio. Also, using a univariate general linear model,the analysis treats different image voxel separately. Thus we toleratedthe resultant level of spatial heterogeneity and proceeded with time-series analysis.
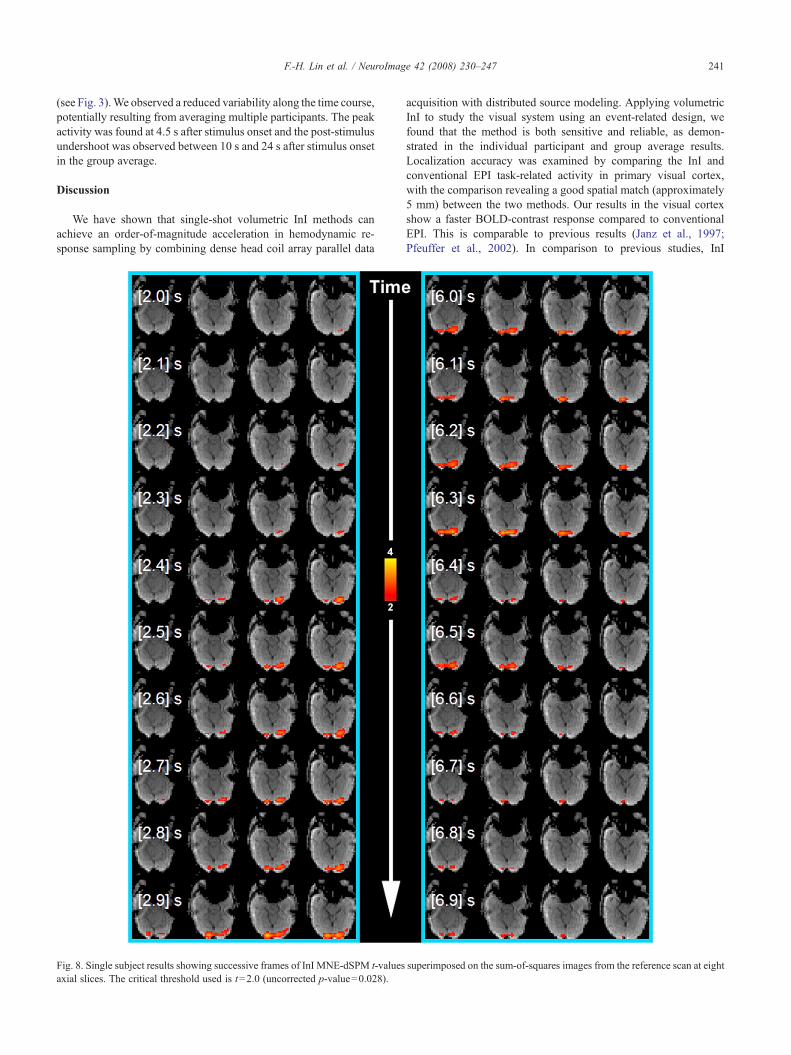
Fig. 8 shows two series (2.0–2.9 s and 6.0–6.9 s post stimulus)of functional activity estimated by InI dSPM overlaid on the sum-of-squares images from the reference scans at eight axial slicesfrom a representative participant. The InI dSPM t-statistic mapswere rendered on an inflated brain surface where light grayindicates gyri and dark gray indicates sulci. We used a criticalthreshold of t=2 (uncorrected p-value=0.028). The maps show aprogressive activation in response to the reversing checkerboardaround the calcarine sulcus. Starting from the most posterior part ofthe occipital lobe, the activity spreads anteriorly, superiorly, andinferiorly. Peak activity was observed between 3 and 5 s after sti-

Fig. 6. Difference magnitude images between the simulated and actually accelerated InI acquisitions from fully gradient-encoded reference scan at 32 channels. The difference between two was quantified by thepercentage error labeled in the individual simulated image.
239F.-H
.Lin
etal.
/NeuroIm
age42
(2008)230–247

Fig. 7. (Top) InI reconstructed images from actually accelerated scan using MNE inverse operator. (Bottom) InI reconstructed images from fully gradient-encoded reference scan using sum-of-squares algorithm.
240 F.-H. Lin et al. / NeuroImage 42 (2008) 230–247
mulus onset. This response started to decrease approximately 6 s afterstimulus onset.
The area showing a positive visual response in the first 3 s afterstimulus onset was used to define a region of interest (ROI) in theprimary visual cortex (V1). The average values and standard deviationsof this ROI time course are shown in Fig. 9. Without utilizing anyspecific model of the hemodynamic response, InI measures revealed asharp BOLD-contrast signal peak at 4 s after stimulus onset. We alsoobserved a post-stimulus undershoot between 10 and 24 s after stimulusonset. The pre-stimulus interval shows fluctuations around the baseline.
To compare InI with conventional EPI reconstruction, wecompared data from the same participants studied with both tech-niques. Fig. 10 shows the t-statistic maps from both InI and EPIacquisitions using an inflated cortical surface model. We averaged theInI dSPM t-statistics between 3 and 5 s after stimulus onset in order tomatch the two-s TR of the EPI acquisition from the same V1 ROI. Tocompensate for the differing sensitivity of the two methods, criticalthresholds were chosen as tb2 (uncorrected p-value b0.028) and tb4(uncorrected p-value b10−4) for InI and EPI respectively in order toshow a similar size and pattern of cortical activity.
Differing detection sensitivity between InI and EPI werequantified by examining the t-value maxima, the t-value baselinestandard deviation, and the z-score transform of the t-values inprimary visual cortex of each participant (see Table 2). Generally, EPIwas associated with higher peak t-values compared to InI. However,the baseline variability of the EPI t-values was also higher than InI.The overall InI z-score transform of the t -values is thus higher thanEPI.We noticed that the standard deviation of baseline t-statistics doesnot equal to 1 in V1 ROI. The reason for this result is because wecalculated the averaged t-statistics within V1 ROI first and then
calculated the standard deviation. The averaging within the V1 ROIcertainly improves the noise fluctuation because of averaging acrossvoxels within the ROI. This explains why the reported standarddeviation of the t-statistics in the baseline period is less than 1.
The distances η between the centers of mass of the EPI and InIreconstructions from five participants are listed in Table 3. Onaverage, the spatial localization of InI and EPI peak activitiesdiffers by 5.2 mm. This localization discrepancy was quite stableamong all five participants. The maximum distance is 6.8 mm andminimum distance is 3.4 mm, both of which are within 2 mm of theaverage.
Group results
Fig. 11 shows single frames of InI dSPM t-values averaged over fiveparticipants at 100 ms temporal resolution. The shape of this groupaverage time series is very similar in character to the individual par-ticipant time series shown in Fig. 9, demonstrating the stableperformance of InI acquisition and reconstruction techniques. Notably,the negative t-values observed in the single participant, shown in Fig. 9,disappeared in this group average, implying that the signal decrease, asevidenced by the negative t-values, may be an individual or temporallyvariable effect. The individual frames of this group average showprogressive increasing activity starting at 2.7 s after the stimulus onset(critical threshold tb2; uncorrected p-value b0.028). The signal retur-ned to baseline approximately 6.0 s after stimulus onset.
The time course of the InI dSPM t-values from the group averageare shown in Fig. 12. The shape of the hemodynamic response in thegroup average is similar to that observed in individual participants
241F.-H. Lin et al. / NeuroImage 42 (2008) 230–247
(see Fig. 3).We observed a reduced variability along the time course,potentially resulting from averaging multiple participants. The peakactivity was found at 4.5 s after stimulus onset and the post-stimulusundershoot was observed between 10 s and 24 s after stimulus onsetin the group average.
Discussion
We have shown that single-shot volumetric InI methods canachieve an order-of-magnitude acceleration in hemodynamic re-sponse sampling by combining dense head coil array parallel data
Fig. 8. Single subject results showing successive frames of InI MNE-dSPM t-valuesaxial slices. The critical threshold used is t=2.0 (uncorrected p-value=0.028).
acquisition with distributed source modeling. Applying volumetricInI to study the visual system using an event-related design, wefound that the method is both sensitive and reliable, as demon-strated in the individual participant and group average results.Localization accuracy was examined by comparing the InI andconventional EPI task-related activity in primary visual cortex,with the comparison revealing a good spatial match (approximately5 mm) between the two methods. Our results in the visual cortexshow a faster BOLD-contrast response compared to conventionalEPI. This is comparable to previous results (Janz et al., 1997;Pfeuffer et al., 2002). In comparison to previous studies, InI
superimposed on the sum-of-squares images from the reference scan at eight
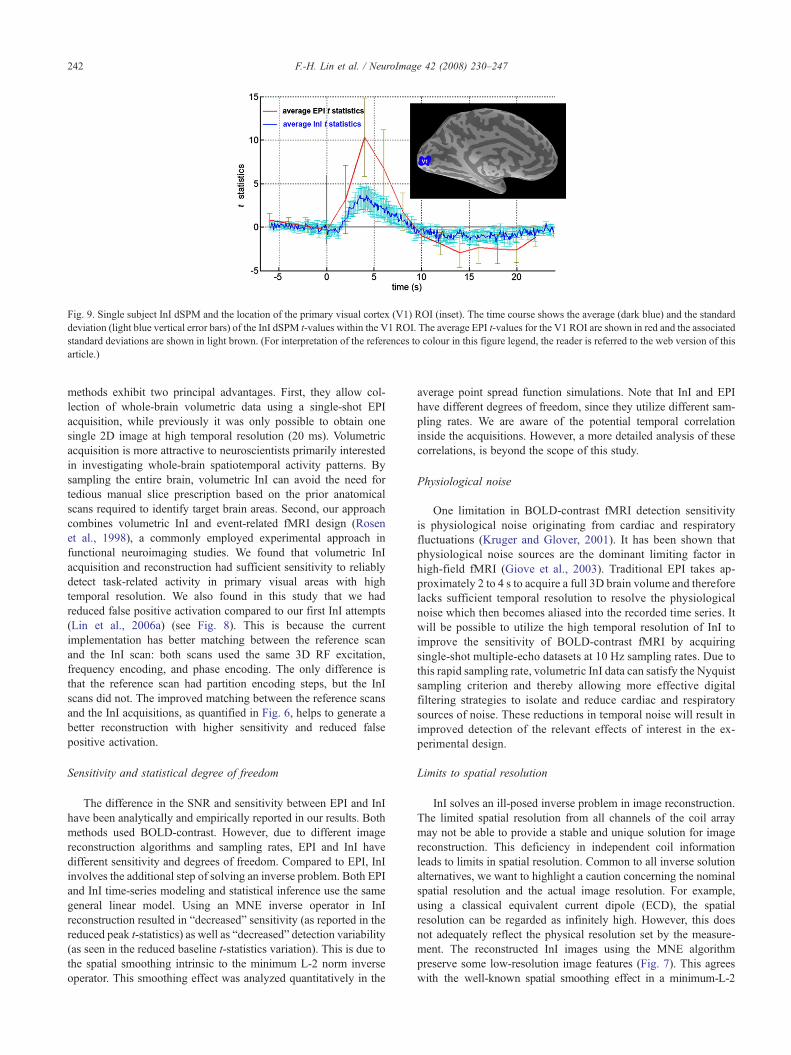
Fig. 9. Single subject InI dSPM and the location of the primary visual cortex (V1) ROI (inset). The time course shows the average (dark blue) and the standarddeviation (light blue vertical error bars) of the InI dSPM t-values within the V1 ROI. The average EPI t-values for the V1 ROI are shown in red and the associatedstandard deviations are shown in light brown. (For interpretation of the references to colour in this figure legend, the reader is referred to the web version of thisarticle.)
242 F.-H. Lin et al. / NeuroImage 42 (2008) 230–247
methods exhibit two principal advantages. First, they allow col-lection of whole-brain volumetric data using a single-shot EPIacquisition, while previously it was only possible to obtain onesingle 2D image at high temporal resolution (20 ms). Volumetricacquisition is more attractive to neuroscientists primarily interestedin investigating whole-brain spatiotemporal activity patterns. Bysampling the entire brain, volumetric InI can avoid the need fortedious manual slice prescription based on the prior anatomicalscans required to identify target brain areas. Second, our approachcombines volumetric InI and event-related fMRI design (Rosenet al., 1998), a commonly employed experimental approach infunctional neuroimaging studies. We found that volumetric InIacquisition and reconstruction had sufficient sensitivity to reliablydetect task-related activity in primary visual areas with hightemporal resolution. We also found in this study that we hadreduced false positive activation compared to our first InI attempts(Lin et al., 2006a) (see Fig. 8). This is because the currentimplementation has better matching between the reference scanand the InI scan: both scans used the same 3D RF excitation,frequency encoding, and phase encoding. The only difference isthat the reference scan had partition encoding steps, but the InIscans did not. The improved matching between the reference scansand the InI acquisitions, as quantified in Fig. 6, helps to generate abetter reconstruction with higher sensitivity and reduced falsepositive activation.
Sensitivity and statistical degree of freedom
The difference in the SNR and sensitivity between EPI and InIhave been analytically and empirically reported in our results. Bothmethods used BOLD-contrast. However, due to different imagereconstruction algorithms and sampling rates, EPI and InI havedifferent sensitivity and degrees of freedom. Compared to EPI, InIinvolves the additional step of solving an inverse problem. Both EPIand InI time-series modeling and statistical inference use the samegeneral linear model. Using an MNE inverse operator in InIreconstruction resulted in “decreased” sensitivity (as reported in thereduced peak t-statistics) as well as “decreased” detection variability(as seen in the reduced baseline t-statistics variation). This is due tothe spatial smoothing intrinsic to the minimum L-2 norm inverseoperator. This smoothing effect was analyzed quantitatively in the
average point spread function simulations. Note that InI and EPIhave different degrees of freedom, since they utilize different sam-pling rates. We are aware of the potential temporal correlationinside the acquisitions. However, a more detailed analysis of thesecorrelations, is beyond the scope of this study.
Physiological noise
One limitation in BOLD-contrast fMRI detection sensitivityis physiological noise originating from cardiac and respiratoryfluctuations (Kruger and Glover, 2001). It has been shown thatphysiological noise sources are the dominant limiting factor inhigh-field fMRI (Giove et al., 2003). Traditional EPI takes ap-proximately 2 to 4 s to acquire a full 3D brain volume and thereforelacks sufficient temporal resolution to resolve the physiologicalnoise which then becomes aliased into the recorded time series. Itwill be possible to utilize the high temporal resolution of InI toimprove the sensitivity of BOLD-contrast fMRI by acquiringsingle-shot multiple-echo datasets at 10 Hz sampling rates. Due tothis rapid sampling rate, volumetric InI data can satisfy the Nyquistsampling criterion and thereby allowing more effective digitalfiltering strategies to isolate and reduce cardiac and respiratorysources of noise. These reductions in temporal noise will result inimproved detection of the relevant effects of interest in the ex-perimental design.
Limits to spatial resolution
InI solves an ill-posed inverse problem in image reconstruction.The limited spatial resolution from all channels of the coil arraymay not be able to provide a stable and unique solution for imagereconstruction. This deficiency in independent coil informationleads to limits in spatial resolution. Common to all inverse solutionalternatives, we want to highlight a caution concerning the nominalspatial resolution and the actual image resolution. For example,using a classical equivalent current dipole (ECD), the spatialresolution can be regarded as infinitely high. However, this doesnot adequately reflect the physical resolution set by the measure-ment. The reconstructed InI images using the MNE algorithmpreserve some low-resolution image features (Fig. 7). This agreeswith the well-known spatial smoothing effect in a minimum-L-2

Fig. 10. Single subject medial and ventral views of thresholded InI and EPI activity estimates seen in response to a 500 ms duration reversing checkerboard. Thecritical thresholds were chosen as tb2 (uncorrected p-value b0.028) and tb4 (uncorrected p-value b10−4) for the InI and EPI displays respectively.
243F.-H. Lin et al. / NeuroImage 42 (2008) 230–247
norm solution. Previously, we estimated that 2D InI using MNEreconstruction has a spatial resolution ranging between 5 mm and16 mm, depending on the measurement SNR and the coil geometry(Lin et al., 2006a). From our results, we can see that volumetric InIprovides reasonable spatial accuracy relative to conventional EPIacquisition. However, a more systematic and extensive study of allfactors modulating the spatial resolution, including SNR, coilgeometry, field strength, and regularization parameters, will berequired in order to quantify the factors influencing spatial variationsin resolving power.
The spatial resolution is spatially-varying because the amount ofindependent spatial information from all channels in a coil arrayvaries among the image voxels within the field-of-view. Notably, inperipheral cortical areas the spatial resolution is higher and at thecenter of the brain the spatial resolution is lower (Lin et al., 2006a).In volumetric InI, anisotropic spatial resolution effects only appearin the InI dimension (L–R direction in this study), while the othertwo spatial dimensions (A–P and S–I directions) still retain isotropicspatial resolution because gradient encoding is used. To improve thespatial resolution, there are two alternatives. First, increasing thenumber of channels in a coil array can provide more independentspatial information. However, the benefit of increasing channels willreach a plateau as the consequence of electromagnetic theoreticallimitations (Ohliger et al., 2003; Wiesinger et al., 2004). In addition,at high field more independent spatial information can be obtainedfrom the same geometry of a coil array as the consequence of ashorter wavelength. This implies that higher spatial resolution can be
Table 2The t-value maxima, t-value baseline standard deviation, and the z-scoretransform of the t-values in primary visual cortex for EPI and InIreconstructions of the five participants
Participant InI EPI
Peakt-value
Baselinet-valuestandarddeviation
z-score Peakt-value
Baselinet-valuestandard dev
z-score
1 3.45 0.32 10.78 9.35 0.53 17.642 5.47 0.24 22.79 3.92 0.71 5.523 2.06 0.43 4.79 3.98 0.90 4.424 2.79 0.29 9.62 5.05 0.79 6.395 3.87 0.41 9.44 5.84 0.64 9.13Average 2.78 0.34 8.18 2.42 0.53 4.57
On average, InI is associated with higher z-scores due its correspondinglower baseline variability estimates.
obtained at 7T, using the existing 32-channel coil array geometryand the MNE reconstruction algorithm. Second, we can amelioratethe spatial blurring using other inverse reconstruction kernels, asdiscussed in the following section.
Reconstruction alternatives
The volumetric InI technique solves an ill-posed inverse problemto obtain reconstructed images, using the MNE solution to estimatethe spatial distribution of task-related activity. In MEG and EEGdistributed source modeling, spatial filters using linear constraintminimal variance (LCMV) beamformers have been also investi-gated extensively (Hillebrand and Barnes, 2005; Robinson, 2004;Sekihara et al., 2002; Van Veen et al., 1997). In contrast to MNE, theLCMVapproach minimizes the point spread function of the inverseoperator, resulting in LCMV results that are more focal compared toMNE. However, one disadvantage of LCMV is its inefficientdetection and separation of coherent sources (Van Veen et al., 1997).Interestingly, it has been shown that MNE and LCMV aremathematically related to each other; the difference residing in thefact that MNE is model-driven while LCMV is data-driven duringthe estimation of the data covariance matrix (Mosher et al., 2003).
Under the interpretation of Bayesian estimation theory, bothLCMV and MNE use L-2 norm prior models to solve an inverseproblem. Thus it may be possible to replace the L-2 norm model byan L-1 norm model to achieve a narrower point-spread-function inInI image reconstruction. The reason that the L-1 norm model has ahigher spatial resolution (a narrower point-spread-function) is thatthe probabilistic distribution of L-1 norm follows a bi-exponentialdistribution and the L-2 norm model follows a normal distribution.Moreover, the bi-exponential distribution has a more concentrated
Table 3Euclidian distances between the estimated primary visual cortex centers ofmass for EPI and InI activity in the five participants
Participant ID Distance (mm)
1 4.02 6.83 5.74 6.25 3.4Average (mm): 5.2
Peak activity localization is strongly concordant between the two imagingtechniques.

Fig. 11. Single frames of the InI dSPM t-values in visual cortex averaged across five participants shown from the medial aspect of the left hemisphere using aninflated brain surface model. The critical threshold was tb2.0 (uncorrected p-valueb0.028).
244 F.-H. Lin et al. / NeuroImage 42 (2008) 230–247
probability around the mean compared to the normal distribution(Uutela et al., 1999). L-1 norm models have been previouslystudied in the context of MEG and EEG source localization underthe term of “minimum-current estimate” MCE (Lin et al., 2006b;Matsuura and Okabe, 1995; Uutela et al., 1999). In future work, wewill investigate the comparative spatial localization accuracy of theLCMV inverse and MCE approaches using InI data.
Spatial distortion
In this study we employed a single-shot volumetric InI acquisitionwith an EPI readout. Thus, the reconstructed projection image con-
Fig. 12. Group average InI dSPM. The time courses show the average (dark bluet-values within the primary visual cortex ROI. The average EPI t-values in the prred and light brown. (For interpretation of the references to colour in this figur
tains the expected EPI artifacts, including intra-voxel signal loss dueto spatially inhomogeneous susceptibility distribution and geome-trical distortion along the phase-encoding direction due to itsintrinsically lower bandwidth. Correction of these artifacts has beenstudied extensively. For example, to mitigate these artifacts, we canuse field mapping to investigate the spatial distribution of the off-resonance effects and then use this information to reduce thesusceptibility artifacts (Chen et al., 2006; Chen and Wyrwicz, 1999;Zeng and Constable, 2002). It is also possible to use parallel imagingtechniques with EPI acquisitions to limit geometric distortion (Weigeret al., 2002), by systematically skipping multiple integer lines in thecontinuous sampling of different phase-encoding lines and thenreconstructing the skipped phase-encoding lines using spatial
) and the standard deviation (light blue vertical error bars) of the InI dSPMimary visual cortex ROI with associated standard deviations are shown ine legend, the reader is referred to the web version of this article.)

245F.-H. Lin et al. / NeuroImage 42 (2008) 230–247
information embedded inside different array channels. Thus theeffective bandwidth in the reconstructed image will be wider and willthereby reduce the distortion.Note that here the spatial information fromthe coil array channels is in an orthogonal direction between EPI phaseencoding (anterior–posterior axis) and InI encoding (left–right axis).Thus the implementation of this approach will not reduce the availablespatial information in the InI reconstructions, while SNR loss is a pricethat must be paid for reduced data sample numbers and changes in theparallel MRI reconstruction geometrical factor (g-factor).
Time-resolved functional imaging
The brain is a highly dynamic system. Consequently, detectionand localization of static patterns of regional functional specializa-tion will not be sufficient to fully understand the neural mechanismsunderlying complex behavior. Nevertheless, current fMRI researchmainly relies on methods that are most sensitive to these stationarypatterns of task-related activity. Volumetric InI allows functionalimaging measurements at high sampling rates over extended brainvolumes usingminimal gradient encoding. To our knowledge, this isthe most rapid whole-brain fMRI achieved to date and this relativelyhigh sampling rate may, in future work, enable the measurement ofrelative brain activity onset times and thereby provide a betterunderstanding of the dynamic driving relationships among interact-ing neural subsystems across the whole brain. This goal cannot beachieved with conventional EPI methods due to their limited spatialcoverage and temporal resolution.
Because of the relative sluggishness of the fMRI BOLD-contrasttime course, it has been argued that improving the temporalresolution of fMRI might not reveal more information about braindynamics. However, it is becoming increasingly clear that thispopularly held view is incorrect, possibly resulting from a paucity ofpractical methods allowing ultrafast fMRI recordings in large brainvolumes. For example, using limited spatial coverage, high temporalresolution fMRI (TR=100 ms/slice or 400 ms/volume) can detectspatially distinct differences in neural activity onset times that canthen be correlated with reaction time in order to localize the corticalareas active in the different phases of sensorimotor integration(Menon et al., 1998). In addition, fMRI experiments using jitteredinter-stimulus-interval manipulations have detected millisecond-scale interactions among neural systems (Ogawa et al., 2000).However, no direct measurements of BOLD-contrast signals at hightemporal resolution with spatial coverage of the entire brain havebeen achieved previously. Using volumetric InI, it may be possibleto adapt time-resolved imaging techniques to experimental designsprobing mutual interactions among a spatially distributed set ofparticipating functionally specialized regions.
Future development
Motion correction is a critical process to improve detectionpower of fMRI. However, Motion correction of InI data isdifficult because the acquisitions have only projection images.Such reduction to one dimensional spatial information poses atechnical difficulty in utilizing post-processing method to do, forexample, rigid body transformation. Thus, InI may not have theoptimal sensitivity due to motion artifacts. A potential method tomitigate this motion artifact issue uses navigator echoes duringacquisition to correct motion effects at a moderate cost intemporal resolution (van der Kouwe et al., 2006). Even thoughvolumetric InI allows dramatic improvement in sampling rates, it
is still constrained by the need to use the optimal TE for detectionof BOLD-contrast effects (approximately 30 ms at 3T). At higherfield strengths, such as 7T, the optimal TE for BOLD-contrastwould be 20 ms or less, allowing further acceleration of volumetricInI, possibly to 50 ms whole-brain sampling times. In addition,there are two potential approaches to mitigate the temporalresolution limitations: First, we may use different contrastmechanisms, such as steady-state free precession (SSFP), whereTE is usually less than 5 ms (Miller et al., 2003, 2006). However,SSFP contrast is challenging at high field because of its high SARfrom RF excitation. Second, we may use an echo-shiftingtechnique to reduce the TR (Golay et al., 2000; Liu et al., 1993),as demonstrated in our previous 2D InI study (Lin et al., 2006a).Both alternatives are capable of reducing the sampling time toaround 20 ms. The resulting higher temporal resolution may allowstudy of relative cortical activity timing on an extraordinarily finetime scale, thereby facilitating study of the complex interactionsamong regionally specialized neural subsystems responsible forthe mediation of complex behavior.
Acknowledgments
This work was supported by National Institutes of HealthGrants R01 HD040712, R01 NS037462, P41 RR14075, the Men-tal Illness and Neuroscience Discovery Institute (MIND), NSC 96-2320-B-002-085 (National Science Council, Taiwan), and NHRI-EX97-9715EC (National Health Research Institute, Taiwan).
References
Belliveau, J.W., Rosen, B.R., Kantor, H.L., Rzedzian, R.R., Kennedy, D.N.,McKinstry, R.C., Vevea, J.M., Cohen, M.S., Pykett, I.L., Brady, T.J.,1990. Functional cerebral imaging by susceptibility-contrast NMR.Magn. Reson. Med. 14, 538–546.
Belliveau, J.W., Kennedy Jr., D.N., McKinstry, R.C., Buchbinder, B.R.,Weisskoff, R.M., Cohen, M.S., Vevea, J.M., Brady, T.J., Rosen, B.R.,1991. Functional mapping of the human visual cortex by magneticresonance imaging. Science 254, 716–719.
Blum, M.J., Braun, M., Rosenfeld, D., 1987. Fast magnetic resonanceimaging using spiral trajectories. Australas. Phys. Eng. Sci. Med. 10,79–87.
Bodurka, J., Ledden, P.J., van Gelderen, P., Chu, R., de Zwart, J.A., Morris,D., Duyn, J.H., 2004. Scalable multichannel MRI data acquisitionsystem. Magn. Reson. Med. 51, 165–171.
Brainard, D.H., 1997. The psychophysics toolbox. Spat. Vis. 10, 433–436.Chen, N.K., Wyrwicz, A.M., 1999. Correction for EPI distortions using
multi-echo gradient-echo imaging. Magn. Reson. Med. 41, 1206–1213.Chen, N.K., Oshio, K., Panych, L.P., 2006. Application of k-space energy
spectrum analysis to susceptibility field mapping and distortioncorrection in gradient-echo EPI. NeuroImage 31, 609–622.
Dale, A.M., Fischl, B., Sereno, M.I., 1999. Cortical surface-based analysis.I. Segmentation and surface reconstruction. NeuroImage 9, 179–194.
Dale, A.M., Liu, A.K., Fischl, B.R., Buckner, R.L., Belliveau, J.W., Lewine,J.D., Halgren, E., 2000. Dynamic statistical parametric mapping:combining fMRI and MEG for high-resolution imaging of corticalactivity. Neuron 26, 55–67.
de Zwart, J.A., Ledden, P.J., Kellman, P., van Gelderen, P., Duyn, J.H., 2002.Design of a SENSE-optimized high-sensitivity MRI receive coil forbrain imaging. Magn. Reson. Med. 47, 1218–1227.
de Zwart, J.A., Ledden, P.J., van Gelderen, P., Bodurka, J., Chu, R., Duyn, J.H.,2004. Signal-to-noise ratio and parallel imaging performance of a 16-channelreceive-only brain coil array at 3.0 Tesla. Magn. Reson. Med. 51, 22–26.
246 F.-H. Lin et al. / NeuroImage 42 (2008) 230–247
Fischl, B., Sereno, M.I., Dale, A.M., 1999. Cortical surface-based analysis.II: inflation, flattening, and a surface-based coordinate system. Neuro-Image 9, 195–207.
Fischl, B., Liu, A., Dale, A.M., 2001. Automated manifold surgery:constructing geometrically accurate and topologically correct models ofthe human cerebral cortex. IEEE Trans. Med. Imag. 20, 70–80.
Friston, K.J., 2007. Statistical parametric mapping: the analysis of funtionalbrain images, 1st ed. Elsevier/Academic Press, Amsterdam; Boston.
Giove, F., Mangia, S., Bianciardi, M., Garreffa, G., Di Salle, F., Morrone, R.,Maraviglia, B., 2003. The physiology and metabolism of neuronalactivation: in vivo studies by NMR and other methods. Magn. Reson.Imaging 21, 1283–1293.
Golay, X., Pruessmann, K.P., Weiger, M., Crelier, G.R., Folkers, P.J.,Kollias, S.S., Boesiger, P., 2000. PRESTO-SENSE: an ultrafast whole-brain fMRI technique. Magn. Reson. Med. 43, 779–786.
Griswold, M.A., Jakob, P.M., Heidemann, R.M., Nittka, M., Jellus, V.,Wang, J., Kiefer, B., Haase, A., 2002. Generalized autocalibratingpartially parallel acquisitions (GRAPPA). Magn. Reson. Med. 47,1202–1210.
Haacke, E.M., 1999. Magnetic resonance imaging: physical principles andsequence design. J. Wiley & Sons, New York.
Hamalainen, M., Hari, R., Ilmoniemi, R., Knuutila, J., Lounasmaa, O., 1993.Magnetoencephalography-theory, instrumentation, and application tononinvasive studies of the working human brain. Rev. Mod. Phys. 65,413–497.
Hennig, J., Zhong, K., Speck, O., 2007. MR-Encephalography: fast multi-channel monitoring of brain physiology with magnetic resonance.NeuroImage 34, 212–219.
Hillebrand, A., Barnes, G.R., 2005. Beamformer analysis of MEG data. Int.Rev. Neurobiol. 68, 149–171.
Janz, C., Speck, O., Hennig, J., 1997. Time-resolved measurements of brainactivation after a short visual stimulus: new results on the physiologicalmechanisms of the cortical response. NMR Biomed. 10, 222–229.
Katscher, U., Manke, D., 2002. Underdetermined SENSE using a-prioriknowledge. International Society for Magnetic Resonance in MedicineTenth Scientific Meeting and Exhibition. International Society forMagnetic Resonance in Medicine, Honolulu, Hawaii, USA, p. 2396.
King, K., 2001. SENSE image quality improvement using matrixregularization. Proceedings of the 9th Annual Meeting of ISMRM.International Society of Magnetic Resonance in Medicine, Glasgow,Scotland, p. 1771.
Kruger, G., Glover, G.H., 2001. Physiological noise in oxygenation-sensitive magnetic resonance imaging. Magn. Reson. Med. 46,631–637.
Kwong, K.K., Belliveau, J.W., Chesler, D.A., Goldberg, I.E.,Weisskoff, R.M.,Poncelet, B.P., Kennedy, D.N., Hoppel, B.E., Cohen, M.S., Turner, R.,Cheng, H., Brady, T.J., Rosen, B.R., 1992. Dynamic magnetic resonanceimaging of human brain activity during primary sensory stimulation. Proc.Natl. Acad. Sci. U. S. A. 89, 5675–5679.
Lin, F.-H., Kwong, K.K., Chen, Y.-J., Belliveau, J.W., Wald, L.L., 2002.Reconstruction of sensitivity encoded images using regularization anddiscrete time wavelet transform estimates of the coil maps. InternationalSociety for Magnetic Resonance in Medicine Tenth Sceintific Meetingand Exhibition. International Society for Magnetic Resonance inMedicine, Honolulu, Hawaii, USA, p. 2389.
Lin, F.H., Kwong, K.K., Belliveau, J.W., Wald, L.L., 2004. Parallel imagingreconstruction using automatic regularization. Magn. Reson. Med. 51,559–567.
Lin, F.H., Huang, T.Y., Chen, N.K., Wang, F.N., Stufflebeam, S.M., Belliveau,J.W., Wald, L.L., Kwong, K.K., 2005. Functional MRI using regularizedparallel imaging acquisition. Magn. Reson. Med. 54, 343–353.
Lin, F.H., Wald, L.L., Ahlfors, S.P., Hamalainen, M.S., Kwong, K.K.,Belliveau, J.W., 2006a. Dynamic magnetic resonance inverse imaging ofhuman brain function. Magn. Reson. Med. 56, 787–802.
Lin, F.H., Belliveau, J.W., Dale, A.M., Hamalainen, M.S., 2006b.Distributed current estimates using cortical orientation constraints.Hum. Brain Mapp. 27 (1), 1–13.
Liu, G., Sobering, G., Duyn, J., Moonen, C.T., 1993. A functional MRItechnique combining principles of echo-shifting with a train ofobservations (PRESTO). Magn. Reson. Med. 30, 764–768.
Liu, A.K., Belliveau, J.W., Dale, A.M., 1998. Spatiotemporal imaging ofhuman brain activity using functional MRI constrained magnetoencepha-lography data:Monte Carlo simulations. Proc. Natl. Acad. Sci. U. S. A. 95,8945–8950.
Liu, A.K., Dale, A.M., Belliveau, J.W., 2002. Monte Carlo simulationstudies of EEG and MEG localization accuracy. Hum. Brain Mapp. 16,47–62.
Mansfield, P., 1977. Multi-planar image formation using NMR spin echos.J. Phys. C10, L55–L58.
Matsuura, K., Okabe, Y., 1995. Selective minimum-norm solution of thebiomagnetic inverse problem. IEEE Trans. Biomed. Eng. 42, 608–615.
McDougall, M.P., Wright, S.M., 2005. 64-channel array coil for single echoacquisition magnetic resonance imaging. Magn. Reson. Med. 54,386–392.
McGibney, G., Smith, M.R., Nichols, S.T., Crawley, A., 1993. Quantitativeevaluation of several partial Fourier reconstruction algorithms used inMRI. Magn. Reson. Med. 30, 51–59.
Menon, R.S., Luknowsky, D.C., Gati, J.S., 1998. Mental chronometry usinglatency-resolved functional MRI. Proc. Natl. Acad. Sci. U. S. A. 95,10902–10907.
Miller, K.L., Hargreaves, B.A., Lee, J., Ress, D., deCharms, R.C., Pauly, J.M.,2003. Functional brain imaging using a blood oxygenation sensitive steadystate. Magn. Reson. Med. 50, 675–683.
Miller, K.L., Smith, S.M., Jezzard, P., Pauly, J.M., 2006. High-resolutionFMRI at 1.5T using balanced SSFP. Magn. Reson. Med. 55, 161–170.
Mistretta, C.A., Wieben, O., Velikina, J., Block, W., Perry, J., Wu, Y.,Johnson, K., Wu, Y., 2006. Highly constrained backprojection for time-resolved MRI. Magn. Reson. Med. 55, 30–40.
Mosher, J.C., Baillet, S., Leahy, R.M., 2003. Equivalence of linearapproaches in biomagnetic inverse solutions. 2003 IEEE workshop onstatistical signal processing. IEEE, St. Louis, Missouri, pp. 294–297.
Ogawa, S., Lee, T.M., Kay, A.R., Tank, D.W., 1990. Brain magneticresonance imaging with contrast dependent on blood oxygenation. Proc.Natl. Acad. Sci. U. S. A. 87, 9868–9872.
Ogawa, S., Lee, T.M., Stepnoski, R., Chen, W., Zhu, X.H., Ugurbil, K.,2000. An approach to probe some neural systems interaction byfunctional MRI at neural time scale down to milliseconds. Proc. Natl.Acad. Sci. U. S. A. 97, 11026–11031.
Ohliger, M.A., Grant, A.K., Sodickson, D.K., 2003. Ultimate intrinsicsignal-to-noise ratio for parallel MRI: electromagnetic field considera-tions. Magn. Reson. Med. 50, 1018–1030.
Pelli, D.G., 1997. The VideoToolbox software for visual psychophysics:transforming numbers into movies. Spat. Vis. 10, 437–442.
Pfeuffer, J., Adriany, G., Shmuel, A., Yacoub, E., Van DeMoortele, P.F., Hu,X., Ugurbil, K., 2002. Perfusion-based high-resolution functionalimaging in the human brain at 7 Tesla. Magn. Reson. Med. 47, 903–911.
Preibisch, C., Pilatus, U., Bunke, J., Hoogenraad, F., Zanella, F.,Lanfermann, H., 2003. Functional MRI using sensitivity-encoded echoplanar imaging (SENSE-EPI). NeuroImage 19, 412–421.
Pruessmann, K.P., Weiger, M., Scheidegger, M.B., Boesiger, P., 1999.SENSE: sensitivity encoding for fast MRI. Magn. Reson. Med. 42,952–962.
Robinson, S.E., 2004. Localization of event-related activity by SAM(erf).Neurol. Clin. Neurophysiol. 2004, 109.
Rosen, B.R., Buckner, R.L., Dale, A.M., 1998. Event-related functional MRI:past, present, and future. Proc. Natl. Acad. Sci. U. S. A. 95, 773–780.
Schmidt, C.F., Degonda, N., Luechinger, R., Henke, K., Boesiger, P., 2005.Sensitivity-encoded (SENSE) echo planar fMRI at 3T in the medialtemporal lobe. NeuroImage 25, 625–641.
Sekihara, K., Nagarajan, S.S., Poeppel, D., Marantz, A., Miyashita, Y., 2002.Application of anMEG eigenspace beamformer to reconstructing spatio-temporal activities of neural sources. Hum. Brain Mapp. 15, 199–215.
Sodickson, D.K., 2000. Tailored SMASH image reconstructions for robustin vivo parallel MR imaging. Magn. Reson. Med. 44, 243–251.

247F.-H. Lin et al. / NeuroImage 42 (2008) 230–247
Sodickson, D.K., Manning, W.J., 1997. Simultaneous acquisition of spatialharmonics (SMASH): fast imaging with radiofrequency coil arrays.Magn. Reson. Med. 38, 591–603.
Sodickson, D.K., McKenzie, C.A., 2001. A generalized approach to parallelmagnetic resonance imaging. Med. Phys. 28, 1629–1643.
Tsao, J., Behnia, B., Webb, A.G., 2001. Unifying linear prior-information-driven methods for accelerated image acquisition. Magn. Reson. Med.46, 652–660.
Tsao, J., Pruessmann, K., Boesiger, P., 2002. Prior-information-enhanceddynamic imaging using single or multiple coils with k-t BLAST and k-tSENSE. International Society for Magnetic Resonance in MedicineTenth Scientific Meeting and Exhibition. International Society ofMagnetic Resonance in Medicine, Honolulu, Hawaii, USA, p. 2369.
Tsao, J., Boesiger, P., Pruessmann, K.P., 2003. k-t BLAST and k-t SENSE:dynamic MRI with high frame rate exploiting spatiotemporal correla-tions. Magn. Reson. Med. 50, 1031–1042.
Tsao, J., Kozerke, S., Boesiger, P., Pruessmann, K.P., 2005. Optimizingspatiotemporal sampling for k-t BLAST and k-t SENSE: application tohigh-resolution real-time cardiac steady-state free precession. Magn.Reson. Med. 53, 1372–1382.
Uutela, K., Hamalainen, M., Somersalo, E., 1999. Visualization ofmagnetoencephalographic data using minimum current estimates.NeuroImage 10, 173–180.
van der Kouwe, A.J., Benner, T., Dale, A.M., 2006. Real-time rigid bodymotion correction and shimming using cloverleaf navigators. Magn.Reson. Med. 56, 1019–1032.
Van Veen, B.D., van Drongelen, W., Yuchtman, M., Suzuki, A., 1997.Localization of brain electrical activity via linearly constrained minimumvariance spatial filtering. IEEE Trans. Biomed. Eng. 44, 867–880.
Wagner, A.D., Schacter, D.L., Rotte, M., Koutstaal, W., Maril, A., Dale, A.M.,Rosen, B.R., Buckner, R.L., 1998. Building memories: remembering andforgetting of verbal experiences as predicted by brain activity. Science 281,1188–1191.
Weiger, M., Pruessmann, K.P., Osterbauer, R., Bornert, P., Boesiger, P.,Jezzard, P., 2002. Sensitivity-encoded single-shot spiral imaging forreduced susceptibility artifacts in BOLD fMRI. Magn. Reson. Med. 48,860–866.
Wiesinger, F., Boesiger, P., Pruessmann, K.P., 2004. Electrodynamics andultimate SNR in parallel MR imaging. Magn. Reson. Med. 52, 376–390.
Wiggins, G.C., Potthast, A., Triantafyllou, C., Lin, F.-H., Benner, T.,Wiggins, C.J., Wald, L.L., 2005a. A 96-channel MRI system with 23-and 90-channel phase array head coils at 1.5 Tesla. International Societyfor Magnetic Resonance in Medicine Thirteenth Scientific Meeting andExhibition. International Society for Magnetic Resonance in Medicine,Miami, Florida, USA, p. 671.
Wiggins, G.C., Triantafyllou, C., Potthast, A., Reykowski, A., Nittka, M.,Wald, L.L., 2005b. A 32 channel receive-only phased array head coil for3T with novel geodesic tiling geometry. International Society forMagnetic Resonance in Medicine Thirteenth Scientific Meeting andExhibition. International Society for Magnetic Resonance in Medicine,Miami, Florida, USA, p. 671.
Wiggins, G.C., Triantafyllou, C., Potthast, A., Reykowski, A., Nittka, M.,Wald, L.L., 2006. 32-channel 3 Tesla receive-only phased-array headcoil with soccer-ball element geometry. Magn. Reson. Med. 56,216–223.
Zeng, H., Constable, R.T., 2002. Image distortion correction in EPI:comparison of field mapping with point spread function mapping. Magn.Reson. Med. 48, 137–146.