evaluation the impact tilt angle on the sun collectors
TRANSCRIPT

Energy Procedia 32 ( 2013 ) 222 – 231
1876-6102 © 2013 The Authors. Published by Elsevier Ltd.Selection and peer-review under responsibility of the Research Centre for Electrical Power and Mechatronics, Indonesian Institute of Sciences.doi: 10.1016/j.egypro.2013.05.029
International Conference on Sustainable Energy Engineering and Application
[ICSEEA 2012]
Evaluation the impact tilt angle on the sun collectors
István Patkó*, András Szeder, Csilla Patkó Óbuda University, Rejt Sándor Faculty of Light Industry and Environmental Engineering, Doberdó út 6., H-1034 Budapest,
Hungary
Abstract
In order to efficiently solve the problems created by the deepening energy crisis affecting Europe and the world, governments cannot neglect the opportunities of using the energy produced by sun collectors. In many of the EU countries there are sun collectors producing heat energy, e.g. in Austria more than 3,500,000m2 and in Germany more than 12,000,000m2 of sun collectors are operated [5]. The energy produced by these sun collectors is utilized at the place of production. In the near future governments will have to focus more on spreading and using sun collectors. Among the complex problems of operating sun collectors, this article deals with determining the optimal tilt angle of sun collectors. The tilt angles which we determined theoretically are confirmed by laboratory measurements. The result of our work will help users and engineers to determine the optimal operation of sun collectors. © 2012 Published by Elsevier Ltd. Selection and/or peer-review under responsibility of Research Centre for Electrical Power and Mechatronics, Indonesian Institute of Sciences Keywords: Sun collector; heat energy; optimal tilt angle.
1. Sun-earth geometry
In order that the surface of the sun collectors should be able to convert as much as possible from the energy transported by the arriving sun rays we must be familiar with the Sun-Earth movements. When determining the geometry of the Sun-Earth movement we tried to use the simplest formulas possible that engineers and enterprises designing the sun collectors may be able to work with. From the different types of solar radiation discussed in the previous chapter we would like to deal with direct radiation only. Figure
* Corresponding author. Tel.: +36-1-666-5900; fax: +36-1-666-5909. E-mail address: [email protected].
Available online at www.sciencedirect.com
© 2013 The Authors. Published by Elsevier Ltd.Selection and peer-review under responsibility of the Research Centre for Electrical Power and Mechatronics, Indonesian Institute of Sciences.
Open access under CC BY-NC-ND license.
Open access under CC BY-NC-ND license.
brought to you by COREView metadata, citation and similar papers at core.ac.uk
provided by Elsevier - Publisher Connector
István Patkó et al. / Energy Procedia 32 ( 2013 ) 222 – 231 223
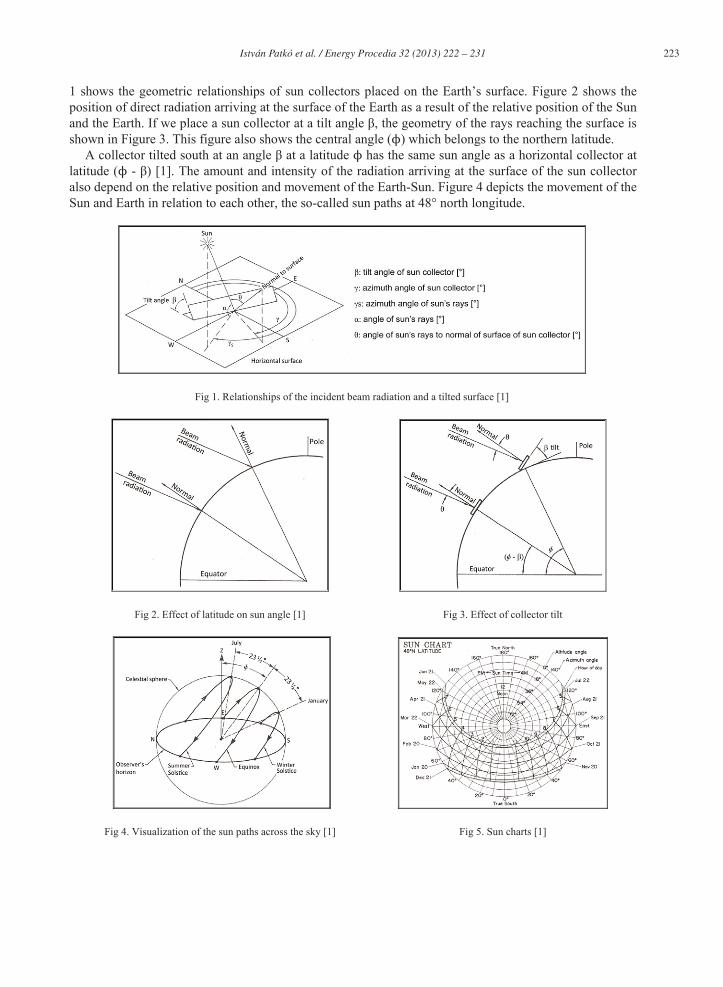
1 shows the geometric relationships of sun collectors placed on the Earth’s surface. Figure 2 shows the position of direct radiation arriving at the surface of the Earth as a result of the relative position of the Sun and the Earth. If we place a sun collector at a tilt angle , the geometry of the rays reaching the surface is shown in Figure 3. This figure also shows the central angle ( ) which belongs to the northern latitude.
A collector tilted south at an angle at a latitude has the same sun angle as a horizontal collector at latitude ( - ) [1]. The amount and intensity of the radiation arriving at the surface of the sun collector also depend on the relative position and movement of the Earth-Sun. Figure 4 depicts the movement of the Sun and Earth in relation to each other, the so-called sun paths at 48° north longitude.
Fig 1. Relationships of the incident beam radiation and a tilted surface [1]
Fig 2. Effect of latitude on sun angle [1] Fig 3. Effect of collector tilt
Fig 4. Visualization of the sun paths across the sky [1] Fig 5. Sun charts [1]

224 István Patkó et al. / Energy Procedia 32 ( 2013 ) 222 – 231
At 48˚ latitude of the northern hemisphere the figure shows the sun’s movement at the time of the winter and summer solstice and the equinox. If we prepare the top-view picture of this figure, we get the sun chart of this northern latitude (Figure 5). According to the sun charts the sun gets the closest to the sun collector placed in the centre of the figure i.e. the observation point, at the time of the summer solstice, i.e. at 12.00 June 21st. It is obvious from this figure that if the sun collector is directed in the true south direction, it gets the largest possible radiation energy. During the day the angle of the sun to the normal of the sun collector ( ) changes according to the passage of time. If we want the sun to reach the surface of the sun collector at the most optimal angle during the day, continuous east-west sun collector adjustment must be provided. This topic is not dealt with in this work. In our work with change tilt angle to the horizontal surface and we determine those tilt angles ( ) at which, during the year, the collector will be capable of transforming the largest energy deriving from the sun. This means that he tilt angle of the ( ) should be modified according to the movement of the sun each day of the year.
This is technically unimaginable and impracticable, therefore in this section of our article we determine the most optimal tilt angle values at the tested geographical location (N 47.5°): for the whole year
(the tilt angle of the collector ( year) is not modified during the year), seasonally
(the tilt angle of the collector is modified according to the four seasons. Therefore four tilt angles will be defined ( summer, winter, autumn, spring)).
The Earth orbits the Sun in an elliptical orbit with an eccentricity of 3%. The Earth makes a full circle in a year. The Earth does not only go around the Sun but it also rotates around its own axis at a speed of one rotation per day. Its own axis is tilted at =23.5° from the axis of the orbit around the Sun. In this way during its orbit around the Sun, the northern hemisphere gets closer to the Sun in the summer than the southern hemisphere, and this is changed in winter. In spring and autumn the tilting of the Earth’s axis ( ) is such that the distance of the northern hemisphere and the southern hemisphere relative to the Sun is the same. This is shown in Figure 6.
Figure 7 shows the variation derived from the relative declination of the Earth’s axis angle ( ) in relation to the time of year. This variation gives a sinusoidal function which shows that on March 20th and September 22nd, i.e. at the time of the summer and winter solstice the incremental distance between the Earth’s northern hemisphere and the Sun is zero, while it is the smallest on June 21st and the largest on December 22nd.
Fig 6. Diagram of the earth’s orbit around the sun [1] Fig 7. Yearly variation of the solar declination [1]
István Patkó et al. / Energy Procedia 32 ( 2013 ) 222 – 231 225
On the basis of our theoretical considerations and experience we have accepted that – globally, regarding a whole year – the tilt angle of the sun collector equals the value of the northern latitude, i.e.:
year= so at the test site, in Budapest, (47.5° N):
year=47.5° According to [1] year= should be modified in the following way:
year= + (10°÷20°) We disregard this assumption, proposal during our tests. The – theoretical – values of seasonal tilt angles are the following according to Figure 6.
summer = - winter = + autumn = spring =
The tilt angles of the sun collectors at the test site, in Budapest, (47.5°N): summer = 24° winter = 71° autumn = 47.5° spring = 47.5°
We made some measurements in order to verify the correctness of the values.
2. Laboratory measurements
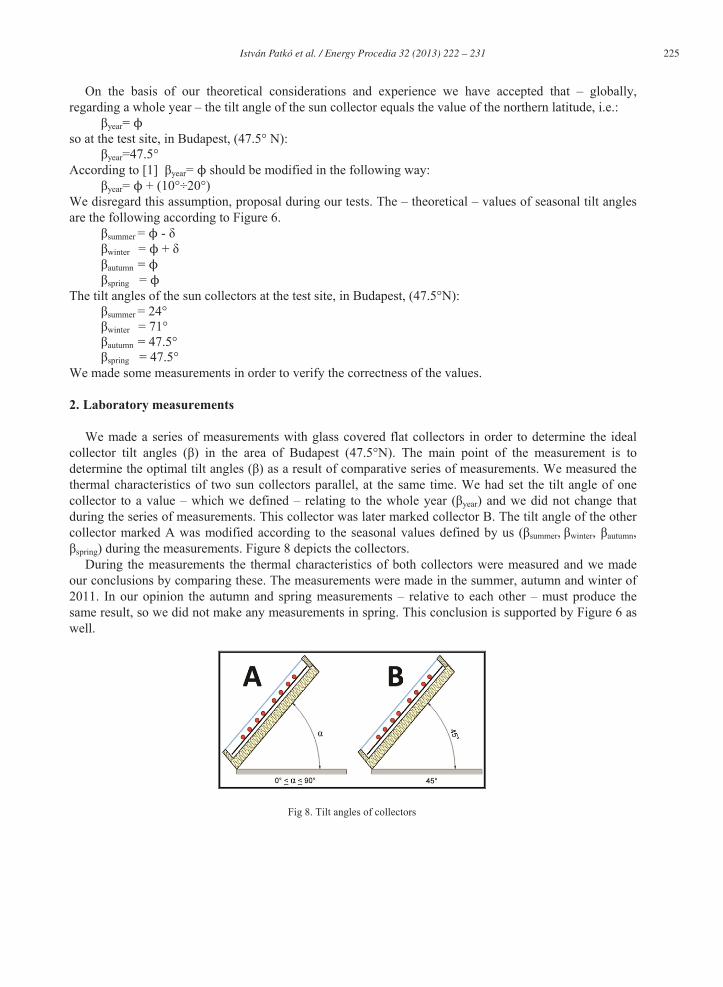
We made a series of measurements with glass covered flat collectors in order to determine the ideal collector tilt angles ( ) in the area of Budapest (47.5°N). The main point of the measurement is to determine the optimal tilt angles ( ) as a result of comparative series of measurements. We measured the thermal characteristics of two sun collectors parallel, at the same time. We had set the tilt angle of one collector to a value – which we defined – relating to the whole year ( year) and we did not change that during the series of measurements. This collector was later marked collector B. The tilt angle of the other collector marked A was modified according to the seasonal values defined by us ( summer, winter, autumn,
spring) during the measurements. Figure 8 depicts the collectors. During the measurements the thermal characteristics of both collectors were measured and we made
our conclusions by comparing these. The measurements were made in the summer, autumn and winter of 2011. In our opinion the autumn and spring measurements – relative to each other – must produce the same result, so we did not make any measurements in spring. This conclusion is supported by Figure 6 as well.
Fig 8. Tilt angles of collectors
226 István Patkó et al. / Energy Procedia 32 ( 2013 ) 222 – 231
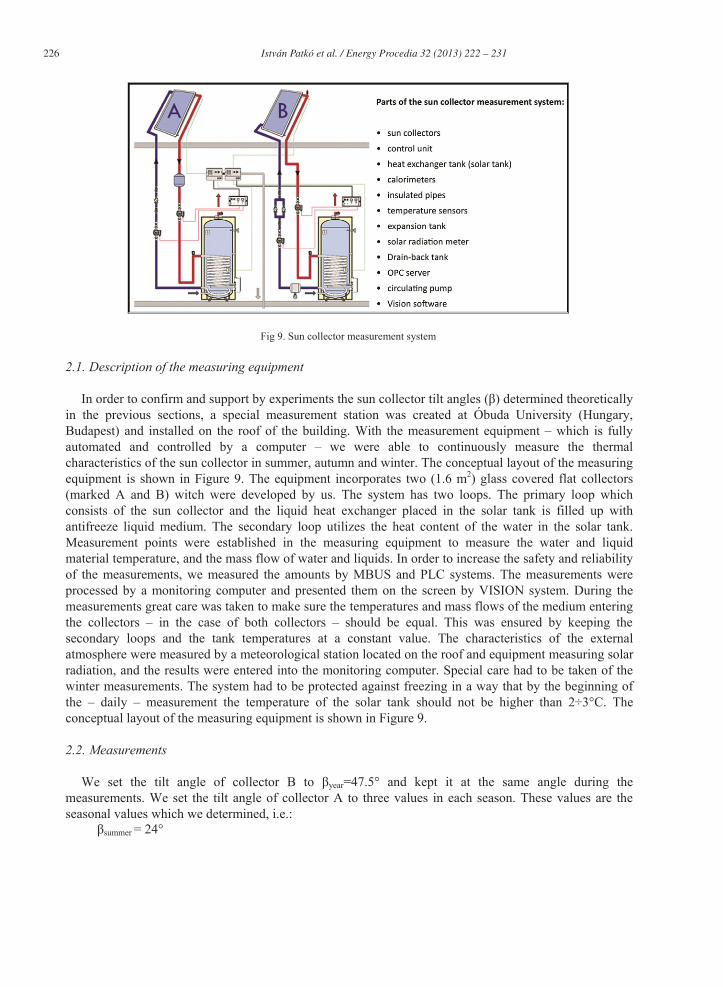
Fig 9. Sun collector measurement system
2.1. Description of the measuring equipment
In order to confirm and support by experiments the sun collector tilt angles ( ) determined theoretically in the previous sections, a special measurement station was created at Óbuda University (Hungary, Budapest) and installed on the roof of the building. With the measurement equipment – which is fully automated and controlled by a computer – we were able to continuously measure the thermal characteristics of the sun collector in summer, autumn and winter. The conceptual layout of the measuring equipment is shown in Figure 9. The equipment incorporates two (1.6 m2) glass covered flat collectors (marked A and B) witch were developed by us. The system has two loops. The primary loop which consists of the sun collector and the liquid heat exchanger placed in the solar tank is filled up with antifreeze liquid medium. The secondary loop utilizes the heat content of the water in the solar tank. Measurement points were established in the measuring equipment to measure the water and liquid material temperature, and the mass flow of water and liquids. In order to increase the safety and reliability of the measurements, we measured the amounts by MBUS and PLC systems. The measurements were processed by a monitoring computer and presented them on the screen by VISION system. During the measurements great care was taken to make sure the temperatures and mass flows of the medium entering the collectors – in the case of both collectors – should be equal. This was ensured by keeping the secondary loops and the tank temperatures at a constant value. The characteristics of the external atmosphere were measured by a meteorological station located on the roof and equipment measuring solar radiation, and the results were entered into the monitoring computer. Special care had to be taken of the winter measurements. The system had to be protected against freezing in a way that by the beginning of the – daily – measurement the temperature of the solar tank should not be higher than 2÷3°C. The conceptual layout of the measuring equipment is shown in Figure 9.
2.2. Measurements
We set the tilt angle of collector B to year=47.5° and kept it at the same angle during the measurements. We set the tilt angle of collector A to three values in each season. These values are the seasonal values which we determined, i.e.:
summer = 24°
István Patkó et al. / Energy Procedia 32 ( 2013 ) 222 – 231 227
winter = 71° autumn = 47.5°
During the measurements we measured the temperature and the mass flow of the liquids entering and leaving the sun collectors, the temperature of the solar tank, the amounts of heat carried off the solar tank as well as the data of the external atmosphere and solar radiation. During the measurements it was ensured that the temperatures and mass flows of the medium entering the collectors should be equal (TinA= TinB).
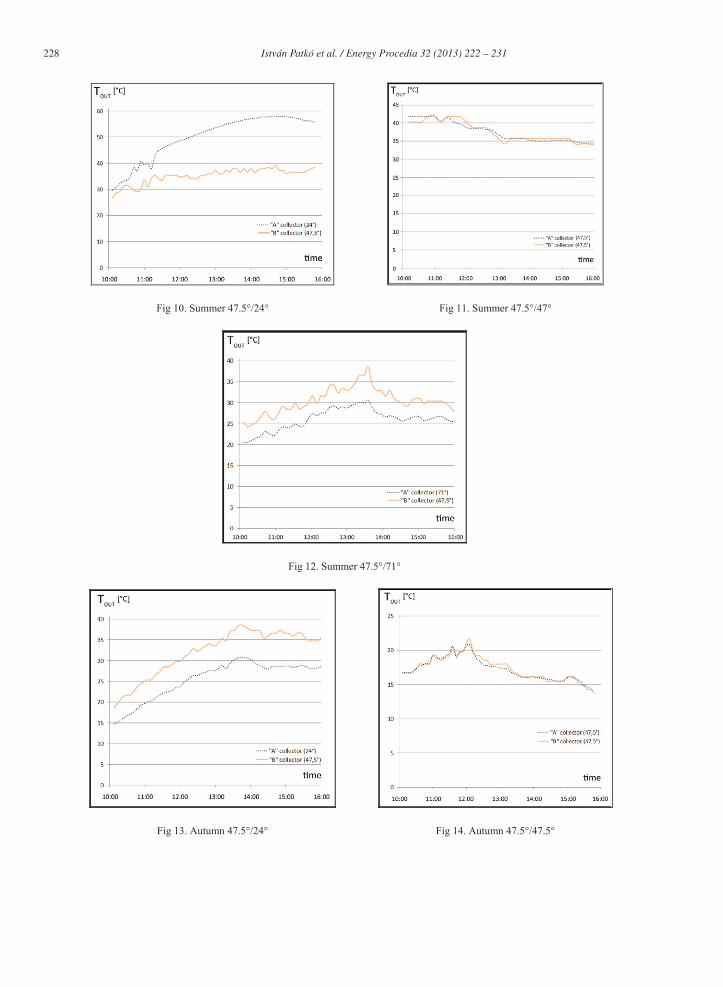
As a result when evaluating the measurement results it is sufficient to compare the temperatures of the medium leaving the sun collectors (ToutA, ToutB). ToutA, TinA are the temperatures of the medium exiting collector A, and ToutB, TinB are the temperature of the medium exiting collector B. We made conclusions by comparing the exit temperatures. The computer system recorded all the measurement results in diagrams and tables. Figure 10- Figure 18 show the – typical – results of the measurements made in the different seasons in diagrams. The exit temperatures of the sun collectors (ToutA, ToutB i.e. Tout) are plotted as the vertical axis, and the measurement time of the measurement results recorded on the measurement day is plotted as the horizontal axis. The descriptions of the diagrams contain the tested tilt angles of the two collectors as: B/ A.
2.3. Evaluation of measurement results
According to the previous chapters the value of entry temperatures of both sun collectors and the value of mass flows of the medium flowing through the collectors were the same during the measurements. In such cases if we want to compare the power of the collectors (PA, PB), it is sufficient to compare the temperatures of the medium leaving the sun collector (ToutA, ToutB) and after this, approximately:
outB
outA
B
A
TT
PP
(1)
For each of Figure 10 - Figure 18 we determined the average values of the relation of the exit temperatures (RTA/TB) with the relevant deviations. The relation of averages were determined with the below equation:
[%]1001
xn
TT
R
n
i Bi
Ai
TT BA (2)
where TA=ToutA, TB=ToutB. If the above described conditions exist, the power relation (RPA/PB) of the two tested collectors should –
approximately - equal the relations of the exit temperatures of the collectors, that is:
TBTAPBPA RR (3)
The determined power relations, tilt angle A of collector A (with modified tilt angle) and the deviation of the calculated temperature relations – according to the seasons – were given in Table 1.-Table 3.
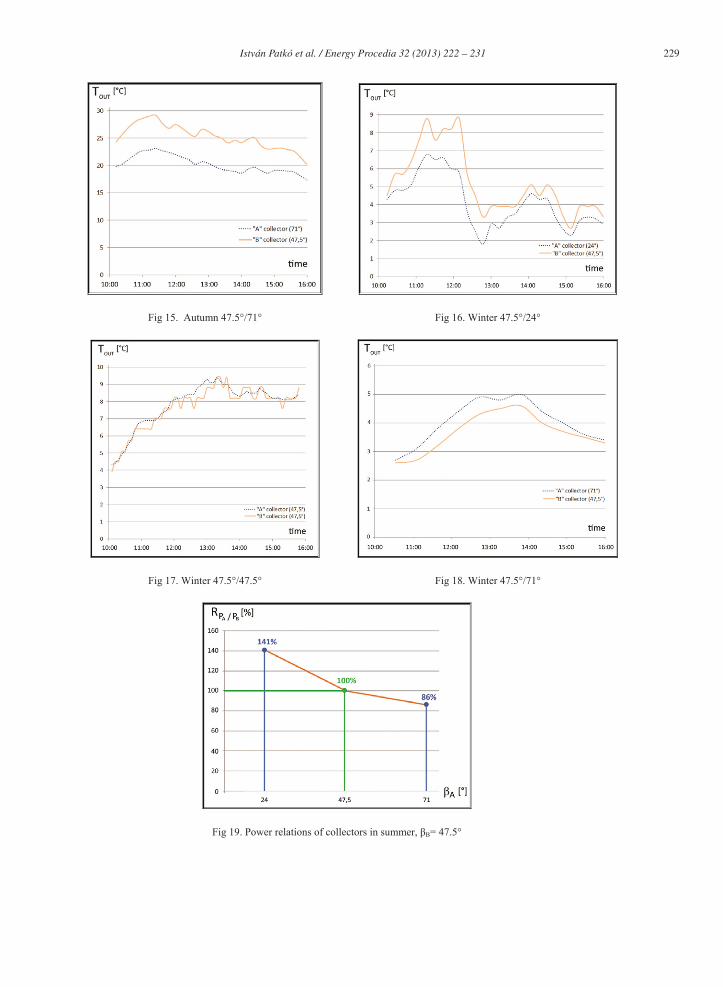
Figure 19 – Figure 21 were plotted from Figure 10 – Figure 18 and Table 1 – Table 3. These diagrams shows – approximately – the R PA/ PB change of the power relation of collectors A and B at angles A and
B=47.5°=constant value per season.
228 István Patkó et al. / Energy Procedia 32 ( 2013 ) 222 – 231
Fig 10. Summer 47.5°/24° Fig 11. Summer 47.5°/47°
Fig 12. Summer 47.5°/71°
Fig 13. Autumn 47.5°/24° Fig 14. Autumn 47.5°/47.5°
István Patkó et al. / Energy Procedia 32 ( 2013 ) 222 – 231 229
Fig 15. Autumn 47.5°/71° Fig 16. Winter 47.5°/24°
Fig 17. Winter 47.5°/47.5° Fig 18. Winter 47.5°/71°
Fig 19. Power relations of collectors in summer, B= 47.5°
230 István Patkó et al. / Energy Procedia 32 ( 2013 ) 222 – 231
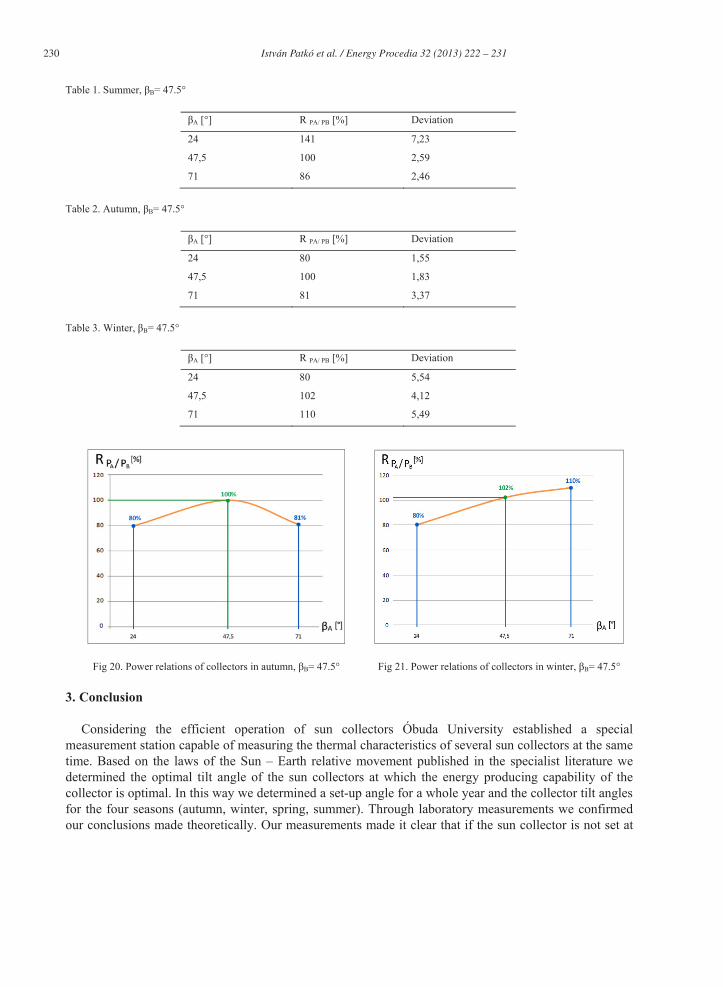
Table 1. Summer, B= 47.5°
A [°] R PA/ PB [%] Deviation
24 141 7,23
47,5 100 2,59
71 86 2,46
Table 2. Autumn, B= 47.5°
A [°] R PA/ PB [%] Deviation
24 80 1,55
47,5 100 1,83
71 81 3,37
Table 3. Winter, B= 47.5°
A [°] R PA/ PB [%] Deviation
24 80 5,54
47,5 102 4,12
71 110 5,49
Fig 20. Power relations of collectors in autumn, B= 47.5° Fig 21. Power relations of collectors in winter, B= 47.5°
3. Conclusion
Considering the efficient operation of sun collectors Óbuda University established a special measurement station capable of measuring the thermal characteristics of several sun collectors at the same time. Based on the laws of the Sun – Earth relative movement published in the specialist literature we determined the optimal tilt angle of the sun collectors at which the energy producing capability of the collector is optimal. In this way we determined a set-up angle for a whole year and the collector tilt angles for the four seasons (autumn, winter, spring, summer). Through laboratory measurements we confirmed our conclusions made theoretically. Our measurements made it clear that if the sun collector is not set at
István Patkó et al. / Energy Procedia 32 ( 2013 ) 222 – 231 231
the right angle, the power of collector falls by up to 10-20%. Figure 19 – Figure 21 graphically depict this decrease in power due to improper tilt angles. If the tilt angle of the sun collector is not modified during the year, the power of the collector in summer – when the possibility of energy transformation is the best – is up to 20-30% less than the optimal value. In spring and autumn the operation and energy producing capability of the sun collector is optimal at this tilt angle ( = = 47.5°).
For the measurements we used a special sun collector developed by we, whose construction cost is lower compared to the commercial sun collectors available in Hungary. In the future we find it necessary to repeat our measurements under more precise circumstances, with more tilt angles and at least four collectors in parallel. We hope that those results will give us more accurate information how to modify the tilt angles of sun collectors.
References
[1] Dickinson W, Cheremisinooff P. Solar Energy Technology Handbook. New York: Marcel Dekker; 1980. [2] Duffie J, Beckman W. Solar Energy Thermal Processes. California: Wiley; 1980. [3] Veneruso A. F. Tracking Angles and Rates for Single Degree of Freedom Solar Collectors. Albuquerque, Sandia Labs: 1976. [4] Patkó I. Integrating renewable energies into the national energy system with special regard to the thermal utilization of solar
energy. In Conference of the Hungarian Technical Experts. 2010. [5] ESTI F. (2012). Statistical Report. Available: www.estif.org/statistics/st_markets_in_europe_2011. [6] Patkó I. Environmental Technology I. University book. Budapest: BMF Publishing Inc; 2004. [7] Patkó I. Renewable energies. University book. Budapest: BMF Publishing Inc; 2009. [8] Barótfi I. Environmental technology. Budapest: Mezögazda Publishing Inc; 2006. [9] Pikó I. Thesis of University Degree. Obuda University: Budapest; 2011. [10] The American Ephemeris and Nautical Almanac for the year 1978. Washington, D.C.: U.S. Government Printing Office;
1979. [11] Hand I.F. Charts to Obtain Solar Altitudes and Azimuths. Heating and Ventilating, October 1978; 86-88. [12] D.O.E. Facilities Solar Design Handbook, U.S. Department of Energy report DOE /AD-0006/1, 1978. [13] G. O. G. Lof, Systems for Space Heating with Solar Energy, Chapter XII. in R. C. Jordan and B. Y. H. Liu, eds.,
Applications of Solar Energy for Heating and Cooling of Buildings, ASHRAE GRP 170; 1977.