evaluation of the initiative to reduce avoidable ... · avoidable hospitalizations among nursing...
TRANSCRIPT

September 2017
Evaluation of the Initiative to Reduce Avoidable Hospitalizations among
Nursing Facility Residents: Final Report
Prepared for
Jean Gaines, PhD, RN Center for Medicare and Medicaid Innovation
Centers for Medicare & Medicaid Services Mail Stop WB-06-05
7500 Security Boulevard Baltimore, MD 21244-1850
Submitted by
RTI International 307 Waverley Oaks Road, Suite 101
Waltham, MA 02452-8403
RTI Project Number 0212790.006.004.012

_________________________________ RTI International is a registered trademark and a trade name of Research Triangle Institute.
EVALUATION OF THE INITIATIVE TO REDUCE AVOIDABLE HOSPITALIZATIONS AMONG NURSING FACILITY RESIDENTS:
FINAL REPORT
by
RTI International Melvin J. Ingber, PhD Zhanlian Feng, PhD
Galina Khatutsky, MS Robert Baker, BA
Lawren Bercaw, PhD Nicole Coomer, PhD
Laurie Coots, MS, MA Jonathan DiBello, BS Terry Eng, PhD, RN Abigail Ferrell, BA
Caroline B. Husick, MPH Jessica M. Jones, BA E. Nilay Kafali, PhD
Yevgeniya Kaganova, PhD Molly Knowles, MPP
Brieanne Lyda-McDonald, MS Catherine Ormond, MS Kristie A. Porter, MPH
Jean Robinson, MS Christopher Saur, BS Micah Segelman, PhD
Anushi Shah, MPH Trini Thach, BS
Alison Vadnais, MHS Emily Vreeland, MSPH
Helen G. Walsh, BA Joyce M. Wang, MPH
Samantha Zepeda, BA, BS Nan Tracy Zheng, PhD
University of Pennsylvania
Mary Naylor, PhD, RN
Patti Zoromski, RN, BSN, MBA
Contracting Officer Representative: Jean Gaines, PhD, RN

RTI International
CMS Contract No. HHSM-500-2010-00021I (HHSM-500-T0006)
September 2017
This project was funded by the Centers for Medicare & Medicaid Services under contract no. HHSM-500-2010-00021I. The statements contained in this report are solely those of the authors and do not necessarily reflect the views or policies of the Centers for Medicare & Medicaid Services. RTI assumes responsibility for the accuracy and completeness of the information contained in this report.

ACKNOWLEDGMENTS
The authors gratefully acknowledge the support and contributions of the following people, who worked on the project in the past 5 years: William Bayliss, Burcu Bozkurt, Nathaniel Breg, Audrey Etlinger, Nikki Freeman, Christopher Goodrich, Jan Maier, Joshua Manning, Karen Reilly, Laura Smith, and Venkat Yetukuri. They also thank their consultants on this project—David Grabowski, from Harvard Medical School; Mary D. Naylor, from the University of Pennsylvania; Ann Spenard, from Qualidigm; and Debra Saliba, from RAND Corporation—for their advice and contributions. We also gratefully acknowledge Michelle Back, Kara O’Halloran, Terry Hall, Debbie Bond, Roxanne Snaauw, and Vivien Arnold for editing, document preparation, and graphics.

v
CONTENTS
Executive Summary ...................................................................................................................ES-1 Section 1 Overview ..........................................................................................................................1
1.1 Initiative to Reduce Avoidable Hospitalizations among Nursing Facility Residents ........................................................................................................................1
1.2 Overview of Evaluation .................................................................................................3 1.3 Technical Approach to Final Evaluation .......................................................................4 1.4 Organization of Final Report .......................................................................................11
Section 2 Initiative Implementation Across All ECCPs ................................................................13 2.1 Overview of the ECCP Models....................................................................................13 2.2 ECCP Administration and Management ......................................................................18 2.3 Advanced Practice Registered Nurse and Registered Nurse Involvement ..................19 2.4 Documenting Change of Condition in Residents and Improving
Communication Across Providers ...............................................................................27 2.5 Education and Training ................................................................................................32 2.6 End-of-Life Care ..........................................................................................................35 2.7 Quality Improvement ...................................................................................................39 2.8 Medication Review and Management..........................................................................41 2.9 Care Transitions ...........................................................................................................45 2.10 IT, Telemedicine, and Other Technology Components of the Initiative .....................48 2.11 Spillover and Contamination .......................................................................................52 2.12 Learning Community ...................................................................................................56
Section 3 State-Specific Analysis ..................................................................................................59 3.1 Alabama ......................................................................................................................63
3.1.1 Alabama Quality Assurance Foundation (AQAF) ...........................................63
3.1.2 Utilization, Expenditure, and Quality ..............................................................64
3.1.3 Implementation ................................................................................................75
3.1.4 Summary ..........................................................................................................79 3.2 Indiana..........................................................................................................................81
3.2.1 Indiana University’s Optimizing Patient Transfers, Impacting Medical quality, and Improving Symptoms: Transforming Institutional Care (OPTIMISTIC).................................................................................................81
3.2.2 Utilization, Expenditure, and Quality ..............................................................83
3.2.3 Implementation ................................................................................................91
3.2.4 Summary ..........................................................................................................96 3.3 Missouri .......................................................................................................................98
3.3.1 University of Missouri, Sinclair School of Nursing Missouri Quality Initiative for Nursing Homes (MOQI) .............................................................98
3.3.2 Utilization, Expenditure, and Quality ............................................................100
3.3.3 Implementation ..............................................................................................113
3.3.4 Summary ........................................................................................................119

vi
3.4 Nebraska.....................................................................................................................121
3.4.1 Nebraska Alegent ...........................................................................................121
3.4.2 Utilization, Expenditure, and Quality ............................................................123
3.4.3 Implementation ..............................................................................................136
3.4.4 Summary ........................................................................................................141 3.5 Nevada .......................................................................................................................143
3.5.1 HealthInsight Nevada Admissions and Transitions Optimization Program (ATOP) ............................................................................................143
3.5.2 Utilization, Expenditure, and Quality ............................................................145
3.5.3 Implementation ..............................................................................................158
3.5.4 Summary ........................................................................................................163 3.6 New York ...................................................................................................................166
3.6.1 New York-Reducing Avoidable Hospitalizations (NY-RAH) Project of the Greater New York Hospital Association Foundation ..............................166
3.6.2 Utilization, Expenditure, and Quality ............................................................168
3.6.3 Implementation ..............................................................................................176
3.6.4 Summary ........................................................................................................182 3.7 Pennsylvania ..............................................................................................................184
3.7.1 The University of Pittsburgh Medical Center (UPMC) Community Provider Services Program to Reduce Avoidable hospitalizations using Evidence-based interventions for Nursing facilities (RAVEN).....................184
3.7.2 Utilization, Expenditure, and Quality ............................................................186
3.7.3 Implementation ..............................................................................................197
3.7.4 Summary ........................................................................................................204 Section 4 Initiative-Wide Analysis Combining All States...........................................................207 Section 5 Aggregate Estimates of the Initiative’s Impact on Medicare Expenditures.................211 Section 6 Discussion ....................................................................................................................223
6.1 Initiative-Wide Impact of ECCP Interventions..........................................................223 6.2 Variations in Intervention Effects Across ECCPs and Across Measures ..................224 6.3 Variations in and Limitations of ECCP Effects Over Time.......................................234 6.4 ECCP Effects on Quality ...........................................................................................235 6.5 Implementation of the Initiative: Successes, Barriers, and Lessons Learned ............236
References ....................................................................................................................................239

vii
List of Figures
ES-1 Theory of action for ECCP models ............................................................................... ES-2 ES-2 ECCP effect on probability of having any hospitalization per resident per year
during intervention period, 2014–2016 ES-4 ......................................................................... ES-3 ECCP effect on probability of having any potentially avoidable hospitalization per
resident per year during intervention period, 2014–2016 ............................................. ES-5 1-1 ECCP location and number of participating facilities (as of September 2016) .................. 2 2-1 Theory of action for ECCP models ................................................................................... 15 2-2 Facility engagement with ECCP nurses, 2016 .................................................................. 27 2-3 Facility engagement with forms to standardize communication between nurses and
physicians, 2016 ................................................................................................................ 30 2-4 Facility engagement with Stop and Watch and other tools to document changes in
residents’ conditions, 2016 ............................................................................................... 31 2-5 Facility engagement with ECCP education and training, 2016 ........................................ 34 2-6 Facility engagement with end-of-life care planning, 2016 ............................................... 36 2-7 Facility engagement with QI/QAPI/RCA, 2016 ............................................................... 41 2-8 Facility engagement with medication management interventions, 2016 .......................... 44 2-9 Facility engagement with care transition interventions and communication during
transfers, 2016 ................................................................................................................... 46 3-1 ECCP effect on probability of any utilization per resident per year, Alabama ................ 67 3-2 ECCP effect on Medicare expenditures per resident per year, Alabama .......................... 70 3-3 RTI Nursing Facility Survey results, 2013–2016 ............................................................. 76 3-4 ECCP effect on probability of any utilization per resident per year, Indiana ................... 86 3-5 ECCP effect on Medicare expenditures per resident per year, Indiana ............................ 89 3-6 RTI Nursing Facility Survey results, 2013–2016 ............................................................. 92 3-7 ECCP effect on probability of any utilization per resident per year, Missouri............... 104 3-8 ECCP effect on Medicare expenditures per resident per year, Missouri ........................ 107 3-9 RTI Nursing Facility Survey results, 2013–2016 ........................................................... 115 3-10 ECCP effect on probability of any utilization per resident per year, Nebraska .............. 126 3-11 ECCP effect on Medicare expenditures per resident per year, Nebraska ....................... 129 3-12 RTI Nursing Facility Survey results, 2013–2016 ........................................................... 137 3-13 ECCP effect on probability of any utilization per resident per year, Nevada................. 148 3-14 ECCP effect on Medicare expenditures per resident per year, Nevada .......................... 151 3-15 RTI Nursing Facility Survey results, 2013–2016 ........................................................... 160 3-16 ECCP effect on probability of any utilization per resident per year, New York ............ 171 3-17 ECCP effect on Medicare expenditures per resident per year, New York ..................... 174 3-18 RTI Nursing Facility Survey results 2013–2016 ............................................................ 178 3-19 ECCP effect on probability of any utilization per resident per year, Pennsylvania........ 189 3-20 ECCP effect on Medicare expenditures per resident per year, Pennsylvania ................. 192 3-21 RTI Nursing Facility Survey results, 2013–2016 ........................................................... 200 6-1 ECCP effect on probability of having any hospitalization per resident per year
during intervention period, 2014–2016 226 ...........................................................................

viii
6-2 ECCP effect on probability of having any potentially avoidable hospitalization per resident per year during intervention period, 2014–2016 ............................................... 227
6-3 ECCP effect on probability of having any ED visit per resident per year during intervention period, 2014–2016 ...................................................................................... 228
6-4 ECCP effect on probability of having any potentially avoidable ED visit per resident per year during intervention period, 2014–2016 ............................................... 229
6-5 ECCP effect on total Medicare expenditures per resident per year during intervention period, 2014–2016 ...................................................................................... 230
6-6 ECCP effect on Medicare expenditures for all-cause hospitalizations per resident per year during intervention period, 2014–2016 231 .............................................................
6-7 ECCP effect on Medicare expenditures for potentially avoidable hospitalizations per resident per year during intervention period, 2014–2016 ......................................... 232
6-8 ECCP effect on Medicare expenditures for all-cause ED visits per resident per year during intervention period, 2014–2016 233 ...........................................................................
6-9 ECCP effect on Medicare expenditures for potentially avoidable ED visits per resident per year during intervention period, 2014–2016 ............................................... 234

ix
List of Tables
ES-1 ECCPs participating in the Initiative ............................................................................ ES-1 ES-2 Probability of any (greater than $0) overall savings or reductions in Medicare
spending: Initiative-wide intervention effect during the intervention period, 2014-2016, all seven states combined .................................................................................... ES-6
ES-3 Total Medicare expenditures: by state and Initiative-wide total estimates of intervention-associated reduction/increase, 2014–2016 (Reductions in spending are indicated by negative quantities in parentheses) ........................................................... ES-7
ES-4 Summary of Initiative effects during the intervention period, 2014–2016, on Medicare utilization and expenditure............................................................................ ES-9
1-1 Measures of service utilization, expenditure, and quality................................................... 6 1-2 Types of Initiative effects presented in this report.............................................................. 9 2-1 Key ECCP model features as of 2016............................................................................... 14 2-2 State policies affecting NPs’ scope of practice in the Initiative states.............................. 22 2-3 Full-Time Equivalent APRN and RN assignments in participating facilities, 2016 ........ 23 2-4 ECCP training topics......................................................................................................... 33 2-5 Policies or practices implemented to reduce avoidable hospitalizations of long-stay
residents that were unrelated to the Initiative ................................................................... 55 3-1 AQAF model description .................................................................................................. 63 3-2 ECCP effect on probability of any utilization per resident per year during
intervention period, 2014–2016, Alabama........................................................................ 66 3-3 ECCP effect on probability of any utilization per resident, 2016, Alabama .................... 67 3-4 ECCP effect on count of utilization per resident per year during intervention period,
2014–2016, Alabama ........................................................................................................ 68 3-5 ECCP effect on count of utilization per resident, 2016, Alabama .................................... 68 3-6 ECCP effect on Medicare expenditures per resident per year during intervention
period, 2014–2016, Alabama ............................................................................................ 69 3-7 ECCP effect on Medicare expenditures per resident, 2016, Alabama .............................. 69 3-8 Medicaid and Medicare expenditures (in dollars) per beneficiary per month,
Medicare-Medicaid dually eligible and Medicaid-only residents: Means (standard deviations), Alabama, 2011 .............................................................................................. 71
3-9 Medicaid and Medicare expenditures (in dollars) per beneficiary per month, Medicare-Medicaid dually eligible and Medicaid-only residents: Means (standard deviations), Alabama, 2012 .............................................................................................. 72
3-10 Medicaid and Medicare expenditures (in dollars) per beneficiary per month, Medicare-Medicaid dually eligible and Medicaid-only residents: Means (standard deviations), Alabama, 2013 .............................................................................................. 73
3-11 ECCP effect on MDS-based quality measures (percent of observed quarters with event per resident per year) during intervention period, 2014–2016, Alabama ............... 74
3-12 ECCP effect on MDS-based quality measures (percent of observed quarters with event per resident per year), 2016, Alabama .................................................................... 74
3-13 Facility engagement with Initiative components, AQAF, 2016 ....................................... 77 3-14 OPTIMISTIC model description ...................................................................................... 81

x
3-15 ECCP effect on probability of any utilization per resident per year during intervention period, 2014–2016, Indiana .......................................................................... 85
3-16 ECCP effect on probability of any utilization per resident, 2016, Indiana ....................... 85 3-17 ECCP effect on count of utilization per resident per year during intervention period,
2014–2016, Indiana........................................................................................................... 87 3-18 ECCP effect on count of utilization per resident per year, 2016, Indiana ........................ 87 3-19 ECCP effect on Medicare expenditures per resident per year during intervention
period, 2014–2016, Indiana .............................................................................................. 88 3-20 ECCP effect on Medicare expenditures per resident, 2016, Indiana ................................ 88 3-21 ECCP effect on MDS-based quality measures (percent of observed quarters per
resident per year with event) during intervention period, 2014–2016, Indiana ................ 90 3-22 ECCP effect on MDS-based quality measures (percent of observed quarters per
resident with event), 2016, Indiana ................................................................................... 90 3-23 Facility engagement with Initiative components, OPTIMISTIC, 2016 ............................ 93 3-24 MOQI model description .................................................................................................. 98 3-25 ECCP effect on probability of any utilization per resident per year during
intervention period, 2014–2016, Missouri ...................................................................... 103 3-26 ECCP effect on probability of any utilization per resident per year, 2016, Missouri..... 103 3-27 ECCP effect on count of utilization per resident per year during intervention period,
2014–2016, Missouri ...................................................................................................... 105 3-28 ECCP effect on count of utilization per resident per year, 2016, Missouri .................... 105 3-29 ECCP effect on Medicare expenditures per resident per year during intervention
period, 2014–2016, Missouri .......................................................................................... 106 3-30 ECCP effect on Medicare expenditures per resident, 2016, Missouri ............................ 106 3-31 Medicaid and Medicare expenditures (in dollars) per beneficiary per month,
Medicare-Medicaid dually eligible and Medicaid-only residents: Means (standard deviations), Missouri, 2011 108 .............................................................................................
3-32 Medicaid and Medicare expenditures (in dollars) per beneficiary per month, Medicare-Medicaid dually eligible and Medicaid-only residents: Means (standard deviations), Missouri, 2012 109 .............................................................................................
3-33 Medicaid and Medicare expenditures (in dollars) per beneficiary per month, Medicare-Medicaid dually eligible and Medicaid-only Residents: Means (standard deviations), Missouri, 2013 110 .............................................................................................
3-34 Medicaid and Medicare expenditures (in dollars) per beneficiary per month, Medicare-Medicaid dually eligible and Medicaid-only residents: Means (standard deviations), Missouri, 2014 111 .............................................................................................
3-35 Medicaid and Medicare expenditures (in dollars) per beneficiary per month, Medicare-Medicaid dually eligible and Medicaid-only residents: Means (standard deviations), Missouri, 2015 112 .............................................................................................
3-36 ECCP effect on MDS-based quality measures (percent of observed quarters per resident per year with event) during intervention period, 2014–2016, Missouri............ 113
3-37 ECCP effect on MDS-based quality measures (percent of observed quarters per resident with event), 2016, Missouri............................................................................... 113
3-38 Facility engagement with Initiative components, MOQI, 2016...................................... 117 3-39 Alegent (Nebraska) model description ........................................................................... 121

xi
3-40 ECCP effect on probability of any utilization per resident per year during intervention period, 2014–2016, Nebraska ..................................................................... 125
3-41 ECCP effect on probability of any utilization per resident per year, 2016, Nebraska .... 125 3-42 ECCP effect on count of utilization per resident per year during intervention period,
2014–2016, Nebraska...................................................................................................... 127 3-43 ECCP effect on count of utilization per resident per year, 2016, Nebraska ................... 127 3-44 ECCP effect on Medicare expenditures per resident per year during intervention
period, 2014–2016, Nebraska ......................................................................................... 128 3-45 ECCP effect on Medicare expenditures per resident, 2016, Nebraska ........................... 128 3-46 Medicaid and Medicare expenditures (in dollars) per beneficiary per month,
Medicare-Medicaid dually eligible and Medicaid-only residents: Means (standard deviations), Nebraska, 2011 ............................................................................................ 130
3-47 Medicaid and Medicare expenditures (in dollars) per beneficiary per month, Medicare-Medicaid dually eligible and Medicaid-only residents: Means (standard deviations), Nebraska, 2012 ............................................................................................ 131
3-48 Medicaid and Medicare expenditures (in dollars) per beneficiary per month, Medicare-Medicaid dually eligible and Medicaid-only residents: Means (standard deviations), Nebraska, 2013 ............................................................................................ 132
3-49 Medicaid and Medicare expenditures (in dollars) per beneficiary per month, Medicare-Medicaid dually eligible and Medicaid-only residents: Means (standard deviations), Nebraska, 2014 ............................................................................................ 133
3-50 Medicaid and Medicare expenditures (in dollars) per beneficiary per month, Medicare-Medicaid dually eligible and Medicaid-only residents: Means (standard deviations), Nebraska, 2015 ............................................................................................ 134
3-51 ECCP effect on MDS-based quality measures (percent of observed quarters per resident per year with event) during intervention period 2014–2016, Nebraska ............ 135
3-52 ECCP effect on MDS-based quality measures (percent of observed quarters per resident with event), 2016, Nebraska .............................................................................. 135
3-53 Facility engagement with Initiative components, Alegent, 2016.................................... 138 3-54 ATOP model description ................................................................................................ 143 3-55 ECCP effect on probability of any utilization per resident per year during
intervention period, 2014–2016, Nevada ........................................................................ 147 3-56 ECCP effect on probability of any utilization per resident per year, 2016, Nevada....... 147 3-57 ECCP effect on count of utilization per resident per year during intervention period,
2014–2016, Nevada ........................................................................................................ 149 3-58 ECCP effect on count of utilization per resident per year, 2016, Nevada ...................... 149 3-59 ECCP effect on Medicare expenditures per resident per year during intervention
period, 2014–2016, Nevada ............................................................................................ 150 3-60 ECCP effect on Medicare expenditures per resident, 2016, Nevada .............................. 150 3-61 Medicaid and Medicare expenditures (in dollars) per beneficiary per month,
Medicare-Medicaid dually eligible and Medicaid-only residents: Means (standard deviations), Nevada, 2011 152 ...............................................................................................
3-62 Medicaid and Medicare expenditures (in dollars) per beneficiary per month, Medicare-Medicaid dually eligible and Medicaid-only residents: Means (standard deviations), Nevada, 2012 153 ...............................................................................................

xii
3-63 Medicaid and Medicare expenditures (in dollars) per beneficiary per month,Medicare-Medicaid dually eligible and Medicaid-only residents: Means (standard deviations), Nevada, 2013 154 ...............................................................................................
3-64 Medicaid and Medicare expenditures (in dollars) per beneficiary per month,Medicare-Medicaid dually eligible and Medicaid-only residents: Means (standard deviations), Nevada, 2014 155 ...............................................................................................
3-65 Medicaid and Medicare expenditures (in dollars) per beneficiary per month,Medicare-Medicaid dually eligible and Medicaid-only residents: Means (standard deviations), Nevada, 2015 156 ...............................................................................................
3-66 ECCP effect on MDS-based quality measures (percent of observed quarters perresident per year with event) during intervention period 2014–2016, Nevada............... 157
3-67 ECCP effect on MDS-based quality measures (percent of observed quarters perresident with event), 2016, Nevada................................................................................. 157
3-68 Facility engagement with Initiative components, ATOP, 2016 ...................................... 161 3-69 NY-RAH model description ........................................................................................... 166 3-70 ECCP effect on probability of any utilization per resident per year during
intervention period, 2014–2016, New York ................................................................... 170 3-71 ECCP effect on probability of any utilization per resident per year, 2016, New York .. 1703-72 ECCP effect on count of utilization per resident per year during intervention period,
2014–2016, New York .................................................................................................... 172 3-73 ECCP effect on count of utilization per resident per year, 2016, New York 172 .................. 3-74 ECCP effect on Medicare expenditures per resident per year during intervention
period, 2014–2016, New York........................................................................................ 173 3-75 ECCP effect on Medicare expenditures per resident, 2016, New York ......................... 173 3-76 ECCP effect on MDS-based quality measures (percent of observed quarters per
resident per year with event) during intervention period 2014–2016, New York .......... 175 3-77 ECCP effect on MDS-based quality measures (percent of observed quarters per
resident with event), 2016, New York ............................................................................ 175 3-78 Facility engagement with Initiative components, NY-RAH, 2016................................. 179 3-79 UPMC-RAVEN model description ................................................................................ 184 3-80 ECCP effect on probability of any utilization per resident per year during
intervention period, 2014–2016, Pennsylvania ............................................................... 188 3-81 ECCP effect on probability of any utilization per resident per year, 2016,
Pennsylvania ................................................................................................................... 189 3-82 ECCP effect on count of utilization per resident per year during intervention period,
2014–2016, Pennsylvania ............................................................................................... 190 3-83 ECCP effect on count of utilization per resident per year, 2016, Pennsylvania ............. 190 3-84 ECCP effect on Medicare expenditures per resident per year during intervention
period, 2014–2016, Pennsylvania ................................................................................... 191 3-85 ECCP effect on Medicare expenditures per resident, 2016, Pennsylvania ..................... 191 3-86 Medicaid and Medicare expenditures (in dollars) per beneficiary per month,
Medicare-Medicaid dually eligible and Medicaid-only residents: Means (standard deviations), Pennsylvania, 2011 193 ......................................................................................
3-87 Medicaid and Medicare expenditures (in dollars) per beneficiary per month,Medicare-Medicaid dually eligible and Medicaid-only residents: Means (standard deviations), Pennsylvania, 2012 194 ......................................................................................
xiii
3-88 Medicaid and Medicare expenditures (in dollars) per beneficiary per month, Medicare-Medicaid dually eligible and Medicaid-only residents: Means (standard deviations), Pennsylvania, 2013 195 ......................................................................................
3-89 Medicaid and Medicare expenditures (in dollars) per beneficiary per month, Medicare-Medicaid dually eligible and Medicaid-only residents: Means (standard deviations), Pennsylvania, 2014 196 ......................................................................................
3-90 ECCP effect on MDS-based quality measures (percent of observed quarters per resident per year with event) during intervention period, 2014–2016, Pennsylvania..... 197
3-91 ECCP effect on MDS-based quality measures (percent of observed quarters per resident with event), 2016, Pennsylvania........................................................................ 197
3-92 Facility engagement with Initiative components, UPMC-RAVEN, 2016 ...................... 201 4-1 Initiative-wide ECCP effect on probability of any utilization per resident per year
during intervention period, 2014-2016, all 7 states combined........................................ 208 4-2 Initiative-wide ECCP effect on count of utilization per resident per year during
intervention period, 2014-2016, all 7 states combined ................................................... 209 4-3 Initiative-wide ECCP effect on Medicare expenditures per resident per year during
intervention period, 2014-2016, all 7 states combined ................................................... 210 4-4 Initiative-wide ECCP effect on MDS-based quality measures (percent of observed
quarters with event per resident per year) during intervention period, 2014-2016, all 7 states combined ............................................................................................................ 210
5-1 Total Medicare expenditures: by state and Initiative-wide total estimates of
intervention-associated reduction/increase, 2014–2016 (Reductions in spending are indicated by negative quantities in parentheses) ............................................................. 213
5-2 Total Medicare expenditures: by state and Initiative-wide total estimates of intervention-associated reduction/increase, 2014 (Reductions in spending are indicated by negative quantities in parentheses) ............................................................. 214
5-3 Total Medicare expenditures: by state and Initiative-wide total estimates of intervention-associated reduction/increase, 2015 (Reductions in spending are indicated by negative quantities in parentheses) ............................................................. 215
5-4 Total Medicare expenditures: by state and Initiative-wide total estimates of intervention-associated reduction/increase, 2016 (Reductions in spending are indicated by negative quantities in parentheses) ............................................................. 216
5-5 Medicare expenditures for all-cause hospitalizations: By state and Initiative-wide total estimates of intervention-associated reduction/increase, 2014–2016 (Reductions in spending are indicated by negative quantities in parentheses) ............... 217
5-6 Medicare expenditures for potentially avoidable hospitalizations: By state and Initiative-wide total estimates of intervention-associated reduction/increase, 2014–2016 (Reductions in spending are indicated by negative quantities in parentheses) ...... 218
5-7 Medicare expenditures for all-cause ED visits: By state and Initiative-wide total estimates of intervention-associated reduction/increase, 2014–2016 (Reductions in spending are indicated by negative quantities in parentheses) ....................................... 219
5-8 Medicare expenditures for potentially avoidable ED visits: By state and Initiative-wide total estimates of intervention-associated reduction/increase, 2014–2016 (Reductions in spending are indicated by negative quantities in parentheses) ............... 220

xiv
5-9 Probability of any (greater than $0) overall savings or reductions in Medicarespending: Initiative-wide intervention effect during intervention period, 2014–2016, all 7 states combined ....................................................................................................... 221
6-1 Summary of Initiative effects during intervention period, 2014–2016, on Medicareutilization and expenditures ............................................................................................ 225

ES-1
EXECUTIVE SUMMARY
This final report details the evaluation findings for the Centers for Medicare & Medicaid Services (CMS) Initiative to Reduce Avoidable Hospitalizations among Nursing Facility (NF) Residents (hereafter referred to as the Initiative), which was designed to affect hospitalization rates among long-stay nursing facility residents by directly changing practices at the facility level. The Initiative was implemented from 2013–2016 by seven Enhanced Care and Coordination Provider (ECCP) organizations, selected by CMS from solicited applications. Each ECCP operated in one of seven states (Alabama, Indiana, Missouri, Nebraska, Nevada, New York, and Pennsylvania), and a total of 143 nursing facilities participated, each partnering with one ECCP. The ECCPs, named in Table ES-1, were created for the Initiative by a variety of organization types (see Sections 2 and 3 of the report for the details of individual ECCP models).
Table ES-1 ECCPs participating in the Initiative
State ECCP ECCP Full Name
Alabama AQAF Alabama Quality Assurance Foundation Indiana OPTIMISTIC Optimizing Patient Transfers, Impacting Medical Quality, and
Improving Symptoms: Transforming Institutional Care Missouri MOQI University of Missouri, Sinclair School of Nursing Missouri Quality
Initiative for Nursing Homes Nebraska Alegent Nebraska Catholic Health Initiatives/Alegent Creighton Health Nevada ATOP Admissions and Transitions Optimization Program New York NY-RAH New York Potentially Avoidable Hospitalizations Project of the
Greater New York Hospital Association Foundation Pennsylvania UPMC-RAVEN University of Pittsburgh Medical Center-Community Provider
Services Program to Reduce Avoidable hospitalizations using Evidence-based interventions for Nursing facilities
All ECCPs were required to employ registered nurses (RNs) or advanced practice registered nurses (APRNs), full or part time, to support partnering facilities. In five ECCPs, nurses provided clinical care to residents and education to facility staff. In two ECCPs, AQAF (Alabama) and NY-RAH (New York), the ECCP staff served as advisors who trained facility staff, reported facility data to participating facilities, and shared best practices without providing clinical care. Although CMS provided guidelines for intervention design and required key model elements, ECCPs had the flexibility to implement specific interventions. Key ECCP model features in the final year of the Initiative are summarized in Table 2-1. For a more detailed description of ECCP models, see Section 2.1, Overview of the ECCP Models.
ECCP Theory of Action. The theory of action for the ECCP models is depicted in Figure ES-1. ECCP nurses (APRNs, RNs, or both) support nursing facility staff by providing clinical care, education, or both and by introducing INTERACT (Interventions to Reduce Acute Care Transfers) tools, end-of-life care planning, medication management, and other ECCP-specific interventions. This additional support improves clinical care processes and information

ES-2
exchange, which results in more accurate identification of resident changes in condition and more timely communication with primary care providers and hospitals. Improved care processes and provider communication allow facilities to provide higher quality care to residents and avoid unnecessary hospitalizations, which improves residents’ quality of life and provides savings for Medicare.
Figure ES-1 Theory of action for ECCP models
Overview of Evaluation. RTI applied a mix of quantitative and qualitative methods to evaluate the seven ECCP interventions, which allowed us to link structural and process changes to outcomes. Quantitative methods were used to evaluate the impact of ECCP interventions on outcomes, using a propensity score–matched comparison group of non-ECCP facilities (except for Nevada where propensity matching was unfeasible) to determine the net effect of the interventions. RTI used multivariate analyses to evaluate key utilization, expenditure, and quality outcomes in a difference-in-differences regression model framework, as explained in Section 1.3. This method computes the changes from a pre-Initiative year to the Initiative years and the difference in those changes from the changes observed in the comparison group.
The qualitative design used data collected directly from the ECCPs and the participating facilities. Formal site visit protocols and telephone interviews were used to ensure standardized qualitative data were collected. Facility in-person and telephone interviews provided details about the extent to which facility staff and leadership were engaged in Initiative efforts and the degree to which facilities implemented and used Initiative components consistently in everyday practice. In addition, a survey of participating facilities was conducted annually to track facility administrators’ perceptions of Initiative progress, successes, and challenges; these findings were compared to a one-time survey of comparison group facilities. These data complement quantitative data analyses, providing critical context to interpret quantitative findings. In addition to informing quantitative data analyses, the qualitative data analyses provide a better understanding of the ECCPs and processes of implementing various models of the Initiative in participating facilities.

ES-3
Below we present major evaluation findings, first on the Initiative-wide impact (treating the Initiative in all seven states as a whole) and then the ECCP-specific impact within each state. Drawing on primary data collection and qualitative analysis results, we emphasize key successes, challenges, and barriers to implementation of the Initiative as well as lessons learned. Based on quantitative analysis results from multivariate regression models, we highlight the effects of the Initiative on Medicare utilization outcomes—the probability of a resident having any hospitalization, any potentially avoidable hospitalization, any outpatient emergency department (ED) visit, and any potentially avoidable outpatient ED visit—and Medicare expenditures, both total and by utilization category. The estimated effects on other types of outcomes, including utilization counts and minimum dataset (MDS)-based quality measures, are presented in Section 3 of this report. The evaluation was unable to determine the Initiative’s effect on Medicaid expenditures, due to Medicaid data challenges.
ES.1 Initiative-wide Results: Aggregate Estimates of the Initiative’s Impact on Utilization and Expenditures
Utilization. The estimated Initiative-wide intervention period (2014–2016) average annual effect was a statistically significant reduction of 2.6 percentage points in the probability of an all-cause hospitalization (Figure ES-2), which represents a relative reduction of 9.5 percent from the annual average rate of all-cause hospitalizations during the period. For the probability of a potentially avoidable hospitalization, the Initiative-wide average annual effect was a statistically significant reduction of 2.0 percentage points (Figure ES-3), or a relative reduction of 17.0 percent. For more details on the Initiative-wide effects on utilization, see Section 4 of the report.
Expenditure. For total Medicare expenditures, accounting for CMS grants given to the ECCPs, we estimated a 21 percent probability that the Initiative was cost-saving (Table ES-2). The estimated probability of any reduction in total Medicare expenditures from the trust funds, not accounting for CMS grants from the Center for Medicare and Medicaid Innovation funds, is about 92 percent. For Medicare expenditures on inpatient services, for both all-cause hospitalizations and potentially avoidable hospitalizations, we estimated that the probability of spending reductions, not accounting for the grants, was greater than 99 percent.

ES-4
Figure ES-2 ECCP effect on probability of having any hospitalization per resident per year during
intervention period, 2014–2016
NOTE: Dots indicate ECCP-specific effects separately estimated within each state; triangle indicates Initiative-wide effect estimated from a pooled analysis combining data from all states; horizontal bars are 90% confidence intervals. Detailed numbers underlying this figure are provided in Sections 3 and 4. ECCP = Enhanced Care and Coordination Provider. SOURCE: RTI analysis of Medicare claims data (RTI program ms06; annual_2016\ms01_xtgee).

ES-5
Figure ES-3 ECCP effect on probability of having any potentially avoidable hospitalization per resident
per year during intervention period, 2014–2016
NOTE: Dots indicate ECCP-specific effects separately estimated within each state; triangle indicates Initiative-wide effect estimated from a pooled analysis combining data from all states; horizontal bars are 90% confidence intervals. Detailed numbers underlying this figure are provided in Sections 3 and 4. ECCP = Enhanced Care and Coordination Provider. SOURCE: RTI analysis of Medicare claims data (RTI program ms06; annual_2016\ms01_xtgee).
ES-6
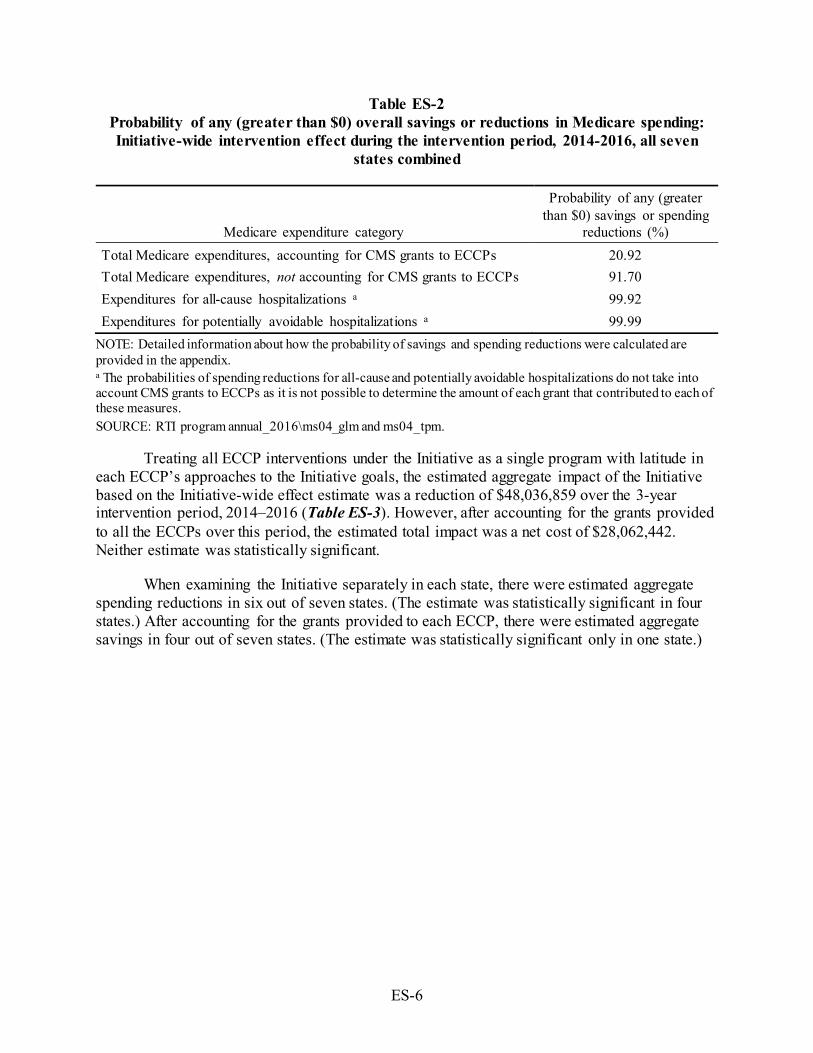
Table ES-2 Probability of any (greater than $0) overall savings or reductions in Medicare spending: Initiative-wide intervention effect during the intervention period, 2014-2016, all seven
states combined
Medicare expenditure category
Probability of any (greater than $0) savings or spending
reductions (%) Total Medicare expenditures, accounting for CMS grants to ECCPs 20.92 Total Medicare expenditures, not accounting for CMS grants to ECCPs 91.70 Expenditures for all-cause hospitalizations a 99.92 Expenditures for potentially avoidable hospitalizations a 99.99
NOTE: Detailed information about how the probability of savings and spending reductions were calculated are provided in the appendix. a The probabilities of spending reductions for all-cause and potentially avoidable hospitalizations do not take into account CMS grants to ECCPs as it is not possible to determine the amount of each grant that contributed to each of these measures. SOURCE: RTI program annual_2016\ms04_glm and ms04_tpm.
Treating all ECCP interventions under the Initiative as a single program with latitude in each ECCP’s approaches to the Initiative goals, the estimated aggregate impact of the Initiative based on the Initiative-wide effect estimate was a reduction of $48,036,859 over the 3-year intervention period, 2014–2016 (Table ES-3). However, after accounting for the grants provided to all the ECCPs over this period, the estimated total impact was a net cost of $28,062,442. Neither estimate was statistically significant.
When examining the Initiative separately in each state, there were estimated aggregate spending reductions in six out of seven states. (The estimate was statistically significant in four states.) After accounting for the grants provided to each ECCP, there were estimated aggregate savings in four out of seven states. (The estimate was statistically significant only in one state.)

ES-7.
Table ES-3 Total Medicare expenditures: by state and Initiative-wide total estimates of intervention-associated reduction/increase, 2014–
2016 (Reductions in spending are indicated by negative quantities in parentheses)
State
Number Participants Each Year, Summed,
2014–2016
Intervention Period Effect on Spending:
(Reduction)/Increase Per Participant Per Year
Total ECCP Effect on Spending: (Reduction)/Increase, 2014–2016 Total Grant
for Initiative, 2014–2016 $
Total Initiative Net (Savings)/Costs, 2014–2016 a
Estimate $ 90% CI 80% CI Estimate $
90% CI 80% CI Estimate $
90% CI 80% CI
AL 9,867 147 (1,286), 1,580 (970), 1,263
1,449,186 (12,686,579), 15,584,951 (9,567,258), 12,465,630
11,368,402 12,817,588 (1,318,177), 26,953,353 1,801,144, 23,834,032
IN 8,469 (1,589) (2,966), (211) (2,662), (515)
(13,456,242) (25,122,498), (1,789,985) (22,548,120), (4,364,363)
10,042,277 (3,413,965) (15,080,221), 8,252,292 (12,505,843), 5,677,914
MO 6,895 (1,241) (2,403), (79) (2,146), (335)
(8,555,233) (16,565,885), (544,581) (14,798,185), (2,312,281)
11,762,469 3,207,236 (4,803,416), 11,217,888 (3,035,716), 9,450,188
NE 3,976 (1,554) (3,495), 387 (3,066), (41)
(6,177,185) (13,894,632), 1,540,262 (12,191,633), (162,737)
3,454,775 (2,722,410) (10,439,857), 4,995,037 (8,736,858), 3,292,038
NV 9,911 (4,853) (8,096), (1,611) (7,380), (2,327)
(48,102,632) (80,238,518), (15,966,746) (73,147,134), (23,058,130)
10,201,107 (37,901,525) (70,037,411), (5,765,639) (62,946,027), (12,857,023)
NY 20,474 (556) (3,127), 2,014 (2,559), 1,447
(11,386,799) (64,016,935), 41,243,336 (52,403,111), 29,629,513
15,258,509 3,871,710 (48,758,426), 56,501,845 (37,144,602), 44,888,022
PA 7,723 (2,513) (3,929), (1,097) (3,617), (1,409)
(19,407,528) (30,345,287), (8,469,769) (27,931,666), (10,883,390)
14,011,762 (5,395,766) (16,333,525), 5,541,993 (13,919,904), 3,128,372
All b 67,315 (714) (1,561), 134 (1,374), (53)
(48,036,859) (105,081,386), 9,007,668 (92,493,445), (3,580,273)
76,099,301 28,062,442 (28,982,085), 85,106,969 (16,394,144), 72,519,028
NOTES: Bold numbers indicate statistical significance at the 0.10 level. Standard statistical practice is to use confidence intervals of 90% or higher; 80% confidence intervals are provided here for comparison purposes only. a Total Initiative Net (Savings)/Costs are the net balance between [Total ECCP Effect on Spending: (Reduction)/Increase] and [Total Grant for Initiative]. b Estimates are based on a pooled analysis, treating the Initiative in all seven states as a single intervention (see Section 4 for more detailed explanations). ECCP = Enhanced Care and Coordination Provider. SOURCE: RTI program annual_2016/ms04_glm.

ES-8
ES.2 State-Specific Findings
The ECCPs were given considerable latitude in implementing the Initiative. Thus, analyzing the processes and results in each state is warranted. Our quantitative analysis shows substantial variability in the effects of the Initiative on reducing utilization and expenditures both across the ECCPs and across measures, as summarized in Table ES-4. The Indiana, Missouri, and Pennsylvania ECCP models included consistent, hands-on clinical care for residents provided by full-time nurses on a daily basis, not just training for facility staff or intermittent visits with clinical care. These models demonstrated greater changes in facility culture, greater support for the need to reduce avoidable hospitalizations, and greater overall buy-in to the Initiative from facility staff, resulting in stronger intervention effects. The Alabama and New York ECCP models included full-time nurses at each facility but they did not provide direct clinical care; in Nebraska and Nevada, although ECCP nurses provided direct clinical care, they did so in a less consistent manner by rotating across multiple facilities. Accordingly, these models showed weaker and less consistent effects.

ES-9
Table ES-4 Summary of Initiative effects during the intervention period, 2014–2016, on
Medicare utilization and expenditure
Measures
ECCP Intervention Period Effect, 2014–2016 Full-time nurse at
each NF performing direct clinical care
Full-time nurse at each NF without
direct clinical care
Nurses rotate across multiple NFs performing
direct clinical care
IN MO PA AL NY NE NV*
Probability of at least one:
All-cause hospitalization ‒ ‒ ‒ ~ ‒ ~ ‒
Potentially avoidable hospitalization ‒ ‒ ~ ‒ ‒ ~ ~
All-cause ED visit ~ ‒ ~ ‒ ~ † † Potentially avoidable ED visit ~ ‒ ‒ ‒ ~ † †
Count of:
All-cause hospitalizations ‒ ‒ ‒ ~ ~ ~ ‒ Potentially avoidable hospitalizations ‒ ‒ ‒ ~ ‒ ~ ~
All-cause ED visits ~ ‒ ~ ‒ ~ † † Potentially avoidable ED visits ~ ‒ ‒ ‒ ~ † †
Medicare expenditures for:
Total ‒ ‒ ‒ † ~ ~ ‒
All-cause hospitalizations ‒ ‒ ‒ † ~ ‒ ‒ Potentially avoidable hospitalizations ‒ ‒ ‒ ~ ~ ~ ‒
All-cause ED visits ~ ‒ ‒ ‒ ~ ‡ ‡ Potentially avoidable ED visits ~ ‒ ‒ ‒ ~ † ‡
NOTE: ECCP = Enhanced Care and Coordination Provider; ED = Emergency Department. SOURCE: RTI analysis of Medicare claims data (RTI programs ms06, ms07, ms08, jw20; annual_2016). *Results for Nevada should be interpreted with caution due to limitations with the comparison group.
Legend: ‒ = Effect estimate is favorable (reduction in measure) and statistically significant (p < 0.10). ~ = Effect estimate is favorable (reduction in measure) but statistically insignificant (p ≥ 0.10). † = Effect estimate is unfavorable (increase in measure) but statistically insignificant (p ≥ 0.10). ‡ = Effect estimate is unfavorable (increase in measure) and statistically significant (p < 0.10).

ES-10
ES.2.1 Alabama Quality Assurance Foundation Nursing Facility Initiative (AQAF)
The goal of the AQAF model was to affect facility culture change through staff education with a focus on enhancing facility leadership, improving quality, and encouraging use of INTERACT tools to identify and respond to changes in resident condition.
ECCP Overview (See Section 3.1, Table 3-1 for a more complete model description)
ECCP Details INTERACT Tools Key Model Elements Organization type: QIO SBAR Advance directives Number of facilities: 23 Stop and Watch Facility staff end-of-life education ECCP RNs: 23 ECCP APRNs: 0 Transfer Form Quality improvement ECCP nurse in NF days per week: 5 QI tool Medication management/review Role of nurse: Education and training
No clinical care Care Paths ECCP-specific model elements:
Leadership training
Highlight of Key Findings (See Section 3.1 for a complete description and results for Alabama)
Implementation Key Successes • Increasing focus on facility quality improvement and QAPI efforts • Improving communication across staff levels • Changing facility culture toward treating residents in house Top Challenges • Frequent facility staff turnover • Frequent ECCP staff turnover and recruitment difficulties • Differences between facility culture and ECCP model
Lessons Learned • Initial facility leadership and corporate buy-in are critical for successful implementation • There must be a good fit with ECCP nurses and facility culture • Achieving facility culture change is a gradual process
Outcomes Utilization (2014–2016), probability of any: • All-cause hospitalization: nonsignificant reduction of 1.0 percentage point, a relative reduction of 3.2% • Potentially avoidable hospitalization: significant reduction of 1.5 percentage points, a relative reduction of
10.0% • All-cause ED visit: significant reduction of 4.6 percentage points, a relative reduction of 19.1% • Potentially avoidable ED visit: significant reduction of 2.3 percentage points, a relative reduction of 25.4% Medicare Expenditures (2014–2016), per resident per year: • Total for all Medicare services: nonsignificant increase of $147, a relative increase of 0.7% • Spending for all-cause hospitalizations: nonsignificant increase of $103, a relative increase of 2.5% • Spending for potentially avoidable hospitalizations: nonsignificant reduction of $61, a relative reduction of
4.7% • Spending for all-cause ED visits: significant reduction of $33, a relative reduction of 21.3% • Spending for potentially avoidable ED visits: significant reduction of $10, a relative reduction of 19.9%

ES-11
ES.2.2 Indiana University’s Optimizing Patient Transfers, Impacting Medical Quality, and Improving Symptoms: Transforming Institutional Care (OPTIMISTIC)
OPTIMISTIC model placed highly trained full-time registered nurses (RNs) in each of their 19 facilities to provide direct clinical support, education, and training to nursing facility staff to improve the quality of and access to (1) medical care, (2) transitional care, and (3) palliative care for eligible residents.
ECCP Overview (See Section 3.2, Table 3-14 for a more complete model description)
ECCP Details INTERACT Tools Key Model Elements Organization type: University research
program SBAR Advance directives
Number of facilities: 19 Stop and Watch Facility staff end-of-life education ECCP RNs: 17.5 ECCP APRNs: 6 Transfer Form Quality improvement ECCP nurse in NF days per week: 5 QI tool Medication management/review Role of nurse: Clinical care and
education Care Paths ECCP-specific model elements:
Collaborative Care Review
Highlight of Key Findings (See Section 3.2 for a complete description and results for Indiana)
Implementation Key Successes • Increasing staff knowledge and provider communication skills • Greater understanding of end-of-life issues by facility staff; completion of POST forms • Changing facility culture toward treating residents in house Top Challenges • Frequent facility staff turnover • Difficulties with ECCP APRN recruitment • Competing facility priorities different from ECCP model
Lessons Learned • Need for clearly defined roles, responsibilities, and expectations for ECCP nurses working in facilities • ECCP staff need skills in IT, data collection and analysis, communication, and organizational change • Interventions must be streamlined and affordable for the facility
Outcomes Utilization (2014–2016), probability of any: • All-cause hospitalization: significant reduction of 5.1 percentage points, a relative reduction of 19.3% • Potentially avoidable hospitalization: significant reduction of 3.9 percentage points, a relative reduction of
32.6% • All-cause ED visit: nonsignificant reduction of 0.8 percentage points, a relative reduction of 3.9% • Potentially avoidable ED visit: nonsignificant reduction of 1.2 percentage points, a relative reduction of
15.9% Medicare Expenditures (2014–2016), per resident per year: • Total for all Medicare services: significant reduction of $1,589, a relative reduction of 6.9% • Spending for all-cause hospitalizations: significant reduction of $888, a relative reduction of 21.6% • Spending for potentially avoidable hospitalizations: significant reduction of $314, a relative reduction of
24.9% • Spending for all-cause ED visits: nonsignificant reduction of $15, a relative reduction of 8.7% • Spending for potentially avoidable ED visits: nonsignificant reduction of $12, a relative reduction of 24.1%

ES-12
ES.2.3 University of Missouri, Sinclair School of Nursing Missouri Quality Initiative for Nursing Homes (MOQI)
MOQI model included full-time APRNs to provide patient assessment and clinical care (without writing orders) to residents while mentoring, role-modeling, and educating the nursing staff about early symptom/illness recognition, assessment, and management of health conditions commonly affecting residents. The role of the APRN also included support for staff in using INTERACT tools
to document changes in resident condition, advance directives, medication reduction, and QI activities. ECCP Overview (See Section 3.3, Table 3-24 for a more complete model description)
ECCP Details INTERACT Tools Key Model Elements Organization type: University research
program SBAR Advance directives
Number of facilities: 16 Stop and Watch Facility staff end-of-life education ECCP RNs: 0 ECCP APRNs: 17 Transfer Form Quality improvement ECCP nurse in NF days per week: 5 QI tool Medication management/review Role of nurse: Clinical care and
education; not authorized to write orders
Care Paths ECCP-specific model elements: E-tables, CareMail, Care View portal
Highlight of Key Findings (See Section 3.3 for a complete description and results for Missouri)
Implementation Key Successes • Changing facility culture toward treating residents in house • Increasing facility nurses' skills and capabilities • Increasing focus on end-of-life care planning
Top Challenges • Frequent facility staff turnover • Family demands for hospitalization • Challenges with HIT implementation and use • Difficulties with APRN recruitment and retention
Lessons Learned • APRNs must lead culture change • DON and NFA buy-in are key in Initiative success • Physician buy-in is essential for implementation
Outcomes Utilization (2014–2016), probability of any: • All-cause hospitalization: significant reduction of 7.9 percentage points, a relative reduction of 27.4% • Potentially avoidable hospitalization: significant reduction of 6.1 percentage points, a relative reduction of
45.3% • All-cause ED visit: significant reduction of 6.8 percentage points, a relative reduction of 32.1% • Potentially avoidable ED visit: significant reduction of 3.3 percentage points, a relative reduction of 43.9%
Medicare Expenditures (2014–2016), per resident per year: • Total for all Medicare services: significant reduction of $1,241, a relative reduction of 6.3% • Spending for all-cause hospitalizations: significant reduction of $1,153, a relative reduction of 28.6% • Spending for potentially avoidable hospitalizations: significant reduction of $514, a relative reduction of
40.2% • Spending for all-cause ED visits: significant reduction of $62, a relative reduction of 36.3% • Spending for potentially avoidable ED visits: significant reduction of $21, a relative reduction of 42.8%

ES-13
ES.2.4 Nebraska Catholic Health Initiatives/Alegent Creighton Health (Alegent)
Alegent model assigned six APRNs to several nursing facilities each, where they provided clinical services to residents including life issue reviews, medication review using the Long Term Care Medication Outcomes Manager (LTC-MOM) tool, history and physical assessment (H&P), and training in using INTERACT tools. In addition, dental hygienists employed by the ECCP also
provided dental care and education in participating facilities. ECCP Overview (See Section 3.4, Table 3-39 for a more complete model description)
ECCP Details INTERACT Tools Key Model Elements Organization type: Not-for-profit
health care system SBAR Advance directives
Number of facilities: 14 Stop and Watch Facility staff end-of-life education ECCP RNs: 0 ECCP APRNs: 6 Transfer Form Quality improvement ECCP nurse in NF days per week: 1-4 QI tool Medication management/review Role of nurse: Clinical care and
education; APRNs rotated in facilities
Care Paths ECCP-specific model elements: Dental care
Highlight of Key Findings (See Section 3.4 for a complete description and results for Nebraska)
Implementation Key Successes • Integrating APRNs within nursing facilities • Changing facility culture toward treating residents in house • Empowering facility nurses through mentorship and ad hoc coaching • Highlighting the benefits of APRNs to facilities and physicians Top Challenges • Frequent facility staff turnover • Limited ability to write orders for many participants because of physician resistance • Minimal investment and engagement in the Initiative by many facilities Lessons Learned • Establishing buy-in with physicians must be an early priority • ECCP must brand its activities within facilities • Formal education must be reinforced with individual coaching
Outcomes Utilization (2014–2016), probability of any: • All-cause hospitalization: nonsignificant reduction of 2.3 percentage point, a relative reduction of 8.6% • Potentially avoidable hospitalization: nonsignificant reduction of 1.8 percentage points, a relative reduction
of 15.4% • All-cause ED visit: nonsignificant increase of 1.3 percentage points, a relative increase of 5.3% • Potentially avoidable ED visit: nonsignificant increase of 0.7 percentage points, a relative increase of 8.6% Medicare Expenditures (2014–2016), per resident per year: • Total for all Medicare services: nonsignificant reduction of $1,554, a relative reduction of 7.7% • Spending for all-cause hospitalizations: significant reduction of $802, a relative reduction of 20.1% • Spending for potentially avoidable hospitalizations: nonsignificant reduction of $252, a relative reduction
of 20.8% • Spending for all-cause ED visits: significant increase of $69, a relative increase of 32.4% • Spending for potentially avoidable ED visits: nonsignificant increase of $29, a relative increase of 40.9%

ES-14
ES.2.5 HealthInsight Nevada Admissions and Transitions Optimization Program (ATOP)
The ATOP model utilized APRNs and RNs to provide clinical care and education, training by the ECCP and partners on a variety of topics, and support of INTERACT tool use, EOL care planning, and QI activities. ATOP nurses were assigned to groups of facilities, called pods, and divided their time across all facilities within a given pod.
ECCP Overview (See Section 3.5, Table 3-54 for a more complete model description)
ECCP Details INTERACT Tools Key Model Elements Organization type: QIO SBAR Advance directives Number of facilities: 24 Stop and Watch Facility staff end-of-life education ECCP RNs: 10.5 ECCP APRNs: 5 Transfer Form Quality improvement ECCP nurse in NF days per week: 1-4 QI tool Medication management/review Role of nurse: Clinical care and
education; nurses assigned to specific groups (pods) of facilities
Care Paths ECCP-specific model elements: Web registry with risk assessment and tools
Highlight of Key Findings (See Section 3.5 for a complete description and results for Nevada)
Implementation Key Successes • Facilities engaged in ATOP experienced improved focus on changes in condition and a culture change
toward treating residents in house
Top Challenges • Frequent ECCP staff turnover • Frequent facility staff turnover • Low physician engagement Lessons Learned • Physician engagement is essential to implementation success • ECCP nurse fit in each facility is key to integration • Achieving facility culture change is a gradual process, requiring time
Outcomes1 Utilization (2014–2016), probability of any: • All-cause hospitalization: significant reduction of 5.7 percentage points, a relative reduction of 20.0% • Potentially avoidable hospitalization: nonsignificant reduction of 2.0 percentage points, a relative reduction
of 18.2% • All-cause ED visit: nonsignificant increase of 0.8 percentage points, a relative increase of 3.8% • Potentially avoidable ED visit: nonsignificant increase of 1.0 percentage point, a relative increase of 12.7% Medicare Expenditures (2014–2016), per resident per year: • Total for all Medicare services: significant reduction of $4,853, a relative reduction of 20.8% • Spending for all-cause hospitalizations: significant reduction of $1,581, a relative reduction of 27.3% • Spending for potentially avoidable hospitalizations: significant reduction of $370, a relative reduction of
28.0% • Spending for all-cause ED visits: significant increase of $61, a relative increase of 25.7% • Spending for potentially avoidable ED visits: significant increase of $40, a relative increase of 56.9%
1 Note that the estimated effects of the Initiative in Nevada may be unreliable because the comparison group (all the nonparticipating facilities in the state) had fewer facilities than the ECCP group and was not propensity matched.

ES-15
ES.2.6 New York Reducing Avoidable Hospitalizations (NY-RAH) Project of the Greater New York Hospital Association Foundation
NY-RAH model used full-time RNs to deliver education and training to nursing home leadership and staff on the following topics: recognition of acute changes of condition (ACOCs), improving staff communication, QI, medication management, hospital communication, transitions in care, and advance care planning tools.
ECCP Overview (See Section 3.6, Table 3-69 for a more complete model description)
ECCP Details INTERACT Tools Key Model Elements Organization type: Hospital association
foundation SBAR Advance directives
Number of facilities: 29 Stop and Watch Facility staff end-of-life education ECCP RNs: 27 ECCP APRNs: 0 Transfer Form Quality improvement ECCP nurse in NF days per week: 5 QI tool Medication management/review Role of nurse: Education and training
No clinical care Care Paths ECCP-specific model elements:
Secure Direct Messaging
Highlight of Key Findings (See Section 3.6 for a complete description and results for New York)
Implementation Key Successes • Changing facility culture toward treating residents in house • Increasing focus on end-of-life care planning • Increasing focus on quality improvement Top Challenges • Low initial facility staff buy-in • Low buy-in and inconsistent use of Stop and Watch • Challenges with HIT implementation and use Lessons Learned • Must have a good fit between the ECCP nurse and facility culture and staff • Administrator, DON, and physician engagement are all essential to successful implementation • Multiple intervention components should be staggered, not implemented simultaneously • Achieving facility culture change is a gradual process that requires time Outcomes Utilization (2014–2016), probability of any: • All-cause hospitalization: significant reduction of 2.8 percentage points, a relative reduction of 10.0% • Potentially avoidable hospitalization: significant reduction of 1.3 percentage points, a relative reduction of
12.5% • All-cause ED visit: nonsignificant reduction of 0.8 percentage points, a relative reduction of 5.0% • Potentially avoidable ED visit: nonsignificant reduction of 0.8 percentage points, a relative reduction of
15.0% Medicare Expenditures (2014–2016), per resident per year: • Total for all Medicare services: nonsignificant reduction of $556, a relative reduction of 1.9% • Spending for all-cause hospitalizations: nonsignificant reduction of $614, a relative reduction of 7.3% • Spending for potentially avoidable hospitalizations: nonsignificant reduction of $245, a relative reduction
of 13.3% • Spending for all-cause ED visits: nonsignificant reduction of $11, a relative reduction of 8.7% • Spending for potentially avoidable ED visits: nonsignificant reduction of $4, a relative reduction of 9.8%

ES-16
ES.2.7 University of Pittsburgh Medical Center (UPMC) Community Provider Services Program to Reduce Avoidable hospitalizations using Evidence-based Interventions for Nursing facilities (RAVEN)
The UPMC-RAVEN model used full-time APRNs (with some RN support in large facilities) to provide clinical care and support facility staff with EOL care planning and QI activities. ECCP partners delivered medication review and education and training on INTERACT tools and other topics. Lead APRNs supported ECCP facility nurses. Telemedicine carts with Wi-Fi were used to provide after-hours APRN support to facility staff.
ECCP Overview (See Section 3.7, Table 3-79 for a more complete model description)
ECCP Details INTERACT Tools Key Model Elements Organization type: Not-for-profit
health care system SBAR Advance directives and family
counseling
Number of facilities: 18 Stop and Watch Facility staff end-of-life education ECCP RNs: 7 ECCP APRNs: 11 Transfer Form Quality improvement ECCP nurse in NF days per week: 5 QI tool Medication management/review Role of nurse: Clinical care and
education Care Paths ECCP-specific model elements:
Telemedicine
Highlight of Key Findings (See Section 3.7 for a complete description and results for Pennsylvania)
Implementation Key Successes • Changing facility culture toward treating residents in house • Empowering facility staff by improving skills and confidence • Hiring dedicated and effective ECCP staff • Providing strong organizational support for ECCP nurses Top Challenges • Frequent facility leadership and staff turnover • Facility remote location, lack of IT infrastructure and insufficient wi-fi for telemedicine • Difficulties with ECCP nurse retention and recruitment Lessons Learned • More and earlier efforts needed to ensure physician buy-in • Infrastructure assessment needed prior to implementing IT components • Effective interventions need 24/7 ECCP nurse support (in person and on call) Outcomes Utilization (2014–2016), probability of any: • All-cause hospitalization: significant reduction of 3.1 percentage points, a relative reduction of 12.6% • Potentially avoidable hospitalization: nonsignificant reduction of 2.1 percentage points, a relative reduction of
19.6% • All-cause ED visit: nonsignificant reduction of 1.0 percentage point, a relative reduction of 5.0% • Potentially avoidable ED visit: significant reduction of 2.0 percentage points, a relative reduction of 28.2% Medicare Expenditures (2014–2016), per resident per year: • Total for all Medicare services: significant reduction of $2,513, a relative reduction of 12.3% • Spending for all-cause hospitalizations: significant reduction of $1,070, a relative reduction of 27.6% • Spending for potentially avoidable hospitalizations: significant reduction of $377, a relative reduction of
35.3% • Spending for all-cause ED visits: significant reduction of $33, a relative reduction of 20.5% • Spending for potentially avoidable ED visits: significant reduction of $18, a relative reduction of 39.9%

ES-17
ES.3 Discussion
Initiative-Wide Impact of ECCP Interventions
The results of a pooled analysis, where interventions across all ECCPs were treated as one single intervention combining data from seven states, showed that implementation of the Initiative led to statistically significant reductions in 10 of the 13 Medicare utilization and expenditure measures evaluated for long-stay nursing facility residents participating in the Initiative during the intervention period, 2014–2016, relative to residents in the comparison group (see Section 4). These reductions were consistently demonstrated in both forms of the utilization measures—probabilities and counts of all-cause hospitalizations, potentially avoidable hospitalizations, all-cause emergency department (ED) visits, and potentially avoidable ED visits—and in Medicare expenditures for all-cause hospitalizations and for potentially avoidable hospitalizations. The effect estimates also point to reductions, although not statistically significant, in total Medicare spending and in spending on all-cause ED visits and potentially avoidable ED visits. Overall, these findings provide persuasive evidence of the Initiative’s effectiveness in reducing hospital inpatient admissions, ED visits, and hospitalization-related Medicare expenditures.
While the observed reductions in avoidable hospitalizations indicate improvements in that dimension of quality, the Minimum Data Set (MDS)-based quality measures do not show a clear pattern of change related to the Initiative over the intervention period. These measures, derived from the resident assessments, include, for example, rates of events such as having a catheter inserted and left in bladder, being physically restrained, having experienced one or more falls with injury, etc.
Analysis of the primary data collected for the evaluation highlighted several factors contributing to the perceived success of the Initiative among the participants. Ultimately, the overarching accomplishments of the Initiative hinge on the presence of the ECCP nurses who can provide an “extra set of hands” in facilities. Whether these nurses provide clinical care and education or education only, the facility interviewees generally were very positive about the role of the ECCP nurses and their ability to enhance the quality of care that facility residents receive. Feedback from most facilities indicated that staff and leadership felt the Initiative has had a beneficial effect on reducing avoidable hospitalizations. Interview data suggest there has been a generally positive reception to the Initiative across ECCPs, with facility staff and leadership expressing interest in sustaining many Initiative components as permanent facility functions. Major successes of the Initiative include facilitating a change in facility culture toward treating residents in house; empowering facility staff by improving their skills and capabilities, particularly communication skills; and increasing focus on end-of-life quality of care and planning.
KEY FINDINGS
• During the intervention period (2014–2016), the Initiative led to statistically significant reductions in 10 of the 13 Medicare utilization and expenditure measures for participating residents relative to residents in the comparison group.
• The effectiveness of the Initiative interventions was enhanced by the consistent presence of ECCP nurses who provided a knowledgeable extra set of hands in facilities, particularly when assisting with clinical care.
ES-18
Three key elements seemed to support successful implementation. First, a strong, positive relationship and a personality fit between the ECCP nurse and facility staff and leadership is critical for introducing culture change. Second, all ECCP interviewees agreed that physician buy-in is also essential to success and should be obtained as early in the Initiative as possible. Third, implementing an initiative of such scope requiring a shift in facility culture and adjustments to care processes takes significant amount of time and cannot be achieved quickly. Despite the Initiative achievements, ECCPs faced some challenges endemic to long-term care, such as high rates of facility staff and leadership turnover, as well as turnover among ECCP nurses. Initiative success was also often hindered when facility staff or leadership resisted aspects of the Initiative or seemed to have low engagement with certain Initiative components and goals. Additionally, implementation of IT components and tools was slow because of untrained staff and infrastructure limitations.
Interviewees across participating facilities indicated that this Initiative requires a shift in the facility culture to achieve both facility engagement with and use of Initiative components, and that this kind of process change takes time. Some ECCP leaders also indicated that more time would be needed to observe positive effects of the Initiative than the current 4-year time span. Particularly given the fact that ECCP nurses work for the ECCPs, not the facilities, transferring knowledge and skills to existing facility staff was said to be an ongoing challenge that required a substantial investment of time from both the ECCP and the facilities. Interviewees expressed enthusiasm for the opportunity to continue existing efforts through the Payment Reform Initiative, highlighting that additional time likely would produce more concrete findings to demonstrate potential connections between the Initiative and tangible reductions in use and cost of avoidable hospitalizations. The results also indicate that changing attitudes and processes produce more powerful effects when clinical staff with augmented skills are brought into the mix.
Variations in Intervention Effects Across ECCPs and Across Measures
Results from state-specific analyses reveal a great deal of unevenness in the strength of evidence of the Initiative’s impact across the ECCPs (Table ES-4). This would be expected, as the Initiative did vary in specific interventions and challenges across the ECCPs. Judged by the count of favorable (i.e., reductions in measures) and statistically significant effects across the 13 utilization and expenditure measures evaluated for each ECCP during the intervention period, 2014–2016, the ECCP in Missouri stands out as the strongest performer (with favorable and statistically significant effects on all 13 measures), followed by the ECCPs in Pennsylvania (10), Indiana (7), Alabama (7), Nevada (5), New York (3), and Nebraska (1). In Indiana and Pennsylvania, no unfavorable (i.e., increase in a measure) ECCP effect on any measure was observed. In Alabama, two unfavorable effects were observed (suggesting an increase in total Medicare spending and spending on all-cause hospitalizations), but neither of them was statistically significant. In New York, although the ECCP intervention was associated with statistically significant reductions in only three measures (probability of all-cause hospitalizations, probability of potentially avoidable hospitalizations, and count of potentially avoidable hospitalizations), findings showed favorable but statistically insignificant effects on the remaining 10 measures. In contrast, both Nebraska and Nevada showed the greatest number of unfavorable effects, suggesting an increase in 6 of the 13 measures (all pertaining to ED visits and related expenditures) in each state, and at least one of them was statistically significant. The

ES-19
observed increases in outpatient ED visits and related expenditures in Nebraska and Nevada should be viewed in the context of decreased hospitalizations and related expenditures, suggesting a possible substitution of outpatient ED visits for inpatient admissions. This pattern of observed effects is consistent with the combined evidence from quantitative and qualitative analyses suggesting that ECCP models in which nurses provided only education had smaller and less consistent effects, compared to models in which nurses provided regular full-time hands-on clinical care.
Variations in and Limitations of ECCP Effects Over Time
Within each state, a common pattern emerges from the yearly trends of ECCP effects: most grew larger from 2014–2015, and then either leveled off or somewhat weakened from 2015–2016. This trend was likely driven by the diversion of resources and staffing toward qualifying for and implementing the Payment Reform Initiative, which started in October 2016. Moreover, concurrent efforts unrelated to the Initiative but with a similar focus on reducing hospital admissions or readmissions have become widespread: RTI’s 2015 web-based survey indicates that 95 percent of responding comparison facilities introduced efforts to reduce avoidable hospitalizations of long-stay residents since January 2011. However, it is unlikely that the concurrent activities, implemented in the facilities without ECCP support and resources, would be as targeted and effective as the ECCP efforts. Additionally, it was not possible to rigorously separate the effects of specific components of ECCP models. Instead, we could only evaluate each model as a whole, looking for consistencies in characteristics of more successful implementations.
Conclusion
This summary provides major findings of the evaluation. The full report presents quantitative and qualitative findings in a more complete and nuanced way. A detailed understanding of the differences in the implemented form of the Initiative and the particular challenges in each of the sites, is an important link to interpreting the results.
This Initiative was implemented without any financial incentives to the participating facilities. The ECCPs were external agents trying to assist facilities that agreed to participate in activities that could reduce hospitalizations. The facilities were expected to allow and encourage staff to participate in new practices and in some cases to allow ECCP nurses to provide care. There was no payment for participating or success. ECCP models varied substantially and there was a great deal of unevenness in the strength of evidence of the Initiative’s impact across the ECCPs. The combined results from quantitative and qualitative analyses suggest that ECCP models in which nurses provided only education had smaller and less consistent effects, compared to models in which nurses provided regular hands-on clinical care. In Phase 2 of the Initiative, facilities will receive extra payment for treating six defined conditions in the facility rather than transferring residents. Practitioners will also receive extra payments to certify the eligibility of the residents. The Payment Reform is being tested along with continuing ECCP practices and as stand-alone incentives. The evaluation will examine both approaches.

ES-20
[This page intentionally left blank.]

1
SECTION 1 OVERVIEW
1.1 Initiative to Reduce Avoidable Hospitalizations among Nursing Facility Residents
This final report details the evaluation findings for the Centers for Medicare & Medicaid Services (CMS) Initiative to Reduce Avoidable Hospitalizations among Nursing Facility Residents (hereafter referred to as the Initiative), which was primarily designed to affect avoidable hospitalization rates among long-stay nursing facility residents by directly changing practices at the facility level. The Initiative tested a series of clinical interventions or care models, from 2013–2016, aimed at improving the health and health care of these residents, with the goals of reducing avoidable inpatient hospital admissions, improving care quality, and decreasing health care spending for the Medicare-Medicaid enrollees participating in the Initiative. By identifying the clinical intervention models that are the most promising, the Initiative sought to inform future policy development.
The Initiative involved seven Enhanced Care and Coordination Providers (ECCPs), created for the Initiative, each seeking to improve health quality with a focus on reducing avoidable hospitalizations. ECCPs applied to participate and those selected were to uniquely operate in one of seven states: Alabama, Indiana, Missouri, Nebraska, Nevada, New York, and Pennsylvania (Figure 1-1). Each ECCP developed unique models to support 15–30 participating nursing facilities within its respective state. These models included varying combinations of staff education, facility leadership and physician engagement, and/or clinical assessment and treatment of residents who experienced a change in condition. Whereas previously these changes in condition may have triggered an automatic hospital transfer, the Initiative sought to identify and treat residents whose conditions could be managed effectively within the nursing facility, rather than relying on hospital transfers for most or all changes in resident condition. The details of the ECCP models are described in Section 2.
The seven ECCPs implemented interventions with the following objectives:
• Reduce the frequency of avoidable hospital admissions and readmissions amonglong-stay nursing facility residents.
• Improve resident health outcomes.
• Improve transitions between inpatient hospitals and nursing facilities.
• Reduce overall health care spending without restricting access to care or choice ofproviders.
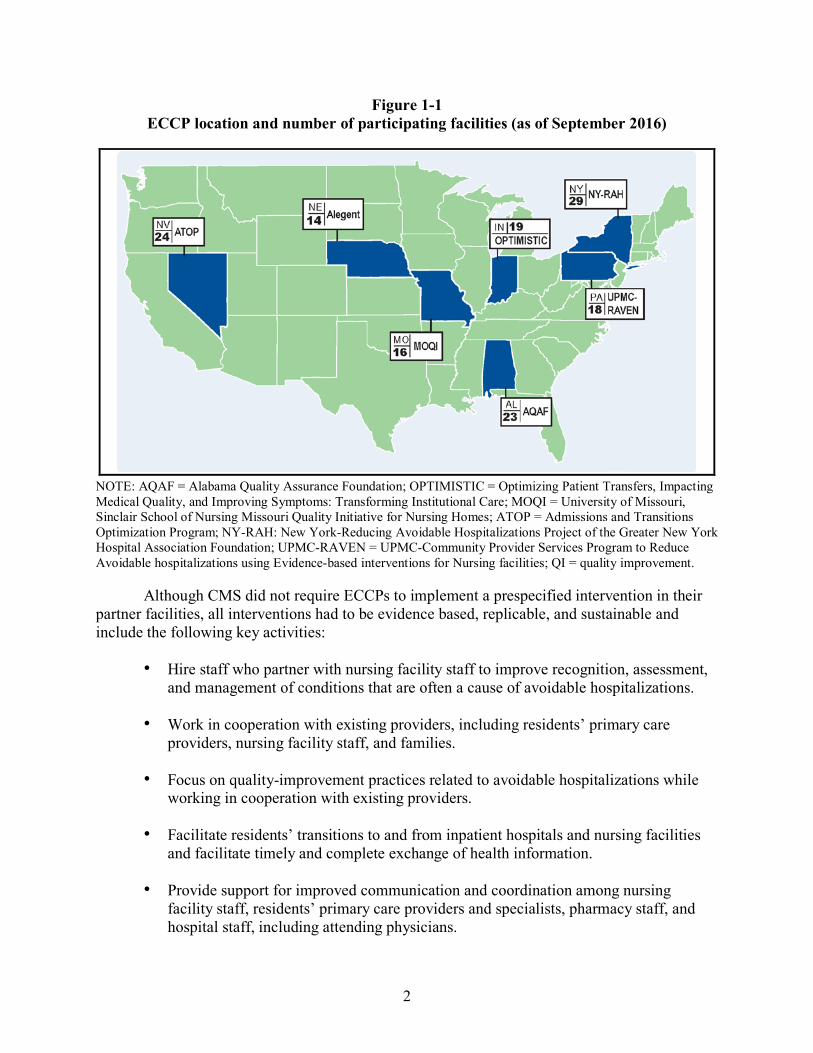
2
Figure 1-1 ECCP location and number of participating facilities (as of September 2016)
NOTE: AQAF = Alabama Quality Assurance Foundation; OPTIMISTIC = Optimizing Patient Transfers, Impacting Medical Quality, and Improving Symptoms: Transforming Institutional Care; MOQI = University of Missouri, Sinclair School of Nursing Missouri Quality Initiative for Nursing Homes; ATOP = Admissions and Transitions Optimization Program; NY-RAH: New York-Reducing Avoidable Hospitalizations Project of the Greater New York Hospital Association Foundation; UPMC-RAVEN = UPMC-Community Provider Services Program to Reduce Avoidable hospitalizations using Evidence-based interventions for Nursing facilities; QI = quality improvement.
Although CMS did not require ECCPs to implement a prespecified intervention in their partner facilities, all interventions had to be evidence based, replicable, and sustainable and include the following key activities:
• Hire staff who partner with nursing facility staff to improve recognition, assessment, and management of conditions that are often a cause of avoidable hospitalizations.
• Work in cooperation with existing providers, including residents’ primary care providers, nursing facility staff, and families.
• Focus on quality-improvement practices related to avoidable hospitalizations while working in cooperation with existing providers.
• Facilitate residents’ transitions to and from inpatient hospitals and nursing facilities and facilitate timely and complete exchange of health information.
• Provide support for improved communication and coordination among nursing facility staff, residents’ primary care providers and specialists, pharmacy staff, and hospital staff, including attending physicians.

3
• Coordinate and improve management and monitoring of prescription drugs to reduce polypharmacy, adverse drug events, and inappropriate use of psychotropic drugs.
1.2 Overview of Evaluation
RTI International partnered with two subcontractors—the RAND Corporation and Qualidigm—and two consultants—David Grabowski, PhD, and Mary Naylor, PhD—to conduct a formative evaluation of the Initiative to improve care for long-term residents in nursing facilities by reducing potentially avoidable hospitalizations. The evaluation was designed to evaluate the ECCP interventions as they unfolded and assessed both the effectiveness of the overall Initiative as well as components of each ECCP intervention. The evaluation aimed to assess both processes and outcomes, addressing the following key issues:
Processes
• What changes did the ECCP implement?
• How did CMS Learning Community activities to support ECCP success and other rapid-cycle activities affect what the nursing facilities and ECCPs did?
• What were the barriers and enablers associated with intervention implementation?
• Did the intervention improve transitions to and from hospitals?
• What were the unintended consequences associated with intervention implementation?
Outcomes
• Did the intervention affect rates of hospitalization, avoidable hospitalization, emergency department (ED) visits, avoidable ED visits, and observation stays among long-stay nursing facility residents?
• Did the intervention affect other aspects of quality of care, health outcomes, and functional status for long-stay nursing facility residents?
• Did the intervention reduce Medicare, Medicaid, and total combined Medicare-Medicaid costs?
RTI applied a mix of quantitative and qualitative methods to evaluate the seven ECCP interventions, which allowed us to link structural and process changes to outcomes.
Quantitative methods were used to evaluate the impact of ECCP interventions and components on outcomes, using a propensity score–matched comparison group of non-ECCP facilities to determine the net effect of the interventions. RTI used multivariate analyses to evaluate key quality, utilization, and expenditure outcome measures in a difference-in-differences regression model framework, as explained in Section 1.3. This method computes the

4
changes from a pre-Initiative year to the Initiative years that were different from the changes observed in the comparison group.
The qualitative design allowed data to be collected directly from the ECCPs and the participating facilities. Formal site visit protocols and telephone interviews were used to ensure standardized qualitative data were collected. Facility in-person and telephone interviews provided details about the extent to which facility staff and leadership were engaged in Initiative efforts and the degree to which facilities implemented and used Initiative components consistently in everyday practice. In addition, a survey of participating facilities was conducted annually to track facility administrators’ perceptions of Initiative progress, successes, and challenges; these findings were compared to a one-time survey of comparison group facilities. These data complement quantitative data analyses, providing critical context to interpret quantitative findings. In addition to informing quantitative data analyses, the qualitative data analyses provide a better understanding of the ECCPs and processes of implementing various models of the Initiative in participating facilities.
1.3 Technical Approach to Final Evaluation
The evaluation was designed to assess the effectiveness of ECCP interventions as they unfolded, measuring both processes and outcomes. The quantitative and qualitative methods employed to evaluate the seven ECCP interventions were designed to (1) capture each ECCP’s unique features and (2) develop an in-depth understanding of the transformations that may have occurred throughout the implementation of the Initiative. This approach allowed us to link structural and process changes to outcomes.
The principal desired outcome of the Initiative was the reduction of avoidable hospitalizations among long-stay residents. These admissions were identified by matching the principal diagnosis on acute hospital admissions to a list of conditions deemed potentially avoidable. RTI used the definition of potentially avoidable hospitalizations developed by Walsh et al. (2010, 2012) in their study of high-cost Medicare-Medicaid dually eligible populations. Since publication, a few conditions have been added or deleted based on subject matter expert input. The updated list of potentially avoidable hospitalization conditions reflect International Classification of Diseases, Tenth Revision (ICD-10), codes since October 2015 (available upon request).
Quantitative Methods. Quantitative methods were used to evaluate the impact of ECCP interventions on outcomes, using a propensity score–matched comparison group of non-ECCP facilities to determine the effect of interventions. Propensity scores are an efficient method to select a comparison group while accounting for a large number of characteristics. A comparison group of non-ECCP facilities with characteristics similar to ECCP facilities was identified within each state except for Nevada. In Nevada, because of the small number of facilities available, it was not feasible to be selective about which facilities to use for comparison. Therefore, all other, non-ECCP nursing facilities in the state were used as a comparison. RTI used multivariate analyses to evaluate key utilization, expenditure, and Minimum Data Set (MDS)–based quality measures in a difference-in-differences regression model framework. The models controlled for many characteristics of the resident population, including clinical and demographic characteristics as well as some facility characteristics (see Appendix E). The key variables that we focused on for the Initiative effect indicated the magnitude of the difference in the change in

5
the measures over time between the ECCP intervention group and the comparison group. This method enabled us to measure differences in outcomes between the two groups that were attributable to the Initiative, accounting for baseline differences between the groups and changes over time that were common to both groups.
We estimated the effect of the Initiative on selected individual-level measures including hospitalizations, potentially avoidable hospitalizations, and related expenditures. The measures were defined on an annual basis, with calendar years used for all years except for 2016, for which a fiscal year (October 1, 2015–September 30, 2016) was used because a new phase of the Initiative, including incentive payments to providers (Payment Reform Initiative), started on October 1, 2016. Thus, the 3-month period from October 1, 2015–December 31, 2015, was counted as both part of 2015 and 2016. Measures for each individual considered the individual’s exposure period associated with being eligible for the Initiative. The exposure period consisted of the time spent in the nursing facility, including brief periods during a stay when the individual was outside the facility, as explained in greater detail in Appendix A. Table 1-1 lists all the measures that are examined in later sections of this report. Descriptive results for several additional measures are presented in Appendix D.
For presentation of multivariate regression model results, we report the marginal effects of the ECCP intervention on each measure in meaningful units, such as dollars, percentage points, or number of events (rather than reporting the coefficients from regression models, which are often not in understandable units). Additionally, we present the impact of the intervention on aggregate expenditures among the participants in the intervention along with the probability that the impact on expenditures was a reduction (money was saved). A detailed description of our quantitative analysis methods appears in the Appendix A.
All the quantitative results treat 2012 as the base year. Because the Initiative was phased in over the course of 2013, it was expected that there would be no meaningful effect of the Initiative on the measures until 2014. The quantitative results presented in this report reflect two different modeling strategies for how the intervention years 2014–2016 were treated.
• Year-specific Effects: This strategy allows for the possibility that the implementation of the Initiative may have evolved over these 3 years and hence estimates a separate effect in each of these years. Based on this strategy, we present new results for 2016 and we also display the trend of Initiative effects over time.
• Intervention Period Annual Effects: This strategy calculates the average Initiative effect on a given measure per resident per year during the intervention period, 2014–2016.

6
Table 1-1 Measures of service utilization, expenditure, and quality
Measure Definition Variable type Unit of analysis Data source
Service utilization—Dichotomous (1/0) measures Any hospitalization, all cause Whether a resident had an inpatient admission. Dichotomous Resident Medicare Part A claims
Any hospitalization, potentially avoidable
Whether a resident had an inpatient admission for any of the conditions defined as potentially avoidable.
Dichotomous Resident Medicare Part A claims
Any ED visit, all cause Whether a resident had an outpatient ED visit that did not lead to inpatient admission, identified as RCC = (045X or 0981) or HCPCS classification code = (99281-99285).
Dichotomous Resident Medicare outpatient (institutional) claims
Any ED visit, potentially avoidable
Whether a resident had an outpatient ED visit (as identified above) for any of the same conditions used to define potentially avoidable hospitalizations.
Dichotomous Resident Medicare outpatient (institutional) claims
Service utilization—Count measures Hospitalization, all cause Total count of inpatient admissions. Count Resident Medicare Part A claims
Hospitalization, potentially avoidable
Total count of inpatient admissions for any of the conditions defined as potentially avoidable. This measure is a subset of Hospitalization, all cause.
Count Resident Medicare Part A claims
ED visit, all cause Total count of outpatient ED visits that did not lead to inpatient admission, identified as RCC = (045X or 0981) or HCPCS classification code = (99281-99285).
Count Resident Medicare outpatient (institutional) claims
ED visit, potentially avoidable Total count of outpatient ED visits (as identified above) for any of the same conditions as used to define potentially avoidable hospitalizations.
Count Resident Medicare outpatient (institutional) claims
(continued)

7
Table 1-1 (continued) Measures of service utilization, expenditure, and quality
Measure Definition Variable type Unit of analysis Data source
Program expenditure measures* Medicaid expenditure, overall Total Medicaid expenditure per beneficiary for long-stay nursing
facility care, and Medicaid cost sharing of Medicare expenditures for all covered services.
Continuous Resident Medicaid claims
Medicare expenditure, overall Total Medicare expenditure per beneficiary for all covered services, including inpatient, outpatient, SNF, carrier file services, hospice, home health, durable medical equipment, and prescription drugs.
Continuous Resident Medicare Parts A/B/D claims
Medicare expenditure measures, by subcategory: All-cause hospitalizations Total Medicare expenditure per beneficiary for all-cause inpatient
admissions. Continuous Resident Medicare Part A claims
Potentially avoidable hospitalizations
Total Medicare expenditure per beneficiary for inpatient admissions for any of the conditions defined as potentially avoidable.
Continuous Resident Medicare Part A claims
All-cause ED visits Total Medicare expenditure per beneficiary for all-cause ED visits that did not lead to inpatient admission, identified as RCC = (045X or 0981) or HCPCS classification code = (99281-99285).
Continuous Resident Medicare outpatient (institutional) claims
Potentially avoidable ED visits Total Medicare expenditure per beneficiary for ED visits (as identified above) for any of the same conditions as used to define potentially avoidable hospitalizations.
Continuous Resident Medicare outpatient (institutional) claims
MDS-based quality measures Catheter inserted and left in bladder
Percent of observed quarters in a year indicating presence of indwelling catheters.
Percent Resident MDS 3.0
Antipsychotic medication use Percent of observed quarters in a year indicating that a resident received an antipsychotic medication.
Percent Resident MDS 3.0
One or more falls with major injury1
Percent of observed quarters in a year indicating presence of one or more falls that resulted in injury.
Percent Resident MDS 3.0
(continued)

8
Table 1-1 (continued) Measures of service utilization, expenditure, and quality
Measure Definition Variable type Unit of analysis Data source
MDS-based quality measures (continued) Self-report moderate to severe pain
Percent of observed quarters in a year indicating presence of either (1) almost constant or frequent moderate to severe pain or (2) any very severe/horrible pain.
Percent Resident MDS 3.0
Pressure ulcers Stage II or higher Percent of observed quarters in a year indicating presence of Stage II–IV pressure ulcers.
Percent Resident MDS 3.0
Decline in ADLs Percent of observed quarters in a year indicating that a resident’s need for help with late-loss ADLs has increased. An increase is defined as an increase in 2 or more coding points in one late-loss ADL item or 1-point increase in coding points in two or more late-loss ADL items.
Percent Resident MDS 3.0
Urinary tract infection Percent of observed quarters in a year indicating presence of urinary tract infection.
Percent Resident MDS 3.0
Depressive symptoms Percent of observed quarters in a year indicating presence of depressive symptoms measured by PHQ-9 or PHQ-9-OV.
Percent Resident MDS 3.0
NOTE: ADLs = activities of daily living; ED = emergency department; HCPCS = Healthcare Common Procedure Coding System; MDS 3.0 = Nursing Home Minimum Data Set resident assessment data; PHQ-9 = Patient Health Questionnaire-9; PHQ-9-OV = PHQ-9 Observational Version; RCC = Revenue Center Code; SNF = skilled nursing facility. 1These specifications are consistent with Nursing Home Compare and were used in RTI’s quarterly reports. In the annual analyses, we expand the measure to include falls with any injury (J1900B = [1, 2] or J1900C = [1, 2]). * Medicaid data are currently reported in descriptive statistics for the following states: Alabama (2011–2013), Missouri (2011–2015), Nebraska (2011–2015), Nevada (2011–2015), and Pennsylvania (2011–2014). Carrier file services are Part B services such as physician and laboratory that are submitted as noninstitutional claims; durable medical equipment is in a separate file. Note that only Medicare data were included in any of the multivariate models.

9
The bulk of the analyses and results presented treat each state separately because there were substantial differences in the design and implementation of the Initiative across the different states. These state-specific results are presented in Section 3. In Section 4, we report results that estimate Initiative-wide intervention period (2014–2016) annual effects based on a pooled analysis of all the states combined. The effect estimates obtained using this method are not simply a sum or an average of the state-specific effects. They are obtained by employing an alternative statistical model that treats the seven-state Initiative group as a whole. We list the types of Initiative effects that are presented in later sections of this report in Table 1-2.
Table 1-2 Types of Initiative effects presented in this report
Initiative Effects Description Measures Tables/Figures
State-specific intervention period annual effects
This strategy calculates the Initiative effect on a given measure per resident per year during the intervention period, 2014–2016.
Utilization, expenditure, and key quality
Tables 3-2, 3-4, 3-6, and 3-11 for AL. Other states follow a similar pattern.
State-specific 2016 effects
As in prior annual reports, we present year-specific results. This strategy, which estimates a separate effect for each year, is employed because the effect of the Initiative may have evolved over time.
Utilization, expenditure, and quality
Tables 3-3, 3-5, 3-7, and 3-12 for AL. Other states follow a similar pattern.
State-specific effect patterns over time
We graphically depict the year-specific effect estimates for the years 2014–2016. In the same diagram, we also depict the intervention period annual effects.
Key utilization and expenditure
Figures 3-1 and 3-2 for AL. Other states follow a similar pattern.
Initiative-wide intervention period annual effects (all states combined)
We calculate the Initiative-wide effect on a given measure per resident per year during the intervention period, 2014–2016.
Utilization, expenditure, and key quality
Tables 4-1–4-4
Aggregate effects across states
Using the state-specific intervention period annual effects, we calculate, based on the number of participating nursing facility residents, the impact on aggregate expenditures for the years 2014–2016. We also perform the same calculation based on the Initiative-wide intervention period annual effects.
Key expenditure Tables 5-1–5-9
Effect patterns across states For each outcome, we graphically depict the state-specific intervention period annual effect estimates on one graph. On the same graph, we also depict the Initiative-wide intervention period annual effects.
Key utilization and expenditure
Figures 6-1–6-9

10
Because the Initiative focused specifically on long-stay nursing facility residents, the Initiative study population was limited to individuals who resided in either an ECCP or a comparison nursing facility for at least 101 days or who had a target assessment with no discharge plan in place. We used Medicare eligibility and enrollment data, and the CMS MDS patient assessments, version 3.0, to determine each resident’s eligibility for inclusion in the evaluation and to obtain resident characteristics. Hospitalizations and related expenditures were tracked using Medicare claims, while individual-level quality measures were tracked using the MDS. Greater technical detail on data sources, statistical methods (including propensity score matching and the difference-in-differences models), and the resident and facility characteristics included in the models, is provided in Appendix A.
Qualitative Data Collection Methods. The overarching goal of qualitative data collection activities was to identify elements of, or structures for, the most promising or effective care models. To achieve this goal, the PDC team used site visits, telephone interviews, web-based surveys of participating facilities, and a one-time survey of comparison facilities. In addition, the team developed an engagement-and-use document to describe the extent to which facility staff had bought in to the Initiative goals (engagement) and implemented the Initiative components (use). These efforts added context to and help explain the findings from quantitative data analysis. Particularly, the qualitative information helped to answer questions about the implementation experience for ECCPs and participating facilities.
Data from qualitative data collection activities2 were organized into four research domains: (1) Care Model Description, including key features of the ECCPs and care models; implementation timeline; partnerships with external organizations; and project challenges, sustainability, and lessons learned; (2) Shared Learning Activities, including the structure, participation level, and impact of learning community events; (3) Project Impact, which focuses on practice pattern changes, consequences, and spillover across ECCPS, facilities, and residents; and (4) Project Attrition, including both characteristics of and reasons for attrition at the facility and resident levels.
Over the course of the Initiative, the team visited all 7 participating ECCP headquarters and 110 of 143 participating facilities.3 The team also conducted 371 telephone interviews with participating facility staff not interviewed in person. The response rate to the survey of participating facilities ranged from 79% to 98% across Initiative years, and the response rate to the one-time comparison group survey was 43%. In addition, teams categorized the degree of engagement with and use of Initiative components for 117 facilities participating in 2016 primary data collection.4 For more detailed information about the qualitative data collection effort and methods, see the Appendix B.
2 All data collection tools were approved prior to use by the RTI Institutional Review Board (IRB). 3 143 facilities were participating at the end of the Initiative. Totals include facilities visited and interviewed
multiple times during the Initiative. 4 No engagement data were available for the facilities that did not respond to the phone interview requests. N=117
represents the number of facilities site visited in person or interviewed by phone.

11
1.4 Organization of Final Report
The organization of this final report is as follows: Section 1 provides an overview of the Initiative and an overview of the evaluation methods. Section 2 describes the Initiative implementation across participating states and discusses common features of ECCP models and the range of model components and implementation approaches. Section 3 includes state-specific analyses; for each state the results are integrated across multimethod evaluation approaches to present a clear picture of each ECCP’s accomplishments, challenges, and the evaluation results. Section 4 presents the Initiative-wide intervention period annual effects, and Section 5 presents aggregated expenditure results and analyses of the overall probability that net savings were achieved and that reductions in expenditures on hospitalizations, and potentially avoidable hospitalizations, were achieved. Section 6 includes a discussion of major Initiative findings and our key takeaways from the evaluation.
The appendices (submitted in a separate volume) include detailed descriptions of the quantitative methods for the evaluation (Appendix A), and the qualitative methods for the evaluation (Appendix B). In addition, we include tables delineating ECCP participating facilities (Appendix C), summary results from descriptive analyses of key evaluation outcomes on Medicare utilization and expenditure as well as quality measures (Appendix D), characteristics of Initiative-eligible residents and nursing facilities included in the multivariate analyses (Appendix E), facility staffing and inspection deficiencies (Appendix F), selected multivariate regression model results (Appendix G), estimates of the Initiative effect on key utilization and expenditure outcomes obtained using multivariate analyses (Appendix H), and results of an analysis of the relationship between the Initiative and mortality (Appendix I). Appendices for state maps illustrating the geographic locations of ECCP and matched comparison facilities; conditions defined as potentially avoidable hospitalizations; detailed measure specifications; and primary data collection protocols are available upon request.

12
[This page intentionally left blank.]

13
SECTION 2 INITIATIVE IMPLEMENTATION ACROSS ALL ECCPS
2.1 Overview of the ECCP Models
The Initiative was implemented by seven Enhanced Care and Coordination Provider (ECCP) organizations, selected by Centers for Medicare & Medicaid Services (CMS) from solicited applications. Each ECCP operated in one of seven states. The ECCP models aimed at improving the overall health and health care of participating long-stay nursing facility residents, with the primary goals of reducing potentially avoidable hospitalizations, improving quality of care, and decreasing health care spending . A total of 143 nursing facilities participated, each partnering with one of the state-based ECCPs to implement specific clinical or educational interventions. Although CMS provided guidelines for intervention design and required certain key model elements, ECCPs had the flexibility to select and implement specific interventions.
All ECCPs were required to employ staff, such as registered nurses (RNs) or advanced practice registered nurses (APRNs), including nurse practitioners (NPs),5 to provide full- or part-time support to the partnering nursing facilities. In five ECCPs, nurses provided clinical care to residents and education to nursing facility staff. In two ECCPs, AQAF (Alabama) and NY-RAH (New York), the ECCP staff served as advisors who trained facility staff, reported facility data to participating facilities, and shared best practices, but did not provide clinical care.
To improve care processes and communication among providers, all ECCPs chose to use components of the INTERACT (Interventions to Reduce Acute Care Transfers) (Ouslander, Bonner, Herndon, & Shutes, 2014) approach, which is a quality improvement process that provides staff with communication tools, such as standardized forms, to enhance care for residents. ECCPs used one or more of the following five INTERACT tools, and ECCP nurses trained facility staff to use these tools:
• Stop and Watch assists staff members who witness a change in resident condition innotifying licensed nurses.
• Care Paths Tool provides decision support tools for nurses.
• The SBAR (Situation, Background, Assessment, and Recommendation)communication form provides a template for nurses to make a structured assessmentprior to notifying a physician of a resident’s change in condition.
• Transfer Forms organize resident records to simplify communication with hospitalstaff.
• Quality Improvement (QI) tools that facilitate tracking, review, and root causeanalyses of acute care transfers.
5 See Section 2.3 for more details regarding APRNs and NPs participating in the Initiative.

14
In addition, ECCP models focused on related care processes, such as reviewing residents’ medications, encouraging end-of-life conversations, and the use of advance directives. Other optional interventions, such as telemedicine, dental care, secure text messaging, and administrative leadership education, were chosen by some ECCPs. Key ECCP model features in the final year of the Initiative are summarized in Table 2-1.
Table 2-1 Key ECCP model features as of 2016
AQAF (AL)
OPTIMISTIC (IN)
MOQI1
(MO) Alegent
(NE) ATOP (NV)
NY-RAH (NY)
UPMC-RAVEN (PA)
Structure Organization type QIO University
research program
University research program
Not-for-profit health care system
QIO Hospital association foundation
Not-for-profit health care
system Use of registered or higher-level nurses
APRN ● ● ● ● ● RN ● ● ● ● ●
Role of nurse Clinical care ● ● ● ● ● Writing orders ● ● ● ● Education ● ● ● ● ● ● ● Days in facility per week 5 5 5 1-4 1-4 5 5
Medication management Polypharmacy reduction ● ● ● ● ●
Antipsychotics reduction ● ● ● ●
Medication review ● ● ● ● ● ● ● Use of INTERACT tools to improve communication
SBAR ● ● ● ● ● ● ● Stop and Watch ● ● ● ● ● ● ● Transfer Form ● ● ● ● QI tool ● ● ● ● ● ● Care Paths ● ● ● ● ●
End-of-life planning Advance directives ● ● ● ● ● Staff education ● ● ● ● ● ●
Optional features specific to each ECCP Features Leadership
training; QAPI teams
Collaborative Care Review
E-tablets; CareMail; CareView
portal
Dental hygienists
Web registry
with risk assessments
and tools
Direct Messaging; AMDA’s
Know-it-All Before You Call cards
Telemedicine with after-hours APRN support
AMDA = American Medical Directors Association; APRN = advanced practice registered nurse; ECCP = Enhanced Care and Coordination Provider; INTERACT = Interventions to Reduce Acute Care Transfers; RN = registered nurse; QAPI = Quality Assurance and Performance Improvement; QI tool = Quality Improvement Tool for Review of Acute Care Transfers; QIO = Quality Improvement Organization; SBAR = Situation, Background, Assessment, and Recommendation Communication Tool; Stop and Watch = Stop and Watch Early Warning Tool; Transfer Form = Nursing Home–Hospital Transfer Form. 1 MOQI ECCP is using “The Conversation Project” framework for end-of-life planning discussions. SOURCE: RTI analysis of site visit and phone interview data.

15
All ECCPs designed their models according to the following Theory of Action (Figure 2-1). ECCP nurses (APRNs and/or RNs) support nursing facility staff by providing clinical care and/or education and by introducing INTERACT tools, end-of-life care planning, medication management, and other ECCP-specific interventions. This additional support improves clinical care processes and information exchange, which results in more accurate identification of resident changes in condition and more timely communication with primary care providers and hospitals. Improved care processes and provider communication allows facilities to provide higher quality care to residents and avoid unnecessary hospitalizations, which improves residents’ quality of life and provides savings for Medicare.
Figure 2-1 Theory of action for ECCP models
All ECCPs staggered implementation of the Initiative across subgroups of their nursing facility partners, starting in February 2013. Across all ECCPs, four facilities stopped participating prior to the end of the Initiative in September 2016. These facilities withdrew because of facility-specific concerns (e.g., facility closure, change in corporate ownership, or other structural instability), rather than challenges with implementing the Initiative. The Initiative began a new phase in October 2016 testing a provider payment component.
Alabama Quality Assurance Foundation Nursing Facility Initiative (AQAF). The AQAF model focused on providing educational training for leadership and facility staff. AQAF trained RN Care Pathways Coaches (Coaches) in long-term care and placed them in partnering nursing facilities to effect procedural changes in existing facility practices. Coaches did not provide direct clinical care to facility residents; instead they improved staff education and processes through the use of INTERACT tools, staff development training, and creation of targeted Quality Assurance and Performance Improvement (QAPI) teams for reducing hospitalizations, maintaining staff, managing medications, and improving facility quality. In addition, facility leadership participated in AQAF trainings pertaining to facility management, consistent staffing, and related concerns common across facilities. Coaches were placed in facilities on a full-time basis. Data collection was a central focus of the AQAF model, including data concerning potentially avoidable hospitalizations and data required by AQAF that related to

16
specific aspects of their model. The AQAF model operated in 23 nursing facilities in central and north-central Alabama.
Indiana University (IU) Geriatrics Department, Optimizing Patient Transfers, Impacting Medical Quality, and Improving Symptoms: Transforming Institutional Care (OPTIMISTIC). The OPTIMISTIC model placed full-time APRNs and RNs in each facility to provide direct clinical care and education and training to nursing facility staff. OPTIMISTIC used a suite of tools from different sources (American Medical Directors Association [AMDA], INTERACT, and their own) and aimed to improve medical care, palliative care, and transitional care. OPTIMISTIC RNs and APRNs conducted intensive clinical reviews of residents in response to resident transitions or acute changes in condition through the collaborative care review (CCR) process. The ECCP APRNs reviewed diagnoses, medications, activities of daily living, discussed quality of life, plan of care, and advance directives and responded to resident and family concerns. The ECCP RNs assisted with data gathering and supported APRNs on the facility floors. The CCRs were reviewed by IU geriatricians whose recommendations were conveyed by the ECCP APRN to the resident’s attending physician. Finally, OPTIMISTIC facility staff facilitated the rollout of the Physician Orders for Scope of Treatment (POST) form, educating families, residents, and nursing facility staff on advance directives. The OPTIMISTIC model operated in 19 nursing facilities in central Indiana.
The University of Missouri, Sinclair School of Nursing Missouri Quality Initiative for Nursing Homes (MOQI). The MOQI model aimed to reduce rates of avoidable hospitalizations and readmissions through (1) placement of a full-time APRN in each nursing facility to provide clinical care services, coaching, education, and mentoring to facility staff; (2) implementation of INTERACT tools and processes; (3) health IT implementation of the encrypted CareMail and CareView systems for hospital transfers, and Surface tablets for the APRNs; and (4) clinical quality improvement. MOQI APRNs were not able to write orders for treatment, but they could conduct clinical assessments of residents. The MOQI leadership team was composed of nursing, medical, social work, IT, and data management professionals, and the model was based upon the team’s experience in the Quality Improvement Program for Missouri (QIPMO). The MOQI model operated in 16 nursing facilities in the greater St. Louis area.
Nebraska Alegent + Creighton Health Program (recently renamed Nebraska CHI [Catholic Health Initiatives]). The Alegent model assigned six APRNs to split their time, supporting all participating nursing facilities by providing clinical services to residents in their assigned facilities and coordinating training among facility staff. ECCP nurses rotated to assigned nursing facilities, spending 1–2 days per week in each facility. Each facility had one to two assigned APRNs, depending on facility size and specific needs. Most facilities were visited by one APRN for 1 day per week, although large or complex facilities received up to 4 person-days of visits per week. APRNs provided life issue reviews, medication reviews using the Long Term Care Medication Outcome Manager (LTC-MOM) tool,6 history and physical assessment (H&P) exams, and guidance in using INTERACT tools. In addition to the APRNs, the ECCP also provided dental and pharmacy support to participating facilities through dental hygienists, a
6 Bergman-Evans, B. Improving medication management for older adult clients. Iowa City, IA: University of Iowa
College of Nursing, John A. Hartford Foundation Center of Gerontological Nursing Excellence; 2012 May 31.

17
dentist, and a pharmacist who were part of the ECCP team. The dental hygienists provided assessments, cleanings, and referrals for participating residents. Alegent operated in 14 nursing facilities in Omaha and the surrounding area.
HealthInsight Nevada Admissions and Transitions Optimization Program (ATOP). The ATOP model assigned teams of one APRN and two RNs to provide direct clinical care, training, and education to clusters of four or five participating nursing facilities. ECCP nurses rotated to assigned nursing facilities, spending 1–4 days per week in each facility, depending upon facility size and specific needs. ATOP aimed to improve care and reduce avoidable hospitalizations by promoting INTERACT tools and offering a variety of trainings, including at-the-bedside instruction, in-service training in condition management, and training to facility leadership. ATOP also trained and promoted use of the Physician Orders for Life Sustaining Treatment (POLST) form to facilities and hospitals. The Resident Registry, populated by ECCP RNs, captured all relevant clinical data and was designed to provide (1) risk assessments for each participating long-stay resident; (2) web-based data sharing of resident reports for ATOP staff; (3) targeted queries as needed (e.g., for medication reviews); (4) progress reports to nursing facilities; and (5) CMS reporting requirements. Most of ATOP’s 24 participating facilities were located in two major clusters—in and around the Las Vegas area in the southeastern part of the state, and near Reno, in the northwest.
New York Reducing Avoidable Hospitalizations (NY-RAH) Project of Greater New York Hospital Association (GNYHA) Foundation. The NY-RAH model featured Registered Nurse Care Coordinators (RNCCs) who acted as consultants and educators in their assigned facilities. RNCCs were placed in the facilities on a full-time basis. Their main goals were to reduce avoidable hospitalizations, improve transitions between nursing facilities and hospitals, and strengthen efforts in palliative and end-of-life care. To facilitate a reduction in hospitalizations, the model included different tools that a variety of staff could use, such as the INTERACT Stop and Watch and SBAR tools to improve the early identification of acute changes in condition and improve communication with physicians. For palliative and end-of-life care, attending physicians and facility social workers were trained by ECCP leadership on the New York Medical Orders for Life Sustaining Treatment (MOLST) form to document residents’ end-of-life and palliative care goals. RNCCs and ECCP leadership also facilitated the modification of facility policies and procedures on both acute changes in condition and end-of-life care, which ensured the adoption and continued sustainability of the model tools. Concerning data, which all ECCPs were required to collect, RNCCs presented monthly summary data to nursing facility leadership to increase their capacity to identify root causes for potentially avoidable hospitalizations. Improving transitions through increased electronic capabilities and information sharing between hospitals and nursing facilities was another component of the NY-RAH model, including the use of secure software to transmit patient discharge information and hospital documentation. The NY-RAH model operated in 29 nursing facilities in New York City and Long Island.
University of Pittsburgh Medical Center (UPMC) Community Provider Services Program to Reduce Avoidable Hospitalizations using Evidence-based Interventions for Nursing Facilities (UPMC-RAVEN). The UPMC-RAVEN model focused on the clinical care provided by UPMC-RAVEN APRNs and RNs in the facilities. UPMC-RAVEN APRNs and RNs were placed in facilities on a full-time basis and were also supported by lead APRNs

18
assigned to several facilities but who were located elsewhere. UPMC-RAVEN leadership trained enhanced care APRNs and RNs in geriatric/palliative care prior to placing them in partnering nursing facilities. In addition to providing clinical care for UPMC-RAVEN eligible residents, these APRNs worked with both pharmacist partners to provide medication management and educational partners to provide individualized facility learning plans and tailored educational components for training in each facility. INTERACT tools, namely SBAR and Stop and Watch, were used for early warning and condition monitoring, and the Pennsylvania POLST form was used for advance care planning. Telemedicine carts, transmitting information over the Internet, were introduced to each facility, allowing on-call ECCP APRNs to assist in the diagnosis and treatment of acute changes in condition and other medical emergencies occurring outside regular business hours. The UPMC-RAVEN model operated in 18 facilities in Pittsburgh and western Pennsylvania.
2.2 ECCP Administration and Management
In 2012, CMS selected a variety of nonprofit organizations to become ECCPs, funded by Cooperative Agreements. Two were university based (MOQI at the University of Missouri and OPTIMISTIC at the Indiana University), two were health care systems (UPMC-RAVEN and Alegent), one was a foundation affiliate of a hospital association (NY-RAH GNYHA), and two were Quality Improvement Organizations (QIOs) (ATOP of HealthInsight and AQAF).
Although all organizations were experienced with nursing facility policies and operations, only three had had previous experience developing and operating initiatives within facilities. UPMC-RAVEN had previously tested most components of its UPMC-RAVEN model in several nursing facilities within the UPMC network. Similarly, through the Sinclair School of Nursing (SON) at the University of Missouri, the ECCP Project Director also directed the Aging in Place Project at a nursing facility in which SON nursing students provided care to residents as part of their education. Alegent Health, of Alegent, had collaborated with community nursing facilities through its Nursing Home Network and participated in a project focused on reducing avoidable hospitalizations among short-stay residents.
ECCPs organized and structured their project management in different ways. All ECCPs appointed a project director/manager to manage the day-to-day operations, an analyst to supervise the data collection and analysis, and at least one medical director to provide clinical advice and support to the clinical staff in the field. OPTIMISTIC, MOQI, UPMC-RAVEN, and NY-RAH also leveraged in-house expertise or partner organizations to form teams focused on specific clinical interventions such as care transitions, palliative care, and quality improvement.
Nearly all ECCPs engaged partners to provide specialized training for both facility-based ECCP staff and participating nursing facility staff. For example, UPMC-RAVEN, MOQI, OPTIMISTIC, and NY-RAH began operations with as many as nine formal partner organizations to provide specialized training and support. Most ECCPs contracted with partners to provide ongoing technical support for web-based portals, registries, and other data collection and reporting needs. Some also contracted with subject matter experts to provide short-term, targeted training (e.g., ATOP for dementia training and Certified Nursing Assistant [CNA] empowerment training; OPTIMISTIC and NY-RAH for training in end-of-life discussions; MOQI for infection control training). In later years as the Initiative evolved and ECCPs
19
completed rollout of their initial interventions, they made organizational adjustments to focus on new areas. This sometimes involved engaging new partners, re-assigning staff, or making other organizational adjustments.
Advisory committees also played a key role for ECCPs. MOQI, OPTIMISTIC, AQAF, and NY-RAH developed advisory groups composed of nursing facility leadership, hospital and nursing facility associations, medical director associations, and advocacy and other community groups to discuss current and upcoming features of the Initiative. These forums reportedly raised awareness and improved buy-in of the Initiative both in the participating facilities and in the larger community. ATOP convened nursing facility leadership and other partners in training sessions and other meetings at least annually. These activities were held in addition to check-in meetings with individual nursing facility leadership that all ECCPs conducted. Check-in meetings were reported to be critical early in the Initiative. For example, OPTIMISTIC leadership visited all facilities weekly to ensure that facility leadership understood the Initiative and to support the embedded RNs. The frequency of such check-in meetings tapered off as the Initiative matured, and ECCPs with facilities located in broader geographical areas conducted check-in meetings by phone or web.
ECCPs also varied in their approach to supervising and managing facility-based ECCP staff. Facility-based APRNs reported to ECCP clinical staff, generally also including support from the medical director. RNs were supervised by APRNs, other RNs, or ECCP clinical leadership staff. ECCPs also hired senior lead APRNs and RNs to provide support to their colleagues in the facilities, discussed further in the following section.
2.3 Advanced Practice Registered Nurse and Registered Nurse Involvement
All ECCP models included nurses who were hired to partner with nursing facility staff to improve recognition, assessment, and management of conditions that are often a cause of avoidable hospitalizations. All ECCPs hired APRNs, RNs, or both to fulfill this staffing requirement (see Section 2.1 for more on this topic). ECCP APRNs are RNs prepared through advanced education (i.e., Master’s degree, Doctorate of Nursing Practice) and clinical training to provide preventive and acute health care services to individuals of all ages with an emphasis on the health and well-being of the whole person. APRNs are health care providers, mentors, educators, researchers, and administrators. They work autonomously and collaboratively with other members of the health care team.7 The primary data collected by the evaluation team indicated that state and federal policies govern how these clinicians practice, which had direct implications on how the Initiative models were designed and implemented.
APRNs are defined in federal statute as NPs, clinical nurse specialists (CNSs), certified registered nurse anesthetists (CRNAs), and certified nurse midwives (CNMs).8 Currently, a set of federal and state laws and policies regulate APRNs’ scope of practice, limiting the scope of services APRNs can provide independently. Progress toward full practice is uneven across states, with some states granting full practice authority, others adopting compromise legislation (e.g.,
7 Source: http://www.nursepractitionerschools.com/faq/what-is-np. 8 P.L. 114-148, Sec. 5509.

20
APRNs applying for full practice authority after completing a defined number of supervised practice hours), and still others maintaining burdensome restrictions. Since NPs represent the largest group of APRNs (>80%) (Kaiser Family Foundation, 2016) and are the most relevant to the Initiative, the remainder of this section will focus on state and federal policies affecting these clinicians in the context of the Initiative, as well as the role APRNs played in achieving Initiative goals within participating facilities.
Relevant policies affecting NPs’ scope of practice are described in Table 2-2. Two of the seven states involved in this Initiative (Nebraska and Nevada) provided NPs with full practice authority, removing all barriers to their practice and providing independent prescriptive authority. Although state policy permits independent practice, ECCP NPs in Nebraska were still required to have a Collaborative Practice Agreement (CPA) with the ECCP health system physician, and Nevada ECCP NPs were required to have the approval of the primary care physician (PCP) prior to writing orders with a resident. In some cases, the roles and functions of ECCP NPs evolved over the course of the Initiative. For example, in 2013 Nevada law changed, no longer requiring APRNs with 2 years of experience or 2,000 hours of practice to have CPAs. Reduced or restrictive practice regulations in the remaining five states require that NPs have written formal CPAs with physicians. In general, the regulations governing these agreements do not specify on-site reviews or describe how collaboration will take place. However, the need for CPAs can create potential barriers to participation: CPAs can be financially burdensome to NPs; may be difficult to arrange with multiple physicians; can be problematic for physicians who may be reluctant to enter into CPAs because of concerns about increased liability; and often are confusing for policymakers and the public who think CPAs foster NP–physician collaboration when, in fact, they can create an additional layer of complications (Fateux et al., 2017; Phillips, 2017). State restrictions on NPs’ abilities to prescribe medications, order physical therapy, or sign do-not-resuscitate (DNR) orders also limit the effectiveness of NPs in their efforts to care for nursing facility residents.
These restrictions affect end-of-life (EOL) care practices. An important area for the care of the Initiative-eligible population is the Physician Orders for Life-Sustaining Treatment (POLST) designed to systematically identify residents’ wishes regarding EOL medical treatment and to communicate these wishes via portable medical orders. Similar forms include MOLST and POST. In the four states (Nevada [POLST], New York [MOLST], Indiana [POST], Pennsylvania [POLST]) that have endorsed this program to date, the roles of NPs vary. Only in Pennsylvania are NPs permitted to sign POLST forms; in Nevada, Indiana, and in New York the forms require a physician signature. Missouri uses the Transportable Physician Orders for Patient Preferences (TPOPP form), which is modeled on the POLST and must be signed by a physician, not an NP, to be valid. All other states that have either endorsed POLST or are in the development stage require a physician’s signature.
Since the implementation of the Initiative, the following Legislative Updates occurred in participating states:
• Alabama—In 2013, legislation passed to allow NPs to prescribe controlled substances regulated by the Board of Medical Examiners.

21
• Indiana—As of February 28, 2017, there is a house bill to remove the CPA and add graduate education and national certification as requirements for all NPs since Indiana is the only state that does not require a graduate degree and is only one of four states that does not require national certification (HB 1474). However, the bill did not meet the necessary deadline and, thus, will not progress through the legislative process.
• Missouri—House Bill 165 has been introduced that would remove (1) most existing requirements for CPAs, except for prescribing controlled substances, and (2) limitations on the number of NPs with whom a physician may collaborate.
• Nebraska—In 2015, legislation was passed that removed the CPA requirement for NPs (Revised Statute 38-2301).
• Nevada—Assembly Bills 115 and 116 were introduced in 2017. The former would allow NPs to sign POLST forms and order home health services. The latter would provide for NP signature authority on several forms, including DNR orders and death certificates.
• New York—In 2014, New York moved closer to full practice authority with the 2014 Nurse Practitioners Modernization Act (S4611B), which allows experienced NPs to practice without a written CPA. All NPs still need to maintain a collaborative relationship with a physician through informal agreement.
• Pennsylvania—Legislation to eliminate the requirement of NPs to have CPAs with physicians has been pending for 5 years. This year (2017), Senate Bill 25 has been introduced, which would eliminate the CPA requirement for experienced NPs (those with 3 years and 3,600 hours of clinical practice under a CPA).
Although considerable attention has been paid to restrictions on NPs’ scope of practice at the state level, there are also important skilled nursing facility (SNF)-related federal policies that influence how the Initiative is implemented in participating facilities. For example, some federal regulations prohibit NPs from completing the histories and physical examinations of newly admitted Medicare beneficiaries; others preclude NPs from certifying nursing facility residents for hospice services.
State policies affecting scope of practice also influenced ECCP NPs’ ability to implement the Initiative. In Nevada, NPs gained full practice authority in 2013, but generally ATOP NPs did not write orders, as they needed permission from the residents’ PCPs. Prior to a policy change in 2015 to full scope of practice, Nebraska NPs were required to have a CPA with a physician to practice, satisfied by an Alegent physician uninvolved with the ECCP. Missouri NPs were required to have CPAs, but these agreements were not part of the ECCP model, and NPs were not permitted to write orders. Facility physicians became more accepting of the ECCP NPs over time, as they developed relationships and recognized NPs’ contributions to resident care outcomes. Table 2-2 outlines NPs’ scope of practice by ECCP state.

22
Table 2-2 State policies affecting NPs’ scope of practice in the Initiative states
Regulatory Structure AQAF (AL)*
OPTIMISTIC (IN)
MOQI (MO)
Alegent (NE)
ATOP (NV)
NY-RAH (NY)*
UPMC-RAVEN
(PA)
Full Practice** ● (2015)
● (2013)
Reduced Practice*** ● ● ● ● Restrictive Practice**** ●
NOTE: State Variation in Nurse Practice Acts (● = yes) *States that only used RNs for the Initiative’s model. **Authority to evaluate patients; diagnose, order, and interpret diagnostic tests; initiate and manage treatments, including prescriptions. ***At least one element of NP practice (outlined above) is restricted. ****At least one element of NP practice is restricted and supervision by another health professional (MD) is required. Source: Phillips, S. J. 29th Annual APRN Legislative Update. (2017). The Nurse Practitioner, 42(1), 18-46.
ECCP Nursing Models. APRNs and RNs occupied the predominant role in ECCP efforts to reduce avoidable hospitalizations in all seven ECCPs. Two of the seven ECCP models only employed APRNs (MOQI and Alegent), two implemented RN-only models (AQAF and NY-RAH), and three ECCPs employed a combination of APRNs and RNs (OPTIMISTIC, UPMC-RAVEN, and ATOP). One of the seven ECCPs (ATOP) hired a physician assistant in Initiative Year 29 because of difficulty in recruiting APRNs; this position was replaced by an APRN in Initiative Year 4. NY-RAH referred to the RNs as RNCCs, and AQAF called its RNs Care Pathway Coaches. Table 2-3 displays the types of nurses used in the Initiative.
UPMC-RAVEN and Alegent included an experienced lead APRN role. The UPMC-RAVEN lead APRNs provided support to UMPC-RAVEN facilities and served as back-ups when facility nurses were not available. Alegent’s lead APRN provided guidance to other APRNs, coordinated educational offerings, and oriented new APRNs, in addition to regular duties as an ECCP APRN. Some ECCPs also hired float nurses to provide coverage across facilities when vacancies occurred because of turnover.
Most ECCP nurses (AQAF, OPTIMISTIC, MOQI, NY-RAH, and UPMC-RAVEN) were assigned to implement the program in a designated facility and work the daytime shift, Monday through Friday. In some NY-RAH facilities two RNCCs were assigned because of the size of the facility (300–400 residents). In other situations, some RNCCs shared their time between two smaller facilities. Similarly, UPMC-RAVEN RNs were hired to assist APRNs in facilities with large numbers of residents enrolled in the Initiative. OPTIMISTIC RNs were assigned to work
9 Initiative years line up with calendar years, except for 2016, which is fiscal year. Therefore, Initiative Year 1 =
CY 2013, Initiative Year 2 = CY 2014, Initiative Year 3 = CY 2015, and Initiative Year 4 = October 2015–September 2016.

23
full time in a facility and APRNs were assigned to a set of 3–5 facilities. The APRNs were used for assessing acute changes in resident condition, performing transition visits collaborative care reviews, and addressing polypharmacy issues.
Table 2-3 Full-Time Equivalent APRN and RN assignments in participating facilities, 2016
AQAF (AL)
OPTIMISTIC (IN)
MOQI (MO)
Alegent (NE)
ATOP (NV)
NY-RAH (NY)
UPMC-RAVEN
(PA)
APRN 0 6 16 5 5 0 8 RN 23 17.5 0 0 10.5 25 7 Lead APRN and/or RN 0 0 0 1 0 2 3
Float nurses 0 0 1 0 0 1 0 Participating facilities 23 19 16 14 24 29 18 Ratio of ECCP facility staff to nursing facilities
1:1 1.24:1 1.06:1 0.42:1 0.65:1 0.97:1 1:11
NOTE: Positions are full-time equivalent (FTE) budgeted positions. AQAF has a float nurse based at the ECCP headquarters who assists facilities only on an as-needed basis, without consistent FTE or fractional FTE hours in facilities. The ECCP nurse to facility ratios do not adjust for variation in facility size. 1 In some large UPMC-RAVEN facilities, one RN is added to assist an APRN.
In the Alegent model, each member of the team of six APRNs was assigned to an average of 4 of the 14 participating facilities; several facilities had more than one assigned APRN. APRNs visited each of their assigned facilities 1–2 days per week. ATOP used a different model to accommodate the wide geographic dispersion of its facilities participating in the Initiative. Over the course of the project, ATOP had 24–25 participating facilities. These facilities were divided into five pods, with four to five facilities per pod and one assigned ATOP APRN and two RNs to each pod. In this model, larger, urban facilities were often visited several times a week, while smaller facilities or facilities in remote geographic areas were visited less frequently. One remote facility was visited once every 4–6 weeks for 2 days. Another remote facility was assigned a part-time (0.5 FTE) ATOP RN.
APRN clinical support during the overnight hours and weekends varied across ECCPs. During the first 2 years, ATOP APRNs provided coverage for the 24-hour call line Monday through Friday, 5 p.m. to midnight, and 8 a.m. to midnight, Saturday and Sunday. This system was disbanded in Initiative Year 2 because very few calls were received (see Section 2.9 for more on this topic). UPMC-RAVEN APRNs supported on-call services for telemedicine covering extended hours, but they did not provide 24-hour/7-days-a-week coverage. The remaining ECCPs reported a variety of on-call methods, some paid and some voluntary, and in some instances the facility Director of Nurses (DON) required facility staff to contact the DON when there was a change in condition (OPTIMISTIC and MOQI).
ECCP APRN and RN Roles and Responsibilities. The specific roles and responsibilities of the APRNs in the Initiative were guided by the ECCP model, as well as state and federal regulations governing scope of practice and CPAs. Where applicable, ECCP APRNs took health

24
histories; provided complete physical examinations; diagnosed and treated resident problems; ordered, performed, and interpreted laboratory results and x-rays; prescribed and managed medications and other therapies, as applicable by state regulations and CPAs; and provided health teaching and counseling to residents. In conducting this work, ECCP APRNs communicated with PCPs as needed.
The primary roles and responsibilities of the ECCP nurses largely remained constant throughout the Initiative. Providing clinical care support to and development of facility staff were the two most frequently reported responsibilities. ECCP nurses were also involved in other aspects of resident comprehensive care aimed at improving patient outcomes and avoiding unnecessary hospitalizations.
Providing hands-on clinical support to facility staff entailed assisting staff with assessing a change in resident condition, attending clinical rounds, responding to emergency situations, and collecting data about hospitalizations. Across all ECCPs, ECCP nurses educated and developed facility staff, improving knowledge and skills in caring for complex patient conditions to prevent avoidable hospitalizations and providing counseling about advance directives. For example, the OPTIMISTIC RNs and APRNs conducted CCRs, which included diagnoses, hospitalization history, medications, activities of daily living, and resident and family concerns. The APRN presented these CCRs to the OPTIMISTIC geriatrician with care recommendations for the resident’s PCP to approve.
Although specific models varied by ECCP, ECCP nurses generally provided education through one-on-one interactions with facility staff at the point of resident care, as well as formal group continuing and in-service education programs (e.g., use of INTERACT tools). One-on-one education was viewed by facility nurses and DONs as the most effective strategy as some facility staff had difficulty attending formal educational sessions during the work day, and paying for staff to attend educational programs was reported by facility leadership as being expensive. Education was also provided by ECCP staff on common resident conditions associated with hospitalizations. ECCPs varied on what educational topics were emphasized across Initiative years (e.g., POLST and EOL conversations with residents and family members, medication management, palliative care, and specific diagnoses such as aging, dementia, and urinary tract infections). In some facilities, ECCP nurses also spent time educating residents and family members about care choices, disease trajectories, and quality-of-life issues.
OPTIMISTIC, MOQI, Alegent, ATOP, and UPMC-RAVEN APRNs provided clinical assessment and care of facility residents. This work by ECCP nurses was extremely valuable according to participating facility staff and was consistently reported as being one of the most important Initiative components. Facility staff across these five ECCPs provided positive feedback, explaining that these ECCP nurses were “extra pairs of eyes” or “extra sets of hands” to assist in managing resident care, particularly in emergent situations such as treating imminent threats to health or assisting with necessary hospital transfers. In addition to providing care to residents, these ECCP nurses provided ECCP nurse-to-facility training and guidance to help nurses improve their skills in recognizing potential health concerns.
In these five ECCPs, a fundamental role of both the ECCP APRNs and RNs was assessing resident conditions. This assessment was sometimes completed independently based on

25
identification of a resident with an unstable high-risk condition (e.g., heart failure) by the facility nurses or when an emergent change in condition warranted transferring the resident to an acute care hospital. During these episodes, ECCP nurses were instrumental in teaching facility staff how to recognize and assess the resident’s disease or condition-specific symptoms and what treatments and interventions were applicable. Often, the ECCP nurses also played a role in facilitating and communicating health information during hospital transfers. This direct intervention between the ECCP nurses and facility staff was viewed by DONs as one of the most influential contributors to the clinical development of facility staff and, in turn, the avoidance of unnecessary hospitalizations.
ECCP nurses were also involved in indirect care activities that supported the overall quality of care delivered to facility residents. The specific activities, role of the ECCP nurse, and the time spent on these activities varied but often included reviewing drug regimens, including medication reconciliation; developing resident care plans independently or in collaboration with facility staff; participating in facility quality improvement activities; and training or assisting with implementation of telemedicine and other technology. Some ECCP nurses also encouraged EOL conversations; for example, OPTIMISTIC, MOQI, and UPMC-RAVEN nurses worked closely with social workers and facility nurses to develop skills and confidence to initiate these conversations with residents and family members.
Data collection was another important function that all ECCP nurses performed in Initiative facilities. Many ECCP nurses reported that data collection related to the Initiative was a burdensome task, taking away time from their clinical responsibilities, with some spending as much as 60 percent of their time on data collection. The amount of time spent in each facility collecting data was also dictated by the number of enrolled residents. The data collection burden was somewhat reduced in the later years of the Initiative implementation, as CMS reduced reporting requirements, ECCPs improved data collection tools, hired additional support staff, or implemented various strategies to assist nurses with this task. The data collection burden was also reduced for those facilities that implemented electronic medical records (EMRs). ECCP nurses primarily collected data on residents transferred to the hospital and used this information to conduct root cause analysis (RCA) of the events leading up to the hospitalizations. This information was also used to develop facility quality improvement plans to reduce future avoidable hospitalizations (OPTIMISTIC, MOQI, ATOP, and NY-RAH). The NY-RAH ECCP RN collected data on residents and presented monthly findings on hospitalizations to designated facility staff, which typically included the administrator, DON, physicians, social workers, and unit nurse managers. These presentations occurred during morning meetings or other regularly planned quality improvement or QAPI meetings. Three ECCPs (MOQI, AQAF, and NY-RAH) hired a floating ECCP nurse who was based at the ECCP headquarters to assist with maintaining data collection activities as needed during position vacancies and to address data collection burden.
Best Practices. The ECCP nurse’s ability to develop effective relationships with clinical and leadership staff was integral to the success of each ECCP model; this ability also helped facility staff buy-in. Facility buy-in was a major contributor to achieving Initiative outcomes. Buy-in fluctuated across ECCPs and Initiative years. MOQI and UPMC-RAVEN experienced early acceptance of the ECCP nursing staff beginning in Initiative Year 1, while the remaining ECCPs saw a more gradual acceptance in subsequent Initiative years. Facilities with stable

26
leadership staff were reportedly more successful in implementing Initiative goals, particularly facilities with a DON who supported the Initiative. The ECCP Medical Director’s level of engagement, collaboration, and regular communication with the ECCP nursing staff also contributed to the pace at which facility staff accepted the ECCP nurses. ECCP nurses with expertise in gerontologic nursing and experience in long-term care were more successful, adapted to their roles sooner and, were more accepted in participating facilities compared to nurses who did not have similar experience.
The availability of the ECCP nurses to provide clinical consultations during resident changes in condition, as well as regular care situations, contributed to the success of the Initiative. ECCP nurses who could provide clinical assessment, were assigned to a designated facility, and were present full time throughout the week seemed to contribute to improving resident care and avoiding unnecessary hospitalizations. Facility buy-in and acceptance of the ECCP nurses took longer in geographic areas where the nurses were not able to visit each facility regularly because of long travel distances (ATOP). Facility interviewees also emphasized the value of ECCP nurse trainings (e.g., INTERACT tools) to improving knowledge and skills for facility staff. One-on-one education at the point of care between the ECCP nurse and facility nurse was said by DONs to be the most effective teaching–learning strategy. The 2016 assessment of facility engagement with ECCP nurses is presented in Figure 2-2.
Challenges and Lessons Learned. Data collected during the evaluation indicated barriers to involving nurses in ECCP models. Generally, the difficulties in hiring ECCP nursing staff, particularly experienced APRNs with gerontologic or long-term care experience, was viewed as a barrier to implementation of the Initiative. Lack of understanding of the ECCP APRN and RN roles and inconsistent implementation of the roles across facilities was also a barrier. While specific turnover data were not available to the evaluation, turnover of ECCP nurses was reported across all ECCPs as contributing negatively to the implementation and sustainability of the Initiative. Substantial time and effort were expended to educate and demonstrate to physicians, residents, and family members that residents could be safely and effectively cared for in the nursing facility when appropriate. Resistance to ECCP nurses caring for residents in the facility decreased over the course of the Initiative as physicians, patients, and family members developed trust in the ECCP nurses and facility staff’s skills and judgment.
The major state-specific barrier was the uneven scope of practice across ECCP APRNs related to state laws. Of the five ECCPs with APRNs, Nebraska (Alegent) and Nevada (ATOP) are the only states that have nurse practice acts that grant full practice authority to nurse practitioners. As previously noted, despite full practice authority there were ECCP-imposed APRN barriers to autonomous practice. Missouri has the most restrictive nurse practice act regulations, including written formal CPAs with physicians (Table 2-2).

27
Figure 2-2 Facility engagement with ECCP nurses, 2016
NOTE: Number of facilities evaluated: AQAF = 21, OPTIMISTIC = 12, MOQI = 13, Alegent = 13, ATOP = 22, NY-RAH = 21, UPMC-RAVEN = 13. NOTE: During the 2016 site visits, RTI interviewers asked facility and ECCP staff about their levels of engagement with the Initiative, where high engagement described facilities that had embraced most aspects or components of the Initiative; moderate engagement described facilities that were fairly engaged with many components or highly engaged with some components and weaker on others; and low engagement described facilities that had not embraced much of the Initiative or resisted many Initiative components. SOURCE: RTI evaluation of facility engagement using site visit and telephone interview data (data collected 2016).
At the core of sustaining the current ECCP models was the ability to attract and retain qualified ECCP nurses and have the economic resources to pay them. Facility leaders expressed doubt about being able to afford to pay the ECCP nurses when the Initiative ended, particularly the APRNs because of their high salaries. Physician buy-in of the role of the ECCP nurses, particularly the APRNs, was reported as essential to sustaining the model. The continued focus by DONs on avoidable hospitalizations was also reported as integral to sustaining the outcomes achieved in the Initiative. Facilities where the DON was a consistent presence, understood the role of the ECCP nurses, and was engaged in the Initiative were reportedly essential to sustaining the goals achieved across all Initiative years and reducing unnecessary hospitalizations. Facility leadership also believed that the knowledge, skills (e.g., SBAR and Stop and Watch), and confidence attained by facility nurses through the Initiative could be sustained through continued reinforcement by facility education and development of nursing staff. The multiple successes of the Initiative across different but complementary ECCP models underscores the pivotal role of APRNs and RNs intervening on behalf of nursing facility residents to reduce unnecessary hospitalizations.
2.4 Documenting Change of Condition in Residents and Improving Communication Across Providers
To reduce potentially avoidable hospitalizations, ECCPs implemented methods to improve communication about recognition, assessment, and management of changes in resident condition. To accomplish this goal, ECCPs provided support for improved communication and coordination among facility staff, hospital staff, PCPs, and other specialists and pharmacies
6271 77
46
6852
83
24
29 23
23
9
14
814
31 2333
8
0
20
40
60
80
100
AQAF OPTIMISTIC MOQI Alegent ATOP NY-RAH UPMC-RAVEN
Faci
litie
s (%
)
LowEngagement
ModerateEngagement
HighEngagement

28
using evidence-based tools such as INTERACT. A prior independent evaluation of the use of INTERACT tools found a 17 percent reduction in hospital admissions at an average cost of $7,700 per nursing facility with projected savings to Medicare of $125,000 per year per 100-bed nursing facility (Ouslander et al., 2011).
ECCPs typically introduced some or all the following tools: INTERACT Stop and Watch, SBAR, and Care Paths; AMDA (The Society for Post-Acute and Long-Term Care Medicine) Clinical Practice Guidelines and the Know-It-All Before You Call data collection system; Advancing Excellence tools; and various ECCP-specific tools. The INTERACT Stop and Watch and SBAR were the two tools used most widely. The uptake of these tools increased over the duration of the Initiative, but variation in use continued. Corporate and facility leadership buy-in substantially increased tool use. Some ECCPs, such as OPTIMISTIC, NY-RAH, and ATOP, found some participating facilities had implemented INTERACT tools prior to the Initiative. Of note, other unrelated initiatives, such as DSRIP (Delivery System Reform Incentive Payment) in New York required use of the SBAR. ECCPs also related that several corporations had mandated use of INTERACT tools in all their facilities, including those facilities participating in the Initiative and facilities that were not participating. Our survey of comparison group facility administrators found that 79 percent of comparison facilities used tools such as the SBAR and Know-It-All Before You Call. Seventy-one percent of respondents stated they used the Stop and Watch or other tools that alerted staff to changes in condition.10
All ECCPs provided INTERACT training to their nurses during Initiative boot camps. ECCP nurses, in turn, trained facility staff using formal in-service meetings, change-of-shift discussions, and/or one-on-one sessions. OPTIMISTIC used real-time changes in condition to educate staff on how to complete both the SBAR and Stop and Watch tools. Most training efforts were the responsibility of the ECCP staff, and ECCP staff repeated training to educate new staff and to reinforce use of the tools. Facility leadership noted that ECCP nurses, by educating and mentoring staff, improved the frequency of use and the quality of the information recorded on tools. In at least three ECCPs, facility leadership reported that even though staff were not consistently completing tools, staff members were more aware of changes in condition, performed better resident assessments, and communicated better with practitioners as a result of the Initiative.
SBAR11—Facility nurses were responsible for completing SBAR tools; ECCP nurses modeled their use in facilities that were initially unfamiliar with the form. Facility nurses reported the SBAR provided clinical guidance, helped organize their assessment findings, and increased their level of confidence when calling a PCP. As the Initiative progressed, many PCPs
10 Ingber, M., Feng, Z., Khatutsky, G., Bayliss, W., Bercaw, L., Breg, N., Coomer, N., et al. Evaluation of the
Initiative to Reduce Avoidable Hospitalizations Among Nursing Facility Residents: Final Annual Report Initiative Year 3. Report prepared for Centers for Medicare & Medicaid Services, January 2016. Available at: https://innovation.cms.gov/Files/reports/irahnfr-finalyrthreeevalrpt.pdf.
11 The original INTERACT SBAR acronym represented Situation, Background, Assessment, and Recommendation. Starting with version 2, the representation changed to Situation, Background, Appearance, and Review and Notify. The latter versions replaced the “assessment and recommendation” component ostensibly to eliminate the concern that assessment is not within the scope of practice of licensed vocational/practical nurses (LVN/LPN).

29
became more receptive to receiving the tool and some were adamant that nurses complete the SBAR prior to calling about a change in condition. DONs stated having a completed SBAR was especially beneficial when communicating with an on-call PCP who typically was less familiar with residents and facility staff. Completed SBARs were often included in transfer packets when a resident was sent to the emergency department (ED) or hospital. Facility quality assurance programs also reviewed completed forms to help determine what interventions were or could be provided to prevent resident hospitalizations. For example, OPTIMISTIC reviewed SBAR information to determine whether facilities needed additional equipment or on-site diagnostic services. Some ECCPs, including NY-RAH, AQAF, and OPTIMISTIC, tracked if and how well facility staff had completed the SBAR with hospital transfers and used these data to inform educational efforts. Some corporate headquarters of facilities participating in ATOP also required SBAR completion.
ECCPs, such as OPTIMISTIC, and facilities often used modified versions of the SBAR, typically shortening the 3-page INTERACT version to a shorter 1-page format. Some corporations used multiple versions of the SBAR form, tailored for different conditions. Facilities reported that the LVN/LPN completed the situation (S) and background (B) information, but an RN or APRN had to complete the assessment (A) and recommendation (R) portions of the tool. This ostensibly placed a burden on facilities that had a nursing staff composed mostly of LVN/LPNs, making shortened versions of SBAR sometimes more manageable for facilities.
Staff experience and perception of the SBAR’s utility resulted in variations in use. Some staff nurses articulated that inexperienced staff needed the clinical guidance provided by tools such as the SBAR; however, experienced staff felt the tools were unnecessary. Recent nursing school graduates often had been exposed to the tools during their education and were more accepting of their use. Although these nurses lacked the clinical expertise to recognize and assess changes in condition, they were more comfortable completing the tools, which they accepted as normal practice. Nurses also were not always clear about the circumstances under which the SBAR should be used. Some nurses used the SBAR with any change in condition, some used it only if they were going to communicate with the PCP, and still others used it only when an ED transfer was anticipated. Nurses also were concerned that taking time to complete the SBAR was seen as interfering with care of residents, especially in crisis situations. In some facilities, this resulted in completion of the tool after the fact, fundamentally defeating the purpose of the tool. In a few ECCP locations, PCPs were in facilities up to 7 days per week. In these facilities nursing staff related it was unnecessary to complete tools because they could communicate directly with the PCP. Likewise, OPTIMISTIC facility nurses reported they often relayed changes in condition to the ECCP nurses and, in those situations, did not consistently complete the SBAR. The 2016 assessment of facility engagement with the SBAR or other tools to standardize communication between nurses and physicians is presented in Figure 2-3.

30
Figure 2-3 Facility engagement with forms to standardize communication between nurses and
physicians, 2016
NOTE: Number of facilities evaluated: AQAF = 21, OPTIMISTIC = 12, MOQI = 13, Alegent = 13, ATOP = 22, NY-RAH = 21, UPMC-RAVEN = 13. SOURCE: RTI evaluation of facility engagement using site visit and telephone interview data (data collected 2016). NOTE: During the 2016 site visits, RTI interviewers asked facility and ECCP staff about their levels of engagement with the Initiative, where high engagement described facilities that had embraced most aspects or components of the Initiative; moderate engagement described facilities that were fairly engaged with many components or highly engaged with some components and weaker on others; and low engagement described facilities that had not embraced much of the Initiative or resisted many Initiative components.
Stop and Watch—Nursing assistants and staff from non-nursing departments such as therapy, housekeeping, dietary, and activities, used the Stop and Watch to document resident changes in condition. In some facilities, even family members were encouraged to use the form. Several nursing assistants reported that using the Stop and Watch was empowering and helped make them feel more a part of the care team. Several ECCPs made a multiple-copy version of the form for distribution to the ECCP nurse, nurse supervisor, and/or DON, ensuring that licensed nurses followed up on the reported change in condition.
Many nursing assistants continued to prefer verbal communication, citing a dislike for paperwork. One licensed nurse stated she thought that having to complete additional paperwork dissuaded some nursing assistants from reporting a change in condition. Other barriers to using the Stop and Watch tools included literacy issues or workflow interruptions (i.e., stopping care in order to document the change). ECCP and facility leadership often provided incentives (e.g., edible treats) to encourage nursing assistant use of the Stop and Watch. ECCPs tried other approaches such as simplifying the form, making it more readily accessible, and increasing font size to encourage use. Repeated educational sessions often resulted in an initial uptick in usage; however, use often declined with time, due to staff turnover or other factors. Facility engagement with the Stop and Watch or other tools to document changes in residents’ conditions, assessed in 2016, is presented in Figure 2-4.
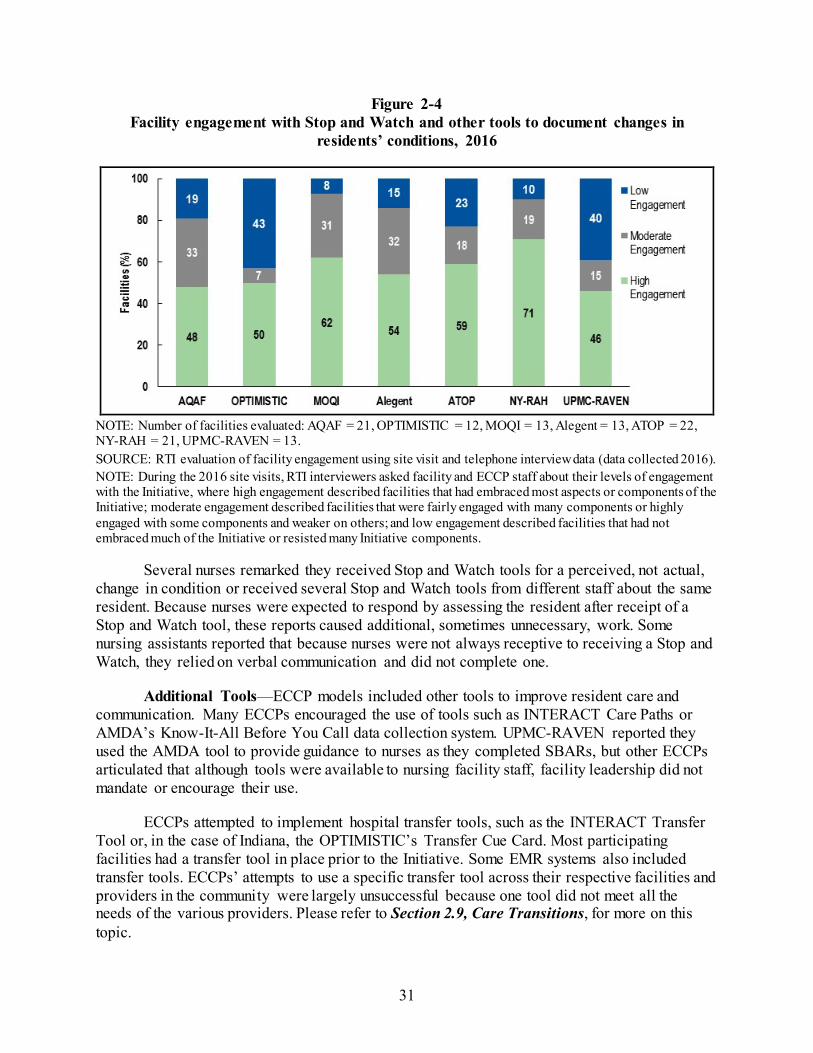
31
Figure 2-4 Facility engagement with Stop and Watch and other tools to document changes in
residents’ conditions, 2016
NOTE: Number of facilities evaluated: AQAF = 21, OPTIMISTIC = 12, MOQI = 13, Alegent = 13, ATOP = 22, NY-RAH = 21, UPMC-RAVEN = 13. SOURCE: RTI evaluation of facility engagement using site visit and telephone interview data (data collected 2016). NOTE: During the 2016 site visits, RTI interviewers asked facility and ECCP staff about their levels of engagement with the Initiative, where high engagement described facilities that had embraced most aspects or components of the Initiative; moderate engagement described facilities that were fairly engaged with many components or highly engaged with some components and weaker on others; and low engagement described facilities that had not embraced much of the Initiative or resisted many Initiative components.
Several nurses remarked they received Stop and Watch tools for a perceived, not actual, change in condition or received several Stop and Watch tools from different staff about the same resident. Because nurses were expected to respond by assessing the resident after receipt of a Stop and Watch tool, these reports caused additional, sometimes unnecessary, work. Some nursing assistants reported that because nurses were not always receptive to receiving a Stop and Watch, they relied on verbal communication and did not complete one.
Additional Tools—ECCP models included other tools to improve resident care and communication. Many ECCPs encouraged the use of tools such as INTERACT Care Paths or AMDA’s Know-It-All Before You Call data collection system. UPMC-RAVEN reported they used the AMDA tool to provide guidance to nurses as they completed SBARs, but other ECCPs articulated that although tools were available to nursing facility staff, facility leadership did not mandate or encourage their use.
ECCPs attempted to implement hospital transfer tools, such as the INTERACT Transfer Tool or, in the case of Indiana, the OPTIMISTIC’s Transfer Cue Card. Most participating facilities had a transfer tool in place prior to the Initiative. Some EMR systems also included transfer tools. ECCPs’ attempts to use a specific transfer tool across their respective facilities and providers in the community were largely unsuccessful because one tool did not meet all the needs of the various providers. Please refer to Section 2.9, Care Transitions, for more on this topic.

32
Variability existed across and within ECCPs as to whether tools such as the SBAR were incorporated into paper and electronic systems. For example, Alegent reported the SBAR was well integrated into EMRs in participating facilities and served as the nurse’s note. These facilities had higher use of the form than facilities that used a paper format of the tool. Other ECCPs such as OPTIMISTIC found that an electronic version could discourage use, citing the tool did not cross-populate to other forms within the EMR and resulted in additional documentation. Staff were more receptive to tools that replaced and did not duplicate documentation. One advantage to electronic versions of tools was the ease with which physicians could access them.
Summary—ECCPs introduced a variety of tools in their models, but supported tools that were either already in place prior to the Initiative or that corporations/facilities preferred. Corporate and facility support was critical to successful implementation and sustainability of tool use. ECCP staff efforts at promoting tool use were also integral to success. In addition, staff perception of tool utility and ease of use impacted both uptake and sustainability of tools. According to the Initiative Year 4 survey of nursing facility administrators, the vast majority of respondents indicated they would be more likely than not to continue use of tools such as Stop and Watch and SBAR. Despite obstacles to implementation and sustainability, many facilities reported they believed use of tools, particularly the SBAR, had resulted in prevention of avoidable hospitalizations.
2.5 Education and Training
Each ECCP model included an educational component, and overall, education efforts were well received across most participating facilities. ECCPs provided education to facility staff on an array of topics, most often focusing on consistent use of INTERACT and similar tools to improve communication skills of facility staff. The education goals for INTERACT were threefold: (1) training facility staff to use Initiative tools and processes to reduce avoidable hospitalizations; (2) maintaining use of these tools and processes over time; and (3) establishing a mechanism within facilities to provide ongoing support for use of these tools and processes beyond the life of the Initiative. Other content areas that ECCPs covered in educating staff, residents, and families over the course of the Initiative are described in Table 2-4.
ECCPs’ educational programs typically fit into one of two categories. AQAF and NY-RAH staff did not provide any clinical care, instead focusing their education efforts on reducing potentially avoidable hospitalizations by encouraging facility culture change and supporting best practices by facility staff. All other ECCPs used education along with the clinical care that they provided to enrolled residents. Another clear distinction exists regarding the diversity of topics covered by ECCP education programs. ECCPs housed within QIOs (AQAF and ATOP) or universities (OPTIMISTIC and MOQI) typically provided education on a wider range of topics compared to other ECCPs.
All ECCPs employed RNs, APRNS, or both, who provided training to facility nurses and other staff. ECCPs were evenly divided between those that primarily used RNs and those using APRNs to provide training, although OPTIMISTIC used both types of nurses equally. Nearly all ECCPs worked with partners or specialized ECCP staff to provide training on specific topics. For example, Alegent’s dental hygienists regularly trained facility CNAs on best practices for

33
dental hygiene, while UPMC-RAVEN worked with two subcontractors to provide specialized training to facilities on a variety of topics including palliative care, telemedicine, and dementia care. In addition to the training provided by ECCP staff and their subcontractors, ECCPs sometimes used a “train-the-trainer” model in which they provided the training to facility leadership so that leadership could continue to train facility staff. NY-RAH, ATOP, AQAF, and MOQI used this model during at least part of their implementation periods.
Table 2-4 ECCP training topics
ECCP Communication
(e.g., INTERACT) End-of-life Quality
Improvement Medication management
Specific conditions1 Technology
AQAF ● ● ● ● ● OPTIMISTIC ● ● ● ● ● MOQI ● ● ● ● ● ● Alegent ● ● ● ATOP ● ● ● ● ● NY-RAH ● ● ● ● ● UPMC-RAVEN ● ● ● ● ●
1 Condition-specific training included content on dementia, pneumonia, fall prevention, chronic obstructive pulmonary disease (COPD), dehydration, and incontinence as well as caring for IVs, catheters, and nasogastric tubes, among other specific care needs.
All seven ECCPs included content on improving communication and using INTERACT tools. Some ECCPs also included content from other sources (e.g., AMDA), and ECCPs varied in how they taught the INTERACT tools, either using the INTERACT tools as designed or using INTERACT as a general model for ideal communication. For example, UPMC-RAVEN brought in outside educators who used high-tech “simulation man” manikins to train facility staff on identifying changes in condition as part of the INTERACT SBAR training. Other training topics across ECCPs typically focused on training facility staff to use other ECCP tools, such as the POLST and tools for QI.
Some ECCPs also offered additional training on specific topics. For example, ATOP facilities often requested condition-specific, procedure-specific, or clinical trainings, such as dehydration prevention, catheter placement training, and management of chronic obstructive pulmonary disease (COPD). In Initiative Year 3, ATOP offered LEAP (Lead, Empower, Achieve, Produce),12 a training targeted at CNAs and designed to build clinical capacity. Similarly, AQAF introduced new training topics in each year of the Initiative, which focused on topics such as medication management and dementia. Although these additional trainings often reflected the most recent literature on best practices, a few facilities expressed frustration with the lack of consistent focus. Some trainings were more generalized to nursing facility operational
12 Piven, M. L. et al. “PAYING ATTENTION: A Leap Toward Quality Care.” Director (Cincinnati, Ohio) 15.1
(2007): 58–63.

34
goals (e.g., nurse retention improvement, survey-related activities) for frontline staff, and AQAF offered specialized leadership training for facility administrators. Facilities tended to show the most support for these trainings when they were involved in choosing the topics presented.
ECCPs also exhibited variation in the way they provided educational material to facilities. Some trainings, such as Stop and Watch, were offered to the entire facility (e.g., nursing staff, dietary, therapy, and housekeeping staff). Other trainings occurred in facilities during off hours to reach night- and weekend-shift staff. All ECCPs conducted in-service trainings and provided direct coaching to facility staff. UPMC-RAVEN and Alegent provided fewer didactic in-service sessions as the Initiative progressed. OPTIMISTIC and NY-RAH shifted from providing more formal, longer in-service sessions to shorter training sessions for individuals or small groups. Facility staff appreciated that these smaller trainings allowed nursing staff to remain on the floor while receiving training. A smaller number of ECCPs also provided written or online resources to facilities, although facility staff typically used these resources infrequently. Formats that engaged staff were most successful. Coaching was well suited for engaging staff, although it is resource intensive, particularly in light of high nursing and CNA turnover rates in many facilities. Written or online sources may have useful content, but the evaluation team saw limited evidence of facility staff actually using these materials. Engaging, interactive in-service sessions, supplemented by support from facility leadership and individual coaching by ECCP staff, seemed to be a reasonable compromise for most of the ECCPs. The most recent assessment of facility engagement with ECCP education and training is presented in Figure 2-5.
Figure 2-5 Facility engagement with ECCP education and training, 2016
NOTE: Number of facilities evaluated: AQAF = 21, OPTIMISTIC = 12, MOQI = 13, Alegent = 13, ATOP = 22, NY-RAH = 21, UPMC-RAVEN = 13. SOURCE: RTI evaluation of facility engagement using site visit and telephone interview data (data collected 2016). NOTE: During the 2016 site visits, RTI interviewers asked facility and ECCP staff about their levels of engagement with the Initiative, where high engagement described facilities that had embraced most aspects or components of the Initiative; moderate engagement described facilities that were fairly engaged with many components or highly engaged with some components and weaker on others; and low engagement described facilities that had not embraced much of the Initiative or resisted many Initiative components.

35
Despite general appreciation for ECCP-provided education by most participating facilities, ECCPs faced several barriers to enacting permanent changes to facility staff behavior. These barriers included frequent turnover of facility staff and a lack of incentives for facility staff to implement the lessons outlined in ECCP training. Site visit data indicated that without a clear incentive to change staff behavior and ongoing reinforcement for such changes by facility leadership, the education efforts were unlikely to be effective. This reinforcement can take the form of facility-level policy changes, such as the mandated use of a particular tool or practice. Even in ECCPs that instructed facility staff to use the INTERACT tools as designed, these ECCP directions sometimes contrasted or conflicted with the policies, practices, and tools in individual facilities. Without support from facility leadership and policies, ECCP staff were limited in their ability to leverage the education to enact consistent changes among staff in all participating facilities.
Leadership buy-in was a key facilitator for ECCP education efforts. ECCPs implemented specific efforts to improve this buy-in. Toward the end of the Initiative, some AQAF staff began to shift their focus from educating facility staff to a more top-down approach that provided mentorship and education directly to facility leadership. ECCP staff, facility leadership, or facility educators also reinforced education by providing ongoing support and encouragement, such as through mentorship or coaching of facility staff.
Education is one component of the Initiative that is particularly likely to produce sustainable changes in participating facilities. With support from facility leadership, adoption of new practices gained through education may endure without the direct presence of ECCP staff. Across all ECCPs, several best practices emerged for using education and training to implement lasting changes in facilities.
2.6 End-of-Life Care
End-of-life (EOL) care in nursing facilities has special significance, as about a quarter of long-term care residents die every year; yet, the quality of EOL care these residents receive varies because many nursing facility staff do not have the training needed to provide effective palliative or EOL care (Unroe et al., 2015). Furthermore, nursing facility residents may not fully benefit from EOL care delivered through the Medicare hospice benefit because of barriers perceived by nursing facilities, such as reduced and delayed payments (Miller et. al., 2011). Although a focus on EOL care planning in nursing facilities, and the community in general, has been lacking, some recent changes to federal requirements have acknowledged its importance (Ersek & Stevenson, 2013). For example, in early 2016, a national policy to reimburse
Initiative Education Best Practices
Engage facility leadership to provide ongoing reinforcement and supportive policies.
When possible, supplement formal in-services with individualized coaching and mentorship.
Focus educational content on a small number of key skills and provide opportunities for reinforcement.
Engage facilities in identifying topics for training. Provide education on key skills or new tools incrementally
and use facility feedback to influence future training. Allow staff to use paid work time to participate in
education; offer training to off-shift staff Offer repeated trainings and ongoing reinforcement.

36
physicians for conducting advance care planning discussions with Medicare beneficiaries and their families was established.13
All ECCPs initially adopted a component(s) of EOL care planning as part of the Initiative, although it was not a formal Initiative requirement. All models implemented advance care planning (ACP) tools. Most ACP tools were not developed by ECCPs, rather state-endorsed POLST tools or standard advance directives. In addition, almost all ECCPs educated nursing facility staff, including social workers and physicians, to have more comfortable EOL discussions with families and patients, as well as to educate families and residents about EOL care treatment options. Some ECCPs also focused on increasing the number of residents with advance directives, and others focused on reviewing resident advance directives for completeness and needed updates. Facility engagement with EOL care, assessed in the final year of the Initiative, is presented in Figure 2-6.
Figure 2-6 Facility engagement with end-of-life care planning, 2016
NOTE: Number of facilities evaluated: AQAF = 21, OPTIMISTIC = 12, MOQI = 13, Alegent = 13, ATOP = 22, NY-RAH = 21, UPMC-RAVEN = 13. SOURCE: RTI evaluation of facility engagement using site visit and telephone interview data (data collected 2016). NOTE: During the 2016 site visits, RTI interviewers asked facility and ECCP staff about their levels of engagement with the Initiative, where high engagement described facilities that had embraced most aspects or components of the Initiative; moderate engagement described facilities that were fairly engaged with many components or highly engaged with some components and weaker on others; and low engagement described facilities that had not embraced much of the Initiative or resisted many Initiative components.
Advance Care Planning Tools: POLST and Advance Directives—All ECCPs focused on implementing ACP tools among their participating nursing facilities. Three clinical ECCP models (ATOP, UPMC-RAVEN, and OPTMISTIC) and one education-only ECCP (NY-RAH)
13 Source: 80 FR 41685, https://www.federalregister.gov/documents/2015/07/15/2015-16875/medicare-program-
revisions-to-payment-policies-under-the-physician-fee-schedule-and-other-revisions.

37
incorporated a version of the POLST.14 POLST and other similar forms capture resident’s preferences for treatment and EOL care, and are recognized by different health care settings, thereby enhancing care coordination across settings. Forms, such as the POLST, are used in the case of medical emergencies and are transferrable between health care settings. These forms do not replace advance directives (e.g., a living will or health care power of attorney), which are used to document an individual’s medical decisions for future, unknown emergencies.15
Clinical and education models differed in their implementation of the ACP tools primarily because of their model designs. Among some clinical models, ECCP RNs or APRNs were often integral to assisting in completing the introduced ACP tools with residents and families. (Please refer to Section 2.3 for more information on the ECCP clinician’s role). Most clinical Initiative ECCP staff were educated on ACP tools first and were given educational materials that could be distributed to their respective facility staff. Both education-only models (AQAF and NY-RAH) initially intended to focus on increasing the number of residents with a completed ACP. However, NY-RAH succeeded in expanding education and awareness surrounding ACP tools (i.e., the MOLST) in its facilities, while AQAF focused only on training facility staff to encourage the use of advance directives, rather than requiring ACP tool use, because DNR orders were not transferrable between hospital and nursing facility settings in Alabama. NY-RAH was more successful in the implementation of the MOLST form because it was already state-endorsed and is transferrable between health care settings.
Education for Facility Staff and Families—ECCPs used varied approaches to educating facility staff and families on ACP. Most ECCPs provided training or support to nursing facility staff responsible for ACP tools (i.e. physicians and social workers). The clinical models also provided direct training for their ECCP APRNs and RNs on EOL care and the purpose and use of the ACP tool. Two ECCP models (NY-RAH and ATOP) used a member of ECCP leadership to provide training directly to ECCP and facility staff and some models used consultants (NY-RAH and MOQI) to provide additional training on ACP tools. ATOP and OPTIMISTIC also conducted non-Initiative trainings on ACP tools in health care community forums and in hospices and hospitals.
Most models also educated families and direct care staff on EOL care communication, although some ECCPs delivered these trainings during later Initiative years (Initiative Years 3 and 4). OPTIMISTIC, UPMC-RAVEN, and NY-RAH provided trainings developed by The Conversation Project, Gundersen Health System (Respecting Choices), or INTERACT to help direct care staff become more comfortable with initiating and conducting EOL conversations. UPMC-RAVEN also had a consultant provide direct training to families, and both MOQI and
14 States endorse different versions of the Physician Orders for Life Sustaining Treatment (POLST) model, which
are very similar but have a few unique differences. Nevada uses the Nevada POLST, Indiana uses the Indiana Physician Orders for Scope of Treatment (POST), New York uses the New York Medical Orders for Life Sustaining Treatment (MOLST), and Pennsylvania uses the Pennsylvania POLST. Nebraska, Missouri, and Alabama did not have state-developed or endorsed POLST forms during the Initiative. There is some variation among these forms. For example the Pennsylvania POLST allows both APRNs and PAs to sign these forms, whereas other state-specific versions allow only the physician to sign. Notably, the MOLST form also includes a “do not hospitalize” order.
15 Source: http://polst.org/advance-care-planning/polst-and-advance-directives/.

38
NY-RAH held awareness events (e.g., National Health Care Decision Day) in many facilities. These events aimed to educate staff, residents, and families on the importance of having EOL conversations, increasing comfort with EOL conversations, and the importance of ACP tools. ECCPs found that these awareness events were successful at increasing buy-in for EOL care and improving EOL culture in their facilities.
Barriers and Facilitators to Implementation—Barriers to EOL interventions arose over the 4 Initiative years; in response, ECCPs implemented some modifications to their EOL activities and ACP tools. ECCPs reported barriers with physician, corporate, social worker, and nursing facility staff buy-in and resident and family receptivity. Several ECCPs reported that some physicians lacked awareness of the ACP tools before the tools were introduced, and others felt the ECCP-imposed ACP tools were burdensome and unnecessary if other advance directive or care plan tools (e.g., facility or corporate tools) were already used in their facilities. Similarly, in some facilities, administrators and corporate staff felt that pre-existing advance directive forms were sufficient in the ACP process, thus reducing buy-in for ECCP efforts. In addition, several ECCPs stated that physicians did not devote sufficient time to participate in in-depth EOL conversations with residents and families, thereby putting the onus on social workers. These ECCPs suggested that physicians “make or break” the use of ACP tool use, because their signature is required on the forms. One ECCP reported increased physician buy-in after a board certified, palliative care ECCP physician, who was a member of the leadership team, directly engaged physicians and social workers.
Another barrier was resistance by families and residents to have EOL care planning discussions. Several clinical ECCP models educated families on quality of life issues and the importance of establishing a clear care plan for their loved ones at the end of life; this proved productive and increased the completion of ACP tools. A few clinical ECCPs were successful in making families comfortable with EOL decisions by explaining clinical care options. Clinical ECCP staff were generally able to dedicate substantial time to end-of-life care discussions, build rapport with residents and families, and facilitate receptivity to in-depth EOL conversations. However, some ECCP nurses reported families’ resistance to having EOL conversations because of cultural and faith-based reasons. For residents with dementia and without family members, guardians are assigned by states to act as health care surrogates for residents; ECCP staff reported that guardians are generally unwilling to make EOL decisions on behalf of residents. This issue was reported as very prevalent in the ATOP facilities.
Progress with EOL Care—Overall, most ECCPs increased awareness around the importance of ACP in the participating facilities and helped to increase use of ACP tools. However, the potential sustainability of improved EOL care planning was reported to be variable across ECCPs. Progress improving family and resident resistance to EOL care planning was less notable in some ECCPs. Staff and physician buy-in proved to be most essential to the success of this component of the Initiative. Training for ECCP staff delivering EOL interventions was imperative to its success and ability to change EOL ACP practices in nursing facilities. Because ECCP RNs and APRNs were responsible for completing ACP tools in most facilities, for the clinical models to be sustained, targeted training for key facility-based staff (i.e., physicians and social workers) would be necessary. For example, for the NY-RAH model to be sustainable, continued buy-in from physicians and social workers would be essential in addition to more staff training on EOL care planning conversations. State policy may also affect the use and

39
sustainability of ACP tool use. Four ECCPs are in states (Nevada, Indiana, New York, and Pennsylvania) that have state regulations16 that endorse using a POLST, or other similar, form. Other ECCPs are in states with no endorsement of such a tool; therefore, cross-setting coordination of ACP could continue to be a challenge in those facilities.
Overall, despite major challenges, the EOL care model components appear to have been effective at promoting EOL care culture change and improving awareness and use of ACP tools.
2.7 Quality Improvement
Health care quality measures have gained prominence as a means of evaluating facility performance, allowing comparisons across facilities to ensure provision of quality care to residents. One of the primary objectives of quality measurement is to use market-based forces to promote quality, with higher-performing facilities receiving better ratings and resulting increases in public demand; lower-performing facilities receive poor ratings and possible financial penalties. In addition, Section 215 of the 2014 Protecting Access to Medicare Act (PAMA) authorized the implementation of the Skilled Nursing Facility Value-Based Purchasing (SNF VBP) Program. The SNF VBP Program rewards SNFs for high-quality care of Medicare residents by creating incentives for reducing unplanned hospital readmissions. The SNF VBP targets potentially preventable readmissions, discouraging SNFs from returning residents to the hospital if care can be provided successfully in the SNF and discharge transitions are successful. The SNF VBP will redistribute a portion of SNF Medicare payments based on performance in the program beginning October 1, 2018. Spillover is expected from SNF VBP such that facilities with SNF beds likely will change facility-wide practices to avoid readmissions for all residents, not just the skilled nursing residents. Similarly, the Affordable Care Act (2010) requires CMS to establish regulations for QAPI in nursing facilities. Although these regulations have not yet been published, CMS is preparing for publication in the next few years by releasing a number of tools and resources for facilities to develop their QAPI programs using a data-driven approach to improve care quality and facility safety. To this end, one of the primary goals of the Initiative is improving resident care quality by reducing avoidable hospitalizations, helping to prepare facilities for upcoming requirements such as SNF VBP and QAPI.
Each ECCP model included components for quality improvement (QI), QAPI, and/or RCA to ensure that participating facilities improve care quality in their efforts to reduce avoidable hospitalization rates. CMS had required facilities to have some QI plans in place, so these newer quality concepts were not unfamiliar to participating facility staff; rather, ECCPs encouraged facilities to take additional steps to expand their existing QI efforts in preparation for forthcoming QAPI requirements. ECCPs varied in their methods to address care quality, although the majority of ECCPs worked with facilities on the following: (1) training on the use of tools, such as the INTERACT QI tools; (2) developing teams of facility staff to identify and
16 Nevada POLST Regulations: http://www.nevadapolst.org/wp-content/uploads/2014/04/POLST-NRS-449.691-
697.pdf; Indiana POST Regulations: http://www.in.gov/legislative/bills/2013/HE/HE1182.1.html; Pennsylvania POLST endorsement: http://www.americanbar.org/content/dam/aba/administrative/law_aging/POLST_Legislative_Chart.authcheckdam.pdf; New York Health Department MOLST endorsement: https://www.health.ny.gov/professionals/patients/patient_rights/molst/.

40
support QI goals; (3) documenting hospitalizations and reporting data to facilities; (4) conducting RCA on past hospitalizations to determine whether these events could have been prevented; and (5) arranging regular discussions to identify potential areas of facility improvement that might result in fewer hospitalizations.
ECCPs encouraged use of tools, such as the INTERACT or ECCP-specific QI tools, to accomplish three key goals: (1) document outcomes of resident transfers to hospitals (e.g., ED visits that resulted in admissions), (2) track hospitalization trends and facility functions that may lead to hospitalizations over time, and (3) aid facilities in developing performance improvement plans or RCAs to determine whether a hospital transfer could have been avoided. UPMC-RAVEN and NY-RAH developed additional ECCP-specific tools for use in their participating facilities. In addition, a small number of for-profit facilities across ECCPs used QI tools mandated by their corporations, rather than INTERACT or ECCP-specific tools, but these corporate tools also were similar to INTERACT and were described as accomplishing the same goals.
Over the 4 years of the Initiative, QI activities targeted toward reducing hospitalizations gained traction in most ECCP facilities. QI was not a focus early on, as ECCPs targeted the initial goals of encouraging relationship development between ECCP nurses and facilities and deploying other INTERACT tools, such as Stop and Watch and SBAR. As facilities became more comfortable with these early Initiative components, many facilities across ECCPs embraced QI, making tool use part of their facility culture. Facility engagement with QI activities, assessed in the final year of the Initiative, is presented in Figure 2-7. AQAF also developed teams that met regularly (e.g., monthly) with staff members across levels and departments in the facility to discuss trends and potential areas of performance improvement on topics such as reducing hospitalizations, improving staff stability, and reducing use of antipsychotics and polypharmacy. Some facilities across ECCPs also invited ECCP nurses to attend their existing QI team meetings. MOQI, ATOP, and Alegent focused on specific topics or conditions linked to hospitalizations, such as preventing falls or reducing urinary tract infections and conducted RCAs to find ways to decrease incidences of these health issues. ECCP nurses provided ongoing data reports to many facilities to help track trends and potential improvement, and some facilities noted substantial reductions in hospitalization rates in these data reports as a result of the ECCP QI efforts.
Variation existed across and within ECCPs, with some facilities becoming more invested in QI/QAPI/RCAs and others considering QI to be a somewhat lower priority. Facilities with other challenges (e.g., staff retention concerns) tended to place less importance on QI, instead prioritizing other Initiative goals. In facilities where QI was not a main focus, ECCP nurses had mixed roles; some attended existing facility QI meetings infrequently, and a few were blocked entirely from QI participation by facility staff. However, in those facilities where QI efforts took root, facility staff reported that the ECCP nurses were responsible for helping establish new quality programs. These ECCP staff helped introduce the concepts and taught facility staff how to document concerns, identify trends, and respond with plans for improvement. ECCP staff also played a critical role in documenting hospitalization rates to ensure that quality efforts were data driven, helping facilities identify ways to improve resident care and reduce avoidable hospitalization rates.

41
Figure 2-7 Facility engagement with QI/QAPI/RCA, 2016
NOTE: Number of facilities evaluated: AQAF = 21, OPTIMISTIC = 12, MOQI = 13, Alegent = 13, ATOP = 22, NY-RAH = 21, UPMC-RAVEN = 13. SOURCE: RTI evaluation of facility engagement using site visit and telephone interview data (data collected 2016). NOTE: During the 2016 site visits, RTI interviewers asked facility and ECCP staff about their levels of engagement with the Initiative, where high engagement described facilities that had embraced most aspects or components of the Initiative; moderate engagement described facilities that were fairly engaged with many components or highly engaged with some components and weaker on others; and low engagement described facilities that had not embraced much of the Initiative or resisted many Initiative components.
Overall, most ECCPs worked to increase facility knowledge and use of QI efforts. As public attention (e.g., SNF VBP), brings quality goals to the forefront, more facilities have embraced the QI/QAPI/RCA supports provided by their ECCP nurses. Success in this area included facility- and ECCP-reported decreases in the use of antipsychotic medications and polypharmacy that may be tied to more frequent hospitalizations; decreased incidence of falls, infections, and certain other conditions that may increase hospitalization rates; and noted reductions in avoidable hospitalization rates in some facilities.
Yet, QI goals cannot succeed without data to identify initial concerns and document changes over time; without ECCP nurses to collect and report data and findings from facilities, facility interviewees from OPTIMISTIC, MOQI, and ATOP expressed concern about the long-term sustainability of Initiative QI efforts, even if facility staff were very engaged in using QAPI or RCAs. To succeed in improving quality goals, facilities seemed to need (1) support for data collection and reporting, and (2) facility leadership and staff who make QI/QAPI/RCAs a key goal with ongoing communication and consistent effort toward improvement. ECCP nurses have been able to meet both of these needs in many cases, but without the support of ECCP staff, many of these quality efforts may be not sustained.
2.8 Medication Review and Management
There are three major challenges related to medication management for long-term nursing facility residents: adverse drug events (ADEs), polypharmacy, and inappropriate use of antipsychotic medications. In response to these challenges, CMS intervention requirements for
42
the Initiative included activities to “coordinate and improve management and monitoring of prescription drugs to reduce risk of polypharmacy and ADEs for residents, including inappropriate prescribing of inappropriate drugs.”17 ADEs, injuries that result directly from taking specific medications, place nursing facility residents at risk and can contribute to potentially avoidable hospitalizations. ADEs can occur because of miscommunication and inadequate coordination of care during transitions between hospitals and nursing facilities as well as because of a lack of coordination between primary care and other health care providers. Polypharmacy, the simultaneous use of multiple drugs by a single patient for one or more conditions, increases the likelihood that an ADE will occur. Finally, inappropriate use of antipsychotic medications (i.e., prescribing in the absence of a documented diagnosis of psychosis18) can negatively impact quality of life and lead to ADEs. Antipsychotic medications are powerful tranquilizers both dangerous to residents and expensive for the Medicare program.
Typical ECCP activities included medication regimen reviews performed by ECCP nurses, presence of pharmacist consultants, and medication education. Strategies across ECCPs focused on decreasing or eliminating medications believed to be no longer necessary or productive for improving the resident’s well-being, such as vitamins, cholesterol-lowering medications, and medications ordered to be administered “as needed.” In addition, ECCP staff and pharmacists reviewed medication regimens and made recommendations that allowed for treatment of conditions or symptoms with fewer medications and/or using medications with fewer side effects.
Medication regimen reviews were usually done when hospitalized residents transitioned back to facilities, during quarterly interdisciplinary care team meetings, and at the time of a change in condition or a major health event such as a fall. As part of medication regimen reviews, ECCP APRNs consulted with ECCP and facility pharmacists as needed and made recommendations to PCPs. In most cases, the APRNs and APRNs did not directly write medication change orders without the approval of the PCP. However, in situations where the relationship between the APRN and PCP evolved and became more trusting, PCPs gave permission to APRNs to write orders (See Section 2.3).
To address medication regimens of more stable, long-term care residents, OPTIMISTIC conducted medication regimen reviews as part of its ECCP-specific CCR process. If modifications to the resident’s regimen were approved by the PCP, the OPTIMISTIC RN and APRN monitored the resident over a 3-week period, after which the APRN performed an evaluation to determine whether the change was beneficial to the resident. During Initiative Year 4, OPTIMISTIC strengthened its medication-related activities by selecting residents who were on 12 or more medications for CCR.
Most ECCPs had pharmacists who were available for consultation, made on-site facility visits, provided education, or a combination of those activities. Pharmacists provided consultation to ECCP staff during regularly scheduled meetings or during as-needed individual
17 Source: https://innovation.cms.gov/Files/x/rahnfr_foa.pdf. 18 Source: https://www.cms.gov/Regulations-and-
Guidance/Guidance/Manuals/downloads/som107ap_pp_guidelines_ltcf.pdf.

43
consultation. Education activities included provision of medication identification cards and newsletters. AQAF’s pharmacy partner provided webinars on topics including “look alike, sound alike,” medications that should not be crushed, and ADEs and reporting. The Alegent pharmacist created newsletters for facility staff and spearheaded the creation of an in-service training on urinary tract infections (i.e., antibiotic stewardship) that was made into an online course that provided continuing education units. Alegent had a pharmacist on its team who consulted with ECCP APRNs and visited facilities on a regular basis. The ECCP APRNs utilized the Long Term Care Medication Outcomes Manager (LTC-MOM)19 tool to make suggestions to PCPs regarding medication changes. Depending on the relationship with the PCP, the Alegent APRN could independently write medication orders. In addition, in rare cases when data collected by Alegent suggested overprescribing of medications, including antipsychotics, the Alegent medical director communicated that information to the facility’s medical director.
In UPMC-RAVEN, ECCP pharmacists (RxPartners) visited facilities and used portable scanners enabling them to collect copies of orders and lab results for review. The pharmacists then made recommendations to the ECCP APRN for approval by the PCP. Information was entered into RxPertise™, which then integrated the information into the UPMC-RAVEN Achieve™ database. In Initiative Year 3 UPMC-RAVEN implemented Psychotropic Medication Interdisciplinary Team Meetings in several facilities to assess residents’ medication regimens for inappropriate psychotropic medications. Similarly, AQAF established a multidisciplinary medication management team in each facility. This team tracked data, such as polypharmacy and antipsychotic reductions and met regularly to review charts and address ongoing concerns related to medication use and processes.
In most cases, ECCP staff were responsible for activities related to medication management. However, several ECCPs believed that facility staff became more aware of medication effects and side-effects through the ECCP activities. An APRN from MOQI made a conscious effort to incorporate facility staff in the process by making facility staff responsible for communicating recommended medication changes to the PCP. Facility engagement with medication management interventions, assessed in the final year of the Initiative, is presented in Figure 2-8.
Most ECCPs encountered barriers to reduction in antipsychotic use. One barrier was the inability of staff to successfully manage behaviors with nonpharmacological interventions when antipsychotic medications were decreased. OPTIMISTIC conducted intensive training on care of residents with dementia; however, despite facility staff lauding the training, they also admitted that care practices did not change as a result. Facility staff in several states reported that some physicians, staff, residents, and residents’ families were not always receptive to changing medications, especially if the resident had been on the medication for an extended period of time. Because of federal requirements for pharmacists to perform monthly medication reviews and gradual dose reductions for psychotropic drugs, many facilities had processes in place and felt efforts by the ECCP were redundant. A few facilities allowed only the facility psychiatrist, working together with the facility social services staff, to adjust psychoactive medications
19 The LTC-MOM focuses on four outcomes: reducing inappropriate prescribing, decreasing polypharmacy,
avoiding adverse events, and maintaining functional status (Bergman-Evans, 2013).

44
because of previously received survey citations for inappropriate reductions of those medications. Finally, at least one corporation objected to attempts to decrease antipsychotics because of liability concerns.
Figure 2-8 Facility engagement with medication management interventions, 2016
NOTE: Number of facilities evaluated: AQAF = 21, OPTIMISTIC = 12, MOQI = 13, Alegent = 13, ATOP = 22, NY-RAH = 21, UPMC-RAVEN = 13. SOURCE: RTI evaluation of facility engagement using site visit and telephone interview data (data collected 2016). NOTE: During the 2016 site visits, RTI interviewers asked facility and ECCP staff about their levels of engagement with the Initiative, where high engagement described facilities that had embraced most aspects or components of the Initiative; moderate engagement described facilities that were fairly engaged with many components or highly engaged with some components and weaker on others; and low engagement described facilities that had not embraced much of the Initiative or resisted many Initiative components.
Several successes were identified as a result of ECCP medication activities. Because of educational efforts, AQAF reported a reduction in the use of sliding scale insulin.20 One group of facilities changed from facility scheduled medication administration times to resident-centered administration times. The resident-centered approach more evenly distributed medication administration times, allowing for a more consistent delivery of medications to residents and potentially decreasing administration timing errors. MOQI was successful in reducing antipsychotic medication use as evidenced by improvement in quality indicator/quality measure scores. The American Health Care Association/National Center for Assisted Living gave an award for reduction of antipsychotic use to two of the MOQI nursing facilities in Initiative Year 2. UPMC-RAVEN leadership reported in one of the Learning Community events in February 2014 that UPMC-RAVEN pharmacists (RxPartners) completed 1,200 medication regimen reviews and recommendations were made on 41 percent of the reviews. The UPMC-RAVEN APRN and/or the primary physician agreed with 89 percent of the recommendations. It was not
20 Sliding scale insulin is on the Beers List of potentially inappropriate medications for use in the elderly.

45
readily apparent if activities related to medication management interventions prevented potentially avoidable hospitalizations.
With most ECCPs, uptake of medication-related interventions was slow. Review of medication regimens was perceived as duplicative of processes already in place, including monthly pharmacy reviews, order reconciliation with admission/readmissions, and mandated gradual dose reductions. Despite these redundancies, facility administrators responded in an Initiative Year 4 survey they would be “likely” to “very likely” to continue the medication management interventions in their respective state models (OPTIMISTIC and UPMC-RAVEN: 100 percent, AQAF: 96 percent, MOQI: 94 percent, NY-RAH: 93 percent, Alegent: 92 percent, and ATOP: 86 percent).
2.9 Care Transitions
Transitions to and from nursing facilities can be fraught with poor communication, including information about residents’ medications, which can lead to ADEs. Forms, such as POLST, that document residents’ wishes may or may not be transferred with the resident. Information that may be important to one care setting, may not be conveyed from another. For example, when residents return from a hospital visit, nursing facilities report that they may not receive information regarding the resident’s last meal, current medications schedule, or even changes in medications. Not all medications and needed supplies are readily available in nursing facilities and they may need advance communication to obtain the correct medications and supplies for incoming residents. From the hospitals’ perspective, lack of communication about capabilities for destination facilities may lead to transferring a resident with certain needs (e.g., ventilator use) to a facility that is not equipped to provide appropriate care.
Therefore, the requirements of CMS’s original ECCP Cooperative Agreement announcement21 included the following: “Facilitate residents’ transitions to and from inpatient hospitals and nursing facilities, including facilitating timely and complete exchange of health information among providers and providing support for residents and nursing facility staff to support successful discharge to the community as appropriate.” CMS did not prescribe a specific model for ECCPs, but allowed applicants to propose their own interventions to improve care transitions.
All ECCPs rolled out their interventions (e.g., recognizing changes in condition, improving communications, medication management) in nursing facilities in stages. In most ECCPs, the focus on transitions did not begin until after the second year of the Initiative. When assessing facility activities, ECCP clinical staff found that nearly all facilities had their own—often corporately mandated—system for documentation of transfers leaving the facility. Those facilities with EMRs often had transfer tools embedded in their EMR. In either case, facilities that had consistent use of certain transfer tools felt they were comprehensive were resistant to adopting a new method. Facility engagement with care transition interventions, assessed in the final year of the Initiative, is presented in Figure 2-9.
21 Source: https://innovation.cms.gov/Files/x/rahnfr_foa.pdf.

46
Figure 2-9 Facility engagement with care transition interventions and communication during
transfers, 2016
NOTE: Number of facilities evaluated: AQAF = 21, OPTIMISTIC = 12, MOQI = 13, Alegent = 13, ATOP = 22, NY-RAH = 21, UPMC-RAVEN = 13. SOURCE: RTI evaluation of facility engagement using site visit and telephone interview data (data collected 2016). NOTE: During the 2016 site visits, RTI interviewers asked facility and ECCP staff about their levels of engagement with the Initiative, where high engagement described facilities that had embraced most aspects or components of the Initiative; moderate engagement described facilities that were fairly engaged with many components or highly engaged with some components and weaker on others; and low engagement described facilities that had not embraced much of the Initiative or resisted many Initiative components.
Facilities generally included the following documents with the resident during a transfer to the ED or hospital: the resident’s face sheet (including diagnoses and health issues, physician and family contact information), current medications list, and medications schedule. Some facilities that had been using the SBAR prior to the Initiative, often included it with the transfer; other facilities, after being introduced to the SBAR, began to include that document with the resident transfer. Nearly all ECCPs included the INTERACT Care Transitions Tool when training facility staff in the INTERACT suite of tools. Although the SBAR was not designed to be used in transfers, facility staff noted that it contained all pertinent and up-to-date information regarding resident condition, and, in many cases, they believed it was more appropriate than the INTERACT transfer form. Other facility staff preferred the INTERACT Transfer Tool, with floor nurses adding that they appreciated that the INTERACT Transfer Tool included an envelope with a reminder checklist of key materials to enclose.
Similarly, some facilities had routinely included the resident’s advance directive, if one had been in place; others had not. After ECCP clinical staff introduced the state-specific POLST or similar forms, and provided training on the importance of including them with the transfer, facilities in most ECCPs began including these documents with the transfers. However, this was not a consistent practice in all facilities, and sending the portable POLST form with residents to the hospital did not always result in the forms returning with the resident upon return to the nursing facility.

47
Some ECCPs made additional efforts to improve transitions. OPTIMISTIC introduced Transfer Cue Cards, a one-page document with questions facility staff nurses would ask hospital staff about incoming resident transfers. This form was originally developed by the Patient Safety Coalition and designed to improve information for patients transferring from hospitals to nursing facilities. OPTIMISTIC facilities that did not have a standard method for capturing incoming transfer information were encouraged to adapt the form to their needs when contacting hospitals. This process was met with mixed results. Some facilities adopted the form and found it useful; others noted that the transfer of information from hospitals was determined solely by the hospitals. Hospital staff faxed or provided the information via phone in a way that did not conform easily to the Cue Card. Another activity designed by OPTIMISTIC to improve transfers was the development of curricula for training of emergency medical services (EMS) staff who supported hospitals that served ECCP facilities. Although the curricula were completed, the actual training did not take place.
MOQI also had a multifaceted approach to improving transitions which may have resulted in high engagement by participating facilities (see Figure 2-9). It named a Care Transitions Lead (CTL) to oversee a Care Transitions Coach (CTC) who visited each facility monthly to focus attention on improving transitions. The CTC promoted the INTERACT Transition Tool and trained facility social workers to ensure advance directives were not only completed for each resident but also included with transfers. Both the CTC and the CTL addressed the need for improved transitions with the MOQI Advisory Board, which included hospitals and participating facility leadership. The MOQI CTC also visited hospitals to address transfer issues and promote the use of the INTERACT Transition Tool.
MOQI and NY-RAH also used electronic health information technology (HIT) interventions to provide the secure exchange of discharge summary information between hospitals and nursing facilities through e-mail (e.g., CareMail and Direct Messaging). MOQI’s HIT coach focused attention on incorporating the INTERACT Transition Tool in EMRs. NY-RAH considered Direct Messaging its main care transition intervention. Please see Section 2.10 of this report for more information on HIT.
OPTIMISTIC took a different approach to including HIT in its transition improvement activities. The Indiana Network for Patient Care (INPC) provides electronic exchange of clinical information between hospitals and physicians’ offices for six major health care systems in central Indiana but does not allow access to nursing facilities. The ECCP arranged for the INPC to provide ECCP RNs and APRNs with access to pertinent clinical information (e.g., discharge summaries and laboratory results). The OPTIMISTIC nurses accessed the information and then passed it on to the facility. Some facilities used this information more than others. Unless the INPC would change its access rules, this activity would not be sustainable without the ECCP.
ATOP, UPMC-RAVEN, and NY-RAH also provided outreach and training to hospitals regarding the importance of comprehensive communication during transfers and included the INTERACT tools and the POLST forms in these trainings. Although hospitals supported the ECCPs in training facilities in the importance of improved communication, along with other aspects of the Initiative, hospitals cited their own policies and procedures—often corporately mandated and electronically configured. There were no reports of hospitals adopting new care transition practices as a result of the Initiative. When facilities did not receive the information
48
they needed for an incoming resident, they generally telephoned the hospital discharge nurse to obtain this information. Information was transmitted by the hospital via telephone or fax. Some facilities reported that hospitals faxed the resident’s entire medical chart, in an effort to be comprehensive.
The role of ECCP nurses during a resident’s care transition also varied among ECCPs and among participating facilities in each state. RNs in AQAF and NY-RAH, whose focus was primarily on education rather than clinical care, supported and encouraged facility staff to provide all necessary documentation for hospital transfers and trained facility nurses to complete transfer paperwork. In clinical model ECCPs, if ECCP staff were present during a resident’s change in condition, they would often be asked to assess the resident, particularly if a physician or a physician extender was not available. If it was determined that the resident needed to be transferred, the ECCP nurse often participated in developing transfer documentation to ensure all relevant information was transmitted. ECCP nurses reported that modeling best practices during the transition was instructive. In some cases, ECCP nurses also called the hospital to alert hospital staff that the resident was being transferred. Some facility staff also telephoned the ECCP nurse when s/he was not present in the facility, to obtain the ECCP nurse’s guidance on an acute change in condition that might lead to a transfer. Alegent, ATOP, and OPTIMISTIC had instituted off-hour call lines for this purpose; however, they found that this service was rarely used. Facilities are required to call the PCP (42 CFR § 483.10(g)(14) [2017]) when a resident is being transferred, and facilities typically also call the DON and the resident’s family. Facility nurses reported that calling an additional person was not feasible in acute situations. When ECCP nurses were not involved in care transfers, they learned of the transfers when reviewing resident or facility records.
Whether the ECCP nurse had been involved in the transfer or had learned of it through medical record review, the ECCP nurses in six of the seven ECCPs routinely documented and analyzed the transfers and conducted an RCA to determine if any had been avoidable (Alegent did not conduct RCAs). They used the RCA results to train facility staff on recognizing early signs of changes in condition (please see Section 2.7, Quality Improvement, for more on this subject).
Although resident transfers might be between other locations, such as dialysis centers or the community, challenges relating to improving communications during care transitions are predominately with hospitals. Therefore, hospital transfers were the main focus of ECCPs’ efforts in the Initiative. Although both hospitals and facilities cited corporate, chain, or EMR requirements for use of particular forms, it appeared that most facilities either had an established protocol for transmitting comprehensive information to hospitals or, as a result of the Initiative, they adopted a standardized tool.
2.10 IT, Telemedicine, and Other Technology Components of the Initiative
Technological innovations, including EMRs, electronic communication tools, and telemedicine platforms, are becoming a larger part of the health care delivery system. High-tech components allow for quicker communication and often provide an opportunity to exchange more data across health care settings, which can improve clinical outcomes. Their use in nursing facilities is slowly growing as these innovations may serve as a valuable tool to improve care for

49
nursing facility residents. Across the spectrum of health care delivery settings, nursing facilities have not embraced technology advancements as quickly as other providers because of financial barriers and lack of incentives. However, in recent years the use of EMR in facilities has become more common. Federal efforts have provided some support for the use of HIT in hospitals, which may influence nursing facilities use of HIT. For example, CMS’s Meaningful Use Requirements22 established specific electronic health information exchange (HIE) objectives and incentives to encourage hospitals to communicate with providers, such as nursing facilities, when patients are discharged. Furthermore, the recently revised Nursing Home Regulations23 include a statement that the U.S Department of Health and Human Services is “committed to accelerating health information exchange through various initiatives” in nursing facilities.
ECCP Technology Components Impacting Care Delivery—MOQI, NY-RAH, and UPMC-RAVEN included primary model components directed at building new or providing ready-made technological solutions in nursing facilities. MOQI and NY-RAH included communication-based technology interventions in their models, and the UPMC-RAVEN model included telemedicine using equipment and staff provided by the ECCP. Although other aspects of HIT affected the Initiative, such as EMRs, these components are not included here, as they were not direct Initiative goals. However, it is worth noting that variations in use of EMRs and related technology in many facilities were barriers to implementing Initiative components. For example, many facilities reported challenges stemming from the duplicative nature of EMR charting and paper-based INTERACT tools. Barriers such as these are reported in Section 3.
Electronic Health Information Exchange (HIE) Systems—MOQI and NY-RAH both established secure e-mail systems for the electronic transfer of resident data between hospitals and nursing facilities (CareMail and Direct Messaging, respectively).24 The MOQI systems aimed to improve the transfer of discharge summary information for patients discharged from the hospital to the nursing facility or vice versa. NY-RAH’s system focused on the transfer of information from hospitals to nursing facilities, while MOQI’s system also allowed for secure back-and-forth exchanges of current resident information (e.g., medication changes or lab results) between staff at nursing facilities and practitioners at hospitals. The ECCPs worked with subcontractors to develop their software programs and covered the cost of each inbox provided to facility staff using grant funding ($200 for MOQI; $15 for NY-RAH per inbox).
The use of subcontractors caused additional implementation delays for both MOQI and NY-RAH. The NY-RAH subcontractor, in Initiative Year 1, was meant to develop an electronic transfer form for nursing facilities. However, this subcontractor had no experience working with nursing facilities and little knowledge of their HIE challenges; therefore, NY-RAH ended the contract. The second NY-RAH subcontractor, created the Direct Messaging software. This subcontractor delayed changes to their electronic messaging system interface by over a year
22 Source: https://www.healthit.gov/providers-professionals/meaningful-use-definition-objectives. 23 Source: https://www.gpo.gov/fdsys/pkg/FR-2016-10-04/pdf/2016-23503.pdf.
24 In Initiative Year 3, MOQI also implemented CareView, a secure HIE portal that allows nursing facility staff to view residents’ hospital medical records in real-time after a transfer occurs. Because of its late implementation, very few facilities adopted CareView.

50
(from Initiative Years 3 to 4), decreasing its use by nursing facility staff. Similarly, MOQI’s subcontractor reconfigured the CareMail system twice during the Initiative, which led to multiple rounds of implementation and retraining as new versions were introduced.
Both MOQI and NY-RAH conducted initial reviews of facilities’ technological capabilities and identified multiple facilities with inadequate access to wireless Internet and with a shortage of basic technology (e.g., computers, scanners, and printers). The ECCPs also identified a low rate of EMR use, although this issue was less pronounced for NY-RAH, which found more facilities with EMRs or facilities planning to add them. As a result of this assessment, MOQI granted an additional $1,500 per facility for investment in updated technology and both ECCPs established support to guide facilities through HIT implementation. NY-RAH designated a member of the ECCP leadership team to work with facilities, and MOQI worked to address facility challenges through a team of subcontractors and ECCP staff. Both ECCPs used clinical advisory groups, which included representatives from facility corporations, physician, nursing, and pharmacy associations, Social Services, and state Medicaid programs, among others, to assist them with implementation, although NY-RAH engaged these stakeholders later than MOQI.
In order for these HIE systems to improve communication between nursing facility staff and hospital providers, implementation of compatible systems was required in both settings. Hospital adoption of these HIE systems proved to be an ongoing challenge because of incorrect and delayed use. In the initial implementation for both ECCPs, many hospitals would delay sending electronic summaries after a patient was discharged to the nursing facility, with delays ranging from a few hours to several days. Information delays required facility staff to call the hospital to clarify or obtain discharge information, thereby negating the usefulness of their HIE systems. Furthermore, the discharge summary information received by nursing facilities was almost useless in some cases, as it was unreadable or unsearchable because of formatting and length issues.
Hospital buy-in was more challenging in New York because Direct Messaging with discharge summary information had to be initiated by hospitals, but many hospitals did not have an established internal workflow for sending electronic discharge information to nursing facilities. Because the flow of information was completely dependent on hospitals, many nursing facilities did not engage with Direct Messaging until more hospitals started using it in the final years of the Initiative. Some NY-RAH nursing facilities that were part of the same health care systems had better success. In comparison, MOQI experienced more success partnering with hospitals and, thus, more hospitals used their electronic mail system. Although the CMS Meaningful Use requirements had a positive effect on buy-in for CareMail, the NY-RAH ECCP and facility staff perceived the requirements as a barrier because hospitals only need to transfer 10 percent of their discharge summaries electronically to meet Meaningful Use requirements and often did so by engaging with other provider types instead of nursing facilities.
Despite varying levels of buy-in and multiple implementation challenges, facility staff from MOQI and NY-RAH reported increasing use of the secure mailboxes over the course of the Initiative. Although some MOQI facility staff cited strong beliefs in the ability of the tools to reduce avoidable hospitalizations if they are well implemented and reliably used, a few NY-RAH facility staff expressed concerns that Direct Messaging could not replace the personal interaction

51
required to capture important discharge information. Because NY-RAH implemented their electronic mail system later (i.e., Initiative Year 3) than MOQI (i.e., Initiative Year 1), these disparate opinions regarding the usefulness of the electronic mail systems may be a result of the different implementation timelines.
Telemedicine Carts—UMPC-RAVEN was the only ECCP to implement a telemedicine program as part of their model. Telemedicine carts connect on-call APRNs with nurses in the facility over the Internet, allowing a remote assessment. The ECCP used telemedicine carts to increase ECCP APRNs’ ability to assess resident changes in condition in real time when these clinicians were not present in the facilities. In addition to large screens that allow face-to-face communication between practitioners, the telemedicine carts include high-resolution cameras, a Wi-Fi connected screen, Bluetooth stethoscopes, and other features to collect clinical data electronically. Telemedicine carts were implemented in all UMPC-RAVEN facilities on a staggered schedule. This component started with ECCP APRNs providing on-call and telecart support on a rotation basis for facility staff during evening and weekend hours; however, by the third Initiative year, UMPC-RAVEN hired a designated telemedicine on-call APRN to provide coverage, as well as a nurse educator to support the telemedicine effort by educating and practicing with facility staff on the use of the cart. The ECCP covered the cost of each telemedicine cart, approximately $15,000 each. UPMC-RAVEN had prior experience in implementing and maintaining similar telemedicine carts within their health care system.
Each telemedicine encounter started with a telephone call. Facility staff called the responsible ECCP APRN and then together they determined if the resident’s condition could be resolved through a telephone conference without the use of the telemedicine cart. Facility staff indicated that they valued the on-call support that the UMPC-RAVEN nurses provided; however, physicians and facility staff questioned the value added by the actual telemedicine carts beyond just telephone support. The ratio of telemedicine uses to telephone consultations was fairly low; the ECCP reported 95 telemedicine encounters and 1,537 telephone consultations between August 2014 and June 2016. The ECCP estimated that 51 percent of telemedicine cart consultations and 12 percent of telephone consultations resulted in avoiding hospital transfers during this time period. Although some facility staff noted that the carts could be cumbersome or time-consuming to bring into residents’ rooms, they spoke of the telemedicine initiative positively across Initiative years and expressed belief in its ability to reduce hospitalizations. In addition, the telemedicine component struggled to find its niche for improving care because it was not offered 24/7.25 The lack of full-day coverage undermined its utility for facility staff who thought it would be more effective overnight when on-site physicians and ECCP nurses were less available. Most importantly, there was no thorough assessment of the Internet infrastructure in the facilities prior to deciding to employ the telemedicine component; several facilities simply did not have Internet capabilities sufficient to support such intervention, leading to major implementation delays.
25 The telemedicine service operates during the following hours: Monday through Friday from 4 p.m.–10 p.m. and
Saturday and Sunday from 10 a.m.–6 p.m. There is no support in other weekend and night hours. The service is also not used during the regular business hours when ECCP nurses are present in the facilities.

52
IT Themes—Several themes related to implementation emerged across the variety of HIT components of the Initiative. ECCPs found a low rate of technology integration in facilities; nursing facility staff were also substantially less technology savvy than anticipated. HIT interventions required time to implement and gain buy-in from all involved provider types. Challenging software, lack of user-friendly interfaces, interoperability between systems, and slow implementation all served as barriers to buy-in and widespread use of these components. For two of the three ECCPs that used HIT interventions, the difficulty with subcontractor timelines and subpar products also affected implementation and use of the HIT initiatives. The impact of these model components on reducing avoidable hospitalizations is uncertain considering that many barriers were still not addressed by the end of the Initiative. The CMS Meaningful Use Requirements may support the continued use of the HIT interventions in the MOQI and NY-RAH facilities. However, the associated costs of the interventions that were previously covered by the ECCP may not be sustainable by the facilities. Moreover, in addition to requiring dedicated support staff, telecart technology needs constant IT support and frequent updating; otherwise, it quickly becomes obsolete. Finally, finding ways to obtain buy-in from participating hospitals is essential to the success of HIE interventions.
2.11 Spillover and Contamination
As part of the initial evaluation design, CMS was interested in evaluating spillover of Initiative components to residents not eligible for the Initiative and potential contamination of nonparticipating facilities. We evaluated the potential for spillover and contamination through site visits, interviews, and surveys of the ECCP facilities, as well as a survey of comparison group facilities. Although there is some overlap in the terminology of spillover and contamination, RTI defined spillover as occurring internally within ECCP facilities, such as facility staff using INTERACT tools to communicate change in condition of short-stay residents who were not eligible to participate in the Initiative. Such spillover has no effect on comparison facilities or quantitative analyses. RTI defined contamination as occurring beyond the ECCP facilities; for example, if a corporate facility owner felt INTERACT was having a positive effect in participating Initiative facilities, that owner also might adopt the use of INTERACT tools in non-ECCP corporate facilities. Contamination could also occur via the ECCPs directly; through site visits and interviews, it was apparent that ECCPs were not only encouraging use of Initiative components for noneligible residents but also were disseminating Initiative information and findings to nonparticipating facilities. If these nonparticipating facilities were part of the comparison group, this contamination could impact the measured effects of the Initiative. There is also the broader possibility of parallel activities aimed toward reducing avoidable hospitalizations occurring in the comparison facilities, which could reflect general trends among all nursing facilities.
Spillover—All ECCPs reported spillover effects from the Initiative across all four Initiative years. Spillover can occur within ECCP facilities when aspects of the Initiative unintentionally affect facility care processes and/or residents who were not eligible for inclusion in the Initiative. All ECCPs made Initiative education and training available to all staff types in participating facilities, resulting in substantial spillover for the components of the Initiative for which education was provided. INTERACT tools and training, in particular the Stop and Watch tool, were often provided to the entire facility, including CNA, nursing, dietary, housekeeping,

53
and therapy staff, to encourage staff to use these tools on all residents, including those not eligible for the Initiative.
Beyond the formal education by ECCPs, the informal education provided by ECCP nurses also resulted in spillover effects. ECCP nurses not only educated facility staff on general assessment skills but also conducted trainings on fall reduction strategies, intravenous therapy, palliative care, dementia, and wound care. These trainings were available to all facility staff, and staff were encouraged to use these lessons on their entire resident population.
In most ECCPs, Initiative-driven QI activities and tools were implemented facility-wide. Most staff were also coached by ECCP nurses on EOL care and advance directives. The formal and informal education provided by the ECCP and the facility-wide QI initiatives were credited with improving staff skills and capabilities, improving communication between staff and physicians, and empowering facility staff. This increased confidence in staff ability and shift in staff attitude led to faster identification of resident changes in condition. In turn, faster identification of changes in condition was reported to lead to a reduction in potentially avoidable hospitalizations for all residents, regardless of Initiative eligibility.
Although most of the education and QI components of the Initiative were designed to be whole house, the clinical care provided by the ECCP nurse was meant to be restricted to Initiative eligible residents. In practice, this was not always the case in the clinical-care model ECCPs. In emergency situations or upon request by facility staff, ECCP nurses were willing to advise facility staff on the care of noneligible residents and actively participated in clinical assessments. Because of both the mentorship and hands-on assistance provided by ECCP nurses to facility staff, ECCPs reported that the impact of the Initiative was broader than originally intended. Finally, the Initiative had an even greater effect in three ECCPs. OPTIMISTIC, AQAF, and UPMC-RAVEN nurses were involved in efforts to improve state inspection survey results, including completing chart reviews and documentation and serving as an extra set of eyes to catch potential deficiencies.
Although the majority of staff reported that spillover was positive, there were negative effects as well. The increased time commitment required from facility staff to complete trainings and INTERACT forms was cited as a negative consequence of the Initiative in multiple ECCPs. Although all residents benefited from the use of the INTERACT tools, the inclusion of noneligible residents increased the number of forms completed by nursing staff and may have added to data collection. Thus, spillover has the potential to benefit residents facility-wide but may also create more burden for facility staff.
Contamination—Although spillover, as previously defined, examines the spread of Initiative components within the ECCPs (i.e., to nonparticipating residents within ECCP facilities), contamination occurs beyond the ECCP, when Initiative components spread to nonparticipating facilities, including potential comparison facilities. During our site visits and telephone interviews, we identified potential dissemination of Initiative components to nonparticipating facilities. If these nonparticipating facilities were also part of the comparison group, such contamination could weaken the measured effects of the Initiative (See Table 2-5 and discussion below for further details). Potential for contamination of comparison group facilities through sharing of Initiative components and findings was particularly evident in the

54
site visit findings for AQAF, OPTIMISTIC, MOQI, ATOP, and NY-RAH. These ECCPs made concentrated efforts to increase awareness of Initiative components and disseminate Initiative findings beyond the participating facilities.
Contamination also occurred through corporate policy changes. After seeing the successes of various Intervention components in their participating facilities, some corporations chose to roll out these components in their nonparticipating facilities, some of which may have been included in the comparison group. Some corporations in AQAF, MOQI, and ATOP facilities expanded the use of INTERACT tools to nonparticipating facilities, and one Alabama corporation even created a position analogous to the ECCP nurse for nonparticipating facilities. One facility in Pennsylvania also indicated that their corporate office was implementing a UPMC-RAVEN-like program in other facilities because of the value they saw in the intervention.
ECCPs could also have affected comparison group facilities by presenting Initiative findings through conference presentations and trainings. ECCPs shared overall Initiative goals and progress in forums such as Nursing Home Association conferences, AMDA conferences, trainings for hospitals, and state-wide conferences. In some cases, ECCPs also invited nonparticipating facilities and corporations to ECCP meetings about INTERACT tools, QI tools, and advance directives.
The dissemination of Initiative components to nonparticipating facilities could be a function of ECCP organizational form. Both AQAF and ATOP reported that dissemination of findings beyond participating facilities was part of their mission as QIOs. AQAF gave preference to corporate facilities during facility selection to increase the likelihood that model elements would spread beyond participating facilities. ATOP also encouraged sharing of Initiative information to promote synergy and improve quality in all nursing facilities in Nevada, including nonparticipating facilities. Furthermore, OPTIMISTIC, MOQI, and NY-RAH created robust websites to share Initiative information. However, it was difficult to gauge the impact of these dissemination efforts on nonparticipating facilities, including any comparison facilities.
In an attempt to assess potential contamination, we surveyed both comparison and ECCP facilities about parallel activities, unrelated to the Initiative, that aimed to reduce avoidable hospitalizations among the long-stay population. In both surveys, we first asked respondents if their facility had introduced any policy or procedure that reduced avoidable hospitalizations of long-stay residents since January of 2011 (among ECCP facilities the question was limited to policies or procedures unrelated to the Initiative). If respondents answered affirmatively, we asked about a series of specific practices, outlined in Table 2-5, and whether they had been introduced and were still being used. If the policy or practice was still in place at the time of the survey, we considered it implemented.

55
Table 2-5 Policies or practices implemented to reduce avoidable hospitalizations of long-stay
residents that were unrelated to the Initiative
SOURCE: RTI analysis of RTI Comparison Facility Survey and wave 3 of the RTI Nursing Facility Administrator Survey (data collected June 2015–December 2015).
We found high levels of contamination. Of the 101 comparison facilities responding to the survey, 95 percent stated they had undertaken efforts to reduce avoidable hospitalizations of long-stay residents. The most commonly implemented specific practice included hospitalization rate tracking or review and SBAR or similar forms to standardize communication between nurses and physicians (Table 2-5). Of the 124 ECCP facilities responding to wave 3 of the survey, almost 75 percent had introduced policies or procedures to reduce avoidable hospitalizations that were unrelated to the Initiative. Like the comparison facilities, hospitalization rate tracking or review was the most commonly implemented component, followed by RCA or medication review, and SBAR or similar forms. Examining patterns of policy implementation, the most common combination of practices outside of the Initiative, in both comparison and ECCP facilities, included SBAR, Stop and Watch, Care Paths, RCA, and hospitalization rate tracking. Since this group of specific policies are commonly implemented together as part of the INTERACT tools suite, this finding was not surprising.
In summary, this Initiative did not operate in a vacuum. Nearly all ECCPs reported expanding use of Initiative components to noneligible residents and disseminating intervention information to nonparticipating facilities. In addition, the survey of comparison facilities found that the majority of respondents reported they were implementing specific practices that were similar to those of the Initiative. This context is important when estimating the effect of the Initiative using a difference-in-differences approach, which relies on the assumption that comparison facilities are not implementing the same components as the Initiative. If the comparison facilities were implementing procedures featured in the ECCPs, as the survey
56
suggests, the difference-in-differences approach could underestimate the effects of the Initiative on hospitalizations. Still, the comparison facilities would likely not have included interventions with the breadth and comprehensiveness of this Initiative, including additional RNs and APRNs working within facilities. Consequently, the Initiative effect can be conceptualized as measuring the incremental benefits of an ECCP nurse in the facility, beyond the potentially overlapping activities occurring in comparison facilities that reflect the changes within the broader long-term care environment.
2.12 Learning Community
The Initiative’s Learning Community intended to provide the ECCPs with a venue in which they could share ongoing results, innovative or best practices, and lessons learned for implementation strategies. Events were to be held at least quarterly but could occur as frequently as once a month. Each ECCP was responsible for participating in the CMS Learning Community throughout the duration of the Initiative. ECCPs also had access to the CMS Innovation Center Partner Collaboration website where they could exchange information in an open forum about their implementation activities.
The Learning Community included a series of webinars that generally followed the same format: a pre-determined selection of ECCPs presented on a specific topic, with time after each presentation for questions from the other ECCPs. The topics addressed during these events ranged from reporting on the ECCPs’ overall progress in the past year, including data outcomes resulting from the Initiative, to specific requests from ECCPs regarding particular issues or challenges the ECCPs faced (e.g., ECCP staff turnover, documenting resident changes in condition through SBAR or Stop and Watch). Occasionally CMS or the Implementation contractor presented during an event, generally on data collection for the Initiative. The Implementation contractor also held “ECCP Office Hours” calls one or two times per Initiative year. These calls had no agenda and no scheduled presentations, but were times for the ECCP staff to ask questions of the Implementation contractor or other ECCPs. They were generally not well attended, with only one or two ECCPs participating. In addition to the webinars, the ECCPs attended an in-person meeting with CMS once a year.
The CMS Innovation Center Partner Collaboration website included updates from the contractor on the schedule of Learning Community events as well as resources and materials that were discussed during previous events, including PowerPoint slides. Some ECCPs uploaded their milestone trackers to the website, which included information about the extent to which ECCPs had met their goals of implementing the interventions. The website also included a discussion forum where ECCPs could exchange information.
The Learning Community, according to ECCP feedback, was limited in fulfilling its goal to provide a forum in which ECCPs openly shared information and learned from each other. One primary reason for the limited value was the decreasing number of Learning Community events that occurred over the course of the Initiative. Whereas the first two Initiative years included 14 events (6 for Initiative Year 1 and 8 for Initiative Year 2), there were only 6 events across the last two Initiative years (3 events each for Initiative Years 3 and 4). RTI, however, was not informed of any Learning Community activities or events and no longer had access to the CMS Innovation

57
Center Partner Collaboration website by the end of Initiative Year 3 and for all of Initiative Year 4.
Overall, ECCPs were disappointed with the Learning Community events. Several ECCPs spoke of their initial interest in the opportunity for the Learning Community activities to provide a space where they could learn from other ECCPs. However, many ECCPs found the events were too structured and did not include enough time for ECCPs to effectively communicate with one another. One ECCP indicated that the structure of the events improved toward the end of the project. Some ECCPs were frustrated with the low participation from others during the discussions. A couple of ECCPs noted that they felt restricted from openly sharing issues or concerns because CMS was also participating on the Learning Community phone calls and could monitor the ECCP’s progress. Because Initiative progress was tied to the possibility of additional financial incentives, ECCPs said they were hesitant to share anything that worked well for fear that other ECCPs might poach ideas and reap the financial benefits. Rather than discuss questions or lessons learned on the Learning Community calls, several ECCPs used the connections made on the calls to develop contacts with other ECCPs separately, outside of the Learning Community forum.
A few ECCPs mentioned that they were wary of sharing information with others during the Learning Community calls. They believed that the bonus financial awards provided by CMS encouraged competition and discouraged cross-ECCP idea sharing. Working together in a collaborative environment seemed at odds with the potential for receiving extra financial awards that were only available to top-performing ECCPs.
When asked about use of the Learning Community website, most of the ECCP staff indicated minimal use of the website and the forum for discussing topics. Rather than encouraging open discussion, the website generally acted as a repository for official documents about the Initiative. A very limited number of documents were shared via the website, including information on some of the tools ECCPs were using. One ECCP staff person noted the difficulty in accessing the website, even when trying to upload a milestone tracker. The website had several glitches and at least one extended period when the website was not functioning. In addition to design and accessibility issues, some ECCPs may have had reservations about posting their concerns or implementation challenges in an open forum, knowing that CMS and RTI were monitoring these forums.
In summary, the Learning Community activities were limited in facilitating collaboration across ECCPs. More attention to the structure of the Learning Community calls to encourage greater informal communication among the participants was needed. To encourage participation, one ECCP suggested that the facilitator could send out materials ahead of calls to encourage ECCP participation and follow up with ECCPs regarding issues that were brought up on the calls. Website design and accessibility were also challenges when trying to promote discussion and exchange of information across ECCPs. Rather than relying on communication through calls and online forums, ECCPs stressed that they found the annual in-person meetings to be valuable, especially when initiating relationships with each other and having the opportunity to share their thoughts and concerns with CMS staff directly.


59
SECTION 3 STATE-SPECIFIC ANALYSIS
Introduction. In this section, we present results specific to each of the seven Enhanced Care and Coordination Providers (ECCPs). For each ECCP, we begin by summarizing the ECCP model and features in a descriptive table.
Next, we describe the impact of the Initiative on key utilization, expenditure, and Minimum Data Set (MDS)-based quality measures, derived from quantitative analysis using multivariate regression models. As explained in Section 1, we present both intervention period annual effects, treating 3 Initiative years, 2014–2016, as one intervention period, and year-specific effects, separately estimated for each Initiative year:
• Intervention Period Annual Effects: This strategy calculates the average Initiativeeffect on a given measure per resident per year during the intervention period, 2014–2016.
• Year-Specific Effects: This strategy allows for the possibility that the implementationof the Initiative may have evolved over these 3 years and hence estimates a separateeffect in each of these years. Based on this strategy, we present new results for 2016and we also display the trend of Initiative effects over time. Full results for the 2014and 2015 year-specific findings are available in previous annual reports.
The years referred to in this report are calendar years except for 2016, which is a fiscal year (October 1, 2015–September 30, 2016), because a new phase of the Initiative, including incentive payments to providers (Payment Reform Initiative), started on October 1, 2016. Thus, the period from October 1, 2015–December 31, 2015, was counted as both part of calendar year 2015 and fiscal year 2016. We do not present quantitative results from the first Initiative year, 2013, because it was a transition period, with various Initiative components phasing in slowly.
In this report, we examined the year-specific effects of the Initiative on all MDS-based quality measures. For the intervention period (2014–2016) annual effects, we focused on two select MDS-based quality measures: decline in activities of daily living (ADLs) and antipsychotic medication use. These are the two measures that showed consistent patterns in the year-specific effects across years, with very few exceptions. Therefore, it is more likely to discern a consistent effect of the Initiative on these two MDS-based quality measures over the 3-year intervention period (2014–2016). The other MDS measures had no consistency.
Then, we contextualize findings on the implementation outcomes, based on qualitative analysis across the Initiative years, including a summary of major successes, challenges, lessons learned, and factors that impact sustainability. Each state section concludes with a synthesis of the results of quantitative and qualitative analyses; the qualitative data collection findings provide both context and explanations for the quantitative analysis results.

60
In addition, for several states26 for which Medicaid data are available, we present descriptive analyses of Medicaid and Medicare expenditures on select services for Initiative-eligible residents with Medicaid coverage. For these descriptive analyses only, we present an additional year (2011) of descriptive results in the pre-Initiative period for comparison purposes. Assessing the consistency of the 2011 and 2012 results can provide validation for the Medicaid data.
We mapped the Medicaid claims into the same broad utilization categories as the Medicare claims. Because of idiosyncrasies in the Medicaid data across states, the mapping was not always straightforward and consistent, but we believe the results are reasonable. In these descriptive analyses, expenditures are expressed as the average expenditure per beneficiary per month (PBPM) as calculated from Medicare claims, Medicaid claims, and combined Medicare and Medicaid claims on select services. We examine expenditures separately for residents who are dually eligible for Medicare and full Medicaid benefits (hereafter referred to as Medicare-Medicaid duals27), and residents who are eligible for Medicaid but not for Medicare (hereafter referred to as Medicaid-only); we further subdivide these residents into those who are in the ECCP group and those who are in the comparison group. For the Medicare-Medicaid duals group, we present Medicare expenditures, Medicaid expenditures, and combined Medicare and Medicaid expenditures. For beneficiaries with Medicaid-only eligibility, we report Medicaid expenditures only.
Expenditures are reported both as a total and for select services. Total expenditure includes expenditures for the following types of services: inpatient, outpatient (institutional), skilled nursing facility (SNF), nursing facility (NF), hospice, home health, durable medical equipment, Medicare carrier file services, and prescription drugs. Claims for NF services were paid for exclusively by Medicaid, whereas all other types of claims could be paid for by either Medicare, Medicaid, or both.
To assist in interpreting the tables showing the estimated effects of the Initiative on the outcomes, below is a sample table of results (for Alabama, based on Table 3-2 reported in Section 3.1) accompanied by a detailed interpretation of each of the columns in the table. In this sample table, the outcomes are the probability of having a hospitalization or emergency department (ED) visit. We use the outcome for “all-cause hospitalization” for illustration. There are similar tables for counts of events and expenditures throughout this report, which follow the same logic of interpretations as offered in the sample table.
Note that the effect estimates, whether in percentage points, counts or dollars, may be large or small in absolute value and may, in either case, be statistically significant or insignificant. For example, as shown in the sample table below, the estimated effect of the Initiative on the probability of a resident having an all-cause hospitalization is relatively small
26 These states include Alabama (2011–2013), Missouri (2011–2015), Nebraska (2011–2015), Nevada (2011–
2015) and Pennsylvania (2011–2014). 27 For Medicare-Medicaid duals, all Medicaid expenditures reflect the combined total for cross-over claims (i.e.,
Medicaid expenditures for cost-sharing of Medicare covered services) and non-cross over claims (i.e., services fully paid by Medicaid).

61
and not statistically significant. The row for the probability of a resident having a potentially avoidable hospitalization shows similar but more favorable results. We also show the size of the Initiative effects compared to the average values of the outcomes, average probabilities in this case. The average probability of a potentially avoidable hospitalization in a year, over the 3-year period, is smaller than that of all-cause hospitalizations, 14.6 percent vs. 30.2 percent. However, the estimated effect of the Initiative on the probability of a potentially avoidable admission is larger, a change of −1.5 percentage points. The relative size of the effect estimate (−1.5/14.6) is a reduction of about 10.0 percent, a more substantial change than the 3.2 percent reduction in all-cause hospitalizations. The 90% confidence interval for this estimate has a range indicating a statistically significant reduction.

62
Sample Table: ECCP effect on probability of any utilization per resident per year during intervention period, 2014–2016, Alabama
Probability of any Mean, 2014–2016
(percent) Effect
(percentage points) 90% CI 80% CI p-value Relative Effect
(% of mean)
All-cause hospitalization
30.2 -1.0 -2.8 0.9 -2.4 0.5 0.398 -3.2
Potentially avoidable hospitalization
14.6 -1.5 -2.7 -0.2 -2.5 -0.5 0.061 -10.0
All-cause ED visit 23.9 -4.6 -7.0 -2.2 -6.4 -2.7 0.002 -19.1 Potentially avoidable ED visit
9.1 -2.3 -3.8 -0.8 -3.5 -1.2 0.010 -25.4
Below: Interpretation of numbers in each column, using the row for “All-cause hospitalization” as example
Outcome of interest, for example, whether a resident had any all-cause hospitalization in each of the 3 Initiative years, 2014–2016.
Average percent of residents having the outcome per year over the 3-year Initiative period: 30.2. It is the unadjusted mean across all ECCP and comparison residents during the period, weighted by the number of residents in each year.
Average effect of the Initiative per resident per year on the outcome, expressed in percentage-point change: -1.0. It measures change in the outcome attributed to the Initiative, estimated from a difference-in-differences regression model that accounts for group differences in the base period, 2012, and changes over time affecting all facilities.
The 90% confidence interval is a measure of uncertainty in the percentage-point estimate of the Initiative effect: a range from −2.8 to 0.9. The interval contains the value of 0, indicating that the effect estimate is not statistically significant, that is, not meaningfully different from 0.
The 80% confidence interval for the percentage-point estimate of the Initiative effect: -2.4 to 0.5. Per CMS request, these estimates are provided here for comparison purposes only. Standard statistical practice is to use confidence intervals of 90% or higher.
The p-value is a measure of statistical significance, representing the probability that an effect of the estimated magnitude would occur by chance. By convention, p-values smaller than 0.05 or 0.10 are considered statistically significant. The p-value of 0.398 indicates that the effect estimate of a −1.0 percentage-point change is not statistically significant.
Relative magnitude: the effect estimate (shown in the second numerical column) relative to the average of the outcome (shown in the first numerical column): -1.0/30.2 = -3.2%. This percent change provides a sense of the relative size of the percentage-point effect estimate—that is, how substantive it is, compared to the underlying values.
NOTE: Bold text indicates statistical significance at the 0.10 level. CI = Confidence Interval; ECCP = Enhanced Care and Coordination Provider; ED = Emergency Department.

63
3.1 Alabama
3.1.1 Alabama Quality Assurance Foundation (AQAF)
The Alabama Quality Assurance Foundation (AQAF) Initiative to reduce potentially avoidable hospitalizations among long-stay nursing facility residents launched in January 2013 with 23 participating facilities (Table 3-1). The AQAF model seeks to effect facility culture change through staff education and a focus on enhancing facility leadership, improving quality, and encouraging use of INTERACT tools to identify and respond to changes in resident condition. There is strong evidence that the AQAF intervention was associated with a reduction in all-cause and potentially avoidable ED visits and related expenditures, with mixed to no evidence for a similar reduction in hospitalizations or total expenditures.
Table 3-1 AQAF model description
Structure
Organization type Quality Improvement Organization (QIO) Partners and their roles • Samford University McWhorter School of Pharmacy: provided
medication review support to participating facilities and training on medication uses, and served as a resource for AQAF Care Pathways Coaches (Coaches) and facilities to answer medication questions.
• Scott Wozniak served as a leadership expert, providing expertise on staff stability and management to participating facility administrators and directors of nursing (DONs); Wozniak replaced B&F Consulting, which provided staff stability training in Initiative Years 1 and 2.
Number of facilities 23 participating facilities NF attrition None Facility-based staff FTEs: 23 registered nurse (RNs) Coaches (ratio 1 FTE Coach: 1
participating facility) State APRN practice arrangements affecting implementation
N/A (education-only model)
Use of registered or higher-level nurses APRN None RN Yes
Role of nurse Clinical care No Writing orders No Education Yes, AQAF employs an education-only model with no clinical care of
facility residents Weekly schedule RN Coaches worked in their assigned facilities 5 days/week during regular
business hours (continued)

64
Table 3-1 (continued) AQAF model description
Medication management
Polypharmacy reduction Yes Antipsychotics reduction Yes Medication review Yes, collaboration between Coaches, facility staff, physicians, and
consulting pharmacists
Tools promoted by ECCPs to improve communication and identification of changes in resident condition (INTERACT and others)
SBAR Yes, introduced and used consistently in all facilities Stop and Watch Yes, introduced and used consistently in all facilities Transfer forms Yes, introduced and used consistently in most facilities QI tool Yes, introduced and used consistently in most facilities Care Paths Yes, introduced and used consistently in most facilities
End-of-life planning
Advance directives No Staff training/ discussion Yes
Optional features specific to AQAF Leadership training AQAF provides specialized ongoing leadership trainings at AQAF
headquarters to facility leadership (i.e., facility administrators and DONs). Topics of focus include facility management, quality improvement, and staff stability. The design of these trainings engages facility leadership to help reinforce the underlying goals of the Initiative and provide strong leadership backing of the facility staff trainings and activities (e.g., INTERACT tools) that Coaches provide in facilities. Coaches also facilitate Quality Assurance and Performance Improvement (QAPI) teams for staff stability, medication management, and preventable hospitalizations; facility leadership and staff participate together on these teams to improve overall quality goals within facilities.
Note: APRN = advanced practice registered nurse; FTE = full-time equivalent; INTERACT = Interventions to Reduce Acute Care Transfers; N/A = not applicable; NF = nursing facility;; RN = registered nurse; SBAR = Situation, Background, Assessment, Recommendation; AQAF = Alabama Quality Assurance Foundation; QI = quality improvement.
3.1.2 Utilization, Expenditure, and Quality
Utilization. The ECCP intervention was associated with a consistent reduction in the probability of ED visits. The intervention period (2014–2016) annual effect estimate indicated a 4.6-percentage point reduction in the probability of any all-cause ED visit per resident per year and a 2.3-percentage point reduction in the probability of any potentially avoidable ED visit, both statistically significant at the 0.10 significance level (Table 3-2). Compared to the overall probabilities of 23.9 percent for all-cause ED visits and 9.1 percent for potentially avoidable ED visits, these effects represented relative reductions of 19.1 and 25.4 percent, respectively. The year-specific effects were statistically significant for all 3 years (Figure 3-1, Table 3-3). The count of ED visits demonstrated similar results, with an intervention period annual reduction of 0.089 all-cause and 0.033 potentially avoidable ED visits per resident per year, which

65
represented a 25.6- and 30.6-percent reduction relative to the 2014–2016 means, respectively (Table 3-4).
The evidence for reductions in all-cause and potentially avoidable hospitalizations was less consistent. While the intervention period annual effect on the probability of potentially avoidable hospitalizations was a statistically significant reduction by 1.5 percentage points (Table 3-2), this effect was largely driven by a strong, statistically significant reduction in 2015 (with statistically insignificant reductions in 2014 and 2016), as shown in year-specific effect estimates (Figure 3-1, Table 3-3). The intervention period annual effect on the probability of all-cause hospitalizations suggested a statistically insignificant reduction and, as with potentially avoidable hospitalizations, there was a strong, statistically significant reduction in year-specific results for 2015 only (with an insignificant reduction in 2014 and an insignificant increase in 2016). For both types of hospitalizations, the intervention period year-specific effect on utilization counts was a reduction but not statistically significant (Table 3-4; for 2016 effect, see Table 3-5).
Medicare Expenditures. The effect of the ECCP interventions on Medicare expenditures exhibited a pattern similar to the utilization findings, with stronger evidence for a reduction in ED expenditures, and weak to no evidence for a reduction in hospitalization-related or total expenditures. The most consistent effect was on decreasing expenditures for all-cause ED visits, with an intervention period annual reduction of $33 per resident per year, and the year-specific effects also showed statistically significant reduction for all 3 years (Table 3-6, Figure 3-2). Although the intervention period annual effect for potentially avoidable ED visits was also a statistically significant reduction, by $10, the year-specific effects were less consistent, with a statistically significant reduction only in 2016 (Table 3-7). The intervention period annual effect suggested a reduction in expenditures for potentially avoidable hospitalizations and an increase in expenditures for all-cause hospitalizations, but neither was statistically significant. The year-specific effects were similar across years for both measures, except for a marginally significant increase in expenditures for all-cause hospitalizations in 2016 (all other year-specific effect estimates for both measures indicated statistically insignificant reductions). The intervention period annual effect on total Medicare expenditures pointed to a slight increase but the estimate was not statistically significant.
Medicaid Expenditures. This section presents descriptive analyses of Medicaid and Medicare expenditures on select services for Initiative-eligible residents with Medicaid coverage in Alabama during all study years for which usable Medicaid data could be obtained, including 2011 (Table 3-8), 2012 (Table 3-9), and 2013 (Table 3-10). Please note that, unlike the Medicare multivariate regression analyses described above, the Medicaid expenditure results presented in this section are descriptive. Descriptive statistics cannot be taken as results of an intervention. The observed trends must be understood within the context of possible changes in ECCP resident
KEY FINDINGS
In Alabama, the ECCP intervention was consistently associated with reductions in the probability and count of all-cause and potentially avoidable ED visits, with some evidence for a reduction in potentially avoidable hospitalizations and minimal evidence for a reduction in all-cause hospitalizations.
There was a similar pattern for expenditures, with strong evidence for a reduction in ED expenditures, and weak to no evidence for a reduction in hospitalization-related expenditures and total expenditures. In addition, effect sizes generally weakened from 2015–2016.
MDS-based quality measures did not demonstrate any consistent change over time.

66
characteristics as well as each state’s comparison group. The expenditures in these tables are presented as dollars per beneficiary per month (PBPM).
Overall, Table 3-8 through Table 3-10 illustrate that the total combined Medicare and Medicaid expenditures for the Medicare-Medicaid duals group and the total Medicaid expenditures for the Medicaid-only group are largely driven by NF expenditures for residing in the facility, which account for a slightly larger percentage of the total costs in the Medicaid-only group than in the Medicare-Medicaid duals group. Total costs were slightly higher for the Medicaid-only group overall; however, when NF claims were excluded, other service costs were higher among the Medicare-Medicaid duals group. Among Medicare-Medicaid duals, average combined Medicare and Medicaid expenditures PBPM for each service type were primarily driven by Medicare expenditures, with Medicaid paying only a small portion of the service, with the notable exception of NF expenditures, which are exclusively from Medicaid. Please see Appendix A for additional details regarding the calculation of Medicaid expenditures for Alabama.
MDS-based Quality. There were no statistically significant intervention period annual effects for either decline in activities of daily living (ADLs) or antipsychotic medication use, although the direction of the effect was negative for antipsychotic use (which would indicate a beneficial effect on quality), and positive for decline in ADLs (which would indicate a deleterious effect) (Table 3-11). In 2016, three of the eight year-specific MDS-based quality measures showed a negative effect estimate, which represents an improvement in quality, although only one of these measures was statistically significant, indicating a reduction in depressive symptoms (Table 3-12). Overall, there was no consistent pattern for any measure across years.
Table 3-2 ECCP effect on probability of any utilization per resident per year during intervention
period, 2014–2016, Alabama
Relative Mean, Effect effect
Probability of having at 2014–2016 (percentage (% of least one: (percent) points) 90% CI 80% CI p-value mean)
All-cause hospitalization 30.2 –1.0 –2.8 0.9 –2.4 0.5 0.398 –3.2 Potentially avoidable 14.6 –1.5 –2.7 –0.2 –2.5 –0.5 0.061 –10.0 hospitalization All-cause ED visit 23.9 –4.6 –7.0 –2.2 –6.4 –2.7 0.002 –19.1 Potentially avoidable ED visit 9.1 –2.3 –3.8 –0.8 –3.5 –1.2 0.010 –25.4
NOTE: The 2014–2016 mean is the unadjusted mean across all ECCP and comparison residents during the 3-year intervention period, weighted by the number of residents in each year. Bold text indicates statistical significance at the 0.10 level. Standard statistical practice is to use confidence intervals of 90% or higher; 80% confidence intervals are provided here for comparison purposes only. ECCP = Enhanced Care and Coordination Provider; ED = Emergency Department. SOURCE: RTI analysis of Medicare claims data (RTI program ms06; annual_2016\ms01_xtgee).

67
Figure 3-1 ECCP effect on probability of any utilization per resident per year, Alabama
NOTE: Dots indicate year-specific effects separately estimated for 2014, 2015, and 2016; triangles indicate intervention period (2014–2016) annual effects; vertical bars are 90% confidence intervals. Detailed numbers underlying the graphs are provided in Appendix H. ECCP = Enhanced Care and Coordination Provider; ED = Emergency Department. SOURCE: RTI analysis of Medicare claims data (RTI program ms06; annual_2016\ms01_xtgee).
Table 3-3 ECCP effect on probability of any utilization per resident, 2016, Alabama
Relative Mean, Effect effect
Probability of having at least one: 2016
(percent) (percentage
points) 90% CI 80% CI p-value(% of mean)
All-cause hospitalization 29.8 1.0 –1.4 3.5 –0.9 2.9 0.496 3.4 Potentially avoidable hospitalization 14.5 –0.8 –2.7 1.1 –2.3 0.6 0.471 –5.7All-cause ED visit 23.6 –4.8 –7.6 –2.1 –7.0 –2.7 0.004 –20.4Potentially avoidable ED visit 9.3 –2.4 –3.9 –0.9 –3.6 –1.2 0.010 –25.8
NOTE: The 2016 mean is the unadjusted mean across all ECCP and comparison residents in that year. Bold text indicates statistical significance at the 0.10 level. Standard statistical practice is to use confidence intervals of 90% or higher; 80% confidence intervals are provided here for comparison purposes only. ECCP = Enhanced Care and Coordination Provider; ED = Emergency Department. SOURCE: RTI analysis of Medicare claims data (RTI program ms06; annual_2016\ms01_xtgee).
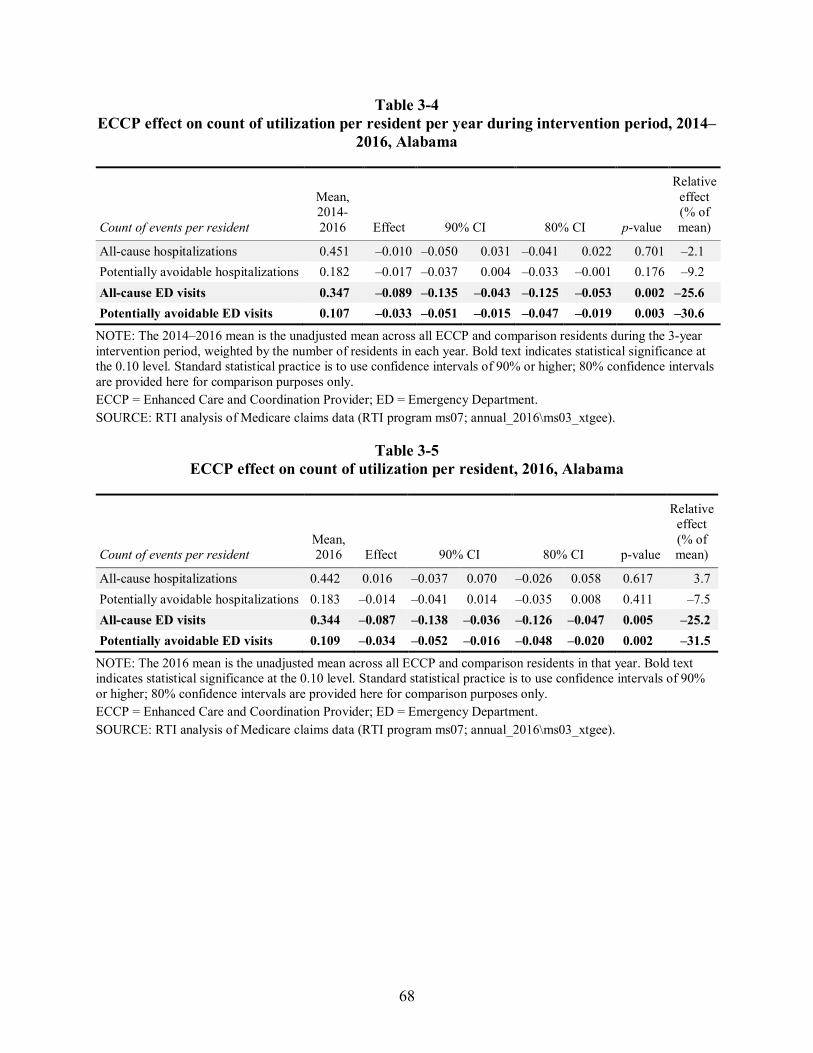
68
Table 3-4 ECCP effect on count of utilization per resident per year during intervention period, 2014–
2016, Alabama
Count of events per resident
Mean, 2014-2016 Effect 90% CI 80% CI p-value
Relative effect (% of mean)
All-cause hospitalizations 0.451 –0.010 –0.050 0.031 –0.041 0.022 0.701 –2.1 Potentially avoidable hospitalizations 0.182 –0.017 –0.037 0.004 –0.033 –0.001 0.176 –9.2 All-cause ED visits 0.347 –0.089 –0.135 –0.043 –0.125 –0.053 0.002 –25.6 Potentially avoidable ED visits 0.107 –0.033 –0.051 –0.015 –0.047 –0.019 0.003 –30.6
NOTE: The 2014–2016 mean is the unadjusted mean across all ECCP and comparison residents during the 3-year intervention period, weighted by the number of residents in each year. Bold text indicates statistical significance at the 0.10 level. Standard statistical practice is to use confidence intervals of 90% or higher; 80% confidence intervals are provided here for comparison purposes only. ECCP = Enhanced Care and Coordination Provider; ED = Emergency Department. SOURCE: RTI analysis of Medicare claims data (RTI program ms07; annual_2016\ms03_xtgee).
Table 3-5 ECCP effect on count of utilization per resident, 2016, Alabama
Count of events per resident Mean, 2016 Effect 90% CI 80% CI p-value
Relative effect (% of mean)
All-cause hospitalizations 0.442 0.016 –0.037 0.070 –0.026 0.058 0.617 3.7 Potentially avoidable hospitalizations 0.183 –0.014 –0.041 0.014 –0.035 0.008 0.411 –7.5 All-cause ED visits 0.344 –0.087 –0.138 –0.036 –0.126 –0.047 0.005 –25.2 Potentially avoidable ED visits 0.109 –0.034 –0.052 –0.016 –0.048 –0.020 0.002 –31.5
NOTE: The 2016 mean is the unadjusted mean across all ECCP and comparison residents in that year. Bold text indicates statistical significance at the 0.10 level. Standard statistical practice is to use confidence intervals of 90% or higher; 80% confidence intervals are provided here for comparison purposes only. ECCP = Enhanced Care and Coordination Provider; ED = Emergency Department. SOURCE: RTI analysis of Medicare claims data (RTI program ms07; annual_2016\ms03_xtgee).

69
Table 3-6 ECCP effect on Medicare expenditures per resident per year during intervention period,
2014–2016, Alabama
Medicare expenditure
Mean, 2014-
2016 ($) Effect
($) 90% CI 80% CI p-value
Relative effect (% of mean)
Total 20,107 147 –1,286 1,580 –970 1,263 0.866 0.7 All-cause hospitalizations 4,105 103 –282 488 –197 403 0.659 2.5 Potentially avoidable hospitalizations 1,301 –61 –219 96 –184 61 0.522 –4.7 All-cause ED visits 155 –33 –54 –12 –49 –17 0.009 –21.3 Potentially avoidable ED visits 52 –10 –20 0 –18 –3 0.089 –19.9
NOTE: The 2014–2016 mean is the unadjusted mean across all ECCP and comparison residents during the three-year intervention period, weighted by the number of residents in each year. Bold text indicates statistical significance at the 0.10 level. Standard statistical practice is to use confidence intervals of 90% or higher; 80% confidence intervals are provided here for comparison purposes only. ECCP = Enhanced Care and Coordination Provider; ED = Emergency Department. SOURCE: RTI analysis of Medicare claims data (RTI program ms08; annual_2016\ms04_glm and ms04_tpm).
Table 3-7 ECCP effect on Medicare expenditures per resident, 2016, Alabama
Medicare expenditure
Mean, 2016 ($)
Effect ($) 90% CI 80% CI p-value
Relative effect (% of mean)
Total 20,309 576 –1,121 2,272 –747 1,898 0.577 2.8 All-cause hospitalizations 3,920 411 –56 878 47 775 0.148 10.5 Potentially avoidable hospitalizations
1,322 –8 –222 205 –175 158 0.948 –0.6
All-cause ED visits 152 –32 –56 –9 –51 –14 0.025 –21.3 Potentially avoidable ED visits 50 –14 –24 –5 –22 –7 0.015 –28.1
NOTE: The 2016 mean is the unadjusted mean across all ECCP and comparison residents in that year. Bold text indicates statistical significance at the 0.10 level. Standard statistical practice is to use confidence intervals of 90% or higher; 80% confidence intervals are provided here for comparison purposes only. ECCP = Enhanced Care and Coordination Provider; ED = Emergency Department. SOURCE: RTI analysis of Medicare claims data (RTI program ms08; annual_2016\ms04_glm and ms04_tpm).

70
Figure 3-2 ECCP effect on Medicare expenditures per resident per year, Alabama
NOTE: Dots indicate year-specific effects separately estimated for 2014, 2015, and 2016; triangles indicate intervention period (2014–2016) annual effects; vertical bars are 90% confidence intervals. Detailed numbers underlying the graphs are provided in Appendix H. ECCP = Enhanced Care and Coordination Provider; ED = Emergency Department. SOURCE: RTI analysis of Medicare claims data (RTI program ms08; annual_2016\ms04_glm and ms04_tpm).

71
Table 3-8 Medicaid and Medicare expenditures (in dollars) per beneficiary per month, Medicare-Medicaid dually eligible and Medicaid-
only residents: Means (standard deviations), Alabama, 2011
Category
Medicare-Medicaid Duals Medicaid-only
Medicare expenditures, PBPM in dollars, mean (SD)
Medicaid expenditures, PBPM in dollars, mean (SD)
Total combined Medicare and Medicaid expenditures, PBPM
in dollars, mean (SD) Medicaid expenditures, PBPM
in dollars, mean (SD)
ECCP Comparison ECCP Comparison ECCP Comparison ECCP Comparison
N (Residents) 2,513 4,966 2,513 4,966 2,513 4,966 173 329 Total expenditures 3,497.92 3,373.33 3,959.92 3,886.49 7,457.83 7,259.82 7,511.47 7,297.38
(8,139.66) (7,037.17) (1,514.10) (1,606.41) (8,173.61) (6,795.65) (3,930.25) (6,030.92) Subtotal of expenditures (No NF)
3,497.92 3,373.33 460.78 431.27 3,958.70 3,804.60 2,656.72 2,333.65 (8,139.66) (7,037.17) (932.44) (829.13) (8,564.67) (7,286.90) (4,086.27) (6,081.40)
All-cause hospitalizations
1,059.61 952.99 55.94 49.98 1,115.55 1,002.96 717.73 657.40 (7,065.60) (5,781.69) (435.46) (289.15) (7,347.81) (5,808.38) (2,502.18) (4,816.49)
Potentially avoidable hospitalizations
319.84 370.30 3.05 3.65 322.89 373.96 101.60 13.22
(1,905.46) (4,221.58) (46.91) (51.17) (1,906.46) (4,224.92) (596.04) (121.59)
All-cause ED visits 30.56 21.28 0.11 0.10 30.67 21.38 19.74 18.11 (166.35) (87.77) (1.59) (2.35) (166.41) (87.82) (67.35) (86.01)
Potentially avoidable ED visits
9.18 6.43 0.00 0.01 9.18 6.44 2.09 1.18 (56.28) (35.61) (0.11) (0.31) (56.28) (35.61) (8.57) (9.78)
NF Services 0.00 0.00 3,499.13 3,455.22 3,499.13 3,455.22 4,854.76 4,963.73 (0.00) (0.00) (1,613.84) (1,722.79) (1,613.84) (1,722.79) (1,391.82) (1,490.52) Prescription drugs 483.71 444.62 8.01 7.24 491.72 451.86 598.99 641.22
(475.93) (422.96) (55.26) (43.09) (479.22) (425.66) (626.27) (1,165.31)
NOTE: PBPM = per beneficiary per month; ED = emergency department; NF = nursing facility; SD = standard deviation; ECCP = Enhanced Care and Coordination Provider. SOURCE: RTI analysis of Medicaid claims data (RTI program: av13/nhpah288).

72
Table 3-9 Medicaid and Medicare expenditures (in dollars) per beneficiary per month, Medicare-Medicaid dually eligible and Medicaid-
only residents: Means (standard deviations), Alabama, 2012
Category
Medicare-Medicaid Duals Medicaid-only
Medicare expenditures, PBPM in dollars, mean (SD)
Medicaid expenditures, PBPM in dollars, mean (SD)
Total combined Medicare and Medicaid expenditures, PBPM
in dollars, mean (SD) Medicaid expenditures, PBPM
in dollars, mean (SD)
ECCP Comparison ECCP Comparison ECCP Comparison ECCP Comparison
N (Residents) 2,532 5,056 2,532 5,056 2,532 5,056 216 341 Total expenditures 3,614.60 3,480.00 4,043.12 3,865.77 7,657.72 7,345.77 8,183.81 7,116.84
(9,106.58) (7,984.41) (2,186.57) (1,604.72) (9,132.42) (7,754.84) (6,247.75) (2,472.70) Subtotal of expenditures (No NF)
3,614.60 3,480.00 489.64 465.49 4,104.25 3,945.48 2,891.82 2,173.70 (9,106.58) (7,984.41) (1,761.75) (907.13) (9,576.10) (8,237.89) (6,528.73) (2,649.26)
All-cause hospitalizations
1,158.05 1,083.00 66.96 57.11 1,225.01 1,140.11 879.74 397.67 (7,724.38) (6,868.47) (583.61) (333.42) (7,865.33) (6,917.06) (5,021.55) (1,099.72)
Potentially avoidable hospitalizations
352.12 329.70 3.47 5.68 355.58 335.38 10.01 15.63 (2,887.63) (1,887.63) (42.32) (127.17) (2,888.83) (1,892.88) (91.60) (119.80)
All-cause ED visits 34.34 25.93 0.02 0.09 34.36 26.03 42.05 19.11 (163.47) (138.38) (0.44) (4.50) (163.47) (138.44) (241.25) (58.81)
Potentially avoidable ED visits
11.13 9.18 0.00 0.00 11.13 9.19 4.26 5.20 (94.60) (105.96) (0.21) (0.08) (94.60) (105.96) (35.92) (32.73)
NF Services 0.00 0.00 3,553.47 3,400.29 3,553.47 3,400.29 5,291.99 4,943.15 (0.00) (0.00) (1,684.62) (1,710.67) (1,684.62) (1,710.67) (1,289.54) (1,197.24)
Prescription drugs 478.97 429.47 6.99 7.34 485.96 436.81 692.68 627.82 (564.31) (472.77) (23.91) (43.04) (565.69) (475.06) (932.03) (875.53)
NOTE: PBPM = per beneficiary per month; ED = emergency department; NF = nursing facility; SD = standard deviation; ECCP = Enhanced Care and Coordination Provider. SOURCE: RTI analysis of Medicaid claims data (RTI program: av13/nhpah288).

73
Table 3-10 Medicaid and Medicare expenditures (in dollars) per beneficiary per month, Medicare-Medicaid dually eligible and Medicaid-
only residents: Means (standard deviations), Alabama, 2013
Category
Medicare-Medicaid Duals Medicaid-only
Medicare expenditures, PBPM in dollars, mean (SD)
Medicaid expenditures, PBPM in dollars, mean (SD)
Total combined Medicare and Medicaid expenditures, PBPM
in dollars, mean (SD) Medicaid expenditures, PBPM
in dollars, mean (SD)
ECCP Comparison ECCP Comparison ECCP Comparison ECCP Comparison
N (Residents) 2,437 5,049 2,437 5,049 2,437 5,049 255 386 Total expenditures 3,128.72 3,910.45 4,099.38 3,916.61 7,228.10 7,827.06 9,215.42 8,600.05
(6,471.65) (21,799.51) (1,924.35) (1,618.09) (6,620.32) (21,669.97) (15,464.18) (23,773.94)
Subtotal of expenditures (No NF)
3,128.72 3,910.45 483.62 455.96 3,612.34 4,366.41 3,972.13 3,511.08 (6,471.65) (21,799.51) (1,341.44) (977.74) (6,997.46) (21,923.72) (15,576.24) (23,894.82)
All-cause hospitalizations
919.38 1,531.90 96.68 60.98 1,016.06 1,592.88 1,369.69 1,141.98 (5,191.49) (20,625.74) (1,045.34) (504.45) (5,484.96) (20,665.13) (8,302.74) (11,774.28)
Potentially avoidable hospitalizations
323.30 472.83 3.03 3.90 326.33 476.73 545.94 621.33 (4,156.84) (12,868.84) (33.07) (49.60) (4,157.43) (12,868.97) (7,258.49) (11,528.17)
All-cause ED visits 28.82 24.40 0.01 0.00 28.82 24.40 25.37 18.82 (222.11) (129.36) (0.17) (0.14) (222.11) (129.36) (116.69) (56.93)
Potentially avoidable ED visits
9.94 6.54 0.00 0.00 9.94 6.54 8.62 6.44 (183.99) (34.94) (0.02) (0.00) (183.99) (34.94) (102.66) (35.96)
NF Services 0.00 0.00 3,615.76 3,460.65 3,615.76 3,460.65 5,243.29 5,088.97 (0.00) (0.00) (1,776.21) (1,683.29) (1,776.21) (1,683.29) (1,272.38) (1,255.97)
Prescription drugs 494.03 441.92 3.64 2.95 497.67 444.87 725.38 606.99 (566.07) (490.79) (35.88) (20.91) (566.77) (491.41) (1,235.33) (742.39)
NOTE: PBPM = per beneficiary per month; ED = emergency department; NF = nursing facility; SD = standard deviation; ECCP = Enhanced Care and Coordination Provider. SOURCE: RTI analysis of Medicaid claims data (RTI program: av13/nhpah288).

74
Table 3-11 ECCP effect on MDS-based quality measures (percent of observed quarters with event per
resident per year) during intervention period, 2014–2016, Alabama
MDS-based quality measures Mean, 2014-
2016 (percent)
Effect (percentage
points) 90% CI 80% CI p-value
Relative effect (% of mean)
Decline in ADLs 13.8 1.4 –1.1 3.9 –0.5 3.3 0.348 10.2 Antipsychotic medication use 20.4 –1.4 –4.0 1.2 –3.5 0.7 0.406 –6.9
NOTE: The 2014–2016 mean is the unadjusted mean across all ECCP and comparison residents during the 3-year intervention period, weighted by the number of residents in each year. Bold text indicates statistical significance at the 0.10 level. Standard statistical practice is to use confidence intervals of 90% or higher; 80% confidence intervals are provided here for comparison purposes only. ADL = Activities of Daily Living; ECCP = Enhanced Care and Coordination Provider; MDS = Minimum Data Set. SOURCE: RTI analysis of MDS assessments data (RTI program jw20; annual_2016\qm).
Table 3-12 ECCP effect on MDS-based quality measures (percent of observed quarters with event per
resident per year), 2016, Alabama
MDS-based quality measures
Mean, 2016
(percent)
Effect (percentage
points) 90% CI 80% CI p-value
Relative effect (% of mean)
One or more falls with injury 12.6 0.8 –0.8 2.4 –0.5 2.1 0.432 6.3 Self-report moderate to severe pain
5.8 0.1 –3.0 3.2 –2.3 2.5 0.977 1.7
Pressure ulcers Stage II or higher
4.5 0.2 –0.6 1.0 –0.4 0.8 0.752 4.5
Urinary tract infection 3.6 1.2 –0.6 3.0 –0.2 2.6 0.303 33.7 Catheter inserted and left in bladder
2.7 –0.5 –1.3 0.3 –1.1 0.1 0.306 –18.8
Decline in ADLs 13.4 1.8 –1.0 4.6 –0.4 4.0 0.293 13.4 Antipsychotic medication use 18.3 –2.5 –5.3 0.3 –4.7 –0.3 0.158 –13.6 Depressive symptoms 1.5 –1.0 –1.8 –0.2 –1.6 –0.4 0.034 –66.9
NOTE: The 2016 mean is the unadjusted mean across all ECCP and comparison residents in that year. Bold text indicates statistical significance at the 0.10 level. Standard statistical practice is to use confidence intervals of 90% or higher; 80% confidence intervals are provided here for comparison purposes only. ADL = Activities of Daily Living; ECCP = Enhanced Care and Coordination Provider; MDS = Minimum Data Set. SOURCE: RTI analysis of MDS assessments data (RTI program jw20; annual_2016\qm).

75
3.1.3 Implementation
Implementation Experience Over the 4 years of the Initiative,
AQAF has shifted focus. Early on, the AQAF model was a bottom-up effort that focused primarily on efforts by the AQAF RN Coaches to train facility floor staff on Initiative goals (e.g., use of INTERACT tools to improve communication, in turn reducing potentially avoidable hospitalizations). This format presented several challenges, most notably high rates of Coach turnover, low facility engagement with and use of Initiative components, and a lack of facility understanding of key quality improvement goals. In the last year and a half of the Initiative, AQAF transitioned to a top-down format with a strong focus on training and engagement for facility leadership staff. With facility leadership buy-in and, in some cases, corporate engagement with the overall goal of reducing potentially avoidable hospitalizations, AQAF has reduced Coach turnover and has seen some improvements in staff compliance with Initiative components, including strong use of all INTERACT tools across many facilities.
Figure 3-3 summarizes key findings from the RTI Nursing Facility Administrator Survey for AQAF. It shows the trajectory of support for the ECCP by presenting longitudinal data from 2013–2016 on whether facility administrators found the training and support provided by the ECCP and its nurses to be sufficient and helpful during the Initiative. The longitudinal data on two major implementation barriers—staff resistance to change and staff turnover—are also included, as well as data on physician buy-in. Finally, the chart includes 2016 feedback from facility leadership on the perceived effectiveness of the Initiative in reducing avoidable hospitalizations and the likelihood of sustainability of the main model components.

76
Figure 3-3 RTI Nursing Facility Survey results, 2013–2016
NOTE: Number of respondents varied by survey wave and question. ECCP = Enhanced Care and Coordination Provider; INTERACT = Interventions to Reduce Acute Care Transfers; APRN = advanced practice registered nurse; RN = registered nurse; SBAR = Situation, Background, Assessment, Recommendation; AQAF = Alabama Quality Assurance Foundation SOURCE: RTI analysis of waves 1 through 4 of the RTI Nursing Facility Administrator Survey (data collected August 2013 to December of 2016).

77
Facility Staff Engagement with Initiative Components As described, facility engagement presented an early challenge to Initiative implementa-
tion. However, over time and with a shift in model focus, engagement has improved. Staff are now most engaged in quality improvement and Quality Assurance and Performance Improvement (QAPI) efforts: 57 percent of facilities were rated as highly engaged in these efforts by the RTI evaluation team (Table 3-13). These QAPI efforts include facility teams for reducing hospitalizations, medication management, and staff stability. Engagement for medication management (i.e., reducing use of antipsychotic medication and addressing poly-pharmacy concerns) was especially high (71 percent highly engaged). Engagement also was notable for involvement of AQAF Coaches (62 percent highly engaged), ongoing education and training (48 percent highly engaged), as well as use of INTERACT tools to communicate with providers (52 percent highly engaged) and document change in condition (48 percent highly engaged).
Table 3-13 Facility engagement with Initiative components, AQAF, 2016
NOTE: 21 facilities evaluated. SOURCE: RTI evaluation of facility engagement using site visit and telephone interview data collected in 2016.
Staff Buy-in In the early model of the Initiative, ECCP Coaches were responsible for training facility
staff, nurses and certified nursing assistants (CNAs), and getting staff members to adopt Initiative goals. This process was reportedly very challenging, as facility staff did not necessarily have strong relationships with ECCP Coaches, and some facility staff resented the Coaches for stepping in from outside to make substantive changes to facility practices and culture. As nurses and CNAs challenged the Initiative, several Coaches quit, leaving AQAF to find replacements

78
quickly to help retain or rekindle any facility interest in the Initiative; newer Coaches subsequently received more AQAF training to build facility relationships. The later model established AQAF’s focus on leadership training for facility administrators, which increased facility engagement at the leadership level, compared to the first years of the Initiative when most facility administrators had very little involvement. By aligning the AQAF Coaches and facility leadership toward the same Initiative goals, the facility staff members interacted with a united front that encouraged and supported them to work toward achieving these goals in most facilities. Overall, facility staff buy-in across levels (i.e., administrators, nurses, and CNAs) has improved across the four years of the Initiative.
In contrast, physician buy-in represented a larger challenge, in part due to the long-term care environment in the state. Several AQAF leadership and facility interviewees described high-level deference shown to physicians in Alabama; many physicians felt the goals of the Initiative infringed on their right to determine what would be best for patients (e.g., transferring them to the hospital, retaining antipsychotic medications, etc.). As time passed, a few physicians relaxed their initial negative reactions, as they witnessed some Initiative benefits, such as improved communication with facility staff (e.g., SBAR), or with persuasion from the AQAF medical director). However, physicians who opposed the Initiative initially typically remained opposed across all years. Approximately 25% of surveyed facilities that responded to the RTI Survey of Nursing Facility administrators reported neutral or negative responses for physician buy-in.
Beneficiary Enrollment and Buy-in AQAF automatically enrolled eligible facility residents. Across all years, facility
interviewees reported that only a handful of residents opted out of participating. Residents and families largely were unaware of the Initiative or knew only general information, such as the overarching goal of reducing the number of residents who were sent to the hospital. Since the AQAF model focused on education of facility staff and facility culture change, most Coaches had minimal interaction with residents or families. A few facilities, typically in rural areas, indicated that families prefer that their loved ones go to the hospital for any change in condition, regardless of the Initiative goals. In some cases, families also were said to oppose efforts like this Initiative, as they were perceived as negative government intervention (i.e., potential reductions in Medicare coverage or other efforts to save money at the expense of providing quality care). Some Coaches and facility staff tried engaging families through family council meetings or one-on-one conversations, but facility interviewees indicated that these attempts at changing families’ mindsets typically had no effect.
Outcomes and Successes Although most AQAF leadership inter-
viewees described the overall Initiative in posi-tive terms, they reported that it may be too soon to see positive effects on reducing potentially avoidable hospitalizations. In the RTI survey of participating AQAF facilities, 47 percent said that they feel the Initiative is extremely effective at reducing hospitalizations, and the remaining 53 percent said the Initiative is somewhat

79
effective. Interview findings from some facility staff indicated that identifying changes in condition early had helped prevent some hospital transfers for emergent conditions (e.g., urinary tract infections), but physicians and families who were resistant to the Initiative goals may have hindered some potential reductions in hospitalization rates. Likewise, interviewees explained that they felt the early bottom-up model design seemed to be less effective than the current top-down approach, which may have delayed some of the positive effects of the Initiative.
Best Practices, Sustainability, and Lessons Learned Since the start of the Initiative, AQAF leadership has viewed their ECCP as one of the
more-sustainable ECCP models because of lower costs of hiring RN Coaches, compared to advanced practice registered nurses. Because this model does not include clinical care, even without the Coach in place, facilities should be able to support and maintain the components of the Initiative for long-term sustainability. When surveyed, most facilities indicated strong support for continued use of QAPI, including medication review (74 percent very likely to continue) and root cause analysis (65 percent very likely), as well as INTERACT tools (78 percent very likely to continue SBAR, 61 percent Stop and Watch, and 57 percent Care Paths).
Primary lessons learned included the importance of hiring the right Coaches early in the Initiative development. The best Coaches were said to be individuals with clinical background, though not necessarily long-term care, and expertise in relationship-building and data management to facilitate information sharing with facilities. Obtaining buy-in from facility leadership and physicians early in the process also was said to be of utmost importance. This earlier engagement from key players, such as administrators and medical directors, might yield more positive effects on reducing hospitalizations.
3.1.4 Summary
The AQAF model seeks to effect facility culture change through staff education and a focus on enhancing facility leadership, improving quality, and encouraging use of INTERACT tools to identify and respond to changes in resident condition. The overall quantitative analysis results indicate strong evidence for a reduction in all-cause and potentially avoidable ED visits and related expenditures, with mixed to no evidence for a similar reduction in hospitalizations or total expenditures. One potential explanation for the lack of evidence showing reductions in hospitalizations is the relationship between participating NFs and hospitals. During qualitative data collection, the RTI team received consistent feedback from facility interviewees that their relationships with local hospitals were weak or nonexistent. These weak facility–hospital relationships may help explain the weak reduction in inpatient stays. The residents who were actually transferred to the ED may have been more likely to experience a hospital stay, rather than an outpatient ED visit. Also, NF physicians, particularly in the early years of the Initiative, often had poor understanding of the types of treatments available in the NFs; consequently, these physicians preferred to send residents to hospitals. In turn, hospital physicians may have
80
perceived a limited breadth of care available in NFs and may have been more inclined to hospitalize those residents that were sent to the ED. Thus, these practices could have reflected a more conservative approach to transferring residents out of NFs because of physician beliefs about severe cases that may merit a hospital admission. This approach is in keeping with the weak evidence for a small reduction in potentially avoidable hospitalizations (presumably for less serious conditions), and no evidence of an effect for all-cause hospitalizations (presumably for more severe conditions).
A secondary explanation for weaker results toward reducing hospitalizations is the general structure of the AQAF model that focuses on education and culture change. In contrast to some other ECCPs, the AQAF model relies on a transfer of knowledge from the ECCP to the facility staff without any clinical intervention from the ECCP. Consequently, success of the model is dependent on a substantial amount of time for facilities to learn new techniques (e.g., use of INTERACT tools) and consistently put them into practice. This type of process change requires more time for implementation, thus delaying the timeline when one might see tangible effects on reducing hospitalizations and expenditures. In fact, ECCP interviewees highlighted this concern, indicating that the 4 years of the Initiative were insufficient for achieving all their model goals in all facilities. The positive results in 2015 might hint at progress in some facilities, but it is unsurprising that the 2014 results were much weaker.
Lastly, the 2016 results were consistently weaker relative to the prior year, particularly for all-cause and potentially avoidable hospitalizations. During 2016, the ECCP shifted focus somewhat to target facility leadership for additional training and support. Although AQAF still included the prior model components, the new focus on leadership may have diverted attention away from the key model components (e.g., INTERACT tool use). The focus of leadership trainings was more generally aimed toward improving leadership skillsets and development (e.g., understanding data and use, improving staff stability, and general engagement and buy-in from facility leadership). As a result, specific subcomponents of the original model became less of a priority through 2016. In addition, as early as spring 2016, the ECCP began focusing on goals related to the new Payment Reform Initiative beginning in October 2016, which could have served as a distraction from the ongoing Initiative-related tasks. In some cases, the new efforts also resulted in turnover of facility-based ECCP staff, further undermining potential continued success within facilities achieving their Initiative goals.
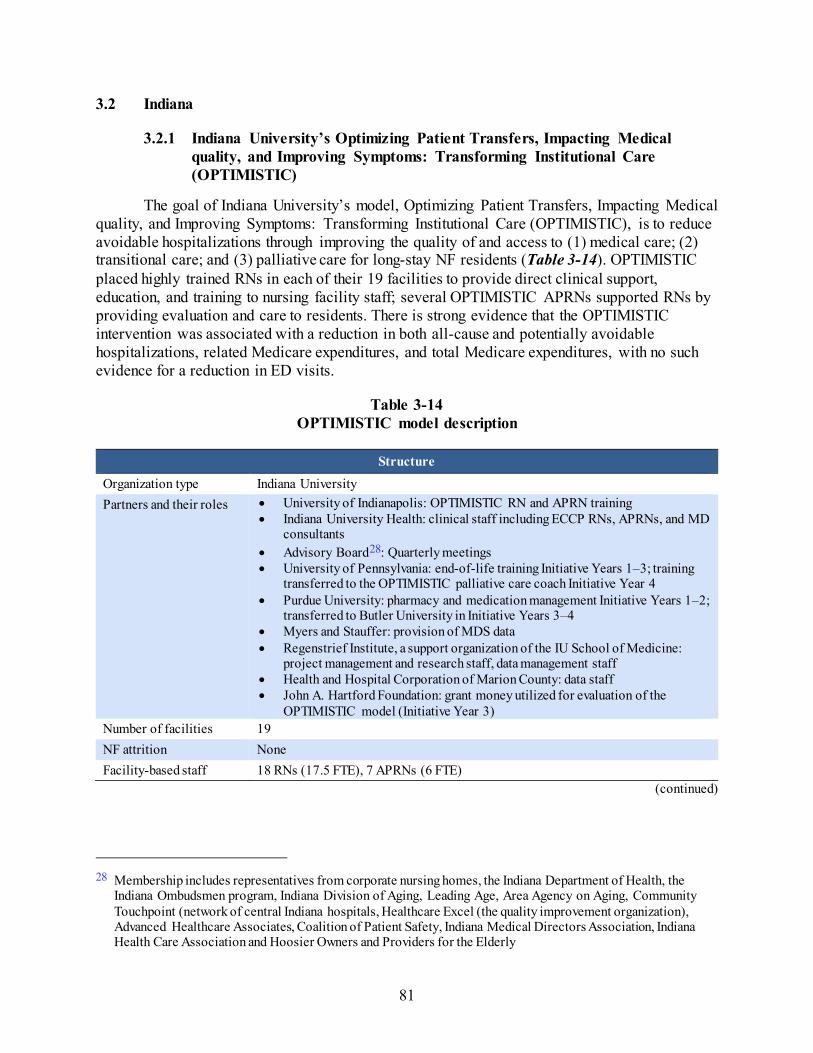
81
3.2 Indiana
3.2.1 Indiana University’s Optimizing Patient Transfers, Impacting Medical quality, and Improving Symptoms: Transforming Institutional Care (OPTIMISTIC)
The goal of Indiana University’s model, Optimizing Patient Transfers, Impacting Medical quality, and Improving Symptoms: Transforming Institutional Care (OPTIMISTIC), is to reduce avoidable hospitalizations through improving the quality of and access to (1) medical care; (2) transitional care; and (3) palliative care for long-stay NF residents (Table 3-14). OPTIMISTIC placed highly trained RNs in each of their 19 facilities to provide direct clinical support, education, and training to nursing facility staff; several OPTIMISTIC APRNs supported RNs by providing evaluation and care to residents. There is strong evidence that the OPTIMISTIC intervention was associated with a reduction in both all-cause and potentially avoidable hospitalizations, related Medicare expenditures, and total Medicare expenditures, with no such evidence for a reduction in ED visits.
Table 3-14 OPTIMISTIC model description
Structure Organization type Indiana University Partners and their roles • University of Indianapolis: OPTIMISTIC RN and APRN training
• Indiana University Health: clinical staff including ECCP RNs, APRNs, and MD consultants
• Advisory Board28: Quarterly meetings • University of Pennsylvania: end-of-life training Initiative Years 1–3; training
transferred to the OPTIMISTIC palliative care coach Initiative Year 4 • Purdue University: pharmacy and medication management Initiative Years 1–2;
transferred to Butler University in Initiative Years 3–4 • Myers and Stauffer: provision of MDS data • Regenstrief Institute, a support organization of the IU School of Medicine:
project management and research staff, data management staff • Health and Hospital Corporation of Marion County: data staff • John A. Hartford Foundation: grant money utilized for evaluation of the
OPTIMISTIC model (Initiative Year 3) Number of facilities 19 NF attrition None Facility-based staff 18 RNs (17.5 FTE), 7 APRNs (6 FTE)
(continued)
28 Membership includes representatives from corporate nursing homes, the Indiana Department of Health, the
Indiana Ombudsmen program, Indiana Division of Aging, Leading Age, Area Agency on Aging, Community Touchpoint (network of central Indiana hospitals, Healthcare Excel (the quality improvement organization), Advanced Healthcare Associates, Coalition of Patient Safety, Indiana Medical Directors Association, Indiana Health Care Association and Hoosier Owners and Providers for the Elderly

82
Table 3-14 (continued) OPTIMISTIC model description
Structure (continued) State APRN practice arrangements affecting implementation
State law requires a regulated collaborative practice agreement (CPA) with a licensed practitioner
Use of registered or higher-level nurses APRN Yes; supported the OPTIMISTIC RN and provided evaluation/assessment and care
for enrolled residents RN Yes; provided clinical support, education, and training to facility staff
Role of nurse Clinical care Yes Writing orders Yes; APRNs provide under CPA with OPTIMISTIC physicians Education Yes Weekly schedule In Initiative Years 1–3, RNs worked full time Monday through Friday in19
facilities(two smaller facilities shared one RN). APRNs worked 10 a.m. to 6 p.m., visiting assigned facilities weekly and as needed. They rotated to provide weekend coverage from 8 a.m. to noon. During Initiative Year 4, OPTIMISTIC phased out weekend coverage. APRNs covered a group of nursing facilities
Medication management Polypharmacy reduction Yes Antipsychotics reduction Yes Medication review Yes; APRNs performed reviews during transition visits and during collaborative
care reviews. Tools promoted by ECCPs to improve communication and identification of changes in resident condition
(INTERACT and others) SBAR Yes; majority of facilities used a shortened version, in either a paper or electronic
format Stop and Watch Yes; largely in paper format, not part of resident’s medical record Transfer forms An assessment at project initiation revealed that all facilities currently utilized their
own transfer forms that contained relevant data elements, thus an OPTIMISTIC transfer form was not created.
QI tool Yes, ECCP Acute Care Transfer form (based on INTERACT) and SBAR used for root cause analysis of hospitalizations; data provided back to facilities in summary reports
(continued)

83
Table 3-14 (continued) OPTIMISTIC model description
Tools promoted by ECCPs to improve communication and identification of changes in resident condition (INTERACT and others) (continued)
Care Paths INTERACT tools were available but consistency of use varied by facility; some facilities used “standing orders” and/or computerized care plans for specific diagnoses.
End-of-life planning Advance directives Yes; end-of-life discussions and POST completion; tracking on transition root cause
analysis. All OPTIMISTIC clinical staff, as well as staff at each facility, completed Respecting Choices advance care planning facilitation training.
Staff training/ discussion Yes Optional features specific to OPTIMISTIC
Collaborative Care Review (CCR)
OPTIMISTIC and facility staff reviewed stable residents to recommend treatment changes to the PCP. The CCR was modified several times during the Initiative. In Initiative Year 4, the CCR was aligned with the OPTIMISTIC polypharmacy intervention to improve efficient use of APRN time.
Note: APRN = advanced practice registered nurse; CPA = collaborative practice agreement; ECCP = Enhanced Care and Coordination Provider; FTE = full-time equivalent; INTERACT = Interventions to Reduce Acute Care Transfers; IU = Indiana University; MDS = Minimum Data Set; NF = nursing facility; PCP = primary care provider; POST = Physician’s Orders for Scope of Treatment; RN = registered nurse; SBAR = Situation, Background, Assessment, Recommendation; OPTIMISTIC = Optimizing Patient Transfers, Impacting Medical Quality, and Improving Symptoms: Transforming Institutional Care; QI = quality improvement.
3.2.2 Utilization, Expenditure, and Quality
Utilization. The ECCP intervention was associated with statistically significant reductions in the probability and count of all-cause hospitalizations and potentially avoidable hospitalizations. The interven-tion period (2014–2016) annual effect estimate was a 5.1-percentage point reduction in the probability of any all-cause hospitalization and a 3.9-percentage point reduction in the probability of any potentially avoidable hospitalization. These effect estimates were statistically significant. Given the overall mean probability of any hospitalization (26.2 percent) and potentially avoidable hospitalization (11.8 percent) across the ECCP and comparison groups in Indiana, these effects represent estimated annual reductions of 19.3 percent and 32.6 percent, respectively (Table 3-15). Based on the year-specific effect estimates, the ECCP intervention was also associated with statistically significant reductions in the probability of any all-cause or potentially avoidable hospitalization in each intervention year, including 2016 (Table 3-16, Figure 3-4). Similarly, the ECCP intervention was associated with statistically significant reductions in both the count of hospitalizations and of potentially avoidable hospitalizations. The 2014–2016 intervention period annual effect was a
KEY FINDINGS
In Indiana, the ECCP intervention was associated with statistically significant reductions in both all-cause and potentially avoidable hospitalizations and related Medicare expenditures.
Statistically significant reduction in total Medicare expenditures
Evidence for reductions in ED visits was weak In general, the effect estimates increased in magnitude
and significance from 2014–2015 but plateaued or weakened from 2015–2016.
No evidence for an effect of the Initiative on MDS-based quality measures

84
0.096 lower count of all-cause hospitalizations and a 0.054 lower count of potentially avoidable hospitalizations (Table 3-17; for 2016 effect, see Table 3-18). In the year-specific estimates for both the probability and count measures, we saw a gradual increase in the magnitude of the reduction in all-cause hospitalizations from 2014 to 2016. The magnitude of reduction in potentially avoidable hospitalizations increased from 2014 to 2015 but essentially remained the same from 2015–2016 (Figure 3-4).
Evidence for reductions in the probability and count of all-cause or potentially avoidable ED visits was weak and inconsistent, with slightly stronger evidence for potentially avoidable ED visits. While the intervention period annual effects on both the probabilities and the counts of these events indicate reductions, neither was statistically significant (Table 3-15, Table 3-17). The year-specific effect estimates were mixed, suggesting an increase (although statistically insignificant) in the probability of any ED visit in 2016. The year-specific ECCP effect suggested a slightly larger reduction in the probability of any potentially avoidable ED visit in 2016 than in 2015, but in neither year was the estimate statistically significant (Figure 3-4).
Medicare Expenditures. The ECCP intervention was associated with reduced total Medicare expenditures and reduced expenditures related to all-cause and potentially avoidable hospitalizations. The intervention period (2014–2016) annual effects show that the ECCP intervention was associated with statistically significant reductions of $1,589 per resident per year in total Medicare expenditures; $888 in expenditures for all-cause hospitalizations; and $314 in expenditures for potentially avoidable hospitalizations (Table 3-19). All year-specific estimates of the ECCP effect on expenditures were in the desired direction for these three measures from 2014–2016. However, in 2016 the year-specific effect estimates weakened from the previous year, with reductions only in the expenditures for all-cause hospitalizations remaining statistically significant (the reduction in potentially avoidable hospitalizations was marginally significant) (Table 3-20, Figure 3-5).
The intervention period annual effects suggested reductions in expenditures for both ED visits and potentially avoidable ED visits, but neither estimate was statistically significant; however, for potentially avoidable ED visits the effect estimate approached statistical significance (Table 3-19). Year-specific estimates of the ECCP effect on expenditures for these measures were mixed, with the ECCP intervention associated with a statistically insignificant increase in expenditures for all-cause ED visits and a statistically insignificant reduction in expenditures for potentially avoidable ED visits in 2016 (Table 3-20).
MDS-Based Quality. There was no consistent evidence for an effect of the ECCP intervention on MDS-based quality measures (Table 3-21, Table 3-22).

85
Table 3-15 ECCP effect on probability of any utilization per resident per year during intervention
period, 2014–2016, Indiana
Probability of having at least one:
Mean, 2014-2016 (percent)
Effect (percentage
points) 90% CI 80% CI p-value
Relative effect (% of mean)
All-cause hospitalization 26.2 –5.1 –8.2 –2.0 –7.5 –2.6 0.007 –19.3 Potentially avoidable hospitalization
11.8 –3.9 –5.9 –1.9 –5.4 –2.3 0.002 –32.6
All-cause ED visit 20.6 –0.8 –4.6 3.0 –3.8 2.2 0.728 –3.9 Potentially avoidable ED visit 7.2 –1.2 –3.5 1.2 –3.0 0.7 0.428 –15.9
NOTE: The 2014–2016 mean is the unadjusted mean across all ECCP and comparison residents during the 3-year intervention period, weighted by the number of residents in each year. Bold text indicates statistical significance at the 0.10 level. Standard statistical practice is to use confidence intervals of 90% or higher; 80% confidence intervals are provided here for comparison purposes only. ECCP = Enhanced Care and Coordination Provider; ED = Emergency Department. SOURCE: RTI analysis of Medicare claims data (RTI program ms06; annual_2016\ms01_xtgee).
Table 3-16 ECCP effect on probability of any utilization per resident, 2016, Indiana
Probability of having at least one:
Mean, 2016
(percent)
Effect (percentage
points) 90% CI 80% CI p-value
Relative effect (% of mean)
All-cause hospitalization 25.3 –5.4 –8.8 –2.0 –8.1 –2.7 0.010 –21.4 Potentially avoidable hospitalization
11.9 –3.9 –6.0 –1.7 –5.6 –2.2 0.003 –32.5
All-cause ED visit 20.7 0.5 –4.1 5.2 –3.1 4.1 0.849 2.6 Potentially avoidable ED visit 7.2 -1.6 -4.1 0.9 -3.5 0.3 0.287 -22.5
NOTE: The 2016 mean is the unadjusted mean across all ECCP and comparison residents in that year. Bold text indicates statistical significance at the 0.10 level. Standard statistical practice is to use confidence intervals of 90% or higher; 80% confidence intervals are provided here for comparison purposes only. ECCP = Enhanced Care and Coordination Provider; ED = Emergency Department. SOURCE: RTI analysis of Medicare claims data (RTI program ms06; annual_2016\ms01_xtgee).

86
Figure 3-4 ECCP effect on probability of any utilization per resident per year, Indiana
NOTE: Dots indicate year-specific effects separately estimated for 2014, 2015, and 2016; triangles indicate intervention period (2014–2016) annual effects; vertical bars are 90% confidence intervals. Detailed numbers underlying the graphs are provided in Appendix H. ECCP = Enhanced Care and Coordination Provider; ED = Emergency Department. SOURCE: RTI analysis of Medicare claims data (RTI program ms06; annual_2016\ms01_xtgee).

87
Table 3-17 ECCP effect on count of utilization per resident per year during intervention period,
2014–2016, Indiana
Count of events per resident
Mean, 2014-2016 Effect 90% CI 80% CI p-value
Relative effect (% of mean)
All-cause hospitalizations 0.384 –0.096 –0.146 –0.045 –0.135 –0.056 0.002 –24.9 Potentially avoidable hospitalizations 0.142 –0.054 –0.079 –0.029 –0.073 –0.035 <0.001 –38.1 All-cause ED visits 0.295 –0.021 –0.096 0.055 –0.080 0.038 0.649 –7.1 Potentially avoidable ED visits 0.083 –0.015 –0.044 0.015 –0.038 0.009 0.424 –17.6
NOTE: The 2014–2016 mean is the unadjusted mean across all ECCP and comparison residents during the 3-year intervention period, weighted by the number of residents in each year. Bold text indicates statistical significance at the 0.10 level. Standard statistical practice is to use confidence intervals of 90% or higher; 80% confidence intervals are provided here for comparison purposes only. ECCP = Enhanced Care and Coordination Provider; ED = Emergency Department. SOURCE: RTI analysis of Medicare claims data (RTI program ms07; annual_2016\ms03_xtgee).
Table 3-18 ECCP effect on count of utilization per resident per year, 2016, Indiana
Count of events per resident Mean, 2016 Effect 90% CI 80% CI p-value
Relative effect (% of mean)
All-cause hospitalizations 0.372 –0.101 –0.154 –0.048 –0.142 –0.060 0.002 –27.1 Potentially avoidable hospitalizations 0.143 –0.055 –0.082 –0.027 –0.076 –0.033 0.001 –38.2 All-cause ED visits 0.298 –0.007 –0.095 0.082 –0.076 0.063 0.905 –2.2 Potentially avoidable ED visits 0.081 –0.019 –0.049 0.010 –0.042 0.004 0.286 –23.6
NOTE: The 2016 mean is the unadjusted mean across all ECCP and comparison residents in that year. Bold text indicates statistical significance at the 0.10 level. Standard statistical practice is to use confidence intervals of 90% or higher; 80% confidence intervals are provided here for comparison purposes only. ECCP = Enhanced Care and Coordination Provider; ED = Emergency Department. SOURCE: RTI analysis of Medicare claims data (RTI program ms07; annual_2016\ms03_xtgee).

88
Table 3-19 ECCP effect on Medicare expenditures per resident per year during intervention period,
2014–2016, Indiana
Medicare expenditure
Mean, 2014-2016 ($) Effect ($) 90% CI 80% CI p-value
Relative effect (% of mean)
Total 23,051 –1,589 –2,966 –211 –2,662 –515 0.058 –6.9 All-cause hospitalizations 4,105 –888 –1,446 –330 –1,323 –453 0.009 –21.6 Potentially avoidable hospitalizations
1,259 –314 –580 –48 –521 –106 0.053 –24.9
All-cause ED visits 172 –15 –48 18 –41 11 0.456 –8.7 Potentially avoidable ED visits 52 –12 –27 2 –24 –1 0.170 –24.1
NOTE: The 2014–2016 mean is the unadjusted mean across all ECCP and comparison residents during the 3-year intervention period, weighted by the number of residents in each year. Bold text indicates statistical significance at the 0.10 level. Standard statistical practice is to use confidence intervals of 90% or higher; 80% confidence intervals are provided here for comparison purposes only. ECCP = Enhanced Care and Coordination Provider; ED = Emergency Department. SOURCE: RTI analysis of Medicare claims data (RTI program ms08; annual_2016\ms04_glm and ms04_tpm).
Table 3-20 ECCP effect on Medicare expenditures per resident, 2016, Indiana
Medicare expenditure Mean,
2016 ($) Effect
($) 90% CI 80% CI p-value
Relative effect (% of mean)
Total 22,493 –902 –2,588 783 –2,216 411 0.378 –4.0 All-cause hospitalizations 4,084 –725 –1,371 –79 –1,228 –222 0.065 –17.8 Potentially avoidable hospitalizations
1,313 –272 –584 40 –515 –29 0.152 –20.7
All-cause ED visits 174 9 –33 50 –24 41 0.725 5.1 Potentially avoidable ED visits 52 –10 –27 7 –24 3 0.321 –19.7
NOTE: The 2016 mean is the unadjusted mean across all ECCP and comparison residents in that year. Bold text indicates statistical significance at the 0.10 level. Standard statistical practice is to use confidence intervals of 90% or higher; 80% confidence intervals are provided here for comparison purposes only. ECCP = Enhanced Care and Coordination Provider; ED = Emergency Department. SOURCE: RTI analysis of Medicare claims data (RTI program ms08; annual_2016\ms04_glm and ms04_tpm).

89
Figure 3-5 ECCP effect on Medicare expenditures per resident per year, Indiana
NOTE: Dots indicate year-specific effects separately estimated for 2014, 2015, and 2016; triangles indicate intervention period (2014–2016) annual effects; vertical bars are 90% confidence intervals. Detailed numbers underlying the graphs are provided in Appendix H. ECCP = Enhanced Care and Coordination Provider; ED = Emergency Department. SOURCE: RTI analysis of Medicare claims data (RTI program ms08; annual_2016\ms04_glm and ms04_tpm).

90
Table 3-21 ECCP effect on MDS-based quality measures (percent of observed quarters per resident
per year with event) during intervention period, 2014–2016, Indiana
MDS-based quality measures
Mean, 2014-2016
(percent)
Effect (percentage
points) 90% CI 80% CI p-value
Relative effect (% of mean)
Decline in ADLs 14.6 0.5 –2.3 3.3 –1.7 2.7 0.748 3.4 Antipsychotic medication use 15.3 –0.9 –3.2 1.4 –2.7 0.9 0.494 –5.9
NOTE: The 2014–2016 mean is the unadjusted mean across all ECCP and comparison residents during the 3-year intervention period, weighted by the number of residents in each year. Bold text indicates statistical significance at the 0.10 level. Standard statistical practice is to use confidence intervals of 90% or higher; 80% confidence intervals are provided here for comparison purposes only. ADL = Activities of Daily Living; ECCP = Enhanced Care and Coordination Provider; MDS = Minimum Data Set. SOURCE: RTI analysis of MDS assessments data (RTI program jw20; annual_2016\qm).
Table 3-22 ECCP effect on MDS-based quality measures (percent of observed quarters per resident
with event), 2016, Indiana
MDS-based quality measures
Mean, 2016
(percent)
Effect (percentage
points) 90% CI 80% CI p-value
Relative effect (% of mean)
One or more falls with injury 14.2 2.5 –1.3 6.3 –0.4 5.4 0.279 17.6 Self-report moderate to severe pain 5.4 –2.2 –5.8 1.4 –5.0 0.6 0.315 –40.6 Pressure ulcers Stage II or higher 5.4 0.2 –0.8 1.2 –0.6 1.0 0.808 3.7 Urinary tract infection 2.7 0.4 –2.2 3.0 –1.7 2.5 0.820 15.1 Catheter inserted and left in bladder 2.6 0.0 –1.3 1.3 –1.0 1.0 0.960 0.0 Decline in ADLs 14.6 0.1 –3.5 3.7 –2.7 2.9 0.962 0.7 Antipsychotic medication use 14.3 –0.3 –3.1 2.5 –2.5 1.9 0.845 –2.1 Depressive symptoms 17.3 7.0 –1.7 15.7 0.2 13.8 0.189 40.5
NOTE: The 2016 mean is the unadjusted mean across all ECCP and comparison residents in that year. Bold text indicates statistical significance at the 0.10 level. Standard statistical practice is to use confidence intervals of 90% or higher; 80% confidence intervals are provided here for comparison purposes only. ADL = Activities of Daily Living; ECCP = Enhanced Care and Coordination Provider; MDS = Minimum Data Set. SOURCE: RTI analysis of MDS assessments data (RTI program jw20; annual_2016\qm).

91
3.2.3 Implementation
Implementation Experience OPTIMISTIC leadership recognized that successful implementation of their model
required the ability to adapt to various challenges presented over the course of the 4 years. Most of the challenges were related to staffing. First, high rates of facility staff turnover required continual rebuilding of relationships and education about the model. Second, some facilities had many inexperienced licensed practical nurses (LPNs) and fewer experienced LPNs and registered nurses (RNs). This staffing structure necessitated a significant commitment by OPTIMISTIC staff in building staff clinical skills and confidence to enable them to care for residents in place. Third, the ECCP was unable to fully staff the APRN positions. Rarely, if ever, did OPTIMISTIC have the number of APRNs they desired, so adjustments were made to the number of on-call hours worked, the number of facilities serviced by each APRN, and refocusing APRN priorities. Recruitment of registered nurses was not as challenging. Retention of both types of staff was high.
Participating facilities had competing priorities that interfered with the efforts of OPTIMISTIC to fully integrate all components of the model. Facility leadership stated budget constraints made it difficult to pull staff from direct resident care to attend educational sessions. To adapt, OPTIMISTIC moved from formal in-service sessions to more one-on-one, at-the-bedside sessions. At times, facilities were focused on their “survey window” and efforts at implementing or improving sustainability of model interventions stopped as facilities prepared for, participated in, or responded to survey-related activities. Finally, corporate policy, procedure, or other initiatives impacted implementation of model components (e.g., two facilities reported corporate liability concerns regarding decreasing antipsychotic use). Facilities had quality improvement (QI) processes in place and participation by OPTIMISTIC staff was variable.
Figure 3-6 summarizes key findings from the RTI Nursing Facility Administrator Survey for OPTIMISTIC. It shows the trajectory of support for the ECCP by presenting longitudinal data from 2013–2016 on whether facility administrators found the training and support provided by the ECCP and its nurses to be sufficient and helpful during the Initiative. The longitudinal data on two major implementation barriers—staff resistance to change and staff turnover—are also included, as well as data on physician buy-in. Finally, the chart includes 2016 feedback from facility leadership on the effectiveness of the Initiative in reducing avoidable hospitalizations and the likelihood of sustainability of the main model components.

92
Figure 3-6 RTI Nursing Facility Survey results, 2013–2016
NOTE: Number of respondents varied by survey wave and question. ECCP = Enhanced Care and Coordination Provider; INTERACT = Interventions to Reduce Acute Care Transfers; APRN = advanced practice registered nurse; RN = registered nurse; SBAR = Situation, Background, Assessment, Recommendation; OPTIMISTIC = Optimizing Patient Transfers, Impacting Medical Quality, and Improving Symptoms: Transforming Institutional Care. SOURCE: RTI analysis of waves 1 through 4 of the RTI Nursing Facility Administrator Survey (data collected August 2013 to December of 2016).

93
Facility Staff Engagement with Initiative Components Facility staff engagement with model components was generally high (Table 3-23).
Facility staff valued the expertise and modeling OPTIMISTIC nurses provided in resident assessment and care situations. OPTIMISTIC used these opportunities to teach staff how to use the INTERACT tools. However, staff typically reported they did not like or have time for additional paperwork (e.g., Stop and Watch), as INTERACT tools did not necessarily substitute for other documentation. Of all OPTIMISTIC tools, the SBAR had the highest use and was frequently included in documents sent with residents who were transferred to the hospital. In addition, both OPTIMISTIC and facilities use completed SBARs in quality improvement programs to analyze treatment and services provided to residents prior to hospital transfers. Facility staff also valued OPTIMISTIC nurses for conducting end-of-life discussions and completing Physician Orders for Scope of Treatment (POST) forms (advance care planning [ACP]). OPTIMISTIC provided education and encouraged facility staff to be involved in ACP; however, facility staff usually relied on OPTIMISTIC staff, citing that the OPTIMISTIC nurse was more knowledgeable about, was “more comfortable” with, and had more time for the discussions. Facilities indicated that they were highly engaged with ACP, provided the OPTIMISTIC nurses were present for discussions with residents and families.
Table 3-23 Facility engagement with Initiative components, OPTIMISTIC, 2016
NOTE: 14 facilities evaluated SOURCE: RTI evaluation of facility engagement using site visit and telephone interview data (data collected 2016).
94
The tool to improve communication with transition of residents to the hospital did not gain as much traction as other tools (i.e., SBAR) largely because area hospitals were not receptive to adopting the Transfer Cue Card. Facilities continued to use their own tools. Facility leadership stated OPTIMISTIC APRNs were instrumental in detecting and correcting errors with transitions of residents back into the facility from the hospital. This process included APRN review of orders and assessments of the resident post return to the facility. Over time, OPTIMISTIC evaluated two approaches to post hospitalization assessments, one with 4 to 5 visits in the first month of return and one with two assessments within an approximate 1-week time frame post return. OPTIMISTIC collected data on the two approaches and concluded that they were equally effective.
The OPTIMISTIC specific collaborative care review (CCR) was modified several times over the course of the Initiative. In its original format, the process was to analyze care of stable, long-term residents and prevent exacerbations of conditions. During the final year of the Initiative, OPTIMISTIC merged its work on polypharmacy/antipsychotic drug use with the CCR and felt this combination was an efficient approach to both interventions. Residents selected for CCR were those residents who were on 12 or more medications.
Facilities embraced OPTIMISTIC efforts aimed at reducing medications, including efforts to reduce antipsychotics. The efforts to reduce antipsychotics included training and nonpharmacological approaches to dementia care and review of antipsychotic medication appropriateness during CCR activities. At the end of the Initiative, APRNs were instrumental in facilitating reduction in other medication classes; however, the APRN did not address antipsychotic medications unless specifically asked to do so by facility staff. Finally, OPTIMISTIC attempted to provide facilities with data and other QI activities. Many facilities tracked hospitalizations as part of corporate practice. Facilities often reviewed completed SBARs and used information learned from APRN transition visits to identify patterns and trends in hospitalizations. This analysis presented opportunities to prevent future hospitalizations. However, facilities generally were not very engaged with ECCP QI efforts, citing they had their own QI processes in place.
Staff Buy-in Several activities helped with facility and provider buy-in. Throughout the Initiative,
facility leadership reported more fully utilizing OPTIMISTIC staff when there was clarity of roles, responsibilities, and expectations. OPTIMISTIC RNs were more easily assimilated into facilities when they were readily accessible to staff and participated in facility activities such as meetings and multidisciplinary rounds. Providers were open to OPTIMISTIC APRNs serving their residents when it was made clear the APRNs were not “stealing” their residents. Facilities were not receptive to model components they perceived were redundant or interfered with resident direct care activities.
Beneficiary Enrollment and Buy-in Residents and families appreciated the OPTIMISTIC nurses though they often were
unable to clearly articulate the components of the program; most eligible residents were enrolled in the Initiative with minimal disenrollment. Residents and families often recognized the OPTIMISTIC staff because of ACP activities and completion of POST forms.

95
Outcomes and Successes During interviews, facility leadership
and nursing staff expressed belief that certain model components reduced potentially avoidable hospitalizations. They most frequently cited the additional clinical expertise and guidance of OPTIMISTIC nurses, particularly RNs, during real-time changes in condition. Staff appreciated the skills and abilities of the APRN when the APRN was on-site but used the primary care provider (PCP) if a phone call was necessary. Staff stated that because the PCP needs to be notified of changes in condition (a federal regulation), calling the PCP was more expeditious. Several facilities and at least one PCP stated the OPTIMISTIC nurses improved resident care by enhancing the interdisciplinary team approach, and that prior to OPTIMISTIC, the care team worked “in silos.”
Facility leadership shared that having completed POST forms has contributed to decreasing potentially avoidable hospitalizations. Staff reported feeling “less panicked” when they knew what the resident/family’s wishes were, and therefore were less predisposed to call 911 in crisis situations. For the most part, residents and families reported that knowing the capabilities of the facility and the risks of hospitalization resulted in them being more comfortable with treating the resident at the facility. Facilities reported that residents and families continued to drive decisions regarding hospitalizations.
Despite inconsistent use of other model tools, nursing staff reported that using the SBAR resulted in decreased hospitalizations because of improved assessments and communication with physicians. This was particularly helpful when communicating with on-call physicians who often were not familiar with residents.
Finally, some facilities stated the OPTIMISTIC APRNs prevented “bounce-backs” to the hospital because of more intense follow-up with the residents after hospitalizations. In addition to the actual resident clinical assessment, APRNs did more in-depth review of readmission treatment and orders, specifically looking at medication orders and need for laboratory services.
As the Initiative evolved, OPTIMISTIC recognized that the tools and approaches used in the model were important; however, they believed the success of the model was reliant on how these interventions were implemented.

96
Best Practices, Sustainability, and Lessons Learned OPTIMISTIC identified several factors
it believed were significant to implementation. These included having clear expectations for OPTIMISTIC RNs and APRNs with metrics defining successful performance. OPTIMISTIC leadership also identified that successful OPTIMISTIC nurses needed excellent clinical skills and knowledge and expertise in areas such as information technology, data collection, organizational change, and communication. Furthermore, OPTIMISTIC identified it was important to perform a facility needs assessment to match OPTIMISTIC staff strengths and weaknesses to the facility needs. In conclusion, the majority of facility administrators who responded to the Initiative Year 4 survey stated they were likely/very likely to continue with the RN/APRN position, INTERACT tools, root cause analysis, and medication review interventions. However, during on-site and telephone interviews, the overwhelming majority of facilities stated they could not afford either the RN or APRN positions, though they indicated that these positions were invaluable in the facilities. Administrators expressed that they would like to sustain the ECCP RN or APRN positions, but assuming insufficient funds to cover the cost of hiring, they said existing facility staff would need to assume responsibility for the intervention components, even though they often reported not having the time or expertise demonstrated by OPTIMISTIC staff.
3.2.4 Summary
Indiana University Geriatrics Department’s OPTIMISTIC placed highly trained RNs in each of their 19 facilities to provide direct clinical support, education, and training to nursing facility staff. Several OPTIMISTIC APRNs supported these OPTIMISTIC RNs by providing evaluation and care to residents.
As previously noted, the OPTIMISTIC intervention was associated with reduced probability and count of utilization of all-cause and potentially avoidable hospitalizations, as well as reduced expenditures for these types of utilization. Participants in OPTIMISTIC frequently identified the presence of the full-time ECCP RN in the facility and the focus on end of life discussions and completion of POST forms as the most valuable pieces of the model; interviewees indicated that these components had the most impact on reducing potentially avoidable hospitalizations. Facility leadership also reported that OPTIMISTIC nurses educating staff in clinical areas and in use of tools, such as the SBAR, improved the assessment and communication skills of staff, enabling staff and physicians to treat more residents in place. Finally, facilities reported that OPTIMISTIC APRNs’ assessments and recommendations during transition visits were successful in preventing further hospitalizations among those residents transitioning back to the facility from the hospital.
The implementation of the OPTIMISTIC intervention also evolved over time, which may help to explain the trends in year-specific effect estimates from quantitative analyses, which generally improved from 2014–2015 and weakened from 2015–2016. As the intervention

97
progressed, the OPTIMISTIC team focused on the way in which the model was implemented as a key to the success of the model. For example, the leadership team developed metrics for ECCP facility staff that ensured staff devoted sufficient effort to the various model interventions. In addition, the efforts of the OPTIMISTIC APRNs shifted over the Initiative years to focus more on evaluation of residents transitioning back to the facility after an acute care stay and on issues related to polypharmacy, and less on the CCRs that targeted the more stable long-term residents. These ongoing efforts to ensure the model was fully implemented among OPTIMISTIC residents may explain the general improvement in the results from 2014–2015. One possible explanation for the weakening, in general, of the ECCP effect in 2016 was the focus among facility and OPTIMISITIC staff on the new, Payment Reform Initiative that began in October 2016, which likely drew focus away from the continued implementation of the Initiative. Another explanation is that the ECCP RN and APRN turnover and facility reassignment, while not very high overall, was slightly higher in the last year of the Initiative.
There was no evidence for an effect of the ECCP intervention on MDS-based quality measures. Although OPTIMISTIC tested a pilot program for a subset of ECCP RNs who completed QAPI projects, the pilot was unsuccessful. Most ECCP RNs contributed to QI meetings by providing updates on the use of INTERACT tools and POST forms rather than targeting QAPI efforts to additional projects.

98
3.3 Missouri
3.3.1 University of Missouri, Sinclair School of Nursing Missouri Quality Initiative for Nursing Homes (MOQI)
The vision of the Missouri Quality Initiative Intervention Model was to transform certified nursing facilities with high hospitalization rates and populations of Medicare/Medicaid beneficiaries through the MOQI Intervention into facilities with reduced rates of avoidable hospitalizations, improved health outcomes and transitions between hospitals and nursing facilities, and reduced health care costs. APRNs were hired to work in each of 16 nursing homes to provide direct services to residents while mentoring, role-modeling, and educating the nursing staff about early symptom/illness recognition, assessment, and management of health conditions commonly affecting nursing facility residents.29 The role of the APRN included patient assessment and clinical care (without writing orders) and education, training, and support for facility staff in using INTERACT tools to document changes in resident condition, advance directives, medication reduction, and QI activities. The ECCP also supported health information technology (HIT) implementation of the encrypted CareMail and CareView systems for hospital transfers (Table 3-24). There is strong evidence that the MOQI intervention was associated with reductions in all hospitalization- and ED-related utilization and expenditures.
Table 3-24 MOQI model description
Structure
Organization type Quality Improvement Organization (QIO): University of Missouri Sinclair School of Nursing
Partners and their roles • Primaris: Missouri QIO, Staffed the health information coordinator (HIC) providing health information technology (HIT) training and support. Also staffed the care transitions coach (CTC) providing support on quality improvement and advance directives from the Base Year through Spring of Initiative Year 4.
• Missouri Health Connection (MHC): Federally designated health information exchange for Missouri. Developed and administered secure communication portals, CareMail and CareView, for the ECCP.
Number of facilities 16 participating facilities (1 facility located in remote rural area); no NFs left the Initiative
NF attrition None
(continued)
29 Missouri Quality Initiative (MOQI) for Nursing Homes: Operations Manual, revised January 13, 2015.

99
Table 3-24 (continued) MOQI model description
Structure
Facility-based staff 17 FTEs total: 17 advanced practice registered nurses (APRN) (1 FTE APRN in each NF and 1 FTE float APRN)
State APRN practice arrangements affecting implementation
State law requires a collaborative practice agreement (CPA) with an outside physician for the APRN to write orders. Each physician is limited to having CPAs with a maximum of 3 APRNs.
Use of registered or higher-level nurses
APRN Yes RN None
Role of nurse
Clinical care Yes Writing orders No. The ECCP attempted to set up CPAs between APRNs and facility
physicians; however, the limit of 3 CPAs per physician in Missouri made this unfeasible.
Education Yes Weekly schedule APRNs worked in their assigned facilities full time 5 days per week (9 a.m. to 5
p.m.) Some offered on-call support on nights and weekends but were not provided additional reimbursement for doing so.
Medication management
Polypharmacy reduction Yes Antipsychotics reduction Yes Medication review Yes; conducted by APRNs in collaboration with NF staff and consulting
pharmacists
Tools promoted by ECCPs to improve communication and identification of changes in resident condition (INTERACT and others)
SBAR Yes; MOQI trained all facilities, used in all facilities with various levels of success Both paper and electronic depending on facility EMR.
Stop and Watch Yes; MOQI trained all facilities, used in all facilities with various levels of success Paper only
Transfer forms Only used in a few NFs; NFs generally used NF specific transfer tool; SBAR sometimes used as a transfer tool
(continued)

100
Table 3-24 (continued) MOQI model description
Tools promoted by ECCPs to improve communication and identification of changes in resident condition (INTERACT and others)
QI tool Yes, ECCP Acute Care Transfer form used for root cause analysis (RCA) of hospitalizations; data provided back to facilities in summary reports (MDs responsible for admissions are identified)
Care Paths Yes, Used in some NFs
End-of-life planning
Advance directives Yes Staff training/ discussion Yes
Optional features specific to MOQI
Education Condition and patient care education and training tailored to facility needs with multiple components available to choose from. APRNs provided education on most model components. Primaris’ HIC provided education and training on HIT. Primaris’ CTC provided education and training on QI and end-of-life care
HIT MHC administered and provided helpdesk support for CareMail, a HIPPA compliant e-mail platform, and CareView, a HIPPA-compliant health information exchange portal used to query resident’s EMR after a hospitalization. HIT lead and HIC provided education and support for CareMail and CareView
Note: APRN = advanced practice registered nurse; ECCP = Enhanced Care and Coordination Provider; EMR = electronic medical record; FTE = full-time equivalent; HIPPA = Health Insurance Portability and Accountability Act; INTERACT = Interventions to Reduce Acute Care Transfers; MD = medical director; MOQI = University of Missouri, Sinclair School of Nursing Missouri Quality Initiative for Nursing Homes; NF = nursing facility; ; RN = registered nurse; SBAR = Situation, Background, Assessment, Recommendation; QI = quality improvement.
3.3.2 Utilization, Expenditure, and Quality
Utilization. The ECCP intervention in Missouri was associated with reductions in the probability of all-cause and poten-tially avoidable hospitalizations and emergency department visits.
The intervention period (2014–2016) annual effect was a statistically significant 7.9-percentage point lower probability of an all-cause hospitalization and a statistically significant 6.1-percentage point lower probability of a potentially avoidable hospitalization. Given the overall probability of hospitalization and potentially avoidable hospitalization of 28.7 percent and 13.4 percent, respectively, these percentage-point intervention effects represent reductions of 27.4 percent and 45.3 percent of the overall probabilities (Table 3-25). These results were consistent with the year-specific intervention effect in 2016, which was a statistically significant 8.2-percentage point lower probability of an all-cause hospitalization and a statistically significant 5.1-percentage point lower probability of a potentially avoidable hospitalization (Table 3-26).
KEY FINDINGS
In Missouri, there were statistically significant reductions in all expenditure and utilization measures over the intervention period, 2014–2016.
Reductions mostly consistent across years with an uptick in the effects in 2015 for all the measures.
No statistically significant effects on MDS-based quality measures.
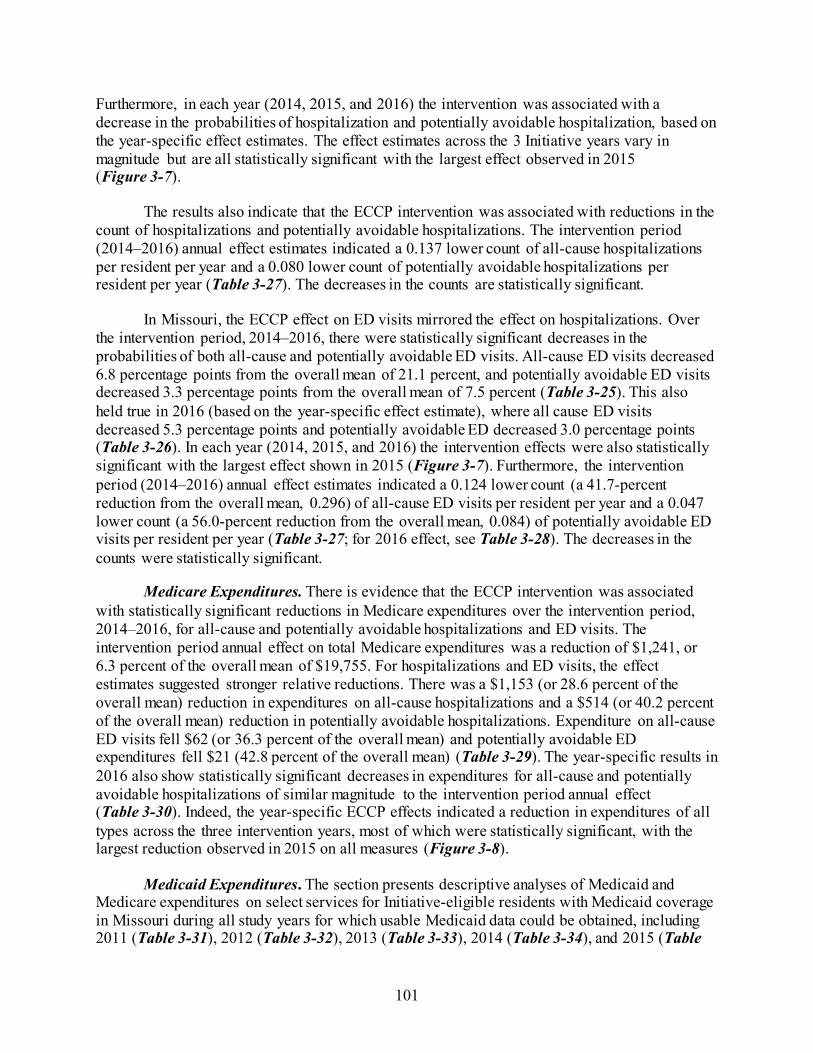
101
Furthermore, in each year (2014, 2015, and 2016) the intervention was associated with a decrease in the probabilities of hospitalization and potentially avoidable hospitalization, based on the year-specific effect estimates. The effect estimates across the 3 Initiative years vary in magnitude but are all statistically significant with the largest effect observed in 2015 (Figure 3-7).
The results also indicate that the ECCP intervention was associated with reductions in the count of hospitalizations and potentially avoidable hospitalizations. The intervention period (2014–2016) annual effect estimates indicated a 0.137 lower count of all-cause hospitalizations per resident per year and a 0.080 lower count of potentially avoidable hospitalizations per resident per year (Table 3-27). The decreases in the counts are statistically significant.
In Missouri, the ECCP effect on ED visits mirrored the effect on hospitalizations. Over the intervention period, 2014–2016, there were statistically significant decreases in the probabilities of both all-cause and potentially avoidable ED visits. All-cause ED visits decreased 6.8 percentage points from the overall mean of 21.1 percent, and potentially avoidable ED visits decreased 3.3 percentage points from the overall mean of 7.5 percent (Table 3-25). This also held true in 2016 (based on the year-specific effect estimate), where all cause ED visits decreased 5.3 percentage points and potentially avoidable ED decreased 3.0 percentage points (Table 3-26). In each year (2014, 2015, and 2016) the intervention effects were also statistically significant with the largest effect shown in 2015 (Figure 3-7). Furthermore, the intervention period (2014–2016) annual effect estimates indicated a 0.124 lower count (a 41.7-percent reduction from the overall mean, 0.296) of all-cause ED visits per resident per year and a 0.047 lower count (a 56.0-percent reduction from the overall mean, 0.084) of potentially avoidable ED visits per resident per year (Table 3-27; for 2016 effect, see Table 3-28). The decreases in the counts were statistically significant.
Medicare Expenditures. There is evidence that the ECCP intervention was associated with statistically significant reductions in Medicare expenditures over the intervention period, 2014–2016, for all-cause and potentially avoidable hospitalizations and ED visits. The intervention period annual effect on total Medicare expenditures was a reduction of $1,241, or 6.3 percent of the overall mean of $19,755. For hospitalizations and ED visits, the effect estimates suggested stronger relative reductions. There was a $1,153 (or 28.6 percent of the overall mean) reduction in expenditures on all-cause hospitalizations and a $514 (or 40.2 percent of the overall mean) reduction in potentially avoidable hospitalizations. Expenditure on all-cause ED visits fell $62 (or 36.3 percent of the overall mean) and potentially avoidable ED expenditures fell $21 (42.8 percent of the overall mean) (Table 3-29). The year-specific results in 2016 also show statistically significant decreases in expenditures for all-cause and potentially avoidable hospitalizations of similar magnitude to the intervention period annual effect (Table 3-30). Indeed, the year-specific ECCP effects indicated a reduction in expenditures of all types across the three intervention years, most of which were statistically significant, with the largest reduction observed in 2015 on all measures (Figure 3-8).
Medicaid Expenditures. The section presents descriptive analyses of Medicaid and Medicare expenditures on select services for Initiative-eligible residents with Medicaid coverage in Missouri during all study years for which usable Medicaid data could be obtained, including 2011 (Table 3-31), 2012 (Table 3-32), 2013 (Table 3-33), 2014 (Table 3-34), and 2015 (Table

102
3-35). Please note that, unlike the Medicare multivariate regression analyses described above, the Medicaid expenditure results presented in this section are descriptive. Descriptive statistics cannot be taken as results of an intervention. The observed trends must be understood within the context of possible changes in ECCP resident characteristics as well as each state’s comparison group.
Overall, Table 3-31 through Table 3-35 illustrate that across all years total combined Medicare and Medicaid expenditures for the Medicare-Medicaid duals group and the total Medicaid expenditures for the Medicaid-only group were driven by all-cause hospitalizations and NF facility expenditures. Across all years, total expenditures were higher for the Medicaid-only group. Among Medicare-Medicaid duals, excluding Medicaid NF expenditures, average total combined Medicare and Medicaid expenditures PBPM for each service type were primarily driven by Medicare payments with Medicaid paying only a small portion of the combined expenditures. The ECCP group’s expenditures on all-cause hospitalizations were lower across all years among the Medicaid-only group. The ECCP group had lower expenditures than the comparison group on all-cause and potentially avoidable hospitalizations among the Medicare-Medicaid duals group beginning in 2013.
Note that there are some anomalies in the Medicaid data that we were unable to resolve. In 2014 the total number of beneficiaries and the number of beneficiaries with nursing facility claims was significantly lower than in other years. In 2012, the total number of nursing facility claims was significantly lower than in other years and the number of beneficiaries with nursing facility claims was slightly lower than in other years. Lastly, some claims which were assigned to the SNF category may have truly been NF claims, but were categorized as SNF due to limitations in the data; thus, the expenditures associated with NF services may be underestimated.
MDS-Based Quality. Unlike the utilization and expenditure results, no statistically significant effects were found for MDS-based quality measures in Missouri, based on either the intervention period (2014–2016) annual effect estimates (Table 3-36) or the year-specific effect estimates in 2016 (Table 3-37). Thus, there was no evidence in Missouri of an ECCP intervention effect on any of the MDS-based quality measures.

103
Table 3-25 ECCP effect on probability of any utilization per resident per year during intervention
period, 2014–2016, Missouri
Probability of having at least one:
Mean, 2014-2016
(percent)
Effect (percentage
points) 90% CI 80% CI p-value
Relative effect (% of mean)
All-cause hospitalization 28.7 –7.9 –10.0 –5.7 –9.5 –6.2 <0.001 –27.4 Potentially avoidable hospitalization
13.4 –6.1 –8.1 –4.1 –7.6 –4.5 <0.001 –45.3
All-cause ED visit 21.1 –6.8 –9.4 –4.1 –8.9 –4.7 <0.001 –32.1 Potentially avoidable ED visit 7.5 –3.3 –4.9 –1.7 –4.5 –2.0 0.001 –43.9
NOTE: The 2014–2016 mean is the unadjusted mean across all ECCP and comparison residents during the 3-year intervention period, weighted by the number of residents in each year. Bold text indicates statistical significance at the 0.10 level. Standard statistical practice is to use confidence intervals of 90% or higher; 80% confidence intervals are provided here for comparison purposes only. ECCP = Enhanced Care and Coordination Provider; ED = Emergency Department. SOURCE: RTI analysis of Medicare claims data (RTI program ms06; annual_2016\ms01_xtgee).
Table 3-26 ECCP effect on probability of any utilization per resident per year, 2016, Missouri
Probability of having at least one:
Mean, 2016
(percent)
Effect (percentage
points) 90% CI 80% CI p-value
Relative effect (% of mean)
All-cause hospitalization 27.0 –8.2 –11.8 –4.7 –11.0 –5.4 <0.001 –30.5 Potentially avoidable hospitalization
12.3 –5.1 –7.6 –2.6 –7.1 –3.1 0.001 –41.4
All-cause ED visit 20.0 –5.3 –9.1 –1.5 –8.2 –2.4 0.021 –26.5 Potentially avoidable ED visit 7.2 –3.0 –5.1 –0.8 –4.7 –1.3 0.022 –41.3
NOTE: The 2016 mean is the unadjusted mean across all ECCP and comparison residents in that year. Bold text indicates statistical significance at the 0.10 level. Standard statistical practice is to use confidence intervals of 90% or higher; 80% confidence intervals are provided here for comparison purposes only. ECCP = Enhanced Care and Coordination Provider; ED = Emergency Department. SOURCE: RTI analysis of Medicare claims data (RTI program ms06; annual_2016\ms01_xtgee).

104
Figure 3-7 ECCP effect on probability of any utilization per resident per year, Missouri
NOTE: Dots indicate year-specific effects separately estimated for 2014, 2015, and 2016; triangles indicate intervention period (2014–2016) annual effects; vertical bars are 90% confidence intervals. Detailed numbers underlying the graphs are provided in Appendix H. ECCP = Enhanced Care and Coordination Provider; ED = Emergency Department. SOURCE: RTI analysis of Medicare claims data (RTI program ms06; annual_2016\ms01_xtgee).

105
Table 3-27 ECCP effect on count of utilization per resident per year during intervention period, 2014–
2016, Missouri
Count of events per resident
Mean, 2014-2016 Effect 90% CI 80% CI p-value
Relative effect (% of mean)
All-cause hospitalizations 0.427 –0.137 –0.175 –0.099 –0.166 –0.107 <0.001 –32.0 Potentially avoidable hospitalizations 0.160 –0.080 –0.104 –0.057 –0.098 –0.062 <0.001 –49.9 All-cause ED visits 0.296 –0.124 –0.163 –0.084 –0.154 –0.093 <0.001 –41.7 Potentially avoidable ED visits 0.084 –0.047 –0.064 –0.030 –0.060 –0.034 <0.001 –56.0
NOTE: The 2014–2016 mean is the unadjusted mean across all ECCP and comparison residents during the 3-year intervention period, weighted by the number of residents in each year. Bold text indicates statistical significance at the 0.10 level. Standard statistical practice is to use confidence intervals of 90% or higher; 80% confidence intervals are provided here for comparison purposes only. ECCP = Enhanced Care and Coordination Provider; ED = Emergency Department. SOURCE: RTI analysis of Medicare claims data (RTI program ms07; annual_2016\ms03_xtgee).
Table 3-28 ECCP effect on count of utilization per resident per year, 2016, Missouri
Count of events per resident Mean, 2016 Effect 90% CI 80% CI p-value
Relative effect (% of mean)
All-cause hospitalizations 0.400 –0.134 –0.187 –0.080 –0.175 –0.092 <0.001 –33.4 Potentially avoidable hospitalizations 0.148 –0.070 –0.100 –0.040 –0.094 –0.047 <0.001 –47.6 All-cause ED visits 0.289 –0.091 –0.154 –0.029 –0.140 –0.043 0.016 –31.6 Potentially avoidable ED visits 0.082 –0.043 –0.065 –0.022 –0.060 –0.026 0.001 –52.8
NOTE: The 2016 mean is the unadjusted mean across all ECCP and comparison residents in that year. Bold text indicates statistical significance at the 0.10 level. Standard statistical practice is to use confidence intervals of 90% or higher; 80% confidence intervals are provided here for comparison purposes only. ECCP = Enhanced Care and Coordination Provider; ED = Emergency Department. SOURCE: RTI analysis of Medicare claims data (RTI program ms07; annual_2016\ms03_xtgee).
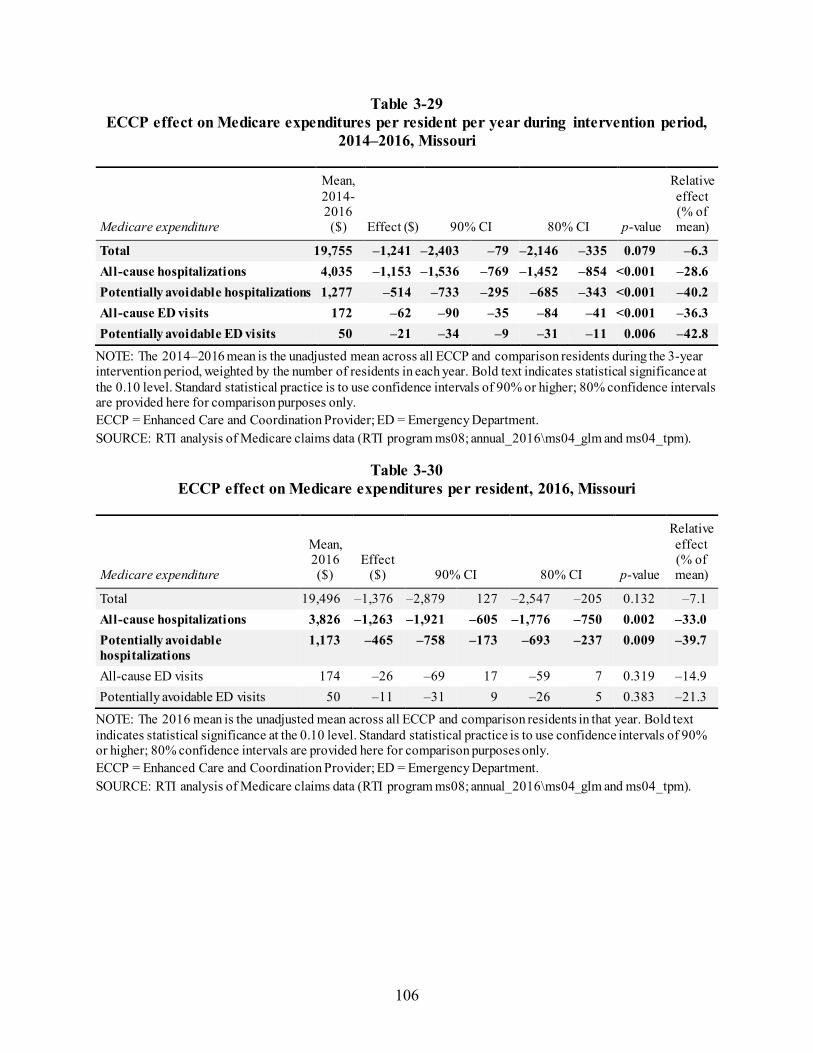
106
Table 3-29 ECCP effect on Medicare expenditures per resident per year during intervention period,
2014–2016, Missouri
Medicare expenditure
Mean, 2014-2016 ($) Effect ($) 90% CI 80% CI p-value
Relative effect (% of mean)
Total 19,755 –1,241 –2,403 –79 –2,146 –335 0.079 –6.3 All-cause hospitalizations 4,035 –1,153 –1,536 –769 –1,452 –854 <0.001 –28.6 Potentially avoidable hospitalizations 1,277 –514 –733 –295 –685 –343 <0.001 –40.2 All-cause ED visits 172 –62 –90 –35 –84 –41 <0.001 –36.3 Potentially avoidable ED visits 50 –21 –34 –9 –31 –11 0.006 –42.8
NOTE: The 2014–2016 mean is the unadjusted mean across all ECCP and comparison residents during the 3-year intervention period, weighted by the number of residents in each year. Bold text indicates statistical significance at the 0.10 level. Standard statistical practice is to use confidence intervals of 90% or higher; 80% confidence intervals are provided here for comparison purposes only. ECCP = Enhanced Care and Coordination Provider; ED = Emergency Department. SOURCE: RTI analysis of Medicare claims data (RTI program ms08; annual_2016\ms04_glm and ms04_tpm).
Table 3-30 ECCP effect on Medicare expenditures per resident, 2016, Missouri
Medicare expenditure
Mean, 2016 ($)
Effect ($) 90% CI 80% CI p-value
Relative effect (% of mean)
Total 19,496 –1,376 –2,879 127 –2,547 –205 0.132 –7.1 All-cause hospitalizations 3,826 –1,263 –1,921 –605 –1,776 –750 0.002 –33.0 Potentially avoidable hospitalizations
1,173 –465 –758 –173 –693 –237 0.009 –39.7
All-cause ED visits 174 –26 –69 17 –59 7 0.319 –14.9 Potentially avoidable ED visits 50 –11 –31 9 –26 5 0.383 –21.3
NOTE: The 2016 mean is the unadjusted mean across all ECCP and comparison residents in that year. Bold text indicates statistical significance at the 0.10 level. Standard statistical practice is to use confidence intervals of 90% or higher; 80% confidence intervals are provided here for comparison purposes only. ECCP = Enhanced Care and Coordination Provider; ED = Emergency Department. SOURCE: RTI analysis of Medicare claims data (RTI program ms08; annual_2016\ms04_glm and ms04_tpm).

107
Figure 3-8 ECCP effect on Medicare expenditures per resident per year, Missouri
NOTE: Dots indicate year-specific effects separately estimated for 2014, 2015, and 2016; triangles indicate intervention period (2014–2016) annual effects; vertical bars are 90% confidence intervals. Detailed numbers underlying the graphs are provided in Appendix H. ECCP = Enhanced Care and Coordination Provider; ED = Emergency Department. SOURCE: RTI analysis of Medicare claims data (RTI program ms08; annual_2016\ms04_glm and ms04_tpm).

108
Table 3-31 Medicaid and Medicare expenditures (in dollars) per beneficiary per month, Medicare-Medicaid dually eligible and Medicaid-
only residents: Means (standard deviations), Missouri, 2011
Category
Medicare-Medicaid Duals Medicaid-only
Medicare expenditures, PBPM in dollars, mean (SD)
Medicaid expenditures, PBPM in dollars, mean (SD)
Total combined Medicare and Medicaid expenditures, PBPM in
dollars, mean (SD) Medicaid expenditures, PBPM in
dollars, mean (SD)
ECCP Comparison ECCP Comparison ECCP Comparison ECCP Comparison
N (Residents) 1,536 2,872 1,536 2,872 1,536 2,872 96 268 Total expenditures
3,485.12 3,377.48 2,499.16 2,672.40 5,984.28 6,049.88 8,796.90 10,512.66 (4,632.58) (4,375.79) (3,135.17) (4,293.08) (5,870.48) (6,287.04) (14,736.68) (18,456.54)
Subtotal of expenditures (No NF)
3,485.12 3,377.48 624.87 702.95 4,109.99 4,080.43 5,828.15 6,688.56 (4,632.58) (4,375.79) (2,355.48) (3,379.34) (5,719.03) (5,935.46) (14,269.23) (17,357.95)
All-cause hospitalizations
1,009.36 829.74 63.33 73.77 1,072.69 903.51 2,787.82 2,905.66 (3,162.42) (2,728.77) (885.14) (754.83) (3,424.35) (2,979.22) (9,533.66) (12,450.44)
Potentially avoidable hospitalizations
387.04 287.13 13.14 21.41 400.18 308.55 705.53 512.92 (1,969.64) (1,659.83) (120.08) (325.87) (1,976.71) (1,703.55) (2,888.72) (2,834.88)
All-cause ED visits
19.88 27.06 3.72 8.06 23.60 35.12 0.00 0.16 (60.63) (107.75) (23.80) (66.99) (67.99) (140.78) (0.00) (1.90)
Potentially avoidable ED visits
5.36 8.60 1.35 2.19 6.72 10.80 0.00 0.09 (27.64) (55.25) (13.67) (18.28) (34.55) (64.07) (0.00) (1.42)
NF Services 0.00 0.00 1,874.29 1,969.45 1,874.29 1,969.45 2,968.75 3,824.11 (0.00) (0.00) (2,180.78) (2,426.93) (2,180.78) (2,426.93) (1,738.29) (3,146.25)
Prescription drugs
459.47 479.75 31.18 29.33 490.65 509.08 1,409.70 1,411.21
(544.60) (533.58) (121.53) (159.63) (560.13) (559.32) (2,676.94) (2,205.34)
NOTE: PBPM = per beneficiary per month; ED = emergency department; NF = nursing facility; SD = standard deviation; ECCP = Enhanced Care and Coordination Provider. SOURCE: RTI analysis of Medicaid claims data (RTI program: nc03/nhpah294b).
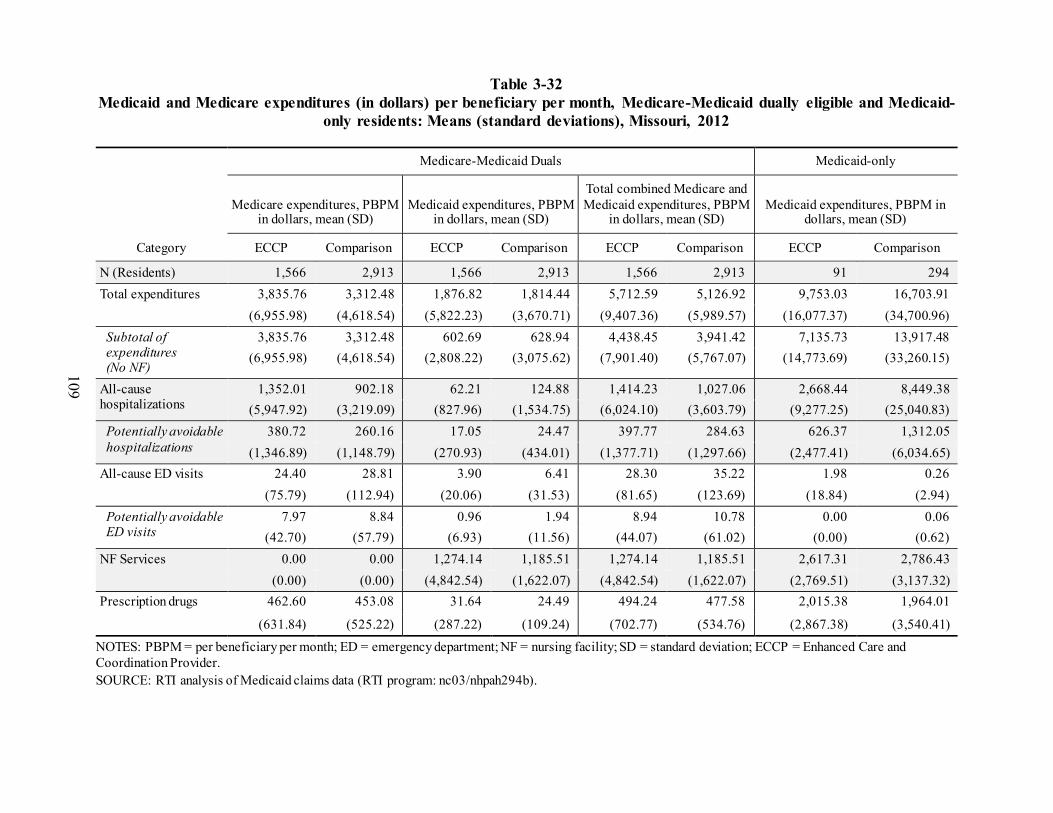
109
Table 3-32 Medicaid and Medicare expenditures (in dollars) per beneficiary per month, Medicare-Medicaid dually eligible and Medicaid-
only residents: Means (standard deviations), Missouri, 2012
Category
Medicare-Medicaid Duals Medicaid-only
Medicare expenditures, PBPM in dollars, mean (SD)
Medicaid expenditures, PBPM in dollars, mean (SD)
Total combined Medicare and Medicaid expenditures, PBPM
in dollars, mean (SD) Medicaid expenditures, PBPM in
dollars, mean (SD)
ECCP Comparison ECCP Comparison ECCP Comparison ECCP Comparison
N (Residents) 1,566 2,913 1,566 2,913 1,566 2,913 91 294 Total expenditures 3,835.76 3,312.48 1,876.82 1,814.44 5,712.59 5,126.92 9,753.03 16,703.91
(6,955.98) (4,618.54) (5,822.23) (3,670.71) (9,407.36) (5,989.57) (16,077.37) (34,700.96) Subtotal of expenditures (No NF)
3,835.76 3,312.48 602.69 628.94 4,438.45 3,941.42 7,135.73 13,917.48 (6,955.98) (4,618.54) (2,808.22) (3,075.62) (7,901.40) (5,767.07) (14,773.69) (33,260.15)
All-cause hospitalizations
1,352.01 902.18 62.21 124.88 1,414.23 1,027.06 2,668.44 8,449.38 (5,947.92) (3,219.09) (827.96) (1,534.75) (6,024.10) (3,603.79) (9,277.25) (25,040.83)
Potentially avoidable hospitalizations
380.72 260.16 17.05 24.47 397.77 284.63 626.37 1,312.05 (1,346.89) (1,148.79) (270.93) (434.01) (1,377.71) (1,297.66) (2,477.41) (6,034.65)
All-cause ED visits 24.40 28.81 3.90 6.41 28.30 35.22 1.98 0.26 (75.79) (112.94) (20.06) (31.53) (81.65) (123.69) (18.84) (2.94)
Potentially avoidable ED visits
7.97 8.84 0.96 1.94 8.94 10.78 0.00 0.06 (42.70) (57.79) (6.93) (11.56) (44.07) (61.02) (0.00) (0.62)
NF Services 0.00 0.00 1,274.14 1,185.51 1,274.14 1,185.51 2,617.31 2,786.43 (0.00) (0.00) (4,842.54) (1,622.07) (4,842.54) (1,622.07) (2,769.51) (3,137.32)
Prescription drugs 462.60 453.08 31.64 24.49 494.24 477.58 2,015.38 1,964.01
(631.84) (525.22) (287.22) (109.24) (702.77) (534.76) (2,867.38) (3,540.41)
NOTES: PBPM = per beneficiary per month; ED = emergency department; NF = nursing facility; SD = standard deviation; ECCP = Enhanced Care and Coordination Provider. SOURCE: RTI analysis of Medicaid claims data (RTI program: nc03/nhpah294b).
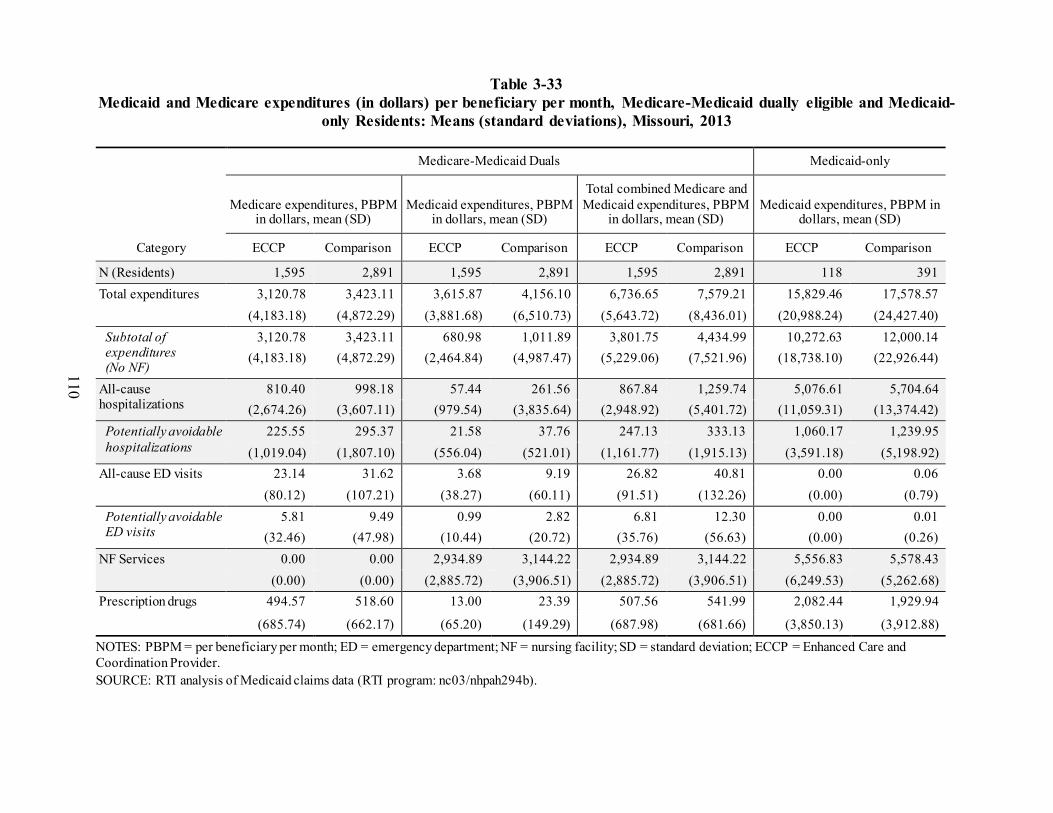
110
Table 3-33 Medicaid and Medicare expenditures (in dollars) per beneficiary per month, Medicare-Medicaid dually eligible and Medicaid-
only Residents: Means (standard deviations), Missouri, 2013
Category
Medicare-Medicaid Duals Medicaid-only
Medicare expenditures, PBPM in dollars, mean (SD)
Medicaid expenditures, PBPM in dollars, mean (SD)
Total combined Medicare and Medicaid expenditures, PBPM
in dollars, mean (SD) Medicaid expenditures, PBPM in
dollars, mean (SD)
ECCP Comparison ECCP Comparison ECCP Comparison ECCP Comparison
N (Residents) 1,595 2,891 1,595 2,891 1,595 2,891 118 391 Total expenditures 3,120.78 3,423.11 3,615.87 4,156.10 6,736.65 7,579.21 15,829.46 17,578.57
(4,183.18) (4,872.29) (3,881.68) (6,510.73) (5,643.72) (8,436.01) (20,988.24) (24,427.40) Subtotal of expenditures (No NF)
3,120.78 3,423.11 680.98 1,011.89 3,801.75 4,434.99 10,272.63 12,000.14 (4,183.18) (4,872.29) (2,464.84) (4,987.47) (5,229.06) (7,521.96) (18,738.10) (22,926.44)
All-cause hospitalizations
810.40 998.18 57.44 261.56 867.84 1,259.74 5,076.61 5,704.64 (2,674.26) (3,607.11) (979.54) (3,835.64) (2,948.92) (5,401.72) (11,059.31) (13,374.42)
Potentially avoidable hospitalizations
225.55 295.37 21.58 37.76 247.13 333.13 1,060.17 1,239.95 (1,019.04) (1,807.10) (556.04) (521.01) (1,161.77) (1,915.13) (3,591.18) (5,198.92)
All-cause ED visits 23.14 31.62 3.68 9.19 26.82 40.81 0.00 0.06 (80.12) (107.21) (38.27) (60.11) (91.51) (132.26) (0.00) (0.79)
Potentially avoidable ED visits
5.81 9.49 0.99 2.82 6.81 12.30 0.00 0.01 (32.46) (47.98) (10.44) (20.72) (35.76) (56.63) (0.00) (0.26)
NF Services 0.00 0.00 2,934.89 3,144.22 2,934.89 3,144.22 5,556.83 5,578.43 (0.00) (0.00) (2,885.72) (3,906.51) (2,885.72) (3,906.51) (6,249.53) (5,262.68)
Prescription drugs 494.57 518.60 13.00 23.39 507.56 541.99 2,082.44 1,929.94
(685.74) (662.17) (65.20) (149.29) (687.98) (681.66) (3,850.13) (3,912.88)
NOTES: PBPM = per beneficiary per month; ED = emergency department; NF = nursing facility; SD = standard deviation; ECCP = Enhanced Care and Coordination Provider. SOURCE: RTI analysis of Medicaid claims data (RTI program: nc03/nhpah294b).

111
Table 3-34 Medicaid and Medicare expenditures (in dollars) per beneficiary per month, Medicare-Medicaid dually eligible and Medicaid-
only residents: Means (standard deviations), Missouri, 201430
Category
Medicare-Medicaid Duals Medicaid-only
Medicare expenditures, PBPM in dollars, mean (SD)
Medicaid expenditures, PBPM in dollars, mean (SD)
Total combined Medicare and Medicaid expenditures, PBPM
in dollars, mean (SD) Medicaid expenditures, PBPM in
dollars, mean (SD) ECCP Comparison ECCP Comparison ECCP Comparison ECCP Comparison
N (Residents) 1,677 2,860 1,677 2,860 1,677 2,860 80 306 Total expenditures 3,280.24 3,384.15 3,015.18 3,294.01 6,295.42 6,678.15 10,726.13 15,098.45
(5,291.66) (4,724.75) (3,640.52) (4,878.56) (6,698.97) (6,800.79) (15,450.59) (25,679.86) Subtotal of expenditures (No NF)
3,280.24 3,384.15 408.27 538.94 3,688.51 3,923.09 4,792.59 8,320.31 (5,291.66) (4,724.75) (1,408.63) (2,687.13) (5,757.76) (5,736.95) (8,651.19) (20,763.02)
All-cause hospitalizations
912.45 936.46 38.85 110.91 951.30 1,047.37 1,746.42 3,915.10 (4,169.98) (3,305.97) (760.08) (1,470.20) (4,242.52) (3,736.08) (4,645.15) (15,211.97)
Potentially avoidable hospitalizations
242.12 264.52 3.49 14.02 245.61 278.55 201.63 585.03 (1,100.31) (1,129.17) (37.81) (233.96) (1,101.78) (1,175.79) (718.62) (3,000.25)
All-cause ED visits 23.47 34.67 3.16 5.19 26.63 39.86 0.00 0.51 (93.51) (122.62) (28.93) (41.63) (99.41) (135.87) (0.00) (5.72)
Potentially avoidable ED visits
7.47 7.65 1.53 1.12 9.01 8.77 0.00 0.06 (45.07) (46.68) (22.26) (9.82) (51.49) (49.47) (0.00) (0.90)
NF Services 0.00 0.00 2,606.91 2,755.07 2,606.91 2,755.07 5,933.54 6,778.14 (0.00) (0.00) (3,122.51) (3,580.24) (3,122.51) (3,580.24) (7,685.83) (7,782.77)
Prescription drugs 530.27 542.02 10.25 9.53 540.53 551.55 1,442.20 2,232.00
(731.19) (783.14) (88.29) (64.22) (739.37) (789.16) (2,034.44) (3,930.00)
NOTES: PBPM = per beneficiary per month; ED = emergency department; NF = nursing facility; SD = standard deviation; ECCP = Enhanced Care and Coordination Provider. SOURCE: RTI analysis of Medicaid claims data (RTI program: nc03/nhpah294b).
30 Please note that Missouri indicated that significant corrections to the 2014 Medicaid dataset provided to RTI were made following the completion of analyses
for this project.

112
Table 3-35 Medicaid and Medicare expenditures (in dollars) per beneficiary per month, Medicare-Medicaid dually eligible and Medicaid-
only residents: Means (standard deviations), Missouri, 2015
Category
Medicare-Medicaid Duals Medicaid-Only
Medicare expenditures, PBPM in dollars, mean (SD)
Medicaid expenditures, PBPM in dollars, mean (SD)
Total combined Medicare and Medicaid expenditures,
PBPM in dollars, mean (SD) Medicaid expenditures, PBPM in
dollars, mean (SD)
ECCP Comparison ECCP Comparison ECCP Comparison ECCP Comparison
N (Residents) 1,689 2,815 1,689 2,815 1,689 2,815 125 445
Total expenditures 3,051.62 3,644.37 4,031.87 4,336.55 7,083.48 7,980.91 16,647.17 23,375.09 (4,267.80) (5,550.16) (5,429.63) (7,759.64) (7,048.18) (10,030.87) (25,514.06) (39,810.35)
Subtotal of expenditures (No NF)
3,051.62 3,644.37 757.22 1,129.39 3,808.84 4,773.76 12,022.05 16,918.94 (4,267.80) (5,550.16) (3,246.32) (6,302.38) (5,742.85) (9,027.30) (24,772.92) (35,820.45)
All-cause hospitalizations
737.19 1,059.74 44.26 252.51 781.44 1,312.25 6,379.68 9,274.41 (2,907.13) (4,319.63) (454.20) (3,390.18) (2,975.40) (5,818.50) (17,977.50) (25,257.64)
Potentially avoidable hospitalizations
217.03 273.75 14.96 47.56 231.99 321.30 894.15 1,692.85 (1,097.46) (1,190.23) (276.56) (929.76) (1,129.65) (1,501.76) (3,096.79) (6,388.74)
All-cause ED visits 17.81 39.03 4.22 11.32 22.04 50.35 0.00 0.51 (69.83) (142.47) (28.54) (88.58) (81.22) (178.71) (0.00) (7.55)
Potentially avoidable ED visits
4.82 11.35 1.11 3.17 5.93 14.52 0.00 0.13 (29.03) (88.01) (9.79) (25.79) (31.90) (95.45) (0.00) (2.63)
NF Services 0.00 0.00 3,274.64 3,207.15 3,274.64 3,207.15 4,625.12 6,456.16 (0.00) (0.00) (4,194.54) (3,720.94) (4,194.54) (3,720.94) (2,727.59) (7,563.67)
Prescription drugs 576.26 546.03 23.38 23.69 599.64 569.72 2,093.27 2,693.86
(807.55) (850.51) (158.13) (338.03) (823.43) (915.19) (4,504.27) (5,035.33)
NOTES: PBPM = per beneficiary per month; ED = emergency department; NF = nursing facility; SD = standard deviation; ECCP = Enhanced Care and Coordination Provider. SOURCE: RTI analysis of Medicaid claims data (RTI program: nc03/nhpah294b).

113
Table 3-36 ECCP effect on MDS-based quality measures (percent of observed quarters per resident
per year with event) during intervention period, 2014–2016, Missouri
MDS-based quality measures
Mean, 2014-2016
(percent)
Effect (percenta
ge points) 90% CI 80% CI p-value
Relative effect (% of mean)
Decline in ADLs 13.9 –1.5 –5.1 2.1 –4.3 1.3 0.490 –10.8 Antipsychotic medication use 17.1 –1.7 –4.7 1.3 –4.0 0.6 0.337 –9.9
NOTE: The 2014–2016 mean is the unadjusted mean across all ECCP and comparison residents during the 3-year intervention period, weighted by the number of residents in each year. Bold text indicates statistical significance at the 0.10 level. Standard statistical practice is to use confidence intervals of 90% or higher; 80% confidence intervals are provided here for comparison purposes only. ADL = Activities of Daily Living; ECCP = Enhanced Care and Coordination Provider; MDS = Minimum Data Set. SOURCE: RTI analysis of MDS assessments data (RTI program jw20; annual_2016\qm).
Table 3-37 ECCP effect on MDS-based quality measures (percent of observed quarters per resident
with event), 2016, Missouri
MDS-based quality measures
Mean, 2016
(percent)
Effect (percentage
points) 90% CI 80% CI p-value
Relative effect (% of mean)
One or more falls with injury 16.5 –0.6 –5.2 4.0 –4.2 3.0 0.814 –3.6 Self-report moderate to severe pain 7.3 3.6 –1.7 8.9 –0.5 7.7 0.272 49.5 Pressure ulcers Stage II or higher 6.1 –0.1 –1.6 1.4 –1.3 1.1 0.900 –1.6 Urinary tract infection 4.4 –1.3 –3.8 1.2 –3.2 0.6 0.398 –29.5 Catheter inserted and left in bladder 3.2 0.2 –1.3 1.7 –1.0 1.4 0.854 6.2 Decline in ADLs 13.2 –2.9 –7.0 1.2 –6.1 0.3 0.241 –22.0 Antipsychotic medication use 16.2 0.6 –4.2 5.4 –3.1 4.3 0.827 3.7 Depressive symptoms 2.4 1.4 –1.6 4.4 –0.9 3.7 0.431 58.0
NOTE: The 2016 mean is the unadjusted mean across all ECCP and comparison residents in that year. Bold text indicates statistical significance at the 0.10 level. Standard statistical practice is to use confidence intervals of 90% or higher; 80% confidence intervals are provided here for comparison purposes only. ADL = Activities of Daily Living; ECCP = Enhanced Care and Coordination Provider; MDS = Minimum Data Set. SOURCE: RTI analysis of MDS assessments data (RTI program jw20; annual_2016\qm).
3.3.3 Implementation
Implementation Experience Overall, MOQI accomplished most of the original Initiative goals set forth in their
operations manual, though the ECCP experienced some early delays and challenges to implementation. Some MOQI nursing facility “go live” dates were delayed from February 2013
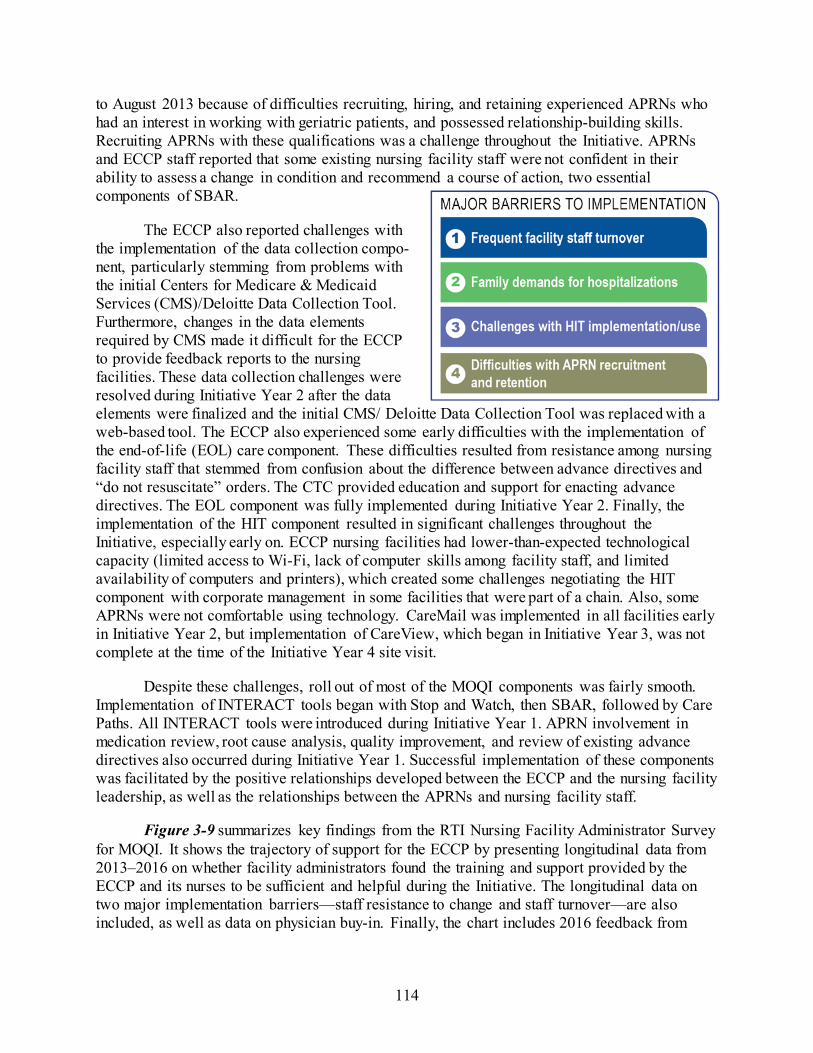
114
to August 2013 because of difficulties recruiting, hiring, and retaining experienced APRNs who had an interest in working with geriatric patients, and possessed relationship-building skills. Recruiting APRNs with these qualifications was a challenge throughout the Initiative. APRNs and ECCP staff reported that some existing nursing facility staff were not confident in their ability to assess a change in condition and recommend a course of action, two essential components of SBAR.
The ECCP also reported challenges with the implementation of the data collection compo-nent, particularly stemming from problems with the initial Centers for Medicare & Medicaid Services (CMS)/Deloitte Data Collection Tool. Furthermore, changes in the data elements required by CMS made it difficult for the ECCP to provide feedback reports to the nursing facilities. These data collection challenges were resolved during Initiative Year 2 after the data elements were finalized and the initial CMS/ Deloitte Data Collection Tool was replaced with a web-based tool. The ECCP also experienced some early difficulties with the implementation of the end-of-life (EOL) care component. These difficulties resulted from resistance among nursing facility staff that stemmed from confusion about the difference between advance directives and “do not resuscitate” orders. The CTC provided education and support for enacting advance directives. The EOL component was fully implemented during Initiative Year 2. Finally, the implementation of the HIT component resulted in significant challenges throughout the Initiative, especially early on. ECCP nursing facilities had lower-than-expected technological capacity (limited access to Wi-Fi, lack of computer skills among facility staff, and limited availability of computers and printers), which created some challenges negotiating the HIT component with corporate management in some facilities that were part of a chain. Also, some APRNs were not comfortable using technology. CareMail was implemented in all facilities early in Initiative Year 2, but implementation of CareView, which began in Initiative Year 3, was not complete at the time of the Initiative Year 4 site visit.
Despite these challenges, roll out of most of the MOQI components was fairly smooth. Implementation of INTERACT tools began with Stop and Watch, then SBAR, followed by Care Paths. All INTERACT tools were introduced during Initiative Year 1. APRN involvement in medication review, root cause analysis, quality improvement, and review of existing advance directives also occurred during Initiative Year 1. Successful implementation of these components was facilitated by the positive relationships developed between the ECCP and the nursing facility leadership, as well as the relationships between the APRNs and nursing facility staff.
Figure 3-9 summarizes key findings from the RTI Nursing Facility Administrator Survey for MOQI. It shows the trajectory of support for the ECCP by presenting longitudinal data from 2013–2016 on whether facility administrators found the training and support provided by the ECCP and its nurses to be sufficient and helpful during the Initiative. The longitudinal data on two major implementation barriers—staff resistance to change and staff turnover—are also included, as well as data on physician buy-in. Finally, the chart includes 2016 feedback from

115
facility leadership on the effectiveness of the Initiative in reducing avoidable hospitalizations and the likelihood of sustainability of the main model components.
Figure 3-9 RTI Nursing Facility Survey results, 2013–2016
NOTE: Number of respondents varied by survey wave and question. ECCP = Enhanced Care and Coordination Provider; INTERACT = Interventions to Reduce Acute Care Transfers; APRN = advanced practice registered nurse; RN = registered nurse; SBAR = Situation, Background, Assessment, Recommendation; MOQI = University of Missouri, Sinclair School of Nursing Missouri Quality Initiative for Nursing Homes. SOURCE: RTI analysis of waves 1 through 4 of the RTI Nursing Facility Administrator Survey (data collected August 2013 to December of 2016).

116
Facility Staff Engagement with Initiative Components Most of the MOQI nursing facilities were highly engaged with most model components.
Levels of engagement were high across facilities for medication review (100 percent of facilities highly engaged), education and training (92 percent of facilities highly engaged), care transitions and communication during transfers (91 percent of facilities highly engaged), communicating with providers (SBAR) (85 percent of facilities highly engaged), end-of-life (85 percent of facilities highly engaged), and QI/Quality Assurance and Performance Improvement (QAPI)/RCA (82 percent of facilities highly engaged) (Table 3-38). Interview data suggest that high levels of engagement for these components occurred because facility nursing staff valued these elements as essential for reducing hospital readmissions and improving resident clinical care outcomes. Facility nursing staff also viewed these components as contributing to their enhanced critical thinking and decision-making skills. APRNs who had strong relationships with facility staff were also viewed as contributing to avoidable hospitalizations and facility staff development. However, there were a few facilities in which the APRN-staff relationships were not as strong, which may explain the slightly lower levels of engagement (77 percent of facilities highly engaged) for the APRN component. It should be noted that it was not possible to determine the level of engagement for a few factors in a small number of facilities.
Engagement was somewhat lower for documenting change of condition (Stop and Watch) (62% of facilities highly engaged), and especially HIT (15% of facilities highly engaged) (Table 3-38). The lower level of engagement for the Stop and Watch tool was mainly a result of CNAs preferring to verbally report changes in condition to nurses rather than filling out the Stop and Watch form. The limited technological capacity of nursing facilities, limited comfort using technology among nursing facility staff, and the existence of other forms of secure communication likely explain the low levels of engagement with the HIT component. Facility staff generally reported that they saw value in HIT, but their engagement with MOQI’s HIT components was much more limited.
Staff Buy-in ECCP leadership and facility interviewees said buy-in from nursing facility leadership,
especially DONs, was essential to the success of the Initiative. Nursing facility leadership staff in most facilities were supportive of most MOQI components by the end of Initiative Year 1. They generally viewed the APRN as an asset to the facility and spoke to the importance of preventing avoidable hospitalizations by providing higher quality care. However, there were a few reports of nursing facility leadership staff undermining or not fully supporting the efforts of the APRN in their facility. Reports of this subsided by the end of Initiative Year 2, but nursing facility leadership staff in a small number of facilities continued to have some misgivings about the ECCP’s “singular” focus on preventing avoidable hospitalizations.
Though there were challenges obtaining buy-in from physicians throughout the Initiative, most physicians backed the Initiative by Initiative Year 4. Reasons for lack of physician buy-in included (1) physicians being “stuck in their ways,” hospitalizing patients when a change in condition occurred; (2) physicians not listening to APRNs’ recommendations; and (3) physicians not trusting nursing facility staff to care for their patients. To obtain buy-in from physicians, the ECCP medical director periodically sent out communiques advising facility physicians on best clinical practices. The ECCP medical director also personally called resistant physicians to

117
discuss strategies for reducing avoidable hospitalizations and sent physicians reports with their hospitalization rates compared to their physician colleagues. Nursing facility staff and APRNs reported that they were working hard to build relationships with physicians who were not supportive of MOQI.
Table 3-38 Facility engagement with Initiative components, MOQI, 2016
NOTE: 13 facilities evaluated SOURCE: RTI evaluation of facility engagement using site visit and telephone interview data (data collected 2016).
Buy-in among facility nursing staff generally improved throughout the Initiative. In Initiative Years 1 and 2, there was a fair amount of resistance to using the SBAR tool and not hospitalizing residents after a change in condition. Some nurses viewed the SBAR as duplicative of their nursing notes or as unnecessary. In Initiative Years 1 and 2, a small number of nurses also expressed concerns that not hospitalizing a resident after a change in condition placed them at risk for losing their nursing license. By Initiative Year 4, however, facility nursing staff overwhelmingly reported valuing the SBAR and no longer mentioned fears about losing their license, though SBAR use remained somewhat variable across facilities.
CNA involvement in MOQI was mainly limited to filling out Stop and Watch forms, and their buy-in to this component remained variable throughout the Initiative. Reasons for inconsistent use among CNAs included (1) frequent turnover, (2) preference to verbally report changes in conditions, (3) lack of positive feedback from nursing staff after turning in a Stop and Watch, (4) literacy problems, and (5) a lack of understanding of the goals of the Initiative among
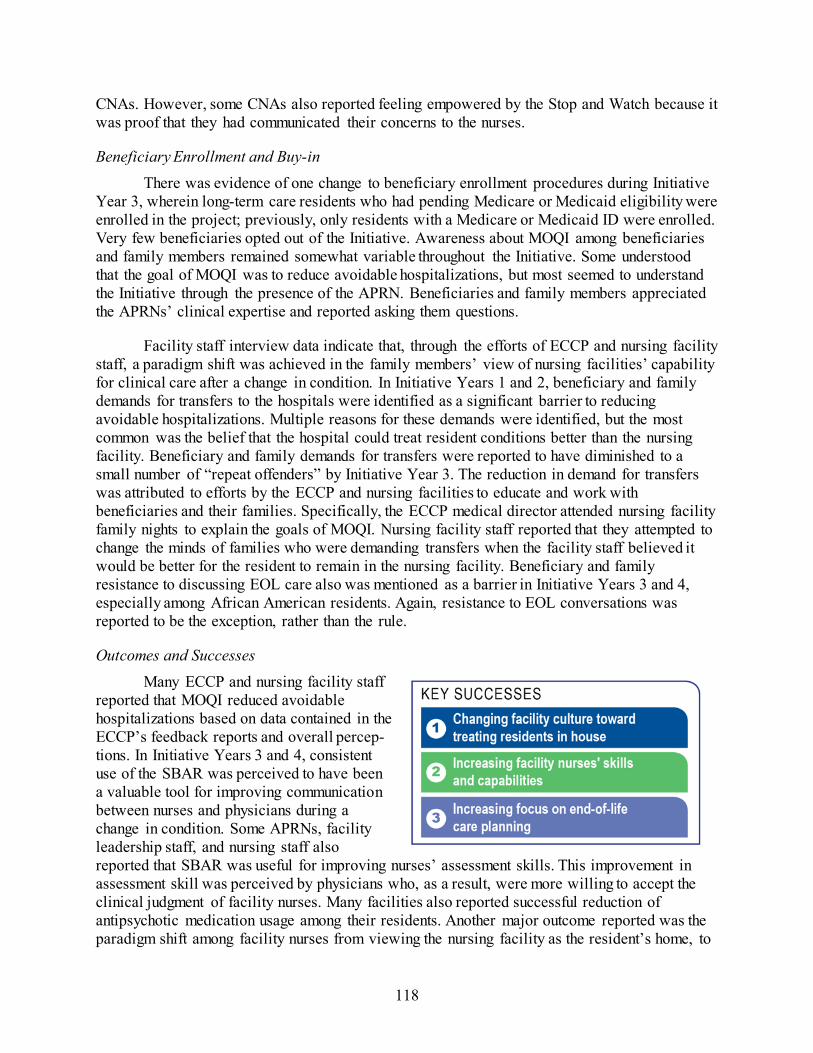
118
CNAs. However, some CNAs also reported feeling empowered by the Stop and Watch because it was proof that they had communicated their concerns to the nurses.
Beneficiary Enrollment and Buy-in There was evidence of one change to beneficiary enrollment procedures during Initiative
Year 3, wherein long-term care residents who had pending Medicare or Medicaid eligibility were enrolled in the project; previously, only residents with a Medicare or Medicaid ID were enrolled. Very few beneficiaries opted out of the Initiative. Awareness about MOQI among beneficiaries and family members remained somewhat variable throughout the Initiative. Some understood that the goal of MOQI was to reduce avoidable hospitalizations, but most seemed to understand the Initiative through the presence of the APRN. Beneficiaries and family members appreciated the APRNs’ clinical expertise and reported asking them questions.
Facility staff interview data indicate that, through the efforts of ECCP and nursing facility staff, a paradigm shift was achieved in the family members’ view of nursing facilities’ capability for clinical care after a change in condition. In Initiative Years 1 and 2, beneficiary and family demands for transfers to the hospitals were identified as a significant barrier to reducing avoidable hospitalizations. Multiple reasons for these demands were identified, but the most common was the belief that the hospital could treat resident conditions better than the nursing facility. Beneficiary and family demands for transfers were reported to have diminished to a small number of “repeat offenders” by Initiative Year 3. The reduction in demand for transfers was attributed to efforts by the ECCP and nursing facilities to educate and work with beneficiaries and their families. Specifically, the ECCP medical director attended nursing facility family nights to explain the goals of MOQI. Nursing facility staff reported that they attempted to change the minds of families who were demanding transfers when the facility staff believed it would be better for the resident to remain in the nursing facility. Beneficiary and family resistance to discussing EOL care also was mentioned as a barrier in Initiative Years 3 and 4, especially among African American residents. Again, resistance to EOL conversations was reported to be the exception, rather than the rule.
Outcomes and Successes Many ECCP and nursing facility staff
reported that MOQI reduced avoidable hospitalizations based on data contained in the ECCP’s feedback reports and overall percep-tions. In Initiative Years 3 and 4, consistent use of the SBAR was perceived to have been a valuable tool for improving communication between nurses and physicians during a change in condition. Some APRNs, facility leadership staff, and nursing staff also reported that SBAR was useful for improving nurses’ assessment skills. This improvement in assessment skill was perceived by physicians who, as a result, were more willing to accept the clinical judgment of facility nurses. Many facilities also reported successful reduction of antipsychotic medication usage among their residents. Another major outcome reported was the paradigm shift among facility nurses from viewing the nursing facility as the resident’s home, to

119
viewing the nursing facility as the best place for a resident to receive care. This paradigm shift also occurred among family members. All MOQI facilities remained in the Initiative for its duration and are continuing on to the Payment Reform Initiative.
Best Practices, Sustainability, and Lessons Learned Several best practices and lessons
learned emerged over the course of the Initiative. Many ECCP staff and APRNs emphasized the importance of the APRNs’ ability to build relationships with facility staff and lead facility culture change from trans-ferring the resident to the hospital following a change in condition to treating in the facility. They believed that APRNs could not consis-tently reduce avoidable hospitalizations simply by assessing, diagnosing, and treating. Rather, the APRNs needed to obtain buy-in from facility staff, work to enhance the clinical capabilities, and change the mindset that the hospital was the best place for residents to receive care. ECCP staff also considered the monthly feedback reports that were distributed to MOQI facilities to be essential to the success of the Initiative because they inspired competition between the participating nursing facilities to reduce avoidable hospitalizations.
ECCP and facility staff became more optimistic about the prospects for sustainability as the Initiative progressed. By the end of Initiative Year 4, staff in most facilities reported that they wanted, and believed they would be able to sustain most of MOQI’s components. However, turnover of nursing facility staff, especially DONs or NFAs, posed a significant threat to sustainability. There were also questions about whether the facilities would be able to afford an APRN and whether the APRNs would be as successful without the support of the ECCP. Without an APRN to collect data, provide education, and support other MOQI components, it may be challenging for nursing facilities to continue many aspects of the Initiative. Finally, the cost of CareMail and CareView, coupled with existence of alternative methods for secure electronic communication (e.g., EpicCare Link, Mediprocity, and other HIPPA-compliant e-mail services), make sustainability of these components uncertain.
3.3.4 Summary
The MOQI model utilized APRNs to provide and support clinical care, education and training, medication management, EOL care planning, and QI activities. Each MOQI nursing facility was assigned a full-time APRN, and APRNs were supported by the MOQI Leadership Team. Although implementation of, and engagement with, the Initiative varied across the facilities, qualitative data suggested that both implementation and engagement consistently improved over the course of the Initiative. Results from the quantitative analyses reflected the positive impact of the Initiative. Significant decreases were found across all expenditure and utilization measures, with the decreases peaking in 2015. Qualitative data provided context to these findings. By 2014, most MOQI facility staff reported strong support for the Initiative goals, close relationships with the APRNs in their facility, and a culture change among staff nurses regarding the impact they and the ECCP APRN had in responding to and treating changes in a

120
resident’s condition. The fact that MOQI APRN turnover was lowest in 2015 may partially explain the peak in expenditure and utilization reductions in that year.
The support mechanisms engrained in the MOQI model also explain its consistent success on reducing utilization and expenditures. In the MOQI model, ECCP leadership staff and coaches worked together to provide support for many of the Initiative components that APRNs were responsible for implementing. The APRNs met with the Project Supervisor and Project Coordinator monthly across most Initiative years to work through challenges. The Project Supervisor and Project Coordinator used data collected by the APRNs to tailor the advice that they offered the APRNs. APRNs routinely contacted Clinical Practice Experts to discuss root-cause analysis and strategies to navigate difficult clinical situations. The INTERACT Coach, CTC, and HIC periodically visited nursing facilities to support APRNs in implementing the Initiative’s INTERACT tools, QI, EOL care, and HIT components. The ECCP also held regular meetings with leadership staff from all facilities to educate, maintain buy-in, and share strategies. Qualitative data suggest that ECCP leadership staff and coaches also maintained a consistent presence in and good rapport with the MOQI nursing facilities. Overall, the ECCP provided the APRNs with the support and the expertise to successfully implement the components of the Initiative.
Despite MOQI APRNs’ efforts to educate on a variety of clinical topics and reduce antipsychotic medication use, the effects on MDS-based quality measures were not statistically significant. Qualitative findings indicated that MOQI staff felt they were able to improve quality of care by reducing the use of antipsychotic medications in MOQI nursing facilities. However, within the context of difference-in-differences models, reductions may have occurred within MOQI facilities without being attributable to the Initiative, particularly if comparison group facilities also were focusing QI efforts on the same quality measures. It is likely that facilities in the comparison group also were attempting to reduce antipsychotic medication use as part of CMS’ nation-wide effort. Moreover, many MOQI nursing facilities undertook QI initiatives outside of those championed by MOQI APRNs and leadership.

121
3.4 Nebraska
3.4.1 Nebraska Alegent
Nebraska Catholic Health Initiatives/Alegent Creighton Health31 (Alegent), a not-for-profit health care system, administered the Nebraska ECCP model. The goals of the ECCP were to reduce the frequency of avoidable hospital admissions and readmissions, improve resident health outcomes, improve the process of transitioning between inpatient hospitals and nursing facilities, reduce health care spending, and improve medication management.32 A team of six APRNs were assigned to several nursing facilities each, where they provided clinical services to residents and facilitated training among facility staff. Services that they provided include life issue reviews, medication review using the Long Term Care Medication Outcomes Manager (LTC-MOM) tool, history and physical assessment (H&P), and training in using INTERACT tools. In addition to the APRNs, dental hygienists employed by the ECCP also provided dental care and education in participating facilities (Table 3-39). There was consistent but statistically insignificant evidence that the Alegent intervention was associated with reductions in hospitalization, and weak evidence for related expenditure and total expenditures. There seemed to be a tendency toward more ED visits and expenditures among participating facilities.
Table 3-39 Alegent (Nebraska) model description
Structure Organization type Not-for-profit health care system Partners and their roles • No formal partners; All services provided by ECCP staff.
• Limited in-kind support by CHI Alegent Center for Nursing (office space and partial FTE of Project Director position; Limited technical support by CHI staff)
Number of facilities 15 participating facilities (no facilities in rural areas) NF attrition 1 NF dropped out in Oct. 2014: Montclair Nursing and Rehabilitation Center Facility-based staff 6 APRNs, 2 dental hygienists State APRN practice arrangements affecting implementation
During Initiative Year 1, APRNs required an Integrated Practice Agreement with a physician to practice, satisfied by an Alegent physician uninvolved with the ECCP. In 2014, legislation removed this requirement.
(continued)
31 Catholic Health Initiatives purchased Alegent Creighton prior to the start of this Initiative. In late 2014, Alegent
Creighton formally changed its name to CHI Health. For continuity with prior reports, this Initiative will continue to be referred to as the “Alegent” ECCP in this document.
32 Alegent Health Operations Manual: Nursing Facility Initiative to Reduce Avoidable Hospitalizations (ECCP: Enhanced Care & Coordination Program), revised November 22, 2013.

122
Table 3-39 (continued) Alegent (Nebraska) model description
Use of registered or higher-level nurses
APRN Yes; APRNs responsible for resident evaluations, medication management, advance directive planning, and education of facility staff.
RN No
Role of nurse Clinical care Yes Writing orders Yes; APRNs write orders with the permission of residents’ primary care
physicians or offer order recommendations to residents’ physicians. Education Yes; ECCP APRNs and dental hygienists provided in-service trainings, but most
education focused on individual, ad hoc coaching of facility staff Weekly schedule APRNs spend 1–2 days per week in each of their assigned facilities. APRNs are
also available via 24-hour care line or personal lines outside of business hours. Medication management
Polypharmacy reduction Yes Antipsychotics reduction Yes Medication review Yes; The ECCP utilizes the Long Term Care Medication Outcomes Manager
(LTC-MOM) developed by the ECCP Director. Tools promoted by ECCPs to improve communication and identification of changes in resident condition
(INTERACT and others) SBAR Yes; Varying degrees of use in facilities; May be integrated with EMR or paper-
based. Stop and Watch Yes; Varying degrees of use in facilities; May be integrated with EMR or paper-
based. Transfer forms Yes; Limited use of INTERACT transfer tool in facilities. QI tool No; ECCP APRNs attend some facility QI meetings and may provide data or
feedback, but no formal tool is used. Care Paths Yes; Limited use within facilities.
End-of-life planning Advance directives Yes; The ECCP utilizes the Life Issues Review tool to guide advance directive
planning. Staff training/ discussion No
Optional features specific to Alegent Dental hygiene The ECCP employs two dental hygienists who provide dental cleanings
biannually as a supplement to their regular dental care. The hygienists serve those with teeth and dentures and provide oral health training to NF staff via in-service sessions. They began collecting data on residents’ oral health in PY4.
Note: APRN = advanced practice registered nurse; CHI = Catholic Health Initiatives; ECCP = Enhanced Care and Coordination Provider; EMR = electronic medical record; FTE = full-time equivalent; INTERACT = Interventions to Reduce Acute Care Transfers; NF = nursing facility; ; SBAR = Situation, Background, Assessment, Recommendation; QI = quality improvement.

123
3.4.2 Utilization, Expenditure, and Quality
Utilization. The ECCP intervention had a consistent but statistically insignificant tendency to reduce all-cause hospitalizations and potentially avoidable hospitalizations, measured by either probability (Table 3-40) or count (Table 3-42), based on the intervention period (2014–2016) annual effect estimates. The year-specific effect of the ECCP intervention on reducing the probability of hospitalizations and potentially avoidable hospitalizations was in the desirable direction (a reduction) every year (2014, 2015, and 2016), but the effect size varied over time (Figure 3-10). The evidence for reduction in potentially avoidable hospitalizations became statistically significant in 2016. The ECCP intervention reduced residents’ probability of having a potentially avoidable hospitalization by 2.9 percentage points in 2016; this represents a 24.5-percent reduction in the probability of being hospitalized for a potentially avoidable reason, which was 11.6 percent across both the ECCP and comparison groups in 2016 (Table 3-41). Additionally, the ECCP intervention was associated with 0.04 fewer potentially avoidable hospitalizations per resident in 2016 (Table 3-43).
On the other hand, there seemed to be a tendency toward more ED visits, both probability and count of all-cause and potentially avoidable ED visits, in the ECCP group over the intervention period 2014–2016. The intervention period (2014–2016) annual effects for these measures were an increase but not statistically significant.
Medicare Expenditures. There was overall weak evidence for reductions in total Medicare expenditures and expenditures for all-cause and potentially avoidable hospitalizations based on the intervention period (2014–2016) annual effect estimates (Table 3-44). These estimates showed a statistically significant reduction in expenditures for all-cause hospitalizations only; the evidence for reductions in total Medicare expenditures and expenditures for potentially avoidable hospitalizations were borderline statistically significant. Nevertheless, year-specific effects in 2016 showed statistically significant reductions in all these expenditures per resident: the ECCP intervention was associated with $2,177 lower total Medicare expenditures, $934 lower expenditures for all-cause hospitalizations and $357 lower expenditures on potentially avoidable hospitalizations (Table 3-45).
There was weak evidence suggesting the ECCP intervention may be associated with increased expenditures for ED visits, both all-cause and potentially avoidable. Specifically, the intervention period (2014–2016) annual effect was statistically significant for increasing expenditures for all-cause ED visits and borderline statistically significant for increasing expenditures for potentially avoidable ED visits. The year-specific estimates of the intervention effects on expenditures for ED visits were in the undesirable direction in all three years
KEY FINDINGS
In Nebraska, the ECCP intervention had a consistent but statistically insignificant tendency to reduce all-cause hospitalizations and potentially avoidable hospitalizations.
On the other hand, there seemed to be a tendency toward more ED visits, both all-cause and potentially avoidable, in the ECCP group.
Weak evidence of reductions in total Medicare expenditures and in expenditures for all-cause and potentially avoidable hospitalizations
Evidence for an increase in expenditures for all-cause and potentially avoidable ED visits
No evidence for an effect of the ECCP intervention on MDS-based quality measures, despite a tendency toward lower antipsychotic medication use and decline in activities of daily living.

124
(Figure 3-11), consistent with the observed tendency toward increased ED visits in the ECCP group.
Overall, the effect of the ECCP intervention on hospitalizations goes in a direction opposite to the effect on ED visits. This holds true for both utilization and expenditures. The findings suggest that some ED visits may be substituting for hospital inpatient stays. Despite the potential substitution, there was overall weak evidence for reductions in total Medicare expenditures.
Medicaid Expenditures. The section presents descriptive analyses of Medicaid and Medicare expenditures on select services for Initiative-eligible residents with Medicaid coverage in Nebraska during all study years for which usable Medicaid data could be obtained, including 2011 (Table 3-46), 2012 (Table 3-47), 2013 (Table 3-48), 2014 (Table 3-49), and 2015 (Table 3-50). Please note that, unlike the Medicare multivariate regression analyses described above, the Medicaid expenditure results presented in this section are descriptive. Descriptive statistics cannot be taken as results of an intervention. The observed trends must be understood within the context of possible changes in ECCP resident characteristics as well as each state’s comparison group.
The results across years share similar patterns. Overall, Tables 3-46 through 3-50 illustrate that the expenditures for NF residency represented the highest expenditures every year compared to other service types. In general, NF expenditures accounted for a slightly larger percentage of the total expenditures in the Medicaid-only group than in the Medicare-Medicaid duals group in the ECCP group. Total expenditures were higher for the Medicaid-only group. Among Medicare-Medicaid duals, average total combined Medicare and Medicaid expenditures PBPM for each service type (excluding Medicaid NF costs) were primarily driven by Medicare expenditures with Medicaid paying only a small portion of the service. There is no clear trend of reduction in expenditures in the ECCP group relative to the comparison group, except for a vague declining trend for total expenditures for the Medicaid-only group and expenditures associated with potentially avoidable ED visits for the Medicare-Medicaid duals group.
Note that the 2011 data show some anomalies that we were unable to resolve. However, they did not seem to have a big impact on the results at the PBPM level. In addition, some claims which were assigned to the SNF category may have truly been NF claims, but were conservatively categorized as SNF due to limitations in the data; thus, the expenditures associated with NF services may be underestimated.
MDS-Based Quality. There was no consistent evidence for an effect of the ECCP intervention on MDS-based quality measures. There seemed to be a tendency toward lower antipsychotic medication use, as well as a statistically significant signal suggesting worsening in the measure of decline in activities of daily living among those in the ECCP group, based on both the intervention period annual effect estimates and the 2016 year-specific effects (Table 3-51, Table 3-52).

125
Table 3-40 ECCP effect on probability of any utilization per resident per year during intervention
period, 2014–2016, Nebraska
Probability of having at least one:
Mean, 2014-2016
(percent)
Effect (percentage
points) 90% CI 80% CI p-value
Relative effect (% of mean)
All-cause hospitalization 26.7 –2.3 –4.9 0.3 –4.3 –0.3 0.144 –8.6 Potentially avoidable hospitalization 12.0 –1.8 –4.1 0.4 –3.6 –0.1 0.188 –15.4 All-cause ED visit 24.0 1.3 –2.3 4.8 –1.5 4.0 0.559 5.3 Potentially avoidable ED visit 8.5 0.7 –1.5 2.9 –1.0 2.4 0.585 8.6
NOTE: The 2014–2016 mean is the unadjusted mean across all ECCP and comparison residents during the 3-year intervention period, weighted by the number of residents in each year. Bold text indicates statistical significance at the 0.10 level. Standard statistical practice is to use confidence intervals of 90% or higher; 80% confidence intervals are provided here for comparison purposes only. ECCP = Enhanced Care and Coordination Provider; ED = Emergency Department. SOURCE: RTI analysis of Medicare claims data (RTI program ms06; annual_2016\ms01_xtgee).
Table 3-41 ECCP effect on probability of any utilization per resident per year, 2016, Nebraska
Probability of having at least one:
Mean, 2016
(percent)
Effect (percentage
points) 90% CI 80% CI p-value
Relative effect (% of mean)
All-cause hospitalization 26.8 –3.2 –6.8 0.4 –6.0 –0.4 0.150 –11.8 Potentially avoidable hospitalization 11.6 –2.9 –5.6 –0.1 –5.0 –0.7 0.087 –24.5 All-cause ED visit 23.8 1.6 –1.7 5.0 –1.0 4.3 0.423 6.9 Potentially avoidable ED visit 8.5 –0.1 –2.5 2.3 –2.0 1.8 0.949 –1.1
NOTE: The 2016 mean is the unadjusted mean across all ECCP and comparison residents in that year. Bold text indicates statistical significance at the 0.10 level. Standard statistical practice is to use confidence intervals of 90% or higher; 80% confidence intervals are provided here for comparison purposes only. ECCP = Enhanced Care and Coordination Provider; ED = Emergency Department. SOURCE: RTI analysis of Medicare claims data (RTI program ms06; annual_2016\ms01_xtgee).

126
Figure 3-10 ECCP effect on probability of any utilization per resident per year, Nebraska
NOTE: Dots indicate year-specific effects separately estimated for 2014, 2015, and 2016; triangles indicate intervention period (2014–2016) annual effects; vertical bars are 90% confidence intervals. Detailed numbers underlying the graphs are provided in Appendix H. ECCP = Enhanced Care and Coordination Provider; ED = Emergency Department. SOURCE: RTI analysis of Medicare claims data (RTI program ms06; annual_2016\ms01_xtgee).

127
Table 3-42 ECCP effect on count of utilization per resident per year during intervention period, 2014–
2016, Nebraska
Count of events per resident
Mean, 2014-2016 Effect 90% CI 80% CI p-value
Relative effect (% of mean)
All-cause hospitalizations 0.391 –0.036 –0.084 0.012 –0.073 0.001 0.217 –9.2 Potentially avoidable hospitalizations 0.141 –0.023 –0.053 0.008 –0.047 0.001 0.222 –16.1 All-cause ED visits 0.351 0.023 –0.040 0.085 –0.026 0.071 0.551 6.4 Potentially avoidable ED visits 0.099 0.008 –0.015 0.031 –0.010 0.026 0.562 8.1
NOTE: The 2014–2016 mean is the unadjusted mean across all ECCP and comparison residents during the 3-year intervention period, weighted by the number of residents in each year. Bold text indicates statistical significance at the 0.10 level. Standard statistical practice is to use confidence intervals of 90% or higher; 80% confidence intervals are provided here for comparison purposes only. ECCP = Enhanced Care and Coordination Provider; ED = Emergency Department. SOURCE: RTI analysis of Medicare claims data (RTI program ms07; annual_2016\ms03_xtgee).
Table 3-43 ECCP effect on count of utilization per resident per year, 2016, Nebraska
Count of events per resident Mean, 2016 Effect 90% CI 80% CI p-value
Relative Effect (% of mean)
All-cause hospitalizations 0.410 –0.060 –0.122 0.002 –0.108 –0.011 0.114 –14.6 Potentially avoidable hospitalizations 0.140 –0.040 –0.072 –0.008 –0.065 –0.015 0.041 –28.3 All-cause ED visits 0.344 0.020 –0.056 0.096 –0.039 0.079 0.666 5.8 Potentially avoidable ED visits 0.099 –0.005 –0.029 0.020 –0.024 0.014 0.749 –4.9
NOTE: The 2016 mean is the unadjusted mean across all ECCP and comparison residents in that year. Bold text indicates statistical significance at the 0.10 level. Standard statistical practice is to use confidence intervals of 90% or higher; 80% confidence intervals are provided here for comparison purposes only. ECCP = Enhanced Care and Coordination Provider; ED = Emergency Department. SOURCE: RTI analysis of Medicare claims data (RTI program ms07; annual_2016\ms03_xtgee).

128
Table 3-44 ECCP effect on Medicare expenditures per resident per year during intervention period,
2014–2016, Nebraska
Medicare expenditure
Mean, 2014-2016 ($) Effect ($) 90% CI 80% CI p-value
Relative effect (% of mean)
Total 20,172 –1,554 –3,495 387 –3,066 –41 0.188 –7.7 All-cause hospitalizations 3,996 –802 –1,341 –263 –1,222 –382 0.014 –20.1 Potentially avoidable hospitalizations 1,213 –252 –530 25 –469 –36 0.134 –20.8 All-cause ED visits 213 69 10 128 23 115 0.054 32.4 Potentially avoidable ED visits 70 29 –1 59 5 52 0.116 40.9
NOTE: The 2014–2016 mean is the unadjusted mean across all ECCP and comparison residents during the 3-year intervention period, weighted by the number of residents in each year. Bold text indicates statistical significance at the 0.10 level. Standard statistical practice is to use confidence intervals of 90% or higher; 80% confidence intervals are provided here for comparison purposes only. ECCP = Enhanced Care and Coordination Provider; ED = Emergency Department. SOURCE: RTI analysis of Medicare claims data (RTI program ms08; annual_2016\ms04_glm and ms04_tpm).
Table 3-45 ECCP effect on Medicare expenditures per resident, 2016, Nebraska
Medicare expenditure
Mean, 2016 ($)
Effect ($) 90% CI 80% CI p-value
Relative effect (% of mean)
Total 20,855 –2,177 –3,838 –516 –3,471 –883 0.031 –10.4 All-cause hospitalizations 4,247 –934 –1,577 –291 –1,435 –433 0.017 –22.0 Potentially avoidable hospitalizations
1,187 –357 –673 –41 –604 –111 0.063 –30.1
All-cause ED visits 215 44 –12 100 0 87 0.201 20.2 Potentially avoidable ED visits 71 12 –18 43 –12 37 0.508 17.5
NOTE: The 2016 mean is the unadjusted mean across all ECCP and comparison residents in that year. Bold text indicates statistical significance at the 0.10 level. Standard statistical practice is to use confidence intervals of 90% or higher; 80% confidence intervals are provided here for comparison purposes only. ECCP = Enhanced Care and Coordination Provider; ED = Emergency Department. SOURCE: RTI analysis of Medicare claims data (RTI program ms08; annual_2016\ms04_glm and ms04_tpm).

129
Figure 3-11 ECCP effect on Medicare expenditures per resident per year, Nebraska
NOTE: Dots indicate year-specific effects separately estimated for 2014, 2015, and 2016; triangles indicate intervention period (2014–2016) annual effects; vertical bars are 90% confidence intervals. Detailed numbers underlying the graphs are provided in Appendix H. ECCP = Enhanced Care and Coordination Provider; ED = Emergency Department. SOURCE: RTI analysis of Medicare claims data (RTI program ms08; annual_2016\ms04_glm and ms04_tpm).

130
Table 3-46 Medicaid and Medicare expenditures (in dollars) per beneficiary per month, Medicare-Medicaid dually eligible and Medicaid-
only residents: Means (standard deviations), Nebraska, 2011
Category
Medicare-Medicaid Duals Medicaid-only
Medicare expenditures, PBPM in dollars, mean (SD)
Medicaid expenditures, PBPM in dollars, mean (SD)
Total combined Medicare and Medicaid expenditures,
PBPM in dollars, mean (SD)
Medicaid expenditures, PBPM in dollars, mean (SD)
ECCP Comparison ECCP Comparison ECCP Comparison ECCP Comparison
N (Residents) 1,170 2,244 1,170 2,244 1,170 2,244 89 223
Total expenditures 3,749.18 3,049.08 2,753.79 3,230.72 6,502.97 6,279.81 8,201.07 9,103.65 (4,860.98) (3,972.23) (1,567.49) (2,833.98) (4,836.84) (4,697.57) (8,697.99) (7,062.32)
Subtotal of expenditures (No NF)
3,749.18 3,049.08 276.87 559.84 4,026.05 3,608.92 4,594.95 5,474.21 (4,860.98) (3,972.23) (599.08) (2,610.07) (5,039.02) (4,939.81) (8,356.47) (8,055.14)
All-cause hospitalizations
966.48 772.69 49.79 47.60 1,016.27 820.29 2,590.83 1,195.67 (3,163.63) (2,435.46) (395.03) (319.38) (3,244.78) (2,514.96) (6,981.37) (3,987.78)
Potentially avoidable hospitalizations
457.98 261.47 31.28 21.38 489.26 282.85 1,470.01 272.96 (2,480.22) (1,021.04) (385.25) (194.32) (2,556.13) (1,094.36) (4,966.37) (865.62)
All-cause ED visits 33.59 27.95 2.16 2.50 35.74 30.45 22.50 15.75 (122.59) (103.26) (14.65) (21.03) (129.71) (113.42) (135.85) (63.36)
Potentially avoidable ED visits
10.84 8.91 0.89 0.70 11.73 9.61 16.87 7.45 (59.45) (47.87) (11.25) (6.86) (65.57) (51.19) (134.59) (43.94)
NF Services 0.00 0.00 2,476.92 2,670.89 2,476.92 2,670.89 3,606.12 3,629.44 (0.00) (0.00) (1,365.32) (1,622.81) (1,365.32) (1,622.81) (1,519.84) (2,000.73)
Prescription drugs 452.73 562.04 11.66 15.59 464.39 577.63 696.63 841.44
(495.41) (744.98) (64.06) (68.79) (499.95) (754.71) (929.78) (918.42)
NOTES: PBPM = per beneficiary per month; ED = emergency department; NF = nursing facility; SD = standard deviation; ECCP = Enhanced Care and Coordination Provider. SOURCE: RTI analysis of Medicaid claims data (RTI program: nc02/nhpah292b).
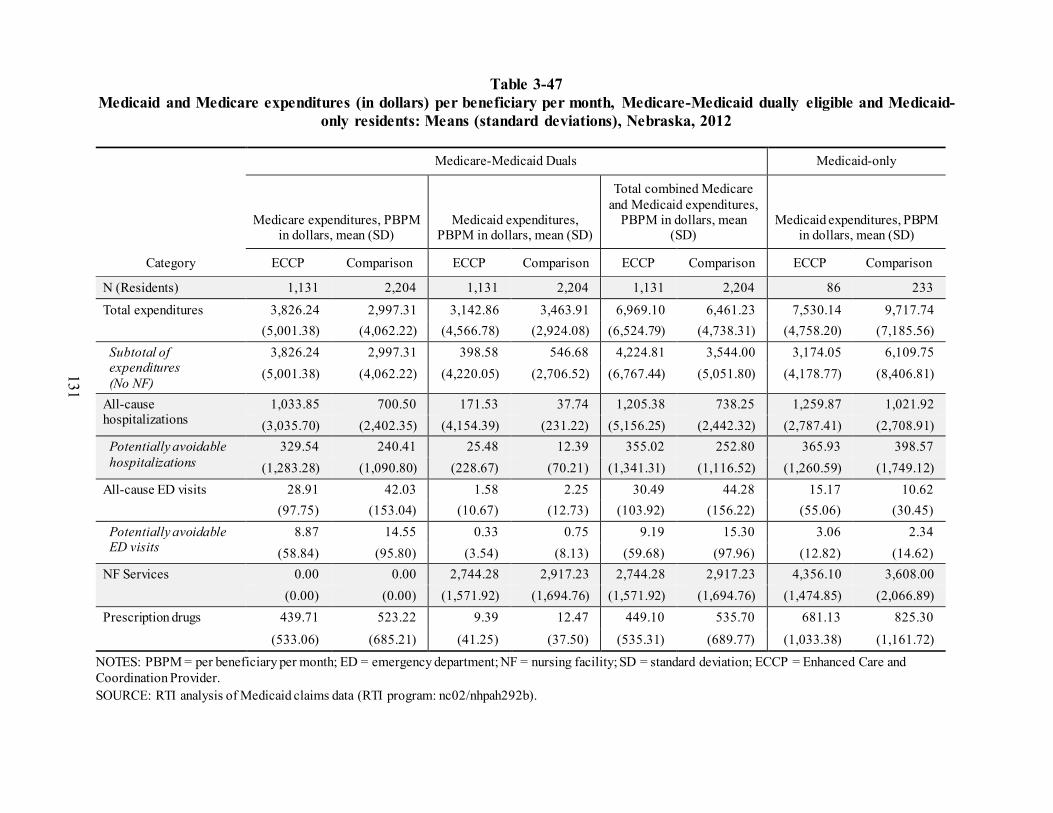
131
Table 3-47 Medicaid and Medicare expenditures (in dollars) per beneficiary per month, Medicare-Medicaid dually eligible and Medicaid-
only residents: Means (standard deviations), Nebraska, 2012
Category
Medicare-Medicaid Duals Medicaid-only
Medicare expenditures, PBPM in dollars, mean (SD)
Medicaid expenditures, PBPM in dollars, mean (SD)
Total combined Medicare and Medicaid expenditures,
PBPM in dollars, mean (SD)
Medicaid expenditures, PBPM in dollars, mean (SD)
ECCP Comparison ECCP Comparison ECCP Comparison ECCP Comparison
N (Residents) 1,131 2,204 1,131 2,204 1,131 2,204 86 233
Total expenditures 3,826.24 2,997.31 3,142.86 3,463.91 6,969.10 6,461.23 7,530.14 9,717.74 (5,001.38) (4,062.22) (4,566.78) (2,924.08) (6,524.79) (4,738.31) (4,758.20) (7,185.56)
Subtotal of expenditures (No NF)
3,826.24 2,997.31 398.58 546.68 4,224.81 3,544.00 3,174.05 6,109.75 (5,001.38) (4,062.22) (4,220.05) (2,706.52) (6,767.44) (5,051.80) (4,178.77) (8,406.81)
All-cause hospitalizations
1,033.85 700.50 171.53 37.74 1,205.38 738.25 1,259.87 1,021.92 (3,035.70) (2,402.35) (4,154.39) (231.22) (5,156.25) (2,442.32) (2,787.41) (2,708.91)
Potentially avoidable hospitalizations
329.54 240.41 25.48 12.39 355.02 252.80 365.93 398.57 (1,283.28) (1,090.80) (228.67) (70.21) (1,341.31) (1,116.52) (1,260.59) (1,749.12)
All-cause ED visits 28.91 42.03 1.58 2.25 30.49 44.28 15.17 10.62 (97.75) (153.04) (10.67) (12.73) (103.92) (156.22) (55.06) (30.45)
Potentially avoidable ED visits
8.87 14.55 0.33 0.75 9.19 15.30 3.06 2.34 (58.84) (95.80) (3.54) (8.13) (59.68) (97.96) (12.82) (14.62)
NF Services 0.00 0.00 2,744.28 2,917.23 2,744.28 2,917.23 4,356.10 3,608.00 (0.00) (0.00) (1,571.92) (1,694.76) (1,571.92) (1,694.76) (1,474.85) (2,066.89)
Prescription drugs 439.71 523.22 9.39 12.47 449.10 535.70 681.13 825.30
(533.06) (685.21) (41.25) (37.50) (535.31) (689.77) (1,033.38) (1,161.72)
NOTES: PBPM = per beneficiary per month; ED = emergency department; NF = nursing facility; SD = standard deviation; ECCP = Enhanced Care and Coordination Provider. SOURCE: RTI analysis of Medicaid claims data (RTI program: nc02/nhpah292b).

132
Table 3-48 Medicaid and Medicare expenditures (in dollars) per beneficiary per month, Medicare-Medicaid dually eligible and Medicaid-
only residents: Means (standard deviations), Nebraska, 2013
Category
Medicare-Medicaid Duals Medicaid-only
Medicare expenditures, PBPM in dollars, mean (SD)
Medicaid expenditures, PBPM in dollars, mean (SD)
Total combined Medicare and Medicaid expenditures,
PBPM in dollars, mean (SD)
Medicaid expenditures, PBPM in dollars, mean (SD)
ECCP Comparison ECCP Comparison ECCP Comparison ECCP Comparison
N (Residents) 1,112 2,185 1,112 2,185 1,112 2,185 100 244
Total expenditures 3,693.89 3,168.00 2,818.30 3,540.99 6,512.19 6,709.00 6,845.70 10,860.61 (5,097.31) (4,835.38) (1,847.06) (2,890.76) (5,214.75) (5,323.00) (4,355.04) (10,073.79)
Subtotal of expenditures (No NF)
3,693.89 3,168.00 230.87 508.01 3,924.76 3,676.02 2,834.14 7,571.50 (5,097.31) (4,835.38) (575.86) (2,624.04) (5,370.96) (5,577.33) (3,834.59) (11,290.15)
All-cause hospitalizations
961.55 858.45 30.33 33.87 991.88 892.32 949.63 1,883.34 (3,391.01) (3,633.45) (145.08) (173.58) (3,437.85) (3,669.74) (3,174.61) (6,114.39)
Potentially avoidable hospitalizations
302.31 318.16 12.05 11.52 314.36 329.69 181.13 561.87 (1,587.47) (2,546.10) (77.99) (65.03) (1,617.02) (2,554.51) (818.78) (3,979.09)
All-cause ED visits 30.19 38.83 1.65 2.65 31.84 41.48 3.48 11.63 (132.34) (137.34) (19.97) (22.78) (144.02) (150.59) (13.04) (48.07)
Potentially avoidable ED visits
11.85 12.16 1.02 1.04 12.88 13.20 1.20 2.21 (107.66) (70.55) (19.51) (13.21) (121.24) (79.31) (9.41) (10.38)
NF Services 0.00 0.00 2,587.44 3,032.98 2,587.44 3,032.98 4,011.56 3,289.11 (0.00) (0.00) (1,667.97) (1,773.08) (1,667.97) (1,773.08) (1,522.76) (2,298.81)
Prescription drugs 481.10 551.91 4.92 8.49 486.02 560.41 635.12 704.43
(669.40) (782.91) (12.48) (21.00) (670.62) (785.07) (946.79) (945.46)
NOTES: PBPM = per beneficiary per month; ED = emergency department; NF = nursing facility; SD = standard deviation; ECCP = Enhanced Care and Coordination Provider. SOURCE: RTI analysis of Medicaid claims data (RTI program: nc02/nhpah292b).

133
Table 3-49 Medicaid and Medicare expenditures (in dollars) per beneficiary per month, Medicare-Medicaid dually eligible and Medicaid-
only residents: Means (standard deviations), Nebraska, 2014
Category
Medicare-Medicaid Duals Medicaid-only
Medicare expenditures, PBPM in dollars, mean (SD)
Medicaid expenditures, PBPM in dollars, mean (SD)
Total combined Medicare and Medicaid expenditures,
PBPM in dollars, mean (SD)
Medicaid expenditures, PBPM in dollars, mean (SD)
ECCP Comparison ECCP Comparison ECCP Comparison ECCP Comparison
N (Residents) 1,070 2,110 1,070 2,110 1,070 2,110 104 227
Total expenditures 3,524.29 3,192.74 3,008.76 3,644.98 6,533.05 6,837.72 7,123.83 10,821.00 (4,589.69) (4,326.83) (1,975.64) (2,966.91) (4,545.02) (5,039.62) (4,967.85) (13,196.76)
Subtotal of expenditures (No NF)
3,524.29 3,192.74 266.40 562.23 3,790.69 3,754.97 3,038.65 7,231.24 (4,589.69) (4,326.83) (898.63) (2,778.42) (4,775.38) (5,371.84) (4,851.14) (14,270.81)
All-cause hospitalizations
863.61 794.44 51.59 37.21 915.19 831.64 1,038.30 1,613.41 (2,950.20) (2,805.39) (637.49) (195.46) (3,079.42) (2,846.06) (3,781.24) (10,797.21)
Potentially avoidable hospitalizations
182.67 218.15 17.02 13.30 199.68 231.45 552.73 325.90 (834.53) (920.78) (236.85) (80.20) (900.06) (943.81) (3,419.80) (1,987.03)
All-cause ED visits 33.83 38.28 1.14 2.77 34.98 41.05 3.19 9.78 (169.13) (124.87) (6.33) (23.68) (170.23) (139.15) (11.88) (37.17)
Potentially avoidable ED visits
9.49 12.59 0.29 0.81 9.78 13.40 0.75 1.38 (72.51) (63.28) (2.69) (10.70) (73.17) (69.38) (5.71) (14.15)
NF Services 0.00 0.00 2,742.36 3,082.75 2,742.36 3,082.75 4,085.19 3,589.77 (0.00) (0.00) (1,639.66) (1,737.81) (1,639.66) (1,737.81) (1,524.47) (2,388.20)
Prescription drugs 494.43 599.22 5.31 9.11 499.74 608.33 668.67 860.72
(647.90) (941.61) (15.42) (39.97) (649.19) (944.48) (1,165.35) (1,453.25)
NOTES: PBPM = per beneficiary per month; ED = emergency department; NF = nursing facility; SD = standard deviation; ECCP = Enhanced Care and Coordination Provider. SOURCE: RTI analysis of Medicaid claims data (RTI program: nc02/nhpah292b).

134
Table 3-50 Medicaid and Medicare expenditures (in dollars) per beneficiary per month, Medicare-Medicaid dually eligible and Medicaid-
only residents: Means (standard deviations), Nebraska, 2015
Category
Medicare-Medicaid Duals Medicaid-only
Medicare expenditures, PBPM in dollars, mean (SD)
Medicaid expenditures, PBPM in dollars, mean (SD)
Total combined Medicare and Medicaid expenditures,
PBPM in dollars, mean (SD)
Medicaid expenditures, PBPM in dollars, mean (SD)
ECCP Comparison ECCP Comparison ECCP Comparison ECCP Comparison
N (Residents) 912 2,076 912 2,076 912 2,076 101 236
Total expenditures 3,754.55 3,202.05 2,843.67 3,450.21 6,598.22 6,652.26 6,700.13 9,323.48 (5,224.45) (4,297.79) (1,731.55) (2,866.52) (5,341.35) (4,910.53) (5,506.34) (8,176.29)
Subtotal of expenditures (No NF)
3,754.55 3,202.05 259.68 563.78 4,014.23 3,765.84 3,170.34 6,028.79 (5,224.45) (4,297.79) (657.45) (2,721.88) (5,481.35) (5,250.73) (5,019.84) (9,163.52)
All-cause hospitalizations
996.23 756.16 30.88 24.72 1,027.12 780.88 1,077.68 1,074.55 (3,827.78) (2,722.10) (243.25) (104.66) (3,887.22) (2,753.88) (3,157.38) (4,824.95)
Potentially avoidable hospitalizations
204.06 205.95 8.16 9.84 212.22 215.79 261.09 185.77 (1,428.24) (955.02) (46.44) (70.36) (1,437.35) (986.79) (1,084.99) (863.18)
All-cause ED visits 27.61 35.80 1.35 2.01 28.96 37.81 8.14 10.81 (105.89) (124.49) (10.54) (14.34) (108.78) (130.35) (24.33) (44.16)
Potentially avoidable ED visits
6.45 10.88 0.39 0.62 6.84 11.50 2.39 1.38 (29.82) (65.66) (6.30) (10.02) (33.35) (71.49) (14.05) (8.85)
NF Services 0.00 0.00 2,583.99 2,886.42 2,583.99 2,886.42 3,529.79 3,294.69 (0.00) (0.00) (1,559.13) (1,632.62) (1,559.13) (1,632.62) (1,574.64) (2,136.74)
Prescription drugs 556.76 648.97 5.10 13.04 561.86 662.02 871.07 837.20
(775.99) (1,130.96) (17.84) (199.02) (776.39) (1,158.46) (2,262.20) (1,135.16)
NOTES: PBPM = per beneficiary per month; ED = emergency department; NF = nursing facility; SD = standard deviation; ECCP = Enhanced Care and Coordination Provider. SOURCE: RTI analysis of Medicaid claims data (RTI program: nc02/nhpah292b).

135
Table 3-51 ECCP effect on MDS-based quality measures (percent of observed quarters per resident
per year with event) during intervention period 2014–2016, Nebraska
MDS-based quality measures
Mean, 2014-2016
(percent)
Effect (percentage
points) 90% CI 80% CI p-value
Relative effect (% of mean)
Decline in ADLs 16.5 4.4 1.6 7.2 2.2 6.6 0.012 26.7 Antipsychotic medication use 22.3 –2.9 –7.2 1.4 –6.2 0.4 0.263 –13.0
NOTE: The 2014–2016 mean is the unadjusted mean across all ECCP and comparison residents during the 3-year intervention period, weighted by the number of residents in each year. Bold text indicates statistical significance at the 0.10 level. Standard statistical practice is to use confidence intervals of 90% or higher; 80% confidence intervals are provided here for comparison purposes only. ADL = Activities of Daily Living; ECCP = Enhanced Care and Coordination Provider; MDS = Minimum Data Set. SOURCE: RTI analysis of MDS assessments data (RTI program jw20; annual_2016\qm).
Table 3-52 ECCP effect on MDS-based quality measures (percent of observed quarters per resident
with event), 2016, Nebraska
MDS-based quality measures
Mean, 2016
(percent)
Effect (percentage
points) 90% CI 80% CI p-value
Relative effect (% of mean)
One or more falls with injury 13.0 0.8 –3.1 4.7 –2.3 3.9 0.744 6.1 Self-report moderate to severe pain 12.6 –0.1 –4.2 4.0 –3.3 3.1 0.954 –0.8 Pressure ulcers Stage II or higher 4.6 –0.6 –1.8 0.6 –1.5 0.3 0.407 –13.0 Urinary tract infection 5.1 1.9 –1.9 5.7 –1.0 4.8 0.398 37.0 Catheter inserted and left in bladder 5.3 1.7 –0.8 4.2 –0.2 3.6 0.238 31.8 Decline in ADLs 16.0 7.7 3.8 11.6 4.6 10.8 0.002 48.2 Antipsychotic medication use 21.0 –4.2 –8.5 0.1 –7.5 –0.9 0.109 –20.0 Depressive symptoms 6.3 2.4 –1.9 6.7 –0.9 5.7 0.364 38.1
NOTE: The 2016 mean is the unadjusted mean across all ECCP and comparison residents in that year. Bold text indicates statistical significance at the 0.10 level. Standard statistical practice is to use confidence intervals of 90% or higher; 80% confidence intervals are provided here for comparison purposes only. ADL = Activities of Daily Living; ECCP = Enhanced Care and Coordination Provider; MDS = Minimum Data Set. SOURCE: RTI analysis of MDS assessments data (RTI program jw20; annual_2016\qm).

136
3.4.3 Implementation
Implementation Experience The Alegent ECCP model was initiated in 2013 in 15 nursing facilities in the Greater
Omaha area. In Initiative Year 2, the Initiative was discontinued in one facility when it was determined the facility no longer could support it. With the exception of the educational program continually evolving, the Initiative was implemented with fidelity to the original model, with a heavy focus on integrating the ECCP APRNs into the clinical care teams in facilities.
The ECCP employed six APRNs who spent 1–2 full days per week in each facility. Most of this time was dedicated to visiting residents, with whom APRNs responded to emergent conditions and conducted regular resident assessments every 120 days. The APRNs also implemented other components of the Initiative, including medication management through use of the LTC-MOM tool, promoting EOL care planning, providing education to nursing staff, and participating in QAPI/ QI efforts. The ECCP also employed two dental hygienists, who provided regular cleanings and referrals for enrolled residents, as well as training on oral care for facility nurses and CNAs.
As implementation progressed, the ECCP built relationships with facility staff and gradually gained buy-in from facility leadership and providers. However, the ECCP encountered several barriers to implementation. One barrier was turnover, both among facility staff and among ECCP APRNs. Both types of turnover slowed the ECCP’s progress toward sustaining model components that required buy-in and collaboration from facility staff. Another barrier was APRNs’ limited ability to write orders for enrolled residents, fueled by early skepticism of the Initiative among providers. APRNs had the most impact on residents for whom they could write orders, though this was limited to only a few residents cared for by medical directors and providers in participating facilities. While the ECCP gained the trust of physicians throughout the course of the Initiative, many physicians started to hire their own extenders and consequently perceived the ECCP nurses to be irrelevant. The ECCP also had difficulty differentiating itself from other groups of physician extenders who visited facilities in the Omaha area. Other barriers included facilities using non-ECCP corporate policies or tools for communicating with providers. The ECCP had more success in supporting existing tools, policies, and practices as they related to reducing avoidable hospitalizations, rather than providing education focused on tools imposed by the ECCP.
Figure 3-12 summarizes key findings from the RTI Nursing Facility Administrator Survey for Alegent. It shows the trajectory of support for the ECCP by presenting longitudinal data from 2013–2016 on whether facility administrators found the training and support provided by the ECCP and its nurses to be sufficient and helpful during the Initiative. While the survey data shows a decrease in satisfaction with ECCP support during the final year of the Initiative, the reason is not clear, but this might relate to change in ECCP leadership duties. The longitudinal data on two major implementation barriers—staff resistance to change and staff turnover—are also included, as well as data on physician buy-in. Finally, the chart includes 2016
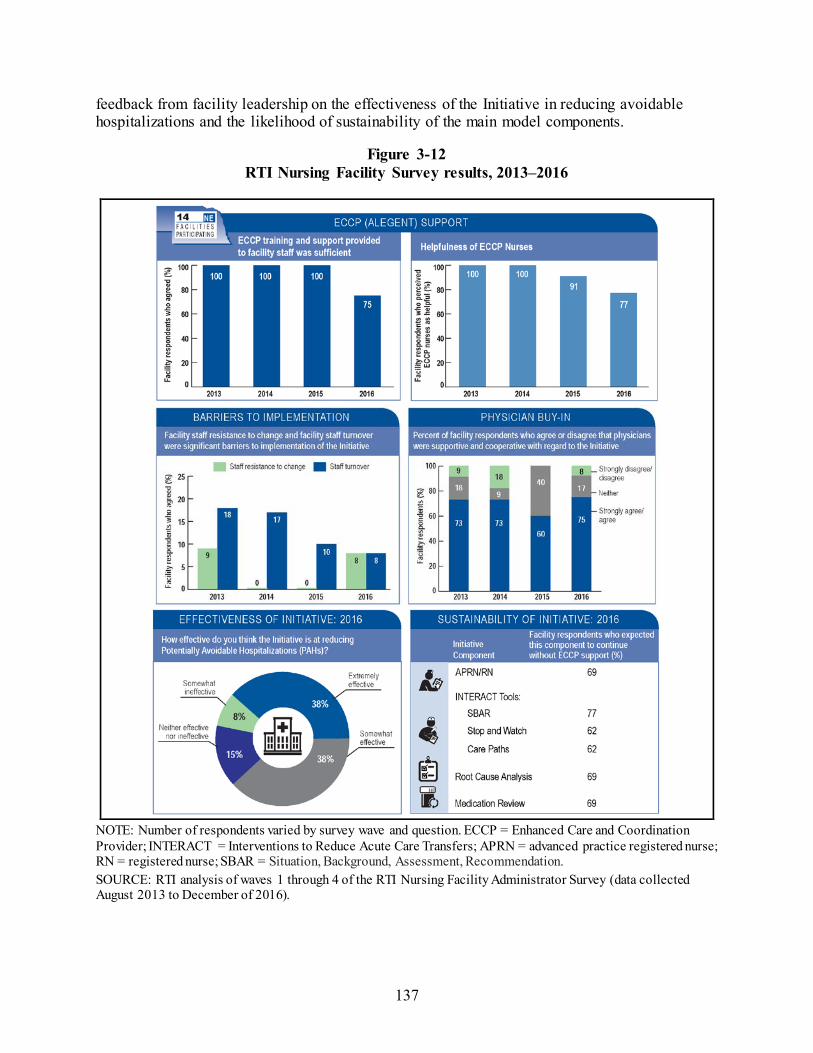
137
feedback from facility leadership on the effectiveness of the Initiative in reducing avoidable hospitalizations and the likelihood of sustainability of the main model components.
Figure 3-12 RTI Nursing Facility Survey results, 2013–2016
NOTE: Number of respondents varied by survey wave and question. ECCP = Enhanced Care and Coordination Provider; INTERACT = Interventions to Reduce Acute Care Transfers; APRN = advanced practice registered nurse; RN = registered nurse; SBAR = Situation, Background, Assessment, Recommendation. SOURCE: RTI analysis of waves 1 through 4 of the RTI Nursing Facility Administrator Survey (data collected August 2013 to December of 2016).

138
Primary care physicians and facility medical directors received fact sheets about the Initiative. Physicians could elect co-management for participating residents, which permitted the ECCP APRN to conduct alternate 60-day visits and write orders for the resident. Physicians electing not to have the ECCP co-manage their residents represented a greater barrier to participation, as the ECCP’s role was limited for these residents. The frequency of this phenomenon fluctuated over the implementation period but impacted enough residents that it may have attenuated the impact of Nebraska’s intervention.
Facility Staff Engagement with Initiative Components Facilities participating in the Alegent ECCP were most engaged with communicating
with providers (Table 3-53). Over half of facilities demonstrated high engagement with documenting changes in condition, medication review, and education and training. The majority of facilities also demonstrated moderate to high engagement with the remaining model components: APRN involvement, end-of-life care, quality improvement, care transitions and communication during transfers, and dental care. Use of model components generally correlated with engagement. More than half of facilities were classified as having moderate to high use of all model components. Facilities demonstrated the highest use of medication review, EOL care, and APRN involvement.
Table 3-53 Facility engagement with Initiative components, Alegent, 2016
NOTE: 13 facilities evaluated SOURCE: RTI evaluation of facility engagement using site visit and telephone interview data (data collected 2016).

139
Staff Buy-in Building relationships with facility staff and increasing facility buy-in were consistent
goals of the Nebraska ECCP. Because the model was focused on increasing the presence and involvement of APRNs in long-term care, buy-in for APRNs and the value of the services they provided was crucial to the success of the Initiative. They generally were successful, particularly with nursing staff who frequently relied on the APRNs for clinical care and consultation. In contrast, engaging providers and nursing facility leadership was challenging, especially toward the beginning of the Initiative, as many were unclear on the role or added value of the ECCP APRNs. Alegent focused on building relationships slowly rather than risking buy-in by attempting to make abrupt or dramatic changes to facilities.
Buy-in varied by facility. In facilities in which residents’ physicians precluded ECCP APRNs from writing orders for patients, the role of the ECCP APRN was less defined, leading to lower awareness and engagement from both nursing facility leadership and floor staff. Conversely, nursing facilities in which the ECCP APRN wrote orders and provided more clinical care formed closer relationships between ECCP and facility staff. Facilities with the highest levels of buy-in often would engage with the Initiative by requesting additional training, utilizing the ECCP’s 24-hour call service, and allowing the ECCP APRN to take an active role in care planning and QI meetings.
Beneficiary Enrollment and Buy-in Eligible residents or their power of attorney received an invitation letter to participate in
the Initiative, which included instructions for opting out. Few residents opted out of the program, and there were no instances of residents opting out after being enrolled. Although the residents expressed appreciation for the APRNs and trust in their care, they were typically unaware of the purpose of the ECCP and were unable to distinguish how the ECCP APRNs differed from the facility staff or other providers. Although participating residents’ charts were marked with stickers, nursing staff often relied primarily on verbal communication with ECCP APRNs to determine which residents were part of the Initiative.
Outcomes and Successes Throughout the Initiative, facility staff
identified the thoroughness of the ECCP APRNs’ chart reviews as a strength of the ECCP, compared to residents’ clinicians who often only had time for cursory reviews during their 60-day visits. In filling this role, the ECCP APRNs evaluated medication interactions, identified changes in condition, tracked critical laboratory results, and recommended appropriate interventions. Facility staff’s respect for the ECCP APRN’s clinical judgment was critical for their involvement in helping to identify acute changes in condition and ability to intervene and prevent hospitalizations. Involving facility staff in chart reviews and clinical assessments allowed the ECCP APRNs to provide one-on-one mentorship to clinical staff. ECCP leadership considered

140
this mentorship and their relationships with facility staff to be a prominent success of the Initiative. APRNs focused their mentorship on developing nurses’ critical thinking skills and elevating the quality of nursing in facilities.
Facility and ECCP staff also indicated that the dental component of the Initiative provided effective care and education. Data collected in the final year of the Initiative revealed some improvement in oral hygiene among residents. Facility staff indicated that CNAs were more vigilant about providing good dental care immediately after ECCP trainings, although these effects diminished over time.
Best Practices, Sustainability, and Lessons Learned The ECCP identified several common strengths in facilities best suited for sustainability,
including high engagement in the ECCP and the presence of an existing medical director who was willing to collaborate with the ECCP. These facility characteristics were described by ECCP interviewees as best practices and lessons learned throughout the course of the Initiative. ECCP staff emphasized the importance of investing time in building relationships with the facility staff. This included gaining buy-in from nursing staff and encouraging them to use the ECCP APRNs as a resource, as well as earning the trust of medical directors and other physicians. When reflecting on lessons learned, ECCP staff suggested that efforts to engage physicians should have occurred earlier and more regularly.
ECCP staff also identified education as an Initiative component that could have been improved. The ECCP conducted an initial in-service on communication and then spent several months developing a second in-service on urinary tract infections (UTIs). Although the trainings were well received, the ECCP found that developing trainings was too resource-intensive to conduct on a quarterly basis, as originally planned. Following the UTI trainings, the ECCP transitioned to using NICHE for education, a web-based program designed for geriatric nursing. Implementation of NICHE, however, proved challenging with the limited number of licenses that could be allotted for each training and limited willingness of leadership in many facilities to devote staff time to online training.
Even when ECCP staff made a concerted effort to engage facility nurses and providers, not every facility accessed the ECCP at an optimal level. In facilities with corporate policies or established practices for communication with providers, implementing INTERACT tools was challenging. Further, in nursing facilities with a high presence of physicians and physician extenders, ECCP APRNs did not play an active role in the clinical care of residents. In these facilities, the ECCP found more success supporting existing tools, policies, and practices as they related to reducing avoidable hospitalizations.

141
3.4.4 Summary
Alegent, a not-for-profit health care system, administered the Nebraska ECCP model. The goals of the ECCP were to reduce potentially avoidable hospitalizations, improve resident health outcomes, improve the transition process between inpatient hospitals and nursing facilities, reduce health care expenditures, and improve medication management for long-stay residents. Each of the ECCP’s six APRNs served several nursing facilities, where they provided clinical services to residents and training to facility staff. ECCP APRNs provided services including EOL planning using the Life Issues Review tool, medication review using the LTC-MOM tool, H&P, and training in using INTERACT tools. In addition to the APRNs, dental hygienists employed by the ECCP provided dental care and related education in participating facilities.
Alegent focused on building relationships slowly rather than risking buy-in by attempting to make abrupt or dramatic changes to facilities. Physicians initially were reticent to permit APRNs affiliated with a local hospital system to write orders for their patients, but many formed collaborative relationships with the APRNs by the final years of the Initiative. Increased buy-in from facilities and physicians led to higher APRN involvement in patient care in several facilities by the final years of the Initiative. Consistent with this approach, the ECCP started seeing more statistically significant and consistent effects in 2016, such as reductions in potentially avoidable hospitalizations and total Medicare expenditures as well as expenditures for all-cause and potentially avoidable hospitalizations. Additionally, Alegent is the only ECCP not participating in the Payment Reform Initiative that began in October 2016. They spent the final year of the Initiative strengthening their presence in facilities in preparation for their sustainability plan, rather than focusing their efforts on preparing for the new Initiative.33 This allowed them to continue to focus on their Initiative goals. Several other ECCPs saw a strongest effect in 2015 and a weaker effect in 2016, which may be explained by those ECCPs diluting focus with preparing for the new Initiative. When looking at the year-specific effect estimates, the evidence for reductions in the ECCP group became stronger in 2016 than in the previous 2 years in potentially avoidable hospitalizations, total Medicare expenditures and hospitalization expenditures.
On the other hand, there seemed to be a tendency toward more ED visits, both all-cause and potentially avoidable, in the ECCP group. The ECCP employed six APRNs who spent 1–2 full days per week, as opposed to a full week, in each facility. Most of this time was dedicated to visiting residents, including assessment using the tools promoted by the ECCP such as the LTC-MOM. The ECCP APRNs had varying ability to write orders across facilities and residents; they had to communicate with the attending physicians for residents for whom the ECCP APRNs were not permitted to write orders. Thus, early identification of symptoms and signs for changing conditions by the ECCP APRNs may have potentially caused more ED visits, especially among residents for whom the ECCP APRNs do not have the permission to write orders. Additionally,
33 The Alegent ECCP conceived an Associate Healthcare Director (AHD) model, which would involve a team of
NPs and physicians hired to collectively serve as medical director across several facilities. This model would mirror the structure of the ECCP. Each facility would have an APRN who is the assigned AHD, and each APRN would serve as AHD in several facilities. The AHD would provide the majority of patient care, with a physician available for consultation.

142
the ECCP saw potentially worse, although not statistically significant, results for falls with injuries relative to the comparison group, which may have caused more ED visits. The increasing trend in both ED visits and falls may be due to increased identification and reporting of falls by the ECCP APRNs and insistence that residents who experience falls receive x-rays or computed tomography (CT) scans. The ECCP APRNs regularly reviewed patients who experienced recent falls using the LTC-MOM tool, which includes components related to functional status. These efforts may have led to better reporting of these outcomes on the MDS, which would result in a tendency toward worse MDS-based quality measures.
There was no evidence for an effect of the ECCP intervention on MDS-based quality measures. Alegent’s intent was to impact quality through improving nursing care in facilities, although much of these efforts focused on informal education of nursing staff. The ECCP APRNs had minimal involvement in facilities’ QI efforts. The ECCP APRNs only attended the QI meetings in some facilities in 2015–2016 and were mostly observers in these meetings. There seemed to be a tendency toward lower antipsychotic medication use, which may be related to the medication management activities done by the ECCP APRNs. However, the comparison group also saw decline in antipsychotic medication use during the same period, possibly caused by a national effort by CMS to improve dementia care and reduce antipsychotic medication use in nursing homes. The ECCP also conducted limited formal trainings as part of the QI efforts, including an in-service on UTIs. Although the training was well received, there was no evidence to support improved outcomes for UTIs and catheter use.

143
3.5 Nevada
3.5.1 HealthInsight Nevada Admissions and Transitions Optimization Program (ATOP)
HealthInsight, a QIO and an ECCP, administered the Admissions and Transitions Optimization Program (ATOP) model. The goals were to reduce avoidable hospitalizations among long-stay NF residents, improve NF resident health outcomes, reduce overall health care spending, and facilitate culture change toward the early recognition and management of conditions that lead to avoidable hospitalizations. The ATOP model utilized APRNs and RNs to provide clinical care and education, training by the ECCP and partners on a variety of topics, and support of INTERACT tool use, EOL care planning, and QI activities. ATOP APRNs and RNs were assigned to groups of four or five facilities, called pods, and divided their time and resources across all facilities within a given pod. The model also used a web-based Resident Registry to capture all clinical information for resident management and reporting by ATOP clinicians. Table 3-54 summarizes the ATOP model. The ATOP intervention was associated with statistically significant reductions in hospitalization-related utilization and expenditures but a tendency toward increased ED use. Estimated effects may be unreliable because of comparison group limitations.
Table 3-54 ATOP model description
Structure Organization type HealthInsight is Nevada’s QIO Partners and their roles Nevada Health Care Association Perry Foundation and the Ralston Group provide
training for ATOP and nursing facility clinical staff. Number of facilities HealthInsight initially engaged 25 nursing facilities. NF attrition In August 2013, Las Vegas Post-Acute and Rehabilitation (formerly Kindred Life
Care) withdrew from the Initiative; 24 facilities continued through the final year. Facility-based staff 15.5 FTE total: 10.5 RNs, 5 APRNs State APRN practice arrangements affecting implementation
In July 2013, state law was changed to allow APRNs with 2 years, or 2,000 hours of practice, to practice without a collaborative practice agreement with a physician. This law also allows them to prescribe medications independently, with limits on controlled substances.
Use of registered or higher-level nurses APRN Yes; 1 APRN per five facilities RN Yes; 2 RNs per five facilities, 0.5 RN assigned to one facility
(continued)

144
Table 3-54 (continued) ATOP model description
Role of Nurse Clinical care Yes Writing orders APRNs wrote orders for residents with the permission of the resident’s primary
care provider. Education APRNs and RNs provided 1-on-1 and group trainings to nursing facility staff. Weekly Schedule The design called for 1 APRN and 2 RNs to cover five nursing facilities. Because
of staff shortages and variation in sizes of facilities, coverage of facilities varied greatly.
Medication Management Polypharmacy reduction Yes; in the early years, ATOP also focused on falls associated with polypharmacy Antipsychotics reduction Yes; in the second and third years, ATOP provided training on reducing
psychotropic drugs Medication review Yes; ATOP APRNs reviewed resident medications Tools promoted by ECCPs to improve communication and identification of changes in resident condition
(INTERACT and others) SBAR Yes; ATOP promoted all INTERACT tools in all facilities with various levels of
adoption. Both paper and electronic tools were used depending on facility EMR. Stop and Watch Yes; ATOP staff trained all facilities with various levels of adoption. Both paper
and electronic tools were used depending on facility EMR. Transfer forms Yes; ATOP promoted this form, but facilities generally used their own forms.
Some facilities included the SBAR with the transfer. QI tool Yes; root cause analyses (INTERACT QI tool) of hospitalizations were conducted
by ATOP and provided to facilities; quarterly hospitalization data were also provided to facilities (including physicians responsible for admissions/time/day, and cause).
Care paths Yes
End-of-life planning Advance directives Yes; POLST Staff training/ discussion Yes None
Note: APRN = advanced practice registered nurse; ATOP = Admissions and Transitions Optimization Program; ECCP = Enhanced Care and Coordination Provider; EMR = electronic medical record; FTE = full-time equivalent; INTERACT = Interventions to Reduce Acute Care Transfers; POLST = Physician Orders for Life-Sustaining Treatment; RN = registered nurse; SBAR = Situation, Background, Assessment, Recommendation; QI = quality improvement; QIO = quality improvement organization.

145
3.5.2 Utilization, Expenditure, and Quality
It should be noted that in Nevada, the comparison group was limited to a small number of non-ECCP facilities not matched on propensity scores, in contrast to the larger, propensity-matched comparison groups used in other states. Thus, the results reported below on ECCP effect estimates in Nevada should be interpreted with caution.
Utilization. The ECCP intervention was associated with reductions in the probability of hospitalizations and poten-tially avoidable hospitalizations. The estimated per resident, per year interven-tion period (2014–2016) effect was a 5.7-percentage point lower probability of an all-cause hospitalization (statistically significant at the 0.10 level) and a 2.0-percentage point lower probability of a potentially avoidable hospitalization (not statistically significant). Given the overall probability of a hospitalization and potentially avoidable hospitalization of 28.4 percent and 10.7 percent, respectively, these effects represent reductions of 20.0 percent and 18.2 percent (not statistically significant), respectively (Table 3-55). Each of the year-specific Initiative effect estimates was associated with a statistically significant reduction in the probability of any hospitalization, although the effect estimates varied in magnitude. In 2014, the intervention effect was a 4.6 percentage point reduction in the probability of any hospitalization, which became stronger in 2015, with an 8.7-percentage point reduction, and weakened in 2016, with a 5.1-percentage point reduction (Figure 3-13). For the probability of any potentially avoidable hospitalization, the year-specific effects all had negative signs, indicating reductions, although they were statistically significant only in 2015 and 2016 (Figure 3-13, Table 3-56). There was a similar pattern of effect estimates for the counts of hospitalizations and potentially avoidable hospitalizations (Table 3-57, Table 3-58).
There is no evidence for reductions in ED visits or potentially avoidable ED visits. Indeed, the intervention period annual effect estimates indicated an increase in both the probability and count of ED visits and potentially avoidable ED visits, although none of these estimates were statistically significant and the overall magnitude of these estimates was small. The year-specific effect estimates also indicated an increase in all-cause and potentially avoidable ED visits in each year, although most of these estimates were not statistically significant.
Medicare Expenditures. There is evidence that the ECCP intervention was associated with reduced total Medicare expenditures as well as expenditures for all-cause and potentially avoidable hospitalizations. The intervention period (2014–2016) annual effect estimate on total Medicare expenditures was a statistically significant reduction of $4,853 per resident per year, a 20.8-percent reduction based on total average spending of $23,284 (Table 3-59). The
KEY FINDINGS
In Nevada, the ECCP intervention showed mixed effects on key utilization and expenditure measures.
There were statistically significant reductions in both all-cause and potentially avoidable hospitalizations, hospitalization-related expenditures, and total Medicare expenditures among ECCP facility residents, mostly shown in the last two Initiative years, 2015 and 2016.
Evidence points to increases in ED visits and related expenditures across all years. However, not all increases were statistically significant.
The estimated effects of the Initiative in Nevada may be unreliable because the comparison group (all the non-participating facilities in the state) had fewer facilities than the ECCP group and could not be matched. The estimated effects of the Initiative in Nevada may be unreliable because the comparison group (all the non-participating facilities in the state) had fewer facilities than the ECCP group and could not be matched.

146
intervention period per resident, per year effect estimates also indicated statistically significant reductions in expenditures for all-cause hospitalizations and potentially avoidable hospitalizations. All the year-specific effects indicate reductions in all these expenditure measures, with the largest reductions observed in 2015 (Figure 3-14, Table 3-60). However, the ECCP was associated with statistically significant increases in Medicare expenditures for both all-cause and potentially avoidable ED visits, in the intervention period annual effect estimates (Table 3-59) and several of the year-specific effect estimates (Figure 3-14).
Medicaid Expenditures. The section presents descriptive analyses of Medicaid and Medicare expenditures on select services for Initiative-eligible residents with Medicaid coverage in Nevada during all study years for which usable Medicaid data could be obtained, including 2011 (Table 3-61), 2012 (Table 3-62), 2013 (Table 3-63), 2014 (Table 3-64), and 2015 (Table 3-65). Please note that, unlike the Medicare multivariate regression analyses described above, the Medicaid expenditure results presented in this section are descriptive. Descriptive statistics cannot be taken as results of an intervention. The observed trends must be understood within the context of possible changes in ECCP resident characteristics as well as each state’s comparison group.
The results across years share similar patterns. Overall, Tables 3-61 through 3-65 illustrate that the expenditures for NF residency represented the highest expenditures every year compared to other service types. In general, NF expenditures accounted for a slightly larger percentage of the total expenditures in the Medicaid-only group than in the Medicare-Medicaid duals group in the ECCP group. However, the opposite was true for the percentage of Medicaid payments. Among Medicare-Medicaid duals, average total combined Medicare and Medicaid expenditures PBPM for each service type (excluding Medicaid NF costs) were primarily driven by Medicare expenditures with Medicaid paying only a small portion of the service. There is no clear trend of reduction in expenditures in the ECCP group relative to the comparison group.
MDS-Based Quality. Based on the intervention period annual effect, there was a statistically significant 5.2-percentage point increase in the use of antipsychotic medications, suggesting worsening quality (Table 3-66). This result is consistent with the 2016 year-specific results, where only one quality measure had a statistically significant result, with an 8.2-percentage point increase in the use of antipsychotic medications, indicating worsening quality. Based on year-specific estimates in 2016, the Initiative does not appear to have improved quality based on MDS quality measures. Five of the eight quality measures, pressure ulcers stage II or higher, UTI, catheter inserted and left in bladder, decline in ADLs, and depressive symptoms, demonstrated an improvement, but the effect estimates are not statistically significant (Table 3-67).

147
Table 3-55 ECCP effect on probability of any utilization per resident per year during intervention
period, 2014–2016, Nevada
Probability of having at least one:
Mean, 2014-2016
(percent)
Effect (percentage
points) 90% CI 80% CI p-value
Relative effect (% of mean)
All-cause hospitalization 28.4 –5.7 –9.1 –2.3 –8.3 –3.0 0.007 –20.0 Potentially avoidable hospitalization
10.7 –2.0 –4.1 0.2 –3.7 –0.3 0.141 –18.2
All-cause ED visit 20.4 0.8 –2.1 3.6 –1.5 3.0 0.654 3.8 Potentially avoidable ED visit 7.6 1.0 –0.9 2.9 –0.5 2.4 0.397 12.7
NOTE: The 2014–2016 mean is the unadjusted mean across all ECCP and comparison residents during the three-year intervention period, weighted by the number of residents in each year. Bold text indicates statistical significance at the 0.10 level. Standard statistical practice is to use confidence intervals of 90% or higher; 80% confidence intervals are provided here for comparison purposes only. ECCP = Enhanced Care and Coordination Provider; ED = Emergency Department. SOURCE: RTI analysis of Medicare claims data (RTI program ms06; annual_2016\ms01_xtgee).
Table 3-56 ECCP effect on probability of any utilization per resident per year, 2016, Nevada
Probability of having at least one:
Mean, 2016
(percent)
Effect (percentage
points) 90% CI 80% CI p-value
Relative effect (% of mean)
All-cause hospitalization 29.0 –5.1 –7.8 –2.4 –7.2 –3.0 0.002 –17.5 Potentially avoidable hospitalization
10.6 –2.3 –4.2 –0.3 –3.8 –0.7 0.057 –21.2
All-cause ED visit 21.5 0.8 –2.3 3.9 –1.6 3.3 0.656 3.9 Potentially avoidable ED visit 8.3 0.9 –1.5 3.2 –0.9 2.7 0.535 10.6
NOTE: The 2016 mean is the unadjusted mean across all ECCP and comparison residents in that year. Bold text indicates statistical significance at the 0.10 level. Standard statistical practice is to use confidence intervals of 90% or higher; 80% confidence intervals are provided here for comparison purposes only. ECCP = Enhanced Care and Coordination Provider; ED = Emergency Department. SOURCE: RTI analysis of Medicare claims data (RTI program ms06; annual_2016\ms01_xtgee).

148
Figure 3-13 ECCP effect on probability of any utilization per resident per year, Nevada
NOTE: Dots indicate year-specific effects separately estimated for 2014, 2015, and 2016; triangles indicate intervention period (2014–2016) annual effects; vertical bars are 90% confidence intervals. Detailed numbers underlying the graphs are provided in Appendix H. ECCP = Enhanced Care and Coordination Provider; ED = Emergency Department. SOURCE: RTI analysis of Medicare claims data (RTI program ms06; annual_2016\ms01_xtgee).

149
Table 3-57 ECCP effect on count of utilization per resident per year during intervention period, 2014–
2016, Nevada
Count of events per resident
Mean, 2014-2016 Effect 90% CI 80% CI p-value
Relative effect (% of mean)
All-cause hospitalizations 0.415 –0.117 –0.188 –0.046 –0.172 –0.061 0.007 –28.1 Potentially avoidable hospitalizations 0.126 –0.026 –0.058 0.007 –0.050 –0.001 0.192 –20.3 All-cause ED visits 0.300 0.013 –0.035 0.062 –0.025 0.051 0.655 4.4 Potentially avoidable ED visits 0.092 0.024 –0.001 0.049 0.005 0.043 0.114 26.2
NOTE: The 2014–2016 mean is the unadjusted mean across all ECCP and comparison residents during the 3-year intervention period, weighted by the number of residents in each year. Bold text indicates statistical significance at the 0.10 level. Standard statistical practice is to use confidence intervals of 90% or higher; 80% confidence intervals are provided here for comparison purposes only. ECCP = Enhanced Care and Coordination Provider; ED = Emergency Department. SOURCE: RTI analysis of Medicare claims data (RTI program ms07; annual_2016\ms03_xtgee).
Table 3-58 ECCP effect on count of utilization per resident per year, 2016, Nevada
Count of events per resident Mean, 2016 Effect 90% CI 80% CI p-value
Relative effect (% of mean)
All-cause hospitalizations 0.429 –0.096 –0.146 –0.046 –0.135 –0.057 0.002 –22.4 Potentially avoidable hospitalizations 0.123 –0.033 –0.061 –0.005 –0.055 –0.011 0.049 –26.9 All-cause ED visits 0.321 0.008 –0.049 0.066 –0.036 0.053 0.811 2.6 Potentially avoidable ED visits 0.102 0.026 –0.018 0.071 –0.008 0.061 0.330 25.9
NOTE: The 2016 mean is the unadjusted mean across all ECCP and comparison residents in that year. Bold text indicates statistical significance at the 0.10 level. Standard statistical practice is to use confidence intervals of 90% or higher; 80% confidence intervals are provided here for comparison purposes only. ECCP = Enhanced Care and Coordination Provider; ED = Emergency Department. SOURCE: RTI analysis of Medicare claims data (RTI program ms07; annual_2016\ms03_xtgee).

150
Table 3-59 ECCP effect on Medicare expenditures per resident per year during intervention period,
2014–2016, Nevada
Medicare expenditure
Mean, 2014-2016 ($) Effect ($) 90% CI 80% CI p-value
Relative effect (% of mean)
Total 23,284 –4,853 –8,096 –1,611 –7,380 –2,327 0.014 –20.8 All-cause hospitalizations 5,802 –1,581 –2,506 –656 –2,302 –860 0.005 –27.3 Potentially avoidable hospitalizations 1,320 –370 –719 –20 –642 –97 0.082 –28.0 All-cause ED visits 237 61 1 121 14 108 0.096 25.7 Potentially avoidable ED visits 70 40 6 74 14 66 0.051 56.9
NOTE: The 2014–2016 mean is the unadjusted mean across all ECCP and comparison residents during the 3-year intervention period, weighted by the number of residents in each year. Bold text indicates statistical significance at the 0.10 level. Standard statistical practice is to use confidence intervals of 90% or higher; 80% confidence intervals are provided here for comparison purposes only. ECCP = Enhanced Care and Coordination Provider; ED = Emergency Department. SOURCE: RTI analysis of Medicare claims data (RTI program ms08; annual_2016\ms04_glm and ms04_tpm).
Table 3-60 ECCP effect on Medicare expenditures per resident, 2016, Nevada
Medicare expenditure
Mean, 2016 ($)
Effect ($) 90% CI 80% CI p-value
Relative effect (% of mean)
Total 23,787 –3,925 –7,689 –160 –6,859 –990 0.086 –16.5 All-cause hospitalizations 6,123 –1,289 –2,226 –351 –2,019 –558 0.024 –21.0 Potentially avoidable hospitalizations
1,352 –458 –728 –189 –669 –248 0.005 –33.9
All-cause ED visits 246 23 –43 90 –29 75 0.565 9.4 Potentially avoidable ED visits 77 15 –20 49 –12 41 0.480 19.2
NOTE: The 2016 mean is the unadjusted mean across all ECCP and comparison residents in that year. Bold text indicates statistical significance at the 0.10 level. Standard statistical practice is to use confidence intervals of 90% 4or higher; 80% confidence intervals are provided here for comparison purposes only. ECCP = Enhanced Care and Coordination Provider; ED = Emergency Department. SOURCE: RTI analysis of Medicare claims data (RTI program ms08; annual_2016\ms04_glm and ms04_tpm).

151
Figure 3-14 ECCP effect on Medicare expenditures per resident per year, Nevada
NOTE: Dots indicate year-specific effects separately estimated for 2014, 2015, and 2016; triangles indicate intervention period (2014–2016) annual effects; vertical bars are 90% confidence intervals. Detailed numbers underlying the graphs are provided in Appendix H. ECCP = Enhanced Care and Coordination Provider; ED = Emergency Department.

152
Table 3-61 Medicaid and Medicare expenditures (in dollars) per beneficiary per month, Medicare-Medicaid dually eligible and Medicaid-
only residents: Means (standard deviations), Nevada, 2011
Category
Medicare-Medicaid Duals Medicaid-only
Medicare payments, PBPM in dollars, mean (SD)
Medicaid payments, PBPM in dollars, mean (SD)
Total combined Medicare and Medicaid payments, PBPM in
dollars, mean (SD)
Medicaid payments, PBPM in dollars, mean (SD)
ECCP Comparison ECCP Comparison ECCP Comparison ECCP Comparison
N (Residents) 2,216 1,272 2,216 1,272 2,216 1,272 190 134 Total expenditures 4,692.38 5,643.41 3,189.45 3,908.13 7,881.83 9,551.54 6,493.51 9,196.85
(6,635.83) (8,118.64) (2,249.75) (3,079.81) (6,431.19) (8,331.47) (4,611.44) (5,809.77) Subtotal of expenditures (No NF)
4,692.38 5,643.41 322.95 612.43 5,015.32 6,255.84 1,886.53 1,799.76 (6,635.83) (8,118.64) (1,026.60) (1,988.56) (6,984.43) (8,881.04) (3,657.31) (2,750.37)
All-cause hospitalizations 1,166.87 1,535.17 101.31 159.65 1,268.18 1,694.82 1,021.75 989.55 (4,211.41) (5,051.41) (822.16) (1,395.52) (4,428.92) (5,583.26) (3,341.92) (2,444.39)
Potentially avoidable hospitalizations
366.34 529.40 42.98 45.91 409.32 575.31 172.85 359.47 (1,764.64) (2,812.80) (537.70) (390.47) (1,973.71) (3,004.23) (909.73) (1,712.39)
All-cause ED visits 29.53 33.85 13.93 8.66 43.46 42.51 34.74 35.75 (111.31) (140.52) (86.88) (48.08) (163.46) (176.18) (120.35) (116.89)
Potentially avoidable ED visits
8.50 12.94 3.94 3.23 12.44 16.17 6.20 11.99 (50.79) (90.33) (30.16) (32.33) (72.70) (114.18) (29.44) (45.34)
NF Services 0.00 0.00 2,866.50 3,295.70 2,866.50 3,295.70 4,606.98 7,397.09 (0.00) (0.00) (2,138.57) (2,664.89) (2,138.57) (2,664.89) (2,740.15) (5,480.42)
Prescription drugs 357.99 370.53 23.30 29.00 381.29 399.53 830.04 774.46
(426.30) (544.37) (139.25) (156.38) (448.32) (564.68) (991.40) (953.26)
NOTES: PBPM = per beneficiary per month; ED = emergency department; NF = nursing facility; SD = standard deviation; ECCP = Enhanced Care and Coordination Provider. SOURCE: RTI analysis of Medicare claims data (RTI program nc04\nhpah297).

153
Table 3-62 Medicaid and Medicare expenditures (in dollars) per beneficiary per month, Medicare-Medicaid dually eligible and Medicaid-
only residents: Means (standard deviations), Nevada, 2012
Category
Medicare-Medicaid Duals Medicaid-only
Medicare payments, PBPM in dollars, mean (SD)
Medicaid payments, PBPM in dollars, mean (SD)
Total combined Medicare and Medicaid payments, PBPM in
dollars, mean (SD)
Medicaid payments, PBPM in dollars, mean (SD)
ECCP Comparison ECCP Comparison ECCP Comparison ECCP Comparison
N (Residents) 2,229 1,246 2,229 1,246 2,229 1,246 258 182 Total expenditures 5,269.39 5,400.20 2,409.15 3,275.15 7,678.54 8,675.35 6,009.47 8,880.83
(7,942.08) (9,182.31) (4,253.08) (3,207.22) (9,019.14) (9,471.27) (6,847.83) (7,842.42) Subtotal of expenditures (No NF)
5,269.39 5,400.20 523.80 560.51 5,793.19 5,960.70 2,544.33 2,864.25 (7,942.08) (9,182.31) (3,769.40) (1,932.79) (9,257.98) (9,782.80) (5,968.25) (5,648.85)
All-cause hospitalizations 1,705.70 1,942.71 246.01 199.28 1,951.71 2,141.98 1,632.65 2,014.98 (5,892.38) (7,229.01) (2,962.06) (1,483.10) (6,756.11) (7,606.67) (5,667.27) (5,373.17)
Potentially avoidable hospitalizations
413.34 523.17 36.77 64.66 450.11 587.83 420.39 466.04 (2,319.35) (2,707.00) (394.91) (708.98) (2,420.45) (2,973.44) (3,420.35) (2,170.32)
All-cause ED visits 30.96 37.13 8.82 8.57 39.79 45.70 30.80 28.77 (133.05) (149.90) (65.92) (62.95) (160.85) (187.92) (105.57) (106.44)
Potentially avoidable ED visits
8.11 9.26 2.64 1.73 10.75 10.99 8.12 4.91 (52.80) (66.82) (31.17) (15.37) (69.09) (77.22) (39.98) (22.27)
NF Services 0.00 0.00 1,885.35 2,714.64 1,885.35 2,714.64 3,465.15 6,016.58 (0.00) (0.00) (1,914.87) (2,788.10) (1,914.87) (2,788.10) (2,613.20) (5,989.92)
Prescription drugs 365.83 345.81 29.97 45.49 395.80 391.30 880.88 820.50
(551.81) (462.97) (156.07) (162.70) (594.43) (518.37) (1,371.75) (1,159.64)
NOTES: PBPM = per beneficiary per month; ED = emergency department; NF = nursing facility; SD = standard deviation; ECCP = Enhanced Care and Coordination Provider. SOURCE: RTI analysis of Medicare claims data (RTI program nc04\nhpah297).

154
Table 3-63 Medicaid and Medicare expenditures (in dollars) per beneficiary per month, Medicare-Medicaid dually eligible and Medicaid-
only residents: Means (standard deviations), Nevada, 2013
Category
Medicare-Medicaid Duals Medicaid-only
Medicare payments, PBPM in dollars, mean (SD)
Medicaid payments, PBPM in dollars, mean (SD)
Total combined Medicare and Medicaid payments, PBPM in
dollars, mean (SD)
Medicaid payments, PBPM in dollars, mean (SD)
ECCP Comparison ECCP Comparison ECCP Comparison ECCP Comparison
N (Residents) 2,124 1,189 2,124 1,189 2,124 1,189 270 178 Total expenditures 4,486.54 4,884.86 2,118.28 3,002.79 6,604.82 7,887.65 5,862.20 8,615.85
(6,599.57) (7,537.01) (2,165.37) (3,492.95) (6,676.34) (7,768.69) (5,734.75) (11,094.98) Subtotal of expenditures (No NF)
4,486.54 4,884.86 272.21 423.53 4,758.75 5,308.40 2,099.46 3,171.41 (6,599.57) (7,537.01) (925.05) (1,947.39) (6,899.19) (7,946.85) (4,631.45) (9,723.81)
All-cause hospitalizations 1,293.06 1,553.34 81.83 127.67 1,374.90 1,681.02 1,185.28 2,099.14 (4,321.15) (5,507.24) (685.64) (1,472.34) (4,513.23) (5,758.14) (4,222.69) (9,366.90)
Potentially avoidable hospitalizations
287.06 279.82 24.61 17.01 311.67 296.83 319.42 238.18 (1,413.21) (1,518.24) (261.10) (163.39) (1,466.67) (1,549.82) (2,356.18) (1,408.80)
All-cause ED visits 34.36 32.29 17.31 6.89 51.67 39.18 41.48 120.69 (146.78) (120.98) (188.82) (50.06) (268.49) (154.14) (158.57) (1,137.68)
Potentially avoidable ED visits
10.85 7.68 6.79 1.39 17.64 9.07 6.02 9.26 (68.06) (39.73) (126.63) (12.24) (159.09) (47.68) (33.95) (85.86)
NF Services 0.00 0.00 1,846.07 2,579.26 1,846.07 2,579.26 3,762.74 5,444.44 (0.00) (0.00) (1,955.25) (2,953.61) (1,955.25) (2,953.61) (3,274.64) (5,330.86)
Prescription drugs 391.23 321.82 28.44 54.71 419.67 376.53 872.70 951.59
(539.78) (447.57) (117.47) (603.24) (557.10) (779.09) (1,404.19) (1,497.11)
NOTES: PBPM = per beneficiary per month; ED = emergency department; NF = nursing facility; SD = standard deviation; ECCP = Enhanced Care and Coordination Provider. SOURCE: RTI analysis of Medicare claims data (RTI program nc04\nhpah297).
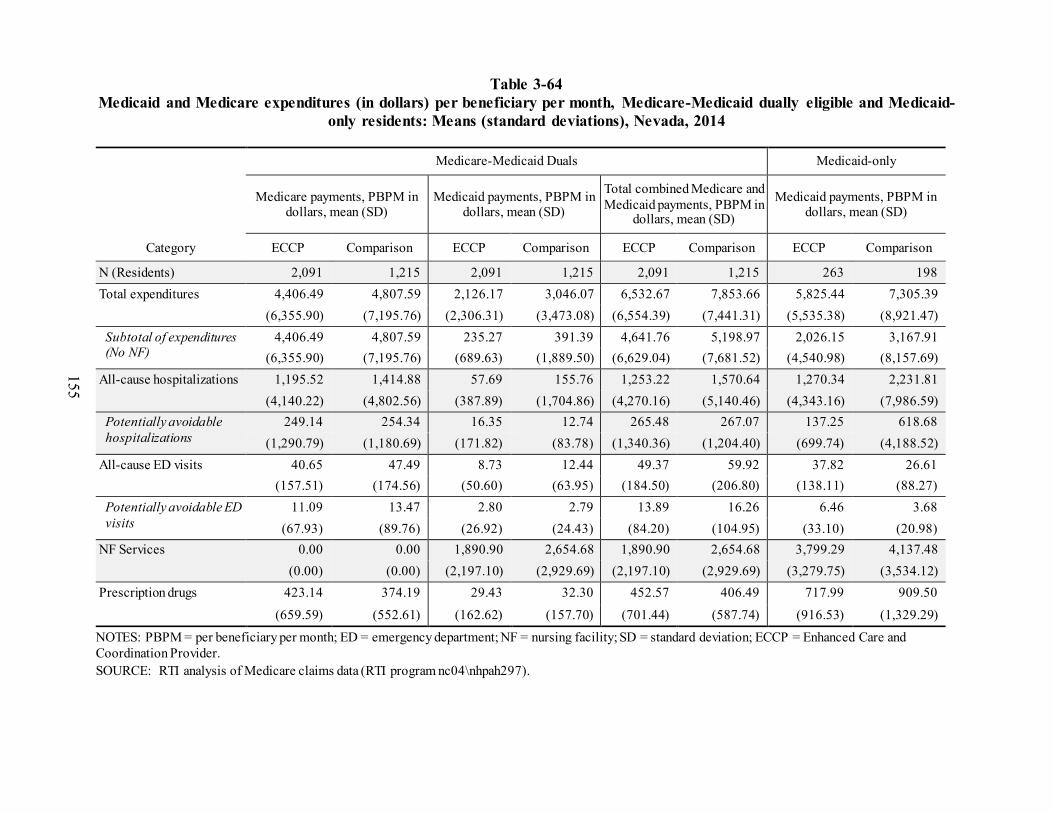
155
Table 3-64 Medicaid and Medicare expenditures (in dollars) per beneficiary per month, Medicare-Medicaid dually eligible and Medicaid-
only residents: Means (standard deviations), Nevada, 2014
Category
Medicare-Medicaid Duals Medicaid-only
Medicare payments, PBPM in dollars, mean (SD)
Medicaid payments, PBPM in dollars, mean (SD)
Total combined Medicare and Medicaid payments, PBPM in
dollars, mean (SD)
Medicaid payments, PBPM in dollars, mean (SD)
ECCP Comparison ECCP Comparison ECCP Comparison ECCP Comparison
N (Residents) 2,091 1,215 2,091 1,215 2,091 1,215 263 198 Total expenditures 4,406.49 4,807.59 2,126.17 3,046.07 6,532.67 7,853.66 5,825.44 7,305.39
(6,355.90) (7,195.76) (2,306.31) (3,473.08) (6,554.39) (7,441.31) (5,535.38) (8,921.47) Subtotal of expenditures (No NF)
4,406.49 4,807.59 235.27 391.39 4,641.76 5,198.97 2,026.15 3,167.91 (6,355.90) (7,195.76) (689.63) (1,889.50) (6,629.04) (7,681.52) (4,540.98) (8,157.69)
All-cause hospitalizations 1,195.52 1,414.88 57.69 155.76 1,253.22 1,570.64 1,270.34 2,231.81 (4,140.22) (4,802.56) (387.89) (1,704.86) (4,270.16) (5,140.46) (4,343.16) (7,986.59)
Potentially avoidable hospitalizations
249.14 254.34 16.35 12.74 265.48 267.07 137.25 618.68 (1,290.79) (1,180.69) (171.82) (83.78) (1,340.36) (1,204.40) (699.74) (4,188.52)
All-cause ED visits 40.65 47.49 8.73 12.44 49.37 59.92 37.82 26.61 (157.51) (174.56) (50.60) (63.95) (184.50) (206.80) (138.11) (88.27)
Potentially avoidable ED visits
11.09 13.47 2.80 2.79 13.89 16.26 6.46 3.68 (67.93) (89.76) (26.92) (24.43) (84.20) (104.95) (33.10) (20.98)
NF Services 0.00 0.00 1,890.90 2,654.68 1,890.90 2,654.68 3,799.29 4,137.48 (0.00) (0.00) (2,197.10) (2,929.69) (2,197.10) (2,929.69) (3,279.75) (3,534.12)
Prescription drugs 423.14 374.19 29.43 32.30 452.57 406.49 717.99 909.50
(659.59) (552.61) (162.62) (157.70) (701.44) (587.74) (916.53) (1,329.29)
NOTES: PBPM = per beneficiary per month; ED = emergency department; NF = nursing facility; SD = standard deviation; ECCP = Enhanced Care and Coordination Provider. SOURCE: RTI analysis of Medicare claims data (RTI program nc04\nhpah297).

156
Table 3-65 Medicaid and Medicare expenditures (in dollars) per beneficiary per month, Medicare-Medicaid dually eligible and Medicaid-
only residents: Means (standard deviations), Nevada, 2015
Category
Medicare-Medicaid Duals Medicaid-only
Medicare payments, PBPM in dollars, mean (SD)
Medicaid payments, PBPM in dollars, mean (SD)
Total combined Medicare and Medicaid payments, PBPM in
dollars, mean (SD)
Medicaid payments, PBPM in dollars, mean (SD)
ECCP Comparison ECCP Comparison ECCP Comparison ECCP Comparison
N (Residents) 2,067 1,121 2,067 1,121 2,067 1,121 316 185 Total expenditures 4,368.12 5,483.52 2,337.85 3,004.44 6,705.97 8,487.96 6,081.54 7,352.55
(6,347.95) (9,773.00) (3,986.47) (3,446.22) (7,446.12) (9,713.71) (9,991.19) (7,683.92) Subtotal of expenditures (No NF)
4,368.12 5,483.52 281.54 319.00 4,649.66 5,802.53 2,497.43 2,869.49 (6,347.95) (9,773.00) (3,260.06) (2,068.40) (7,423.73) (10,135.29) (9,179.65) (6,924.42)
All-cause hospitalizations 1,208.59 2,223.16 132.93 150.76 1,341.52 2,373.91 1,687.93 1,690.03 (3,905.99) (7,635.00) (3,219.88) (1,985.62) (5,100.76) (7,916.40) (9,043.39) (5,141.84)
Potentially avoidable hospitalizations
252.14 345.60 12.77 67.91 264.91 413.51 198.99 70.58 (1,478.12) (2,192.86) (122.72) (1,922.55) (1,529.15) (2,920.25) (2,326.38) (433.33)
All-cause ED visits 51.93 44.66 12.48 9.74 64.41 54.40 94.99 23.96 (246.42) (168.61) (94.52) (55.01) (297.77) (203.05) (391.87) (81.54)
Potentially avoidable ED visits
13.68 12.79 2.44 3.87 16.13 16.66 8.38 5.33 (78.30) (87.11) (17.97) (43.56) (87.49) (117.53) (51.69) (49.45)
NF Services 0.00 0.00 2,056.31 2,685.44 2,056.31 2,685.44 3,584.11 4,483.06 (0.00) (0.00) (2,289.43) (2,819.48) (2,289.43) (2,819.48) (3,115.42) (3,769.75)
Prescription drugs 452.47 391.29 17.71 24.70 470.18 415.99 714.52 1,155.49
(733.12) (563.84) (95.36) (111.29) (735.99) (576.32) (1,002.40) (3,392.00)
NOTES: PBPM = per beneficiary per month; ED = emergency department; NF = nursing facility; SD = standard deviation; ECCP = Enhanced Care and Coordination Provider. SOURCE: RTI analysis of Medicare claims data (RTI program nc04\nhpah297).

157
Table 3-66 ECCP effect on MDS-based quality measures (percent of observed quarters per resident
per year with event) during intervention period 2014–2016, Nevada
MDS-based quality measures
Mean, 2014-2016
(percent)
Effect (percenta
ge points) 90% CI 80% CI p-value
Relative effect (% of mean)
Decline in ADLs 16.9 –0.1 –2.6 2.4 –2.0 1.8 0.938 –0.6 Antipsychotic medication use 18.9 5.2 1.9 8.5 2.6 7.8 0.011 27.5
NOTE: The 2014–2016 mean is the unadjusted mean across all ECCP and comparison residents during the 3-year intervention period, weighted by the number of residents in each year. Bold text indicates statistical significance at the 0.10 level. Standard statistical practice is to use confidence intervals of 90% or higher; 80% confidence intervals are provided here for comparison purposes only. ADL = Activities of Daily Living; ECCP = Enhanced Care and Coordination Provider; MDS = Minimum Data Set. SOURCE: RTI analysis of MDS assessments data (RTI program jw20; annual_2016\qm).
Table 3-67 ECCP effect on MDS-based quality measures (percent of observed quarters per resident
with event), 2016, Nevada
MDS-based quality measures
Mean, 2016
(percent)
Effect (percentage
points) 90% CI 80% CI p-value
Relative effect (% of mean)
One or more falls with injury 10.7 4.6 –0.2 9.4 0.9 8.3 0.113 43.0 Self-report moderate to severe pain 11.0 0.9 –5.8 7.6 –4.4 6.2 0.834 8.2 Pressure ulcers Stage II or higher 6.3 –0.1 –1.9 1.7 –1.5 1.3 0.922 –1.6 Urinary tract infection 4.0 –2.5 –5.3 0.3 –4.7 –0.3 0.142 –63.2 Catheter inserted and left in bladder 6.1 –0.2 –3.7 3.3 –2.9 2.5 0.934 –3.3 Decline in ADLs 17.0 –1.1 –4.1 1.9 –3.4 1.2 0.546 –6.5 Antipsychotic medication use 18.7 8.2 1.9 14.5 3.3 13.1 0.030 43.9 Depressive symptoms 1.9 –1.0 –3.1 1.1 –2.7 0.7 0.442 –52.1
NOTE: The 2016 mean is the unadjusted mean across all ECCP and comparison residents in that year. Bold text indicates statistical significance at the 0.10 level. Standard statistical practice is to use confidence intervals of 90% or higher; 80% confidence intervals are provided here for comparison purposes only. ADL = Activities of Daily Living; ECCP = Enhanced Care and Coordination Provider; MDS = Minimum Data Set. SOURCE: RTI analysis of MDS assessments data (RTI program jw20; annual_2016\qm).

158
3.5.3 Implementation
Implementation Experience ATOP rolled out the Initiative in participating facilities in three cohorts from February to
June 2013. RNs and APRNs began visiting each of the five facilities in their pods, but much of their focus during the first year was on inputting resident data into ATOP’s Resident Registry. The Registry was a web-based repository of enrollees’ complete clinical information that ATOP staff used for real-time resident management. ATOP clinicians eventually used the Registry for targeted queries, to review polypharmacy and antipsychotic medications, identify high-risk residents, and produce dashboard and CMS reports. ATOP’s Green-Yellow-Red algorithm, a decision tool designed for ATOP staff to identify changes in condition, was also in the Resident Registry.
Training began with a focus on the Stop and Watch, SBAR, and the Care Paths and the introduction of all other INTERACT tools in Initiative Year 1. Promotion of the INTERACT Transition Tool in facilities and hospitals began in Initiative Year 2. Throughout the Initiative, ATOP also responded to individual facility requests for training to improve buy-in. Most facility-requested topics related to management of conditions that often led to hospitalizations from their facility (e.g., sepsis, dehydration, chronic obstructive pulmonary disease, congestive heart failure, etc.). Other topics included survey activities (e.g., documentation, passing medications). Training occurred in formal in-services and one-on-one trainings in facilities, or in periodic collaborative meetings with all participating facilities and ATOP clinicians, conducted by a partner trainer.
While ATOP introduced EOL topics in Initiative Year 1, EOL issues became a major focus in Initiative Years 2 and 3 after the Nevada Physician Orders for Life-Sustaining Treatment (POLST) was approved by the Nevada legislature in 2013. Previous to the POLST gaining legal status in the state, facilities either used facility or corporate-specific advance directive forms or they did not document EOL preferences. After POLST became legal, ATOP leadership promoted it in hospitals, hospices, and to physicians. Facilities were thankful for the training, but implementation was mixed. By the end of the Initiative, about 60 percent of the facilities reported that the POLST was used routinely.
Root cause analyses of all hospitalizations were another key activity of the ATOP clinicians who produced reports for facility leadership showing how the hospitalization may have been avoided by managing the resident’s condition earlier. Facilities generally found these reports helpful as they pointed to areas where their staff would benefit from additional training. A few facilities adopted the INTERACT QI Tool and root cause analyses themselves; others indicated they did not have staff time for this activity. Facilities had similar mixed reactions to ATOP’s quarterly hospitalization metrics. These reports showed hospitalizations by condition, physician, time of day and day of week, and frequency of changes in condition.
The ATOP Initiative experienced several implementation barriers discussed in the following section (e.g., high ATOP nurse turnover, mixed engagement of facilities). Other notable barriers included the lack of physician buy-in. After early concerns that ATOP APRNs might charge for their services were dispelled, physicians continued to show little understanding or buy-in. This was partly because of a lack of outreach to physicians and because hospitalists,

159
who had a large presence in the state and were often incentivized for hospitalizations, were not motivated to reduce hospitalizations. In the beginning, some physicians would not allow ATOP nurses to be involved with their patients. Later, a few physicians allowed ATOP APRNs to write orders, but in the final interviews with DONs, many reported that most physicians were not aware of the ATOP Initiative.
Figure 3-15 summarizes key findings from the RTI Nursing Facility Administrator Survey for ATOP, showing support for the ECCP by presenting longitudinal data from 2013–2016 on whether facility administrators found the training and support provided by the ECCP and its nurses to be sufficient and helpful during the Initiative. The longitudinal data on two major implementation barriers—staff resistance to change and staff turnover—are also included, as well as data on physician buy-in. Finally, the chart includes 2016 feedback from facility leadership on the effectiveness of the Initiative in reducing avoidable hospitalizations and the likelihood of sustainability of the main model components. In general, administrator feedback was more positive than interviews with DONs and nursing staff who have a deeper understanding of clinical and educational issues.
Facility Staff Engagement with Initiative Components In March 2016, CMS sent a programmatic assistance letter to the ECCP outlining areas in
which improvement could be achieved in the ATOP Initiative. Facility engagement and implementation were the overarching issues, and the ECCP’s response included practical steps for improvement. However, the fundamental challenge remained because of the model design. The need for clinicians to travel long distances among facilities resulted in high turnover of ATOP staff, which, in turn, led to an inconsistent presence and provision of services that impacted facility engagement and implementation. In the final year, only 3 APRNs and 9.5 RNs, with highly variable experience, were working to sustain the Initiative in 24 facilities. Facilities with sufficient RNs on staff were more interested in having an ATOP APRN and were frustrated by the rotating schedule of the APRN, who visited as many as 10 facilities.
Since the beginning of the Initiative, there was a consistent pattern of engagement of facilities involved in ATOP with about one third highly engaged, one third somewhat engaged/neutral, and one third that were consistently unengaged with the Initiative. Although the level of commitment of the highly engaged and somewhat engaged facilities ebbed and flowed over the years, the unengaged facilities remained static from the beginning. Engaged facility staff naturally reported more success with adopting and implementing ATOP’s interventions and more frustration with ATOP clinician turnover. Facility staff in unengaged facilities discussed more struggles; by the final year, some unengaged facility staff did not have a good understanding of ATOP’s purpose, felt it was not needed, and reported less interaction with ATOP nurses.

160
Figure 3-15 RTI Nursing Facility Survey results, 2013–2016
NOTE: Number of respondents varied by survey wave and question. ECCP = Enhanced Care and Coordination Provider; INTERACT = Interventions to Reduce Acute Care Transfers; APRN = advanced practice registered nurse; RN = registered nurse; SBAR = Situation, Background, Assessment, Recommendation; ATOP = Admissions and Transitions Optimization Program. SOURCE: RTI analysis of waves 1 through 4 of the RTI Nursing Facility Administrator Survey (data collected August 2013 to December of 2016).

161
Table 3-68 depicts the facilities’ interest in each of the ATOP components, gleaned from final year interviews (N=22). It is important to note that this interest in ATOP Initiative components signaled perceived or potential value by facility staff, even if the facilities did not implement the components. Despite frustration with not having more access to ATOP clinicians, most facilities were highly interested in participating with the ATOP nurses and with the education and training component of the Initiative (68%). Facilities also noted the value of documenting changes in condition and improvement in communicating with providers using the INTERACT Stop and Watch and SBAR (59%). More than half of facilities expressed high or moderate interest in receiving ATOP’s EOL training and support for QI activities, including root cause analyses. Facility leadership indicated the least interest in care transitions and medication review activities. This is not surprising because these were not areas that ATOP emphasized in the final year of the Initiative; facilities believed their own procedures were sufficient for these activities.
Table 3-68 Facility engagement with Initiative components, ATOP, 2016
NOTE: 22 facilities evaluated SOURCE: RTI evaluation of facility engagement using site visit and telephone interview data (data collected 2016)
Staff Buy-in Corporate, facility leadership, and physician support of the Initiative were all key to
facility staff buy-in of ATOP. Facilities with unengaged leadership had unengaged floor staff. In the early years, some facility staff, including leadership, believed that the ATOP clinicians were “spies” from a state bureau intent on finding fault, rather than support for facility staff. The fact that ATOP nurses were heavily focused on data input into the Registry from facility medical records during the first year did not help matters. Leadership turnover, particularly of DONs, and high rates of certified nursing assistant and nurse turnover made it difficult for ATOP clinicians
162
to establish trust and integrate into some facilities. In facilities with high staff turnover, ATOP nurses were repeatedly introducing and training staff in ATOP’s goals and tools, rather than focusing on advancing the clinical and educational components.
Facilities that recognized the benefit of the Initiative and appreciated the help ATOP nurses could provide, created an easier environment for nurses to become part of the facility’s team. ATOP nurses answered call lights, fed residents, answered telephones, and anything else the facility viewed as beneficial, to obtain buy-in. Facility staff came to rely on ATOP nurses with respected skills, who had a consistent presence in the facility. In facilities with minimal facility staff and ATOP staff turnover, there was more understanding and successful implementation of the Initiative.
Beneficiary Enrollment and Buy-in Residents were enrolled in ATOP unless they explicitly opted out; believing that access
to another clinician would be beneficial, very few residents opted out. There appeared to be positive relationships between ATOP staff and residents. In facilities in which the ATOP nurses visited frequently, staff noted that residents experiencing frequent changes in condition or acute episodes interacted directly with ATOP nurses and knew them personally. Those personal connections did not always extend to awareness of the Initiative, and residents and their families often were not aware of the overall intent of the Initiative. Facility staff noted families’ lack of understanding or divided interests when it came to hospitalizing their loved ones. ATOP nurses were often seen as independent third parties who were trusted by families and residents. According to facility staff, ATOP nurses could discuss the details of how interventions play out in the hospital when one has a full code, without the resident or family member thinking that the ATOP nurses were trying to influence them in any way. Many interactions with families pertained to EOL discussions and happened ad hoc or in formal care conferences. Facility staff reported that families appreciated the time ECCP nurses took to explain advance directives.
Outcomes and Successes Facilities that were engaged with the
Initiative explained that they had undergone a change in culture. They no longer automatically transferred residents when they noticed a change in condition. They understood that earlier recognition and management of changes in condition avoided unnecessary hospitalizations, which were often upsetting to residents and families. Engaged facilities pointed to increased condition management skills from ATOP trainings and by using INTERACT Care Paths. These facilities noted the positive impact ATOP training had on facility staff empowerment with nurses who could provide all pertinent information to physicians via the SBAR when discussing resident care with a physician. Facilities and ATOP leadership pointed to decreased hospitalizations by providing numerous examples of individual cases and hospitalization rates collected by both facilities, corporate owners, and ATOP.

163
Best Practices, Sustainability, and Lessons Learned ATOP leadership and some facilities
noted the following steps would have improved the initial rollout: (1) increased efforts to obtain physician buy-in, particularly with hospitalists, prior to the launch of the Initiative through increased physician-to-physician outreach; (2) addressing facility resistance and concerns openly through one-on-one meetings; (3) hiring data entry staff to input the initial Registry enrollee data; and (4) aligning nursing staff personality/-skills/licensure with needs, location, and size of each facility. In the final year, ATOP leadership revisited ATOP’s design, concluding that the number of facilities, particularly the remotely located facilities, was too high and the number of clinicians insufficient. Less clinician focus on data collection and more on clinical care and training in fewer facilities would have allowed for more substantial presence and increased effectiveness. Placement of APRNs would have been more valued by facilities.
Facility leadership, noting the time it takes to effectuate culture change, also concluded that ATOP would have had a greater impact if its clinicians had more of a facility presence. DONs at engaged facilities noted the sustainability of certain tools (Stop and Watch and SBAR), saying that many of the tools were now imbedded in their daily routine. The following DON’s statement in 2016 was a sentiment expressed by many facility leaders when asked about ATOP’s overall effects: “… it’s allowed us to think differently about how we are looking at hospital transfers and making sure we’re doing everything we can, to be proactive. I think the mindset would continue. More conversations, with families even, about what we can do here and why going back out is not the best option. I think the culture change would continue.”
3.5.4 Summary
The ATOP model utilized APRNs and RNs to provide clinical care, education and training to reduce unnecessary hospitalizations, increase EOL care planning, and enhance QI activities. Implementation varied across facilities, with some more engaged than others throughout the Initiative years. The quantitative analysis demonstrates mixed results of the Initiative’s impact, with the largest effects generally seen in 2015. Despite the uneven implementation, there was a statistically significant decrease in Medicare expenditures and hospitalizations, mostly in the last 2 years of the Initiative.
There are several factors that may have contributed to the positive results of the Initiative in Nevada. While the ATOP model, with its rotation of nurses among several nursing facilities, did not provide a consistent presence in most facilities and consequently an uneven engagement in the Initiative, the ECCP provided substantial trainings in management of conditions associated with avoidable hospitalizations (e.g., dehydration, sepsis, etc.), which were often tailored to the needs of each facility. Although approximately one-third of the participating facilities were not engaged with most of ATOP’s activities throughout the Initiative, nearly all participating facilities appreciated the ATOP trainings, which often provided required continuing education credits. An additional contributing factor in the reduction in avoidable hospitalizations was the

164
local hospitals’ increased scrutiny of all hospital readmissions from NFs. From 2014, the evaluation team heard reports of hospital staff conducting monthly or quarterly meetings with DONs or nursing facility administrators (NFAs) to review readmissions of both the short-stay and long-stay residents. Repeated readmissions for similar conditions were highlighted and referred to the nursing facility’s QI or QAPI program. By the end of the Initiative, facilities that appeared to be the most engaged with the Initiative explained that they had undergone a culture change—they were identifying changes in conditions that could lead to an unnecessary hospitalization and managing them earlier in the facility—rather than immediately sending residents to the hospital at the first sign of a change in condition.
This culture change is reflected in the decrease in the probability of any hospitalization, both overall and potentially avoidable, but it does not explain the increase in the probability of an ED visit. A possible reason for an increase in ED visits could be related to the uneven condition management skills of nursing facility staff. While nursing staff were trained on early recognition of certain conditions leading to unnecessary hospitalizations, facilities with few RNs on staff often lacked the capabilities necessary to provide care in the facility. For example, the evaluation team heard reports from facility staff that a resident might be transferred to the ED for an IV insertion and then returned to the facility for management of the resident’s dehydration. Training on IV insertion was identified as a need for the new Payment Reform Initiative to begin in October 2016; as a result, trainings in IV insertion were being planned for LPNs in ATOP facilities at the end of 2016 and early 2017. Similarly, residents in need of nasogastric or feeding tubes might be transferred temporarily to hospitals for insertion or removal of these devices, but not admitted.
Another possible reason for an increase in ED visits despite the decrease in hospitalizations could be related to the engagement of physicians, particularly of hospitalists, who provided primary care to nursing facility residents. Physicians and physician extenders in many of the ATOP facilities were not engaged or incentivized, and some were not even aware of the Initiative by 2016. Physicians, uncertain of the skills of NF clinicians, would likely order a resident to be transferred rather than risking a liability.
Across most measures, the largest effects of the Initiative were in 2015. The ECCP struggled with turnover and retention of its clinical staff and its presence in the facilities throughout the Initiative years. Rather than the 5 APRNs and 15.5 RNs in the model, the ECCP in 2016 was operating with only 3 APRNs and 9.5 FTE RNs providing support to 24 facilities. Facility engagement was low, prompting a Programmatic Assistance Letter from CMS and Corrective Action Plan. These reasons help explain the weakening of ECCP effects on reducing hospitalizations and related expenditures in 2016 as compared to 2015.
Despite ATOP’s efforts to improve quality, in general these efforts do not appear to have had a statistically significant impact on MDS-based quality measures. Over the intervention period, there was a statistically significant increase in the ECCP group regarding antipsychotic medication use in residents without a diagnosis who are approved for these medications, and a reduction in the comparison group. In the early years of the Initiative, the ECCP attempted to provide trainings to facilities on the need for appropriate use of antipsychotic medications. APRNs reviewed medication use with facilities and provided related trainings on polypharmacy and antipsychotic medications use. However, facilities generally noted that (1) their pharmacy

165
consultant conducted these reviews; (2) they were aware of CMS’ efforts to reduce the inappropriate use of antipsychotic medications which were often the focus of QAPI initiatives, and (3) they thought that ATOP efforts on the subject were not needed.
The overall effect estimates for the Initiative in Nevada may be unreliable due to the lack of sufficient numbers of facilities in the state to create a matched comparison group.

166
3.6 New York
3.6.1 New York-Reducing Avoidable Hospitalizations (NY-RAH) Project of the Greater New York Hospital Association Foundation
The Greater New York’s Hospital Association Foundation’s New York Reducing Avoidable Hospitalizations model launched across all 30 participating nursing facilities between February and September 2013, with the goals of reducing avoidable hospitalizations among long-stay NF residents to improve the health care, health outcomes and quality of life for nursing facility residents, to reduce health care costs, and improve communications and transition of care. As indicated in Table 3-69, the NY-RAH model used RNs to deliver education and training to nursing home leadership and staff on the following topics: recognition of acute changes of condition (ACOCs), improving staff communication, QI, medication management, hospital communication, transitions in care, and advance care planning tools. There was evidence that NY-RAH was associated with reductions in hospitalizations, weaker evidence for reductions in ED visits, and no evidence of reductions in total Medicare spending.
Table 3-69 NY-RAH model description
Structure
Organization type Nonprofit foundation, affiliate of hospital association Partners and their roles • Icahn School of Medicine at Mount Sinai: ECCP clinical director position,
lead for recruiting, hiring, training, and management of registered nurse care coordinator (RNCC) component, ECCP palliative care director/medical director position, lead for EOL training
• MedAllies—implementation of Direct Messaging34 • Dr. Patricia Bomba—MOLST and e-MOLST consultation35
Number of facilities 29 all urban, 14 for-profit, 14 nonprofit, 1 government NF attrition 30 facilities started in Initiative Year 1. In fall 2014, 1 of the 30 participating
facilities closed. Facility-based staff FTE RNCCs: 25 FTE (9 RNCCs were assigned to 1 facility each, 8 RNCCs were
split between 2 facilities each, and 4 facilities had 2 RNCCs) FTE management: 1 clinical director, 2 clinical nurse managers, 1 RNCC coach
State APRN practice arrangements affecting implementation
N/A (education-only model)
(continued)
34 MedAllies was the technology contractor during Initiative Years 2, 3, and 4. The Continuum of Care
Improvement Through Information-New York (CCITI-NY) was the technology in Initiative Year 1. 35 Dr. Bomba was a consultant during Initiative Years 2 and 3.

167
Table 3-69 (continued) NY-RAH model description
Use of registered or higher-level nurses APRN N/A RN Yes; RNCCs were placed in each participating facility (some RNCCs cover one
facility, some two facilities, and some facilities have 2 RNCCs) to provide staff education and act in a consultant role without providing clinical care
Role of nurse Clinical care No Writing orders No Education Yes Weekly schedule RNCCs worked in their assigned facilities full time 5-days a week (9 a.m. to 5
p.m.). A few larger facilities had two full-time RNCCs. For some smaller facilities or facilities with low enrollment, assigned RNCCs divided their work week between two facilities.
Medication management Polypharmacy reduction No Antipsychotics reduction No Medication review Yes; introduced medication reference cards and medication reconciliation
guidelines to all facilities.
Tools promoted by ECCPs to improve communication and identification of changes in resident condition (INTERACT and others)
SBAR Yes; RNCCs provided training and support for licensed nursing staff on SBAR. Both paper and electronic depending on facility. Facilities were permitted to adopt different SBAR versions.
Stop and Watch Yes; RNCCs offered training to CNAs via in-services, orientation, or refresher trainings in all facilities. Both paper and electronic forms, depending on the facility.
Transfer forms Yes; introduced Interact Transfer Form and transfer checklist. QI tool Yes; initially required use of NY-RAH specific QI tool.36 In the final Initiative
year, facilities were allowed to choose their own approved QI tool. Many chose the INTERACT QI tool.
Care Paths No AMDA Know-It-All Before You Call cards
Yes
(continued)
36 The NY-RAH QI tool includes elements from both the Interact QI tool and the AMDA Root Cause Analysis
Guidelines.

168
Table 3-69 (continued) NY-RAH model description
End-of-life planning Advance directives Yes; MOLST37 and increasing quarterly advance directive discussions Staff training/ discussion Yes; led by ECCP medical director
Optional features specific to NY-RAH Direct Messaging MedAllies—The electronic transfer of secure patient discharge summary
information from the hospital to the nursing facility Note: AMDA = American Medical Directors Association; APRN = advanced practice registered nurse; CNA = certified nursing assistant; ECCP = Enhanced Care and Coordination Provider; EOL = end of life; FTE = full-time equivalent; INTERACT = Interventions to Reduce Acute Care Transfers; MOLST = Medical Orders for Life-Sustaining Treatment; NA = not applicable; NF = nursing facility;; NY-RAH: New York Reducing Avoidable Hospitalizations Project of the Greater New York Hospital Association Foundation; RN = registered nurse; SBAR = Situation, Background, Assessment, Recommendation; QI = quality improvement.
3.6.2 Utilization, Expenditure, and Quality
Utilization. The ECCP intervention was associated with reductions in the probability of hospitalizations and potentially avoidable hospitalizations. The intervention period (2014–2016) per resident, per year effect estimate was a 2.8-percentage point lower probability of an all-cause hospitalization and a 1.3-percentage point lower probability of a potentially avoidable hospitalization. These effect estimates were both statistically significant (at the 0.10 significance level). Given the overall probabilities of hospitalization and potentially avoidable hospitalization of 27.9 percent and 10.6 percent, respectively, these effects represent reductions of 10.0 percent and 12.5 percent, respectively (Table 3-70). For the year-specific estimates of the impact of the intervention on the probability of all-cause hospitalization, we consistently found around a 2–3-percentage point lower probability, with slightly stronger effects over time (Figure 3-16). Some of these estimates were statistically significant, including for 2016 (Table 3-71). For the probability of potentially avoidable hospitalizations, none of the year-specific estimates were statistically significant, although all estimates had negative signs, indicating a tendency toward reductions (Figure 3-16). The results also indicate that the ECCP intervention was associated with reductions in the count of hospitalizations and potentially avoidable hospitalizations. The intervention period annual effect estimates of the intervention were 0.049 fewer all-cause hospitalizations per resident per year and a 0.024 fewer potentially
37 The ECCP also tracked and worked to increase the percentage of residents with a health care proxy, and do-not- resuscitate, intube, or hospitalize orders. These orders are included as part of the MOLST form.
KEY FINDINGS
In New York, there were moderately sized, consistent,and statistically significant reductions in all-causehospitalizations and in potentially avoidablehospitalizations.
Some evidence for reductions in all-cause ED visits andpotentially avoidable ED visits
No evidence for reductions in total Medicare spendingand weak evidence for reductions in hospitalization andED-related spending
Some evidence for improvements in MDS-based qualitymeasures

169
avoidable hospitalizations (Table 3-72) per resident per year. The latter finding was statistically significant and the former was borderline significant.
There is some evidence for reductions in all-cause ED visits and potentially avoidable ED visits. The estimates for the intervention period annual effect of the intervention on both the probabilities and the counts of these events had negative signs, although none were statistically significant (Table 3-70, Table 3-72). This might reflect the fact that there were fewer pure ED visits than hospitalizations, so it is more difficult to attain statistical significance. Nearly all the year-specific effects on the two types of ED utilization measures had negative signs, indicating reductions; two of these reductions were statistically significant, in the probability of a potentially avoidable ED visit and in the count of all-cause ED visits, both in 2016 (Figure 3-16, Table 3-71, Table 3-73).
Medicare Expenditures. There is no evidence that the ECCP intervention was associated with reduced total Medicare expenditures. While the direction of the intervention period annual effect on total Medicare expenditures was negative, suggesting reductions, two of the three year-specific effects were increases in expenditures (Table 3-74, Table 3-75, Figure 3-17). None of these estimated effects were statistically significant. There is weak evidence for reductions in expenditures for specific components of total Medicare expenditures. The estimates for the intervention period effects on expenditures for all-cause hospitalizations, potentially avoidable hospitalizations, all-cause ED visits, and potentially avoidable ED visits, all had negative signs, suggesting reductions; however, none of these estimates were statistically significant. There is a similar pattern in the year-specific effect estimates for these expenditure measures.
MDS-Based Quality. The intervention period annual effects for decline in ADLs and use of antipsychotic medications indicated a decline and an improvement in quality, respectively, but were small in magnitude and not statistically significant (Table 3-76). Six of the eight year-specific estimates for the effect of the ECCP intervention on MDS-based quality measures in 2016 had negative signs, indicating a tendency toward quality improvement. The intervention was associated with a statistically significant 1.0-percentage point reduction in self-reported moderate to severe pain, and a 1.2-percentage point reduction in whether a catheter was inserted and left in bladder (Table 3-77).

170
Table 3-70 ECCP effect on probability of any utilization per resident per year during intervention
period, 2014–2016, New York
Probability of having at least one:
Mean, 2014-2016 (percent)
Effect (percentage
points) 90% CI 80% CI p-value
Relative effect (% of mean)
All-cause hospitalization 27.9 –2.8 –4.8 –0.7 –4.4 –1.2 0.027 –10.0Potentially avoidable hospitalization
10.6 –1.3 –2.6 –0.1 –2.3 –0.3 0.085 –12.5
All-cause ED visit 15.0 –0.8 –2.6 1.1 –2.2 0.7 0.513 –5.0Potentially avoidable ED visit 5.0 –0.8 –1.6 0.1 –1.4 –0.1 0.145 –15.0
NOTE: The 2014–2016 mean is the unadjusted mean across all ECCP and comparison residents during the 3-year intervention period, weighted by the number of residents in each year. Bold text indicates statistical significance at the 0.10 level. Standard statistical practice is to use confidence intervals of 90% or higher; 80% confidence intervals are provided here for comparison purposes only. ECCP = Enhanced Care and Coordination Provider; ED = Emergency Department. SOURCE: RTI analysis of Medicare claims data (RTI program ms06; annual_2016\ms01_xtgee).
Table 3-71 ECCP effect on probability of any utilization per resident per year, 2016, New York
Probability of having at least one:
Mean, 2016
(percent)
Effect (percentage
points) 90% CI 80% CI p-value
Relative effect (% of mean)
All-cause hospitalization 27.4 –3.3 –5.8 –0.8 –5.2 –1.4 0.027 –12.0Potentially avoidable hospitalization 10.2 –1.0 –2.4 0.4 –2.1 0.0 0.217 –10.1All-cause ED visit 15.1 –1.7 –3.9 0.5 –3.4 0.0 0.198 –11.3Potentially avoidable ED visit 5.3 –1.1 –2.1 –0.1 –1.9 –0.4 0.059 –20.9
NOTE: The 2016 mean is the unadjusted mean across all ECCP and comparison residents in that year. Bold text indicates statistical significance at the 0.10 level. Standard statistical practice is to use confidence intervals of 90% or higher; 80% confidence intervals are provided here for comparison purposes only. ECCP = Enhanced Care and Coordination Provider; ED = Emergency Department. SOURCE: RTI analysis of Medicare claims data (RTI program ms06; annual_2016\ms01_xtgee).

171
Figure 3-16 ECCP effect on probability of any utilization per resident per year, New York
NOTE: Dots indicate year-specific effects separately estimated for 2014, 2015, and 2016; triangles indicate intervention period (2014–2016) annual effects; vertical bars are 90% confidence intervals. Detailed numbers underlying the graphs are provided in Appendix H. ECCP = Enhanced Care and Coordination Provider; ED = Emergency Department. SOURCE: RTI analysis of Medicare claims data (RTI program ms06; annual_2016\ms01_xtgee).

172
Table 3-72 ECCP effect on count of utilization per resident per year during intervention period, 2014–
2016, New York
Count of events per resident
Mean, 2014-2016 Effect 90% CI 80% CI p-value
Relative effect (% of mean)
All-cause hospitalizations 0.426 –0.049 –0.098 0.001 –0.087 –0.010 0.108 –11.4 Potentially avoidable hospitalizations 0.126 –0.024 –0.042 –0.006 –0.038 –0.010 0.026 –19.4 All-cause ED visits 0.209 –0.026 –0.058 0.006 –0.051 –0.001 0.178 –12.4 Potentially avoidable ED visits 0.056 –0.008 –0.019 0.003 –0.016 0.000 0.211 –14.4
NOTE: The 2014–2016 mean is the unadjusted mean across all ECCP and comparison residents during the 3-year intervention period, weighted by the number of residents in each year. Bold text indicates statistical significance at the 0.10 level. Standard statistical practice is to use confidence intervals of 90% or higher; 80% confidence intervals are provided here for comparison purposes only. ECCP = Enhanced Care and Coordination Provider; ED = Emergency Department. SOURCE: RTI analysis of Medicare claims data (RTI program ms07; annual_2016\ms03_xtgee).
Table 3-73 ECCP effect on count of utilization per resident per year, 2016, New York
Count of events per resident Mean, 2016 Effect 90% CI 80% CI p-value
Relative effect (% of mean)
All-cause hospitalizations 0.422 –0.046 –0.098 0.005 –0.087 –0.006 0.139 –11.0 Potentially avoidable hospitalizations 0.121 –0.017 –0.037 0.003 –0.032 –0.001 0.174 –13.7 All-cause ED visits 0.212 –0.039 –0.073 –0.005 –0.066 –0.012 0.063 –18.4 Potentially avoidable ED visits 0.059 –0.011 –0.023 0.000 –0.020 –0.002 0.107 –19.2
NOTE: The 2016 mean is the unadjusted mean across all ECCP and comparison residents in that year. Bold text indicates statistical significance at the 0.10 level. Standard statistical practice is to use confidence intervals of 90% or higher; 80% confidence intervals are provided here for comparison purposes only. ECCP = Enhanced Care and Coordination Provider; ED = Emergency Department. SOURCE: RTI analysis of Medicare claims data (RTI program ms07; annual_2016\ms03_xtgee).

173
Table 3-74 ECCP effect on Medicare expenditures per resident per year during intervention period,
2014–2016, New York
Medicare expenditure
Mean, 2014-2016 ($) Effect ($) 90% CI 80% CI p-value
Relative effect (% of mean)
Total 28,561 –556 –3,127 2,014 –2,559 1,447 0.722 –1.9 All-cause hospitalizations 8,414 –614 –1,514 286 –1,315 87 0.261 –7.3 Potentially avoidable hospitalizations 1,837 –245 –515 26 –456 –34 0.137 –13.3 All-cause ED visits 124 –11 –28 7 –24 3 0.309 –8.7 Potentially avoidable ED visits 37 –4 –11 3 –9 2 0.389 –9.8
NOTE: The 2014–2016 mean is the unadjusted mean across all ECCP and comparison residents during the 3-year intervention period, weighted by the number of residents in each year. Bold text indicates statistical significance at the 0.10 level. Standard statistical practice is to use confidence intervals of 90% or higher; 80% confidence intervals are provided here for comparison purposes only. ECCP = Enhanced Care and Coordination Provider; ED = Emergency Department. SOURCE: RTI analysis of Medicare claims data (RTI program ms08; annual_2016\ms04_glm and ms04_tpm).
Table 3-75 ECCP effect on Medicare expenditures per resident, 2016, New York
Medicare expenditure
Mean, 2016 ($)
Effect ($) 90% CI 80% CI p-value
Relative effect (% of mean)
Total 29,784 573 –2,517 3,662 –1,835 2,980 0.760 1.9 All-cause hospitalizations 8,668 –247 –1,386 891 –1,134 640 0.721 –2.9 Potentially avoidable hospitalizations
1,834 –58 –392 275 –318 201 0.773 –3.2
All-cause ED visits 132 –5 –26 16 –21 12 0.707 –3.7 Potentially avoidable ED visits 40 –2 –11 7 –9 5 0.700 –5.1
NOTE: The 2016 mean is the unadjusted mean across all ECCP and comparison residents in that year. Bold text indicates statistical significance at the 0.10 level. Standard statistical practice is to use confidence intervals of 90% or higher; 80% confidence intervals are provided here for comparison purposes only. ECCP = Enhanced Care and Coordination Provider; ED = Emergency Department. SOURCE: RTI analysis of Medicare claims data (RTI program ms08; annual_2016\ms04_glm and ms04_tpm).

174
Figure 3-17 ECCP effect on Medicare expenditures per resident per year, New York
NOTE: Dots indicate year-specific effects separately estimated for 2014, 2015, and 2016; triangles indicate intervention period (2014–2016) annual effects; vertical bars are 90% confidence intervals. Detailed numbers underlying the graphs are provided in Appendix H. ECCP = Enhanced Care and Coordination Provider; ED = Emergency Department. SOURCE: RTI analysis of Medicare claims data (RTI program ms08; annual_2016\ms04_glm and ms04_tpm).

175
Table 3-76 ECCP effect on MDS-based quality measures (percent of observed quarters per resident
per year with event) during intervention period 2014–2016, New York
MDS-based quality measures
Mean, 2014-2016
(percent)
Effect (percenta
ge points) 90% CI 80% CI p-value
Relative effect (% of mean)
Decline in ADLs 11.9 0.6 –1.4 2.6 –0.9 2.1 0.655 5.1 Antipsychotic medication use 15.3 –0.5 –3.1 2.1 –2.6 1.6 0.731 –3.3
NOTE: The 2014–2016 mean is the unadjusted mean across all ECCP and comparison residents during the 3-year intervention period, weighted by the number of residents in each year. Bold text indicates statistical significance at the 0.10 level. Standard statistical practice is to use confidence intervals of 90% or higher; 80% confidence intervals are provided here for comparison purposes only. ADL = Activities of Daily Living; ECCP = Enhanced Care and Coordination Provider; MDS = Minimum Data Set. SOURCE: RTI analysis of MDS assessments data (RTI program jw20; annual_2016\qm).
Table 3-77 ECCP effect on MDS-based quality measures (percent of observed quarters per resident
with event), 2016, New York
MDS-based quality measures
Mean, 2016
(percent)
Effect (percentage
points) 90% CI 80% CI p-value
Relative effect (% of mean)
One or more falls with injury 7.3 –0.8 –2.1 0.5 –1.8 0.2 0.334 –10.9 Self-report moderate to severe pain
2.8 –1.0 –2.0 0.0 –1.8 –0.2 0.089 –35.7
Pressure ulcers Stage II or higher 7.4 0.3 –1.2 1.8 –0.9 1.5 0.698 4.1 Urinary tract infection 3.2 0.0 –1.6 1.6 –1.3 1.3 0.970 0.0 Catheter inserted and left in bladder
2.9 –1.2 –1.9 –0.5 –1.7 –0.7 0.003 –41.7
Decline in ADLs 11.5 –0.3 –2.6 2.0 –2.1 1.5 0.834 –2.6 Antipsychotic medication use 13.8 –0.2 –3.3 2.9 –2.6 2.2 0.913 –1.5 Depressive symptoms 10.6 –2.5 –6.6 1.6 –5.7 0.7 0.336 –23.6
NOTE: The 2016 mean is the unadjusted mean across all ECCP and comparison residents in that year. Bold text indicates statistical significance at the 0.10 level. Standard statistical practice is to use confidence intervals of 90% or higher; 80% confidence intervals are provided here for comparison purposes only. ADL = Activities of Daily Living; ECCP = Enhanced Care and Coordination Provider; MDS = Minimum Data Set. SOURCE: RTI analysis of MDS assessments data (RTI program jw20; annual_2016\qm).

176
3.6.3 Implementation
Implementation Experience Among the seven ECCP Initiatives, the NY-RAH project was one of two education-only
models. The NY-RAH project deployed RNCCs to each participating facility to provide staff education and act in a consultant role without providing clinical care to residents. Over the course of the project, NY-RAH retained its overall structure featuring seven stages of implementation: (Stage 1) recognition of acute changes of condition, (Stage 2) improving staff communication, (Stage 3) QI, (Stage 4) medication management, (Stage 5) hospital communication, (Stage 6) transitions in care, and (Stage 7) advance care planning tools.
The NY-RAH model was considered fully implemented in Initiative Year 3 with some variation existing across NFs. The RNCCs emphasized the staff communication tools (Stages 1 and 2) INTERACT; SBAR; and Stop and Watch, by offering continuous trainings, in-services, and refreshers through all 4 years of the Initiative. QI (Stage 3) was also a major emphasis of the project, and by the final year, the ECCP encouraged the NFs to take ownership of their own QI processes and to adopt their own QI tools. Advance care planning (Stage 7) was implemented, along with encouraging the use of the Medical Orders for Life-Sustaining Treatment (MOLST) form in Initiative Year 2. The Conversation Project and National Health Care Decisions Day were focused initiatives that were added to supplement education around the advance care planning model components in Initiative Years 3 and 4. Medication management (Stage 4) and hospital communication (Stage 5) were delayed until Initiative Year 3 because of the ECCP changes in the primary tool selected and subcontractor delays, respectively. Transitions in care (Stage 6) changed over the course of the project from implementation of an electronic INTERACT Transfer Form, to implementation of Direct Messaging, a secure e-mail software program that enables the secure transfer of patient discharge summary information from the hospital to the nursing facility.
To implement all seven stages, the NY-RAH project had to overcome major operational challenges to deploy its RNCC structure across all participating facilities, especially during the first 2 Initiative years. In the first year, the NY-RAH Initiative area in New York was struck by Hurricane Sandy, delaying the hiring of RNCCs and the delivery of training in participating nursing facilities. A major subcontractor change in the first year of the Initiative also created delays, including the hiring of some RNCCs. The Icahn School of Medicine at Mount Sinai (Mt. Sinai), the final education partner, had the main responsibility to recruit, hire, train, and manage RNCCs, and they implemented a variety of changes to the original RNCC structure. RNCC staff turnover was an ongoing issue during the first years of the Initiative, with 18 RNCCs and 2 clinical nurse managers leaving for a variety of reasons. However, turnover improved in the last 2 years of the project because of more consistency in RNCC management; RNCC reassignments to other facilities to improve facility-RNCC fit; and

177
the addition of two clinical nurse manager roles, one RNCC coach position, and one RNCC float staff.
Figure 3-18 summarizes key findings from the RTI Nursing Facility Administrator Survey for NY-RAH. It shows the trajectory of support for the ECCP by presenting longitudinal data from 2013–2016 on whether facility administrators found the training and support provided by the ECCP and its nurses to be sufficient and helpful during the Initiative. The longitudinal data on two major implementation barriers—staff resistance to change and staff turnover—are also included, as well as data on physician buy-in. Finally, the chart includes 2016 feedback from facility leadership on the effectiveness of the Initiative in reducing avoidable hospitalizations and the likelihood of sustainability of the main model components.

178
Figure 3-18 RTI Nursing Facility Survey results 2013–2016
NOTE: Number of respondents varied by survey wave and question. The NY-RAH model did not include Care Paths. Staff were trained to use the AMDA Know-it-all Before You Call cards. ECCP = Enhanced Care and Coordination Provider; INTERACT = Interventions to Reduce Acute Care Transfers; APRN = advanced practice registered nurse; RN = registered nurse; SBAR = Situation, Background, Assessment, Recommendation; NY-RAH = New York Reducing Avoidable Hospitalizations SOURCE: RTI analysis of waves 1 through 4 of the RTI Nursing Facility Administrator Survey (data collected August 2013 to December of 2016).

179
Facility Staff Engagement with Initiative Components The NY-RAH project sought to increase facility engagement in their seven model
components using a variety of strategies. Facilities found varying levels of success with each model component based on its compatibility with facility culture, buy-in from nursing facility staff, and support from the ECCP (Table 3-78).
Table 3-78 Facility engagement with Initiative components, NY-RAH, 2016
NOTE: 21 facilities evaluated SOURCE: RTI evaluation of facility engagement using site visit and telephone interview data (data collected 2016).
In the final Initiative year, facility staff engagement has greatly improved compared to early Initiative years. Over the course of the project, engagement has grown primarily for four model components, as evidenced by Table 3-78. Highest facility engagement was associated with end of life care, with 86% of facilities highly engaged, followed by 76 percent of facilities highly engaged with communicating with providers (i.e., SBAR), and 71 percent of facilities engaged with both quality improvement processes and documenting changes in condition (i.e., Stop and Watch). Our site visit and phone interviews found that all key staff were engaged with these model components except for documenting change in condition. High facility engagement for this component should be viewed with caution. Both NF leadership and CNAs reported inconsistent buy-in among CNAs who would most often use the Stop and Watch tool to report an ACOC. This low buy-in was persistently variable across all years of the Initiative although in the last year, NF leadership were highly engaged and focused on increasing CNA buy-in. Table 3-78 shows lowest facility engagement is associated with medication review, care transitions and

180
Direct Messaging which is not surprising because these model components faced multiple implementation challenges throughout the course of the project.
Staff Buy-in Staff were generally engaged with the Initiative, and engagement seemed to improve
each year. In highly engaged facilities, DONs were essential to helping RNCCs disseminate new tools (e.g., SBAR and Stop and Watch) to gain staff buy-in. DONs and administrators were responsible for meeting with RNCCs to review quarterly reports, monitor and encourage tool usage, and review and implement policy and procedural changes as recommended by the ECCP. ECCP and facility staff alike reported that physician buy-in also was critical for overall facility engagement with the Initiative, as well as engagement with tools such as the SBAR, Stop and Watch, and the MOLST form. If endorsed and encouraged by the physicians, these tools were more likely to be adopted by staff. Facilities that had in-house medical directors and providers on staff tended to demonstrate greater buy-in but may have used the actual communication tools or forms such as the SBAR less frequently because nursing staff could more easily contact medical directors or in-house physicians directly.
Strong buy-in from licensed nursing staff for key model components such as communication with providers and identifying change of condition was key to successful implementation of the NY-RAH project. Many facilities reported that the higher rates of SBAR tool use may be related to nurses having a greater understanding of the purpose of the SBAR tool and how it facilitated better communication with physicians. Nursing leadership recognized that uneven implementation of tools such as SBAR and Stop and Watch were reflective of the level of buy-in among licensed nursing staff. Low buy-in among CNAs was consistently cited as a major barrier to implementation for the Stop and Watch tool for early identification of ACOCs. Reports from a variety of staff types suggested that CNAs were more resistant to change or less likely to deviate from their normal routines, and they also raised concerns about how facility culture could impact staff buy-in. Low buy-in from licensed nursing staff could also affect buy-in among direct care staff. Some facilities introduced incentive programs to increase buy-in and tool use among the CNAs. The facilities with the highest buy-in and tool use included CNAs who had a strong understanding of the purpose of the tool and goals of the Initiative and felt tool use empowered them as members of the care team.
Beneficiary Enrollment and Buy-in Because this is a nonclinical model that
does not provide direct care of the residents, it was hard to gauge family or resident buy-in through the duration of the project. Resident enrollment and policy procedures remained largely the same through all Initiative years. ECCP staff identified two federal managed care initiatives, the Fully Integrated Duals Advantage (FIDA) demonstration and Medicare Advantage, as having the potential to affect beneficiary enrollment. At the conclusion of the project, FIDA seemed to have very little impact on the eligible beneficiary pool, but Medicare Advantage continued to have an expanding

181
presence in some facilities, reducing the number of eligible fee-for-service beneficiaries for the Initiative.
Outcomes and Successes ECCP and nursing facility leadership viewed the model as a success because of the
resulting changes to the processes and procedures used by the participating facilities to prevent avoidable hospitalizations. After 4 years, many NY-RAH tools were considered fully implemented with ongoing support from the ECCP. The SBAR, MOLST, and the QI processes were considered the most successful. Most notably, facilities reported noticing a shift in facility culture toward preventing avoidable hospitalizations. Physicians became more supportive of the Initiative, showing strong support for the Stop and Watch, SBAR, MOLST form, and QI process. Overall, facility leadership and staff perceived the project as meeting its overall goal of reducing avoidable hospitalizations, though ECCP interviewees indicated that the process took time to implement, and consequently, quantitative data may not yet demonstrate significant reductions in avoidable hospitalizations.
Best Practices, Sustainability, and Lessons Learned The following lessons learned and best practices emerged as a result of the
implementation of the NY-RAH model. These lessons learned were identified as essential to the continued sustainability of the NY-RAH model.
First, the fit of the ECCP nurse within assigned facilities is key to facility-staff buy-in. Second, facility staff buy-in and understanding of the purpose of intervention tools is critical for successful implementation, sustainability, and culture change. And finally, facility leadership (i.e., DON, NFA, medical director) buy-in is also critical and essential to maintain support by staff.
NY-RAH and facility staff offered the following lessons learned. Intervention components should be implemented one at a time. This allows facilities time to digest new information, address challenges, and standardize the use of new tools. Consistent training and refreshers from RNCCs are key for facility staff to be reminded about how to use tools, why tools are important, and what goals the tools serve toward reducing avoidable hospitalizations. Staff turnover also makes this important. With respect to some tools, New York’s Delivery System Reform Incentive Payment (DSRIP) Program, a major reform of the state’s Medicaid system, will help with sustainability, particularly around the use of INTERACT tools to improve communication among facility staff to reduce avoidable hospitalizations.
Smooth transfers to and from the hospital are important; these efforts should be a part of the overall strategy to reduce PAHs. Working with hospital partners is also important:

182
developing tools for communicating with hospitals requires upfront discussions around workflow processes for both the facility and hospital. Establishing QI processes based on other QAPI initiatives is helpful, especially those involving hospitalizations, which are often a driver of QAPI.
3.6.4 Summary
Several key observations of the qualitative data collection may help explain the quantitative analysis results. These pertain to the slower project implementation due to the NY-RAH Initiative model structure; improvements in how facilities address EOL care; changes in transfer patterns resulting in potential reductions in ED use; and state policy environment and related initiatives potentially affecting outcomes as they relate to comparison facilities. First, the NY-RAH model is one of two education-only ECCP models with a registered nurse acting in an advisory role rather than providing clinical care. This ECCP focuses primarily on delivering education to nursing facility staff on tools to prevent ACOCs, quality improvement through root cause analysis, and EOL care. This type of model naturally has a slower implementation timeline because it provides training on tools that can only be successful at improving outcomes and changing organizational culture if trainees understand and learn the content first, followed by effectively using the tools. Interviews with ECCP and nursing facility staff confirmed the slow implementation of the NY-RAH Initiative because of the lack of buy-in across staff types and levels, as well as operational hurdles such as ECCP nurse turnover through the first 2 Initiative years. Many staff also indicated there was a need for continuous retraining of staff to keep up the momentum of tool use (i.e., SBAR and Stop and Watch) and to increase buy-in. By 2015–2016, ECCP staffing became more consistent, and staff engagement with NY-RAH tools increased. In addition, two primary model components were implemented much later in the Initiative timeline. The EOL care planning tools were not introduced until late in 2014; most facilities had adopted the primary tool by 2016. Direct Messaging, or e-mail software to improve the secure transfer of discharge summary information from hospitals to NFs, was implemented in 2015 but was still very much in its infancy even in 2016. These factors may help to explain the gradual improvement over time in reducing the probability of all-cause hospitalizations.
Second, the EOL care component of the NY-RAH ECCP model was strong and may have contributed to reducing hospitalizations and ED visits. During a resident’s final days, there can be increased symptoms that result in emergent situations and lead to transfers to a hospital or ED. The MOLST38 form was implemented across NY-RAH nursing facilities to reduce unnecessary hospitalizations, including ED visits, at the EOL. This form documents resident EOL treatment goals and is transferrable between health care settings (e.g., hospitals and nursing facilities). The intention of this form is to honor resident preferences at the end of life and to reduce unnecessary transfers to hospitals per the resident or their family’s wishes.
Third, 2016 site visits confirmed that some NY-RAH NFs were changing their transfer patterns and increasingly using outpatient clinics and hospital outpatient services to deal with issues that would have been addressed as ED services before, such as transfusions and feeding
38 Source: https://www.health.ny.gov/professionals/patients/patient_rights/molst/.

183
tube replacement. We note that this latter change was not NY-RAH-specific so it could be harder to detect an Initiative effect on ED use relative to the comparison group.
Fourth, the Initiative took place within the context of other New York State efforts to reduce hospitalizations and expenditures. For example, after one year of planning, New York began the full implementation of the DSRIP Program, in April 2015. The purpose of this ongoing state program is to restructure and redesign the Medicaid system with the goal of reducing avoidable hospitalizations by 25 percent over 5 years. DSRIP is statewide and overlaps with some NY-RAH facilities and comparison facilities. In addition to statewide initiatives, nursing facility leadership indicated in 2016 that they were under direct pressure from hospital systems to reduce readmission rates as part of the CMS Readmissions Reduction Program.39 Under this program, hospitals can receive payment penalties if they incur excess readmissions. These changes may also make it harder to detect an Initiative effect. Although this is a national program, the New York facilities made particular mention of it.
39 Source: https://www.cms.gov/Medicare/Medicare-Fee-for-Service-Payment/AcuteInpatientPPS/Readmissions-
Reduction-Program.html.

184
3.7 Pennsylvania
3.7.1 The University of Pittsburgh Medical Center (UPMC) Community Provider Services Program to Reduce Avoidable hospitalizations using Evidence-based interventions for Nursing facilities (RAVEN)
The University of Pittsburgh Medical Center (UPMC) Community Provider Services Program to Reduce Avoidable hospitalizations using Evidence-based interventions for Nursing facilities (RAVEN) model launched in February 2013, with the goals of reducing avoidable hospitalizations among long-stay NF residents, improving NF resident health outcomes, reducing overall health care spending, and facilitating culture change within partner nursing facilities. The UPMC-RAVEN model used seven key components to achieve these goals: clinical care and education provided by APRNs and RNs, support provided by Lead APRNs, trainings provided by the ECCP and partners, INTERACT tool use, EOL care planning support, QI activities, and telemedicine (Table 3-79). There was consistent but not always statistically significant evidence that the UPMC-RAVEN model was associated with reductions in hospitalizations and ED visits, with stronger evidence of related Medicare expenditures.
Table 3-79 UPMC-RAVEN model description
Structure
Organization type Not-for-profit health care system: University of Pittsburgh Medical Center (UPMC) Partners and their roles RxPartners: pharmacy consulting partner providing medication reviews and
consultations; Robert Morris University (RMU): education partner providing INTERACT and other training; Jewish Healthcare Foundation (JHF): education partner providing EOL/palliative care and other training; Heritage Valley Health System: funds 0.4 FTE of ECCP co-Medical Director; Excela Health: supports 0.5 FTE for 1 APRN
Number of facilities 18 participating facilities (6 facilities located in remote rural areas) NF attrition 1 NF dropped out in 2015 Facility-based staff 18 FTE total: 7 RNs, 8 APRNs, 3 lead APRNs State APRN practice arrangements affecting implementation
State law requires a CPA with an outside physician or health care entity for APRNs to practice.
Use of registered or higher-level nurses
APRN Yes RN Yes; placed in facilities with more than 100 enrolled residents in addition to APRN or
in facilities for which a suitable APRN cannot be recruited (continued)

185
Table 3-79 (continued) UPMC-RAVEN: Model description
Role of nurse Clinical care Yes Writing orders Yes; under CPA with facility physicians Education Yes Weekly Schedule APRNs assigned to facilities full time 5 days a week (9 a.m. to 5 p.m.); limited on-
call support through telemedicine APRN on nights and weekends (see Telemedicine section below)
Medication management
Polypharmacy reduction Yes; recommendations by RxPartners’ consulting pharmacists directly to ECCP APRNs
Antipsychotics reduction Yes; In Initiative Year 3 RxPartners’ consulting pharmacists initiated Psychotropic Medication Interdisciplinary Team Meetings in several facilities
Medication review Yes; conducted by RxPartners’ consulting pharmacists
Tools promoted by ECCPs to improve communication and identification of changes in resident condition (INTERACT and others)
SBAR Yes; RMU trained all facilities, used in all facilities with various levels of success. Some facilities mandate use. Both paper and electronic depending on facility EMR. Condition-specific SBAR introduced to some facilities in Initiative Years 3 and 4.
Stop and Watch Yes; RMU trained all facilities, used in all facilities with various levels of success. Both paper and electronic depending on facility EMR. Some facilities use incentives or mandate use.
Transfer forms No, not generally used; SBAR sometimes used as a transfer tool. QI tool Yes, ECCP Acute Care Transfer form used for root cause analysis of hospitalizations;
data provided back to facilities in summary reports which identify PCPs who send residents out
Care paths Yes, but very limited use in a small number of facilities.
End-of-life planning
Advance directives Yes; POLST Staff education Yes
Optional features specific to UMPC-RAVEN
Telemedicine Telemedicine carts with after-hours APRN support for phone and cart consultations. Carts have multiple functionalities: video-chat, high-resolution cameras, e-stethoscope, EKG and otoscope; limited on-call support available through telemedicine APRN on nights and weekends (Monday through Friday from 4 p.m. to 10 p.m., and Saturday and Sunday from 10 a.m. to 6 p.m.).
(continued)
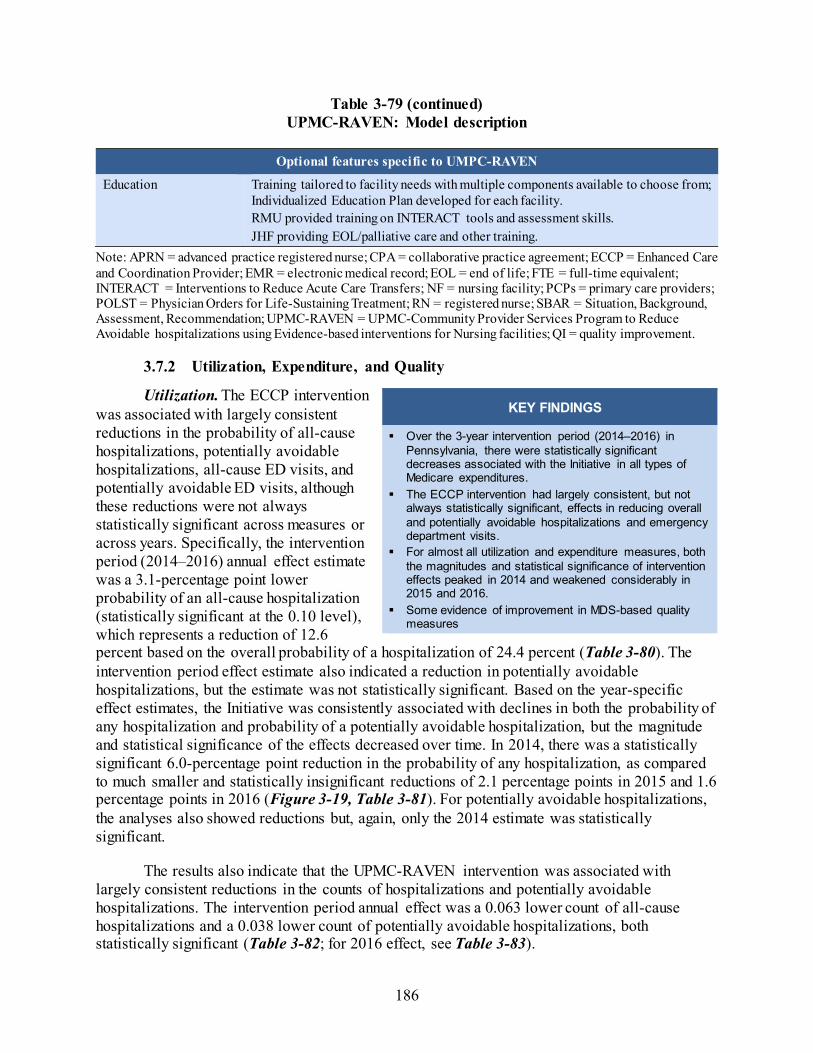
186
Table 3-79 (continued) UPMC-RAVEN: Model description
Optional features specific to UMPC-RAVEN
Education Training tailored to facility needs with multiple components available to choose from; Individualized Education Plan developed for each facility. RMU provided training on INTERACT tools and assessment skills. JHF providing EOL/palliative care and other training.
Note: APRN = advanced practice registered nurse; CPA = collaborative practice agreement; ECCP = Enhanced Care and Coordination Provider; EMR = electronic medical record; EOL = end of life; FTE = full-time equivalent; INTERACT = Interventions to Reduce Acute Care Transfers; NF = nursing facility; PCPs = primary care providers; POLST = Physician Orders for Life-Sustaining Treatment; RN = registered nurse; SBAR = Situation, Background, Assessment, Recommendation; UPMC-RAVEN = UPMC-Community Provider Services Program to Reduce Avoidable hospitalizations using Evidence-based interventions for Nursing facilities; QI = quality improvement.
3.7.2 Utilization, Expenditure, and Quality
Utilization. The ECCP intervention was associated with largely consistent reductions in the probability of all-cause hospitalizations, potentially avoidable hospitalizations, all-cause ED visits, and potentially avoidable ED visits, although these reductions were not always statistically significant across measures or across years. Specifically, the intervention period (2014–2016) annual effect estimate was a 3.1-percentage point lower probability of an all-cause hospitalization (statistically significant at the 0.10 level), which represents a reduction of 12.6 percent based on the overall probability of a hospitalization of 24.4 percent (Table 3-80). The intervention period effect estimate also indicated a reduction in potentially avoidable hospitalizations, but the estimate was not statistically significant. Based on the year-specific effect estimates, the Initiative was consistently associated with declines in both the probability of any hospitalization and probability of a potentially avoidable hospitalization, but the magnitude and statistical significance of the effects decreased over time. In 2014, there was a statistically significant 6.0-percentage point reduction in the probability of any hospitalization, as compared to much smaller and statistically insignificant reductions of 2.1 percentage points in 2015 and 1.6 percentage points in 2016 (Figure 3-19, Table 3-81). For potentially avoidable hospitalizations, the analyses also showed reductions but, again, only the 2014 estimate was statistically significant.
The results also indicate that the UPMC-RAVEN intervention was associated with largely consistent reductions in the counts of hospitalizations and potentially avoidable hospitalizations. The intervention period annual effect was a 0.063 lower count of all-cause hospitalizations and a 0.038 lower count of potentially avoidable hospitalizations, both statistically significant (Table 3-82; for 2016 effect, see Table 3-83).
KEY FINDINGS
Over the 3-year intervention period (2014–2016) in Pennsylvania, there were statistically significant decreases associated with the Initiative in all types of Medicare expenditures.
The ECCP intervention had largely consistent, but not always statistically significant, effects in reducing overall and potentially avoidable hospitalizations and emergency department visits.
For almost all utilization and expenditure measures, both the magnitudes and statistical significance of intervention effects peaked in 2014 and weakened considerably in 2015 and 2016.
Some evidence of improvement in MDS-based quality measures

187
For the probability of all-cause and potentially avoidable ED visits, the intervention period (2014–2016) annual effect estimates were reductions of 1.0 percentage points (not statistically significant), and 2.0 percentage points (statistically significant), respectively (Table 3-80). Based on the year-specific effect estimates, the Initiative was consistently associated with declines in the probability of any ED use, but the magnitude of the effect decreased over time. Specifically, the 2014 effect estimate was a 2.4 percentage point decline, while the 2015 and 2016 estimates were 0.5- and 0.2-percentage point declines, respectively. None of these estimates were statistically significant (Figure 3-19, Table 3-81). For potentially avoidable emergency department visits, the year-specific effect estimates in 2014 and 2015 were 2.8- and 1.5-percentage point, statistically significant, declines.
The results also indicate that the UPMC-RAVEN intervention was associated with reductions in the counts of all-cause emergency department visits and potentially avoidable ED visits. The intervention period annual effect estimate was a 0.007 lower count of all-cause hospitalizations (not statistically significant) and a 0.020 lower count of potentially avoidable hospitalizations (statistically significant).
Medicare Expenditures. This evaluation provides evidence that the UPMC-RAVEN intervention was associated with reduced total Medicare expenditures. The intervention period annual effect estimate on total Medicare expenditures was a statistically significant reduction of $2,513 per resident per year (Table 3-84; for 2016 effect, see Table 3-85). The intervention period annual effect estimates also indicated statistically significant reductions in expenditures for all-cause and potentially avoidable hospitalizations and emergency department visits. The year-specific effect estimates provide additional indication of reductions in all types of expenditures, with the largest reductions in 2014 in both total Medicare expenditure and hospitalization related expenditures (Figure 3-20).
Medicaid Expenditures. The section presents descriptive analyses of Medicaid and Medicare expenditures on select services for Initiative-eligible residents with Medicaid coverage in Pennsylvania during all study years for which usable Medicaid data could be obtained, including: 2011 (Table 3-86), 2012 (Table 3-87), 2013 (Table 3-88), and 2014 (Table 3-89). Please note that, unlike the Medicare multivariate regression analyses described above, the Medicaid expenditure results presented in this section are descriptive. Descriptive statistics cannot be taken as results of an intervention. The observed trends must be understood within the context of possible changes in ECCP resident characteristics as well as each state’s comparison group.
Overall, Table 3-86 through Table 3-89 illustrate that the total combined Medicare and Medicaid expenditures for the Medicare-Medicaid duals group and the total Medicaid expenditures for the Medicaid-only group are largely driven by NF expenditures, which account for a slightly larger percentage of the total costs in the Medicaid-only group than in the Medicare-Medicaid duals group. Total costs were slightly higher for the Medicaid-only group in all years except for 2013. In 2013 and 2014, total costs, excluding NF expenditures, were higher in the Medicare-Medicaid duals group compared with the Medicaid-only group. Among Medicare-Medicaid duals, average total combined Medicare and Medicaid expenditures PBPM for each service type were primarily driven by Medicaid, which are primarily composed of NF expenditures, which are paid for exclusively by Medicaid.

188
MDS-Based Quality. Based on the intervention period annual effects, more residents experienced a decline in ADLs, while fewer residents used antipsychotic medications (Table 3-90). Neither of these effects were statistically significant, but they were consistent with the year-specific effect estimates for 2016. In 2016, the Initiative was associated with an improvement in four of the eight MDS-based quality measures, but only two, one or more falls with injury and catheter inserted and left in bladder, were statistically significant. The reported occurrences of one or more falls with injury decreased by 3.1 percentage points, and incidence of reported catheter inserted and left in bladder also decreased by 1.5 percentage points. There were more residents who experienced a decline in ADLs: this proportion increased by 3.8 percentage points and was statistically significant (Table 3-91).
Table 3-80 ECCP effect on probability of any utilization per resident per year during intervention
period, 2014–2016, Pennsylvania
Probability of having at least one:
Mean, 2014-2016
(percent)
Effect (percentage
points) 90% CI 80% CI p-value
Relative effect (% of mean)
All-cause hospitalization 24.4 –3.1 –5.9 –0.2 –5.3 –0.9 0.075 –12.6 Potentially avoidable hospitalization
10.5 –2.1 –4.3 0.2 –3.8 –0.3 0.131 –19.6
All-cause ED visit 19.7 –1.0 –4.2 2.3 –3.5 1.5 0.618 –5.0 Potentially avoidable ED visit 6.9 –2.0 –3.2 –0.7 –3.0 –0.9 0.013 –28.2
NOTE: The 2014–2016 mean is the unadjusted mean across all ECCP and comparison residents during the 3-year intervention period, weighted by the number of residents in each year. Bold text indicates statistical significance at the 0.10 level. Standard statistical practice is to use confidence intervals of 90% or higher; 80% confidence intervals are provided here for comparison purposes only. ECCP = Enhanced Care and Coordination Provider; ED = Emergency Department. SOURCE: RTI analysis of Medicare claims data (RTI program ms06; annual_2016\ms01_xtgee).

189
Table 3-81 ECCP effect on probability of any utilization per resident per year, 2016, Pennsylvania
Probability of having at least one:
Mean, 2016
(percent)
Effect (percentage
points) 90% CI 80% CI p-value
Relative effect (% of mean)
All-cause hospitalization 23.8 –1.6 –4.6 1.4 –3.9 0.7 0.376 –6.8 Potentially avoidable hospitalization 9.9 –1.1 –3.8 1.5 –3.2 1.0 0.492 –11.2 All-cause ED visit 18.6 –0.2 –4.0 3.7 –3.2 2.8 0.942 –0.9 Potentially avoidable ED visit 6.8 –1.1 –2.6 0.4 –2.3 0.0 0.217 –16.5
NOTE: The 2016 mean is the unadjusted mean across all ECCP and comparison residents in that year. Bold text indicates statistical significance at the 0.10 level. Standard statistical practice is to use confidence intervals of 90% or higher; 80% confidence intervals are provided here for comparison purposes only. ECCP = Enhanced Care and Coordination Provider; ED = Emergency Department. SOURCE: RTI analysis of Medicare claims data (RTI program ms06; annual_2016\ms01_xtgee).
Figure 3-19 ECCP effect on probability of any utilization per resident per year, Pennsylvania
NOTE: Dots indicate year-specific effects separately estimated for 2014, 2015, and 2016; triangles indicate intervention period (2014–2016) annual effects; vertical bars are 90% confidence intervals. Detailed numbers underlying the graphs are provided in Appendix H. ECCP = Enhanced Care and Coordination Provider; ED = Emergency Department. SOURCE: RTI analysis of Medicare claims data (RTI program ms06; annual_2016\ms01_xtgee).

190
Table 3-82 ECCP effect on count of utilization per resident per year during intervention period, 2014–
2016, Pennsylvania
Count of events per resident
Mean, 2014-2016 Effect 90% CI 80% CI p-value
Relative effect (% of mean)
All-cause hospitalizations 0.365 –0.063 –0.120 –0.006 –0.107 –0.019 0.067 –17.3 Potentially avoidable hospitalizations 0.127 –0.038 –0.066 –0.009 –0.060 –0.015 0.031 –29.6 All-cause ED visits 0.281 –0.007 –0.069 0.055 –0.055 0.041 0.852 –2.5 Potentially avoidable ED visits 0.079 –0.020 –0.038 –0.002 –0.034 –0.006 0.063 –25.5
NOTE: The 2014–2016 mean is the unadjusted mean across all ECCP and comparison residents during the 3-year intervention period, weighted by the number of residents in each year. Bold text indicates statistical significance at the 0.10 level. Standard statistical practice is to use confidence intervals of 90% or higher; 80% confidence intervals are provided here for comparison purposes only. ECCP = Enhanced Care and Coordination Provider; ED = Emergency Department. SOURCE: RTI analysis of Medicare claims data (RTI program ms07; annual_2016\ms03_xtgee).
Table 3-83 ECCP effect on count of utilization per resident per year, 2016, Pennsylvania
Count of events per resident Mean, 2016 Effect 90% CI 80% CI p-value
Relative effect (% of mean)
All-cause hospitalizations 0.358 –0.033 –0.100 0.033 –0.085 0.019 0.413 –9.3 Potentially avoidable hospitalizations 0.122 –0.028 –0.064 0.007 –0.056 –0.001 0.188 –23.1 All-cause ED visits 0.266 0.019 –0.064 0.101 –0.046 0.083 0.710 7.0 Potentially avoidable ED visits 0.078 –0.009 –0.031 0.013 –0.026 0.008 0.484 –11.7
NOTE: The 2016 mean is the unadjusted mean across all ECCP and comparison residents in that year. Bold text indicates statistical significance at the 0.10 level. Standard statistical practice is to use confidence intervals of 90% or higher; 80% confidence intervals are provided here for comparison purposes only. ECCP = Enhanced Care and Coordination Provider; ED = Emergency Department. SOURCE: RTI analysis of Medicare claims data (RTI program ms07; annual_2016\ms03_xtgee).

191
Table 3-84 ECCP effect on Medicare expenditures per resident per year during intervention period,
2014–2016, Pennsylvania
Medicare expenditure
Mean, 2014-
2016 ($) Effect
($) 90% CI 80% CI p-value
Relative effect (% of mean)
Total 20,466 –2,513 –3,929 –1,097 –3,617 –1,409 0.004 –12.3All-cause hospitalizations 3,885 –1,070 –1,541 –600 –1,437 –704 <0.001 –27.6Potentially avoidable hospitalizations
1,067 –377 –603 –150 –553 –200 0.006 –35.3
All-cause ED visits 160 –33 –61 –4 –55 –10 0.059 –20.5Potentially avoidable ED visits 45 –18 –28 –8 –26 –10 0.002 –39.9
NOTE: The 2014–2016 mean is the unadjusted mean across all ECCP and comparison residents during the 3-year intervention period, weighted by the number of residents in each year. Bold text indicates statistical significance at the 0.10 level. Standard statistical practice is to use confidence intervals of 90% or higher; 80% confidence intervals are provided here for comparison purposes only. ECCP = Enhanced Care and Coordination Provider; ED = Emergency Department. SOURCE: RTI analysis of Medicare claims data (RTI program ms08; annual_2016\ms04_glm and ms04_tpm).
Table 3-85 ECCP effect on Medicare expenditures per resident, 2016, Pennsylvania
Medicare expenditure Mean,
2016 ($) Effect
($) 90% CI 80% CI p-value
Relative effect (% of mean)
Total 20,417 –2,217 –3,931 –503 –3,553 –881 0.033 –10.9All-cause hospitalizations 3,825 –978 –1,495 –461 –1,381 –575 0.002 –25.6Potentially avoidable hospitalizations 1,040 –375 –624 –126 –569 –181 0.013 –36.1All-cause ED visits 153 –31 –62 –1 –55 –8 0.091 –20.5Potentially avoidable ED visits 45 –15 –26 –5 –24 –7 0.017 –34.3NOTE: The 2016 mean is the unadjusted mean across all ECCP and comparison residents in that year. Bold text indicates statistical significance at the 0.10 level. Standard statistical practice is to use confidence intervals of 90% or higher; 80% confidence intervals are provided here for comparison purposes only. ECCP = Enhanced Care and Coordination Provider; ED = Emergency Department. SOURCE: RTI analysis of Medicare claims data (RTI program ms08; annual_2016\ms04_glm and ms04_tpm).

192
Figure 3-20 ECCP effect on Medicare expenditures per resident per year, Pennsylvania
NOTE: Dots indicate year-specific effects separately estimated for 2014, 2015, and 2016; triangles indicate intervention period (2014–2016) annual effects; vertical bars are 90% confidence intervals. Detailed numbers underlying the graphs are provided in Appendix H. ECCP = Enhanced Care and Coordination Provider; ED = Emergency Department. SOURCE: RTI analysis of Medicare claims data (RTI program ms08; annual_2016\ms04_glm and ms04_tpm).

193
Table 3-86 Medicaid and Medicare expenditures (in dollars) per beneficiary per month, Medicare-Medicaid dually eligible and Medicaid-
only residents: Means (standard deviations), Pennsylvania, 2011
Category
Medicare-Medicaid Duals Medicaid-only
Medicare expenditures, PBPM in dollars, mean (SD)
Medicaid expenditures, PBPM in dollars, mean (SD)
Total combined Medicare and Medicaid expenditures, PBPM
in dollars, mean (SD) Medicaid expenditures, PBPM
in dollars, mean (SD)
ECCP Comparison ECCP Comparison ECCP Comparison ECCP Comparison
N (Residents) 2,155 4,874 2,155 4,874 2,155 4,874 213 305 Total expenditures 3,687.51 3,619.09 4,138.21 4,121.51 7,825.72 7,740.60 11,099.41 9,386.22
(5,512.20) (7,594.22) (2,074.62) (2,030.00) (5,091.38) (7,368.10) (15,834.99) (10,083.01) Subtotal of expenditures (No NF)
3,687.51 3,619.09 118.24 135.41 3,805.74 3,754.50 5,369.57 4,140.56 (5,512.20) (7,594.22) (391.83) (550.16) (5,577.47) (7,674.21) (15,631.20) (10,094.76)
All-cause hospitalizations
925.88 1,038.51 23.85 24.31 949.73 1,062.82 2,508.76 2,112.07 (3,640.95) (6,227.78) (157.97) (292.35) (3,666.75) (6,249.76) (8,220.31) (6,955.92)
Potentially avoidable hospitalizations
342.66 312.76 8.44 8.03 351.09 320.79 637.81 524.27 (2,313.38) (2,791.24) (110.35) (124.26) (2,317.48) (2,797.95) (3,318.18) (3,532.41)
All-cause ED visits 32.82 27.54 0.05 0.13 32.87 27.67 12.04 12.57 (166.06) (196.42) (1.06) (3.29) (166.09) (196.60) (62.32) (53.04)
Potentially avoidable ED visits
12.38 11.18 0.02 0.01 12.40 11.19 2.49 3.19 (121.57) (173.96) (0.73) (0.41) (121.59) (173.96) (12.31) (14.82)
NF Services 0.00 0.00 4,019.97 3,986.10 4,019.97 3,986.10 5,729.84 5,245.65 (0.00) (0.00) (2,063.84) (1,995.79) (2,063.84) (1,995.79) (1,346.45) (1,835.12)
Prescription drugs 542.79 521.17 10.70 10.62 553.49 531.78 756.62 668.66
(590.61) (645.42) (57.48) (74.85) (595.19) (652.29) (755.01) (862.77)
NOTES: PBPM = per beneficiary per month; ED = emergency department; NF = nursing facility; SD = standard deviation; ECCP = Enhanced Care and Coordination Provider. SOURCE: RTI analysis of Medicaid claims data (RTI program: av14/nhpah290).
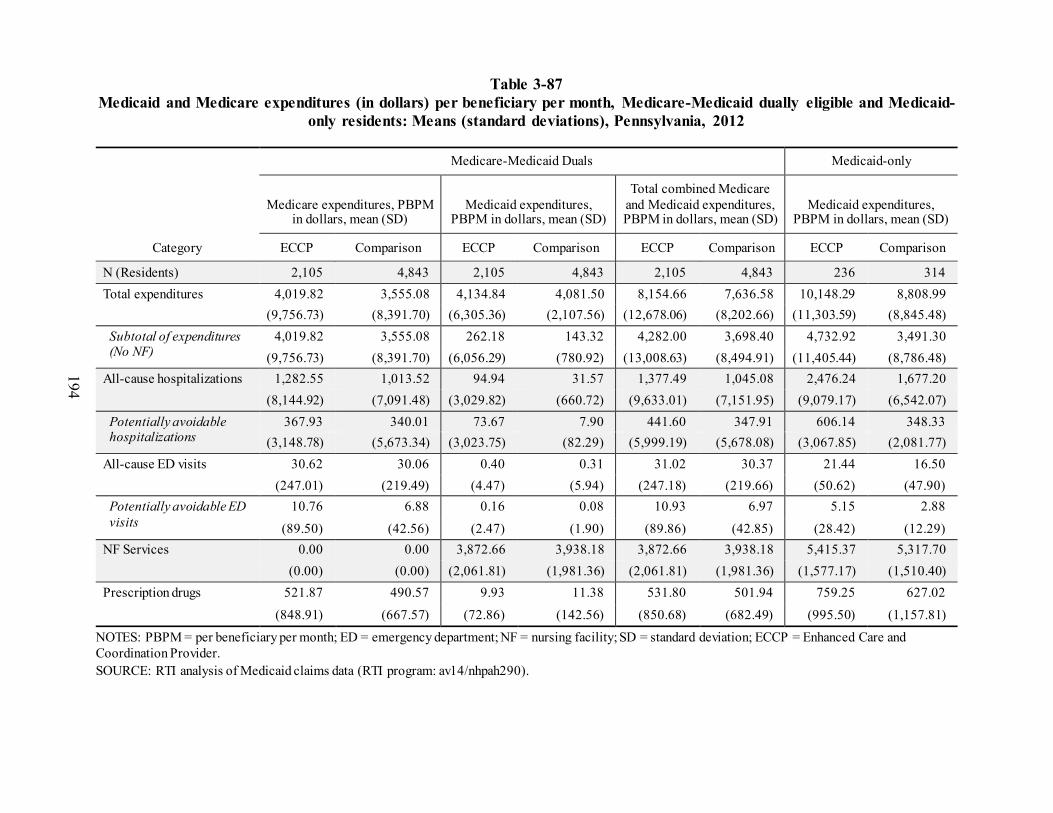
194
Table 3-87 Medicaid and Medicare expenditures (in dollars) per beneficiary per month, Medicare-Medicaid dually eligible and Medicaid-
only residents: Means (standard deviations), Pennsylvania, 2012
Category
Medicare-Medicaid Duals Medicaid-only
Medicare expenditures, PBPM in dollars, mean (SD)
Medicaid expenditures, PBPM in dollars, mean (SD)
Total combined Medicare and Medicaid expenditures, PBPM in dollars, mean (SD)
Medicaid expenditures, PBPM in dollars, mean (SD)
ECCP Comparison ECCP Comparison ECCP Comparison ECCP Comparison
N (Residents) 2,105 4,843 2,105 4,843 2,105 4,843 236 314 Total expenditures 4,019.82 3,555.08 4,134.84 4,081.50 8,154.66 7,636.58 10,148.29 8,808.99
(9,756.73) (8,391.70) (6,305.36) (2,107.56) (12,678.06) (8,202.66) (11,303.59) (8,845.48) Subtotal of expenditures (No NF)
4,019.82 3,555.08 262.18 143.32 4,282.00 3,698.40 4,732.92 3,491.30 (9,756.73) (8,391.70) (6,056.29) (780.92) (13,008.63) (8,494.91) (11,405.44) (8,786.48)
All-cause hospitalizations 1,282.55 1,013.52 94.94 31.57 1,377.49 1,045.08 2,476.24 1,677.20 (8,144.92) (7,091.48) (3,029.82) (660.72) (9,633.01) (7,151.95) (9,079.17) (6,542.07)
Potentially avoidable hospitalizations
367.93 340.01 73.67 7.90 441.60 347.91 606.14 348.33 (3,148.78) (5,673.34) (3,023.75) (82.29) (5,999.19) (5,678.08) (3,067.85) (2,081.77)
All-cause ED visits 30.62 30.06 0.40 0.31 31.02 30.37 21.44 16.50 (247.01) (219.49) (4.47) (5.94) (247.18) (219.66) (50.62) (47.90)
Potentially avoidable ED visits
10.76 6.88 0.16 0.08 10.93 6.97 5.15 2.88
(89.50) (42.56) (2.47) (1.90) (89.86) (42.85) (28.42) (12.29) NF Services 0.00 0.00 3,872.66 3,938.18 3,872.66 3,938.18 5,415.37 5,317.70
(0.00) (0.00) (2,061.81) (1,981.36) (2,061.81) (1,981.36) (1,577.17) (1,510.40) Prescription drugs 521.87 490.57 9.93 11.38 531.80 501.94 759.25 627.02
(848.91) (667.57) (72.86) (142.56) (850.68) (682.49) (995.50) (1,157.81)
NOTES: PBPM = per beneficiary per month; ED = emergency department; NF = nursing facility; SD = standard deviation; ECCP = Enhanced Care and Coordination Provider. SOURCE: RTI analysis of Medicaid claims data (RTI program: av14/nhpah290).

195
Table 3-88 Medicaid and Medicare expenditures (in dollars) per beneficiary per month, Medicare-Medicaid dually eligible and Medicaid-
only residents: Means (standard deviations), Pennsylvania, 2013
Category
Medicare-Medicaid Duals Medicaid-only
Medicare expenditures, PBPM in dollars, mean (SD)
Medicaid expenditures, PBPM in dollars, mean (SD)
Total combined Medicare and Medicaid expenditures, PBPM
in dollars, mean (SD) Medicaid expenditures, PBPM
in dollars, mean (SD)
ECCP Comparison ECCP Comparison ECCP Comparison ECCP Comparison
N (Residents) 2,053 4,766 2,053 4,766 2,053 4,766 285 419 Total payments 3,278.87 3,800.22 4,233.92 4,144.38 7,512.79 7,944.60 7,694.20 7,643.96
(6,543.23) (10,910.74) (1,981.48) (2,322.89) (6,425.60) (10,851.89) (5,574.43) (5,403.38) Subtotal of payments (No NF)
3,278.87 3,800.22 140.70 148.46 3,419.57 3,948.68 2,775.92 2,653.93 (6,543.23) (10,910.74) (412.37) (736.59) (6,717.73) (10,995.51) (5,237.35) (5,119.10)
All-cause hospitalizations
854.21 1,196.80 25.67 23.06 879.87 1,219.86 1,295.39 1,136.05 (5,319.48) (9,623.51) (223.69) (273.48) (5,430.78) (9,637.15) (4,102.10) (3,821.63)
Potentially avoidable hospitalizations
228.53 372.43 8.20 7.17 236.73 379.60 186.82 230.78 (1,177.93) (6,103.91) (74.64) (92.47) (1,196.44) (6,106.42) (874.69) (1,027.99)
All-cause ED visits 36.41 32.10 0.40 0.29 36.81 32.39 19.48 14.38 (265.59) (213.99) (3.99) (4.51) (266.18) (214.85) (73.05) (37.10)
Potentially avoidable ED visits
8.35 7.64 0.10 0.08 8.46 7.72 4.62 4.25 (42.59) (67.97) (1.24) (1.71) (42.97) (69.21) (32.77) (18.32)
NF Services 0.00 0.00 4,093.22 3,995.92 4,093.22 3,995.92 4,918.29 4,990.03 (0.00) (0.00) (1,979.89) (2,241.36) (1,979.89) (2,241.36) (2,200.00) (1,931.03)
Prescription drugs 530.46 520.99 9.01 5.51 539.47 526.50 542.39 483.50
(664.64) (799.65) (78.12) (41.07) (671.05) (801.50) (720.54) (702.41)
NOTES: PBPM = per beneficiary per month; ED = emergency department; NF = nursing facility; SD = standard deviation; ECCP = Enhanced Care and Coordination Provider. SOURCE: RTI analysis of Medicaid claims data (RTI program: av14/nhpah290).

196
Table 3-89 Medicaid and Medicare expenditures (in dollars) per beneficiary per month, Medicare-Medicaid dually eligible and Medicaid-
only residents: Means (standard deviations), Pennsylvania, 2014
Category
Medicare-Medicaid Duals Medicaid-only
Medicare expenditures, PBPM in dollars, mean (SD)
Medicaid expenditures, PBPM in dollars, mean (SD)
Total combined Medicare and Medicaid expenditures, PBPM
in dollars, mean (SD) Medicaid expenditures, PBPM
in dollars, mean (SD)
ECCP Comparison ECCP Comparison ECCP Comparison ECCP Comparison
N (Residents) 2,173 4,781 2,173 4,781 2,173 4,781 286 440 Total expenditures 4,155.79 3,638.32 4,513.70 4,268.22 8,669.49 7,906.54 8,708.66 9,451.88
(24,152.58) (9,548.09) (3,180.55) (2,113.41) (24,832.68) (9,520.47) (9,690.40) (31,959.71) Subtotal of expenditures (No NF)
4,155.79 3,638.32 212.04 149.33 4,367.83 3,787.65 3,323.42 4,397.91 (24,152.58) (9,548.09) (2,059.77) (686.21) (24,382.95) (9,755.39) (9,291.96) (31,347.86)
All-cause hospitalizations
1,621.39 1,171.39 80.58 24.15 1,701.98 1,195.53 1,478.52 2,866.44 (22,901.21) (8,363.41) (2,024.16) (347.72) (23,054.71) (8,455.18) (7,803.30) (30,955.22)
Potentially avoidable hospitalizations
264.78 275.55 6.68 9.51 271.46 285.06 181.13 169.28 (4,070.22) (2,609.55) (58.23) (270.54) (4,073.04) (2,804.83) (988.21) (693.99)
All-cause ED visits 28.38 37.26 0.29 0.14 28.68 37.40 23.94 14.64 (151.58) (651.99) (2.92) (2.01) (152.12) (652.01) (114.47) (40.75)
Potentially avoidable ED visits
8.05 11.13 0.10 0.03 8.15 11.17 5.17 4.40 (72.47) (293.89) (1.73) (0.51) (72.75) (293.90) (36.59) (15.14)
NF Services 0.00 0.00 4,301.65 4,118.89 4,301.65 4,118.89 5,385.24 5,053.98 (0.00) (0.00) (2,476.02) (2,000.01) (2,476.02) (2,000.01) (2,123.10) (1,876.93)
Prescription drugs 549.27 534.90 9.42 6.63 558.69 541.53 617.35 483.93
(720.42) (883.92) (68.24) (69.18) (727.79) (890.55) (871.12) (723.38)
NOTES: PBPM = per beneficiary per month; ED = emergency department; NF = nursing facility; SD = standard deviation; ECCP = Enhanced Care and Coordination Provider. SOURCE: RTI analysis of Medicaid claims data (RTI program: av14/nhpah290).

197
Table 3-90 ECCP effect on MDS-based quality measures (percent of observed quarters per resident
per year with event) during intervention period, 2014–2016, Pennsylvania
MDS-based quality measures
Mean, 2014-2016
(percent)
Effect (percenta
ge points) 90% CI 80% CI p-value
Relative effect (% of mean)
Decline in ADLs 17.4 0.3 –2.0 2.6 –1.5 2.1 0.810 1.7 Antipsychotic medication use 21.1 –1.4 –4.2 1.4 –3.6 0.8 0.415 –6.6
NOTE: The 2014–2016 mean is the unadjusted mean across all ECCP and comparison residents during the 3-year intervention period, weighted by the number of residents in each year. Bold text indicates statistical significance at the 0.10 level. Standard statistical practice is to use confidence intervals of 90% or higher; 80% confidence intervals are provided here for comparison purposes only. ADL = Activities of Daily Living; ECCP = Enhanced Care and Coordination Provider; MDS = Minimum Data Set. SOURCE: RTI analysis of MDS assessments data (RTI program jw20; annual_2016\qm).
Table 3-91 ECCP effect on MDS-based quality measures (percent of observed quarters per resident
with event), 2016, Pennsylvania
MDS-based quality measures
Mean, 2016
(percent)
Effect (percentage
points) 90% CI 80% CI p-value
Relative effect (% of mean)
One or more falls with injury 12.6 –3.1 –4.9 –1.3 –4.5 –1.7 0.007 –24.7Self-report moderate to severe pain 9.1 –1.8 –4.9 1.3 –4.2 0.6 0.360 –19.9Pressure ulcers Stage II or higher 5.1 0.2 –1.0 1.4 –0.7 1.1 0.751 3.9 Urinary tract infection 3.7 0.1 –1.4 1.6 –1.1 1.3 0.892 2.7 Catheter inserted and left in bladder
3.3 –1.5 –2.7 –0.3 –2.4 –0.6 0.029 –45.3
Decline in ADLs 16.8 3.8 0.8 6.8 1.5 6.1 0.034 22.7 Antipsychotic medication use 20.4 –3.1 –6.7 0.5 –5.9 –0.3 0.170 –15.2Depressive symptoms 4.8 2.2 –3.2 7.6 –2.0 6.4 0.508 46.2
NOTE: The 2016 mean is the unadjusted mean across all ECCP and comparison residents in that year. Bold text indicates statistical significance at the 0.10 level. Standard statistical practice is to use confidence intervals of 90% or higher; 80% confidence intervals are provided here for comparison purposes only. ADL = Activities of Daily Living; ECCP = Enhanced Care and Coordination Provider; MDS = Minimum Data Set. SOURCE: RTI analysis of MDS assessments data (RTI program jw20; annual_2016\qm).
3.7.3 Implementation
Implementation Experience The UPMC-RAVEN Initiative was rolled out in five staggered implementation cohorts
between February and September 2013. Overall, implementation went smoothly and most model

198
elements, except for telemedicine, were implemented per the original design. Implementation delays were largely attributed to problems in obtaining CPAs with facility physicians for UPMC-RAVEN APRNs, particularly in facilities with multiple physicians, as this required multiple CPAs to be signed before the APRN could provide care to residents. There were significant delays associated with the telemedicine implementation because of a delay in delivery of the carts and multiple challenges associated with the software, Internet connectivity, and lack of facility information technology (IT) support. Telemedicine became operational in most facilities only by Initiative Year 3. To address challenges with telemedicine implementation, UPMC-RAVEN (1) hired a telemedicine project manager to support facilities and provide training; (2) hired a dedicated APRN to provide after-hours on-call coverage, (3) upgraded to a more user-friendly cart software, and (4) improve internet access, connectivity, and speed, especially in rural areas.
Over the course of Initiative, only one new component was added. Initially, QI activities were not part of model design; root cause analysis of acute care transfers was implemented in Initiative Year 2. Several changes were implementation for the medication review and telemedicine components. Originally, the results of the medication reviews completed by RxPartners were delivered to UPMC-RAVEN APRNs and were not visible to facility staff. To increase the visibility and impact, in Initiative Year 3, RxPartners introduced Interdisciplinary Team (IDT) meetings in five facilities to review inappropriate psychotropic medication use with the plan to roll out to more facilities.
Overall, the implementation of the UPMC-RAVEN model was a positive experi-ence in participating facilities: the majority were committed to working with the ECCP, and by Initiative Year 4 they reported that the Initiative had been successful in changing facility culture, staff mindsets, and reducing hospitalization rates. Although telemedicine implementation and use posed a consistent challenge across project years, the main barriers to Initiative implementation stemmed from staff constraints. Turnover of facility leadership and staff posed a significant barrier because the Initiative had to be constantly reintroduced for new staff, including reimplementing educational and tool interventions, and UPMC-RAVEN nurses had to spend time building trust with new staff members and obtaining buy-in from facility leadership. Both telemedicine/IT infrastructure and staff recruiting/retention challenges were related to the relatively remote rural location of some of the participating facilities. UPMC-RAVEN generally succeeded in hiring a dedicated cadre of APRNs who received high marks from facility staff but experienced challenges in retaining and recruiting qualified APRNs to work in a these remote facilities. Although the Lead APRNs provided support and extra coverage to these facilities, the lack of consistent APRN assignment impacted staff acceptance and understanding of the Initiative. To mitigate staff turnover, UPMC-RAVEN leadership involved facilities in the hiring of APRNs to ensure that the nurse and the facility were a good fit and offered retention bonuses to staff.
Figure 3-21 summarizes key findings from the RTI Nursing Facility Administrator Survey for UPMC-RAVEN. It shows the trajectory of support for the ECCP by presenting longitudinal data from 2013–2016 on whether facility administrators found the training and support provided by the ECCP and its nurses to be sufficient and helpful during the Initiative.

199
The longitudinal data on two major implementation barriers—staff resistance to change and staff turnover—are also included, as well as data on physician buy-in. Finally, the chart includes 2016 feedback from facility leadership on the effectiveness of the Initiative in reducing avoidable hospitalizations and the likelihood of sustainability of the main model components.

200
Figure 3-21 RTI Nursing Facility Survey results, 2013–2016
NOTE: Number of respondents varied by survey wave and question. ECCP = Enhanced Care and Coordination Provider; INTERACT = Interventions to Reduce Acute Care Transfers; APRN = advanced practice registered nurse; RN = registered nurse; SBAR = Situation, Background, Assessment, Recommendation; UPMC-RAVEN = UPMC-Community Provider Services Program to Reduce Avoidable hospitalizations using Evidence-based interventions for Nursing facilities. SOURCE: RTI analysis of waves 1 through 4 of the RTI Nursing Facility Administrator Survey (data collected August 2013 to December of 2016).
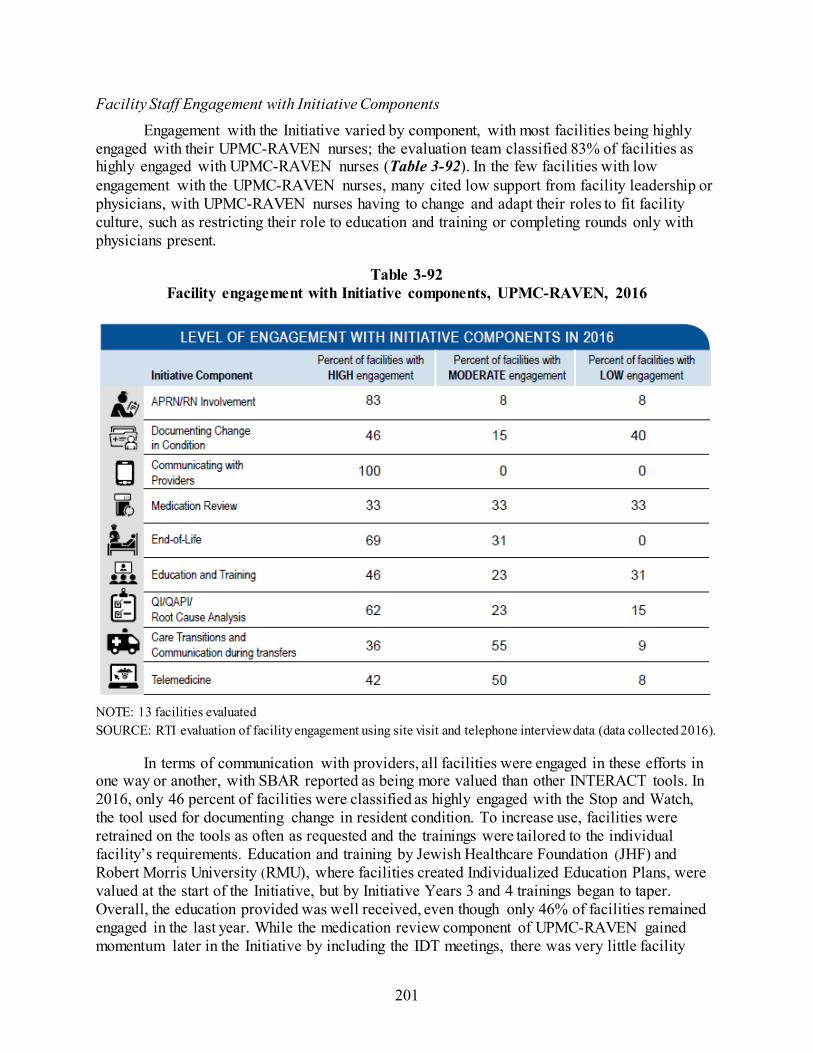
201
Facility Staff Engagement with Initiative Components Engagement with the Initiative varied by component, with most facilities being highly
engaged with their UPMC-RAVEN nurses; the evaluation team classified 83% of facilities as highly engaged with UPMC-RAVEN nurses (Table 3-92). In the few facilities with low engagement with the UPMC-RAVEN nurses, many cited low support from facility leadership or physicians, with UPMC-RAVEN nurses having to change and adapt their roles to fit facility culture, such as restricting their role to education and training or completing rounds only with physicians present.
Table 3-92 Facility engagement with Initiative components, UPMC-RAVEN, 2016
NOTE: 13 facilities evaluated SOURCE: RTI evaluation of facility engagement using site visit and telephone interview data (data collected 2016).
In terms of communication with providers, all facilities were engaged in these efforts in one way or another, with SBAR reported as being more valued than other INTERACT tools. In 2016, only 46 percent of facilities were classified as highly engaged with the Stop and Watch, the tool used for documenting change in resident condition. To increase use, facilities were retrained on the tools as often as requested and the trainings were tailored to the individual facility’s requirements. Education and training by Jewish Healthcare Foundation (JHF) and Robert Morris University (RMU), where facilities created Individualized Education Plans, were valued at the start of the Initiative, but by Initiative Years 3 and 4 trainings began to taper. Overall, the education provided was well received, even though only 46% of facilities remained engaged in the last year. While the medication review component of UPMC-RAVEN gained momentum later in the Initiative by including the IDT meetings, there was very little facility

202
engagement with this component. Facility staff were mainly unaware of RxPartners and their role; only a third of facilities were highly engaged with this component. Facility staff were generally engaged in UPMC-RAVEN’s end-of-life planning activities, with more than two-thirds of facilities rated by the evaluation team as highly engaged with this component. Most facilities used the POLST form and appreciated conversations UPMC-RAVEN nurses had with families about advance directives and care plans. Engagement with QI activities, such as root cause analysis of acute care transfers, varied by facility and was highly dependent on the presence of the UPMC-RAVEN nurse. In terms of preventing and analyzing PAHs, many facilities reverted to pre-Initiative practices when the UPMC-RAVEN nurse was physically not in the facility: not informing the ECCP nurses about the transfers that occurred and not completing root cause analysis for these transfers. Unlike the other Initiative components, telemedicine received overall support as a concept, but it was characterized by low use of the actual telecarts. Most facilities saw the value in telemedicine and believed it could be effective in reducing potentially avoidable hospitalizations, but connectivity issues and significant amount of time required to complete a telemedicine consult precluded its consistent use. Furthermore, facilities were frustrated by the telemedicine coverage gaps, where consults were only available from 4 p.m. to 10 p.m. on weekdays and 10 a.m. to 6 p.m. on weekends.
Staff Buy-in Staff acceptance of the Initiative was generally high but varied by staff type, with some
pushback from a few CNAs and individual physicians. While NFAs had limited contact with the UPMC-RAVEN nurses, most were supportive of Initiative goals and valued the care the ECCP nurses provided. Similarly, DONs and licensed nursing staff were supportive of the Initiative, most were involved in Initiative components, including the education and training, and benefited from support provided by the UPMC-RAVEN nurses. In many facilities, DONs served as champions for the Initiative by encouraging use of INTERACT tools, attendance in trainings, and use of the UPMC-RAVEN nurses. Licensed nursing staff also had high buy-in to the Initiative, felt comfortable approaching UPMC-RAVEN nurses, and praised the education provided by the Initiative. In some cases, leadership and nurses were less supportive, mostly in facilities with high leadership turnover, where crucial relationships were lacking. Only five NFAs were consistently employed through the entire Initiative, making it difficult to garner buy-in. Compared to other staff, CNAs and physicians had less buy-in to the Initiative. CNAs generally had a limited understanding of the UPMC-RAVEN program and its role. Across all 4 Initiative years, there were reports of individual physician resistance to the Initiative because of fear of the loss of autonomy over residents and the old-school mentality of hospitalizations being a default course. Facility and UPMC-RAVEN staff attributed this behavior to a limited understanding of the Initiative and its goals; the ECCP provider outreach and education was deemed insufficient in gaining full physician buy-in in many facilities. Provider buy-in was gradually improving with each year.
Beneficiary Enrollment and Buy-in Beneficiary enrollment in the Initiative was automatic, with most remaining enrolled
throughout the course of the Initiative; only a few residents opted out, mostly encouraged by physicians’ and resident families’ suspicions of the program. Overall, residents and their families appreciated the UPMC-RAVEN nurses and valued the care they provided, but there was limited understanding of UPMC-RAVEN model. Starting in Initiative Year 2, some residents and
203
families even reported preferring to receive care from their UPMC-RAVEN nurses instead of their physicians. Along with facility staff buy-in, family buy-in was vital to successful implementation of the UPMC-RAVEN model. Families were often the main drivers of hospitalizations because they either did not understand the services that the facility could provide or preferred services provided by the hospital. To mitigate this pressure to hospitalize residents, UPMC-RAVEN nurses and facility staff educated families on the benefits of in-house treatment. Because of this education or a change in mindset, reports of familial pressure to hospitalize decreased over the Initiative years, but pressure on facilities remained.
Outcomes and Successes Overall, UPMC-RAVEN was successful
in increasing facility staff capabilities and facilitating a culture change within facilities; staff reported corresponding reductions in potentially avoidable hospitalizations. The education provided by UPMC-RAVEN’s partners was credited with improving assessment skills and empowering staff. The use of INTERACT tools allowed for more timely identification, documentation, and communica-tion of changes in condition. Furthermore, the culture of the facilities gradually changed as nurses became more confident in their abilities and more educated about the importance of treating residents in the facility. Nurses reported taking the extra time to evaluate the resident and determine if transferring them was the best course of action.
The impact of the Initiative was not restricted to only eligible residents. The increase in staff skills and education impacted all residents in the facility, regardless of eligibility. INTERACT tools and POLST forms were also used facility-wide. Therefore, the Initiative not only improved the outcomes for eligible residents but had a positive impact on all residents. Finally, the increased focus on end-of-life care planning was widely cited as a success. Many facilities reported that most, if not all, of their residents had POLST forms or advance directives in place because of the support provided by the Initiative. The role of the UPMC-RAVEN nurses in care planning and discussing difficult topics such as end-of-life wishes was universally valued.
Best Practices, Sustainability, and Lessons Learned The popularity of the UPMC-RAVEN model can largely be attributed to the UPMC-
RAVEN nurses providing clinical care on facility floors. Without the presence of the nurses, coupled with partial after-hours on-call coverage provided by the telemedicine nurse, often by phone, many facilities felt that the Initiative would not have been successful. In facilities where there were no UPMC-RAVEN nurses due to hiring difficulties, or when the nurse was on vacation or off-site, facilities reverted to “business as usual,” where residents were potentially unnecessarily transferred and INTERACT tool use tapered.

204
One best practice from the UPMC-RAVEN model identified by the evaluation was its leadership structure, particularly the presence of three lead APRNs, overseeing ECCP staff embedded in the facilities. The lead APRNs provided valuable support to facilities and served as back-ups when the facility’s nurse was not available This structure was conducive to having a cohesive, well-functioning team of nurses who felt supported. This feature of the UPMC-RAVEN model contributed to its successful integration into facility culture.
Although the nurse practitioner component was the most popular, it was also the least sustainable: most facilities wanted to keep the APRNs after the end of the Initiative but were unsure of the financial feasibility of doing so, concluding that their facilities were unlikely to afford to hire one. Components such as INTERACT tools, specifically SBAR, were commonly cited as the most sustainable after Initiative completion. However, facilities reported that without the training and support provided by the ECCP, the sustainability of the tools might not be as high as facilities expected. Although the medication review results were only delivered to ECCP nurses, the ECCP nurses felt they have benefited from this additional guidance.
Based on the successes and challenges faced by the UPMC-RAVEN Initiative, there were three main lessons learned. First, early physician buy-in is necessary. Many of the challenges faced by the UPMC-RAVEN nurses and much of the resident opt-out was driven by physicians not understanding the roll of the nurse and the goals of the Initiative. Almost all facilities reported that if more time up front had been spent explaining the Initiative to the physicians, nurses and leadership would not have faced as much pushback. Second, to implement an IT intervention such as telemedicine, more time up front should have been spent assessing IT capabilities in facilities. Without functioning wireless connections or, more generally, staff understanding of technology, telemedicine could not be successful. Because of the delays associated with fixing connectivity issues, installing more user-friendly software, and retraining staff on telemedicine, telemedicine use did not effectively begin until Initiative Year 4. Finally, the intervention would have been more effective with 24/7 nursing coverage. Many facilities reported that their transfers increased at night when the UPMC-RAVEN nurses were unavailable. It was during this time that facilities felt that they needed extra clinical support.
3.7.4 Summary
The UPMC-RAVEN model was centered around APRNs providing resident clinical care in the facilities daily; these APRNs were highly valued by facility staff and leadership, and residents and their families. The ECCP leadership structure provided consistent support to ensure these nurses functioned well in the field by appointing several Lead APRNs to oversee the work of ECCP nurses on the floors. To reduce avoidable hospitalizations, the model also utilized a multiprong education program, INTERACT tools, medication review and management by a consulting pharmacy, EOL care planning, and telemedicine. The Initiative was welcomed in most facilities; APRNs were integrated well and became essential partners in resident care teams.

205
Generally, facility staff interviewed for the evaluation supported the Initiative’s goals and felt that the RAVEN Initiative was achieving the desired outcomes; several facility leaders also reported a change in attitudes towards potentially avoidable hospitalizations and a major related culture shift in facilities. Interviewed facility staff also reported fewer hospitalizations.
These positive findings from field work are largely consistent with the results from the quantitative analyses, where the UMPC-RAVEN intervention was associated with significant reductions on all types of expenditure measures. Although not as strong statistically, the UPMC- RAVEN intervention had a consistent effect in reducing potentially avoidable hospitalizations and ED visits. These results indicate that the model’s strongest component, the full-time presence of highly qualified nurse practitioners on the facility floors, almost all of whom were allowed to write orders as well as provide clinical care to residents and support facility staff and resident families, was effective. The support provided by the UPMC-RAVEN APRNs during their work hours in facilities was strengthened by the after-hours on-call ECCP coverage that was part of RAVEN telemedicine intervention and by medication review and consulting offered by RxPartners. Additionally, the INTERACT training component of the UMPC-RAVEN model increased staff confidence and improved facility nurses’ assessment skills. The APRN component, unlike other model components which had a slow start, was implemented from the very beginning, providing a possible explanation for why the intervention resulted in the greatest reductions in most utilization and expenditure measures in 2014, soon after APRNs started their work.
However, we also found that the intervention effect weakened as the implementation of the Initiative unfolded between 2014–2016. There could be several potential explanations for the weaker findings. As implemented, the UMPC-RAVEN model experienced several barriers and challenges. For example, the implementation of telemedicine experienced several delays and once implemented, faced many challenges, most notably the lack of IT infrastructure in rural facilities. The Initiative was also challenged by the lack of consistent physician buy-in; the buy-in increased as the Initiative unfolded, bringing more practitioners on board. Major turnover among facility leadership and front-line staff necessitated retraining in the Initiative.
Overall, the policy environment in the state may have also contributed to the weaker results in the last 2 years. Evaluation findings indicate that in 2015, Pennsylvania comparison facilities reported a particularly high level of practices similar to some in the Initiative. Notably, 100 percent of responding facilities reported introducing policies or procedures to reduce avoidable hospitalizations. Therefore, it appears that hospitalization reduction efforts became more widespread in the state, which could potentially explain the weakening of the estimated Initiative effects in the later implementation years.
Finally, the evaluation analysis of the MDS-based quality measures for residents enrolled in UPMC-RAVEN showed statistically significant reductions in 2016 for catheters inserted and left in bladder and for one or more falls with major injury. As the Initiative unfolded in Pennsylvania facilities, RAVEN APRNs got more involved in QAPI processes in facilities and offered additional trainings on various topics. Interviews of facility staff revealed that falls and falls prevention was one of the topics offered in training. It is likely that QAPI activities also included the emphasis on reducing the number of permanently inserted catheters, as it is an important indicator of resident quality of care.

206
[This page intentionally left blank.]

207
SECTION 4 INITIATIVE-WIDE ANALYSIS COMBINING ALL STATES
Introduction. Two alternative methods may be used to generate Initiative-wide effect estimates, which we refer to as “separate Initiative method” and “single Initiative method,” as explained below.
The “separate Initiative method” treats each of the ECCPs as a separately defined intervention. Hence, essentially there are seven separate initiatives. The evaluation is done separately for each of the seven interventions as was done in Section 3. Then, using a simple bookkeeping approach, the sum of the seven separately estimated effects on spending can be used to calculate the “bottom line” adding separate programs together. In contrast, the “single Initiative method” treats the Initiative as one program with seven ECCPs that are allowed to implement varying versions of the Initiative. In this method, the combined treatment group includes all the ECCP facilities and the combined comparison group includes all the comparison facilities. The Initiative itself allows variation as opposed to being seven separate initiatives.
Each method has its own assumptions, and the results and conclusions drawn would also be different. The single Initiative method would yield aggregate savings estimates that are more conservative as compared to the separate Initiative method. We believe the “single Initiative method” is best suited for answering the following question: Does the concept of having an ECCP, with flexibility of approach, reduce avoidable hospitalizations and expenditures? We also think this is in line with CMS’s interest in evaluating Initiative-wide effects. Section 3 provides results for each ECCP implementation.
In this section, we present results from a pooled analysis of the Initiative-wide impact on selected utilization, expenditure, and MDS-based quality measures, following the single Initiative method described above. Even though the ECCPs implemented various intervention activities individually, herein the Initiative is treated as a single intervention in the pooled analysis, in which the combined intervention group includes all the ECCP facilities and the combined comparison group includes all the comparison facilities from all seven states. We note again that in Nevada the comparison group is small (smaller than the intervention group) and not propensity matched; in all the remaining states, two comparison facilities were matched for each intervention facility using propensity scores. Despite this limitation, inclusion of Nevada in the pooled analysis would have a limited effect on the estimates of Initiative-wide impact in a difference-in-differences analysis. This approach is also consistent with best practice in an “intention-to-treat” evaluation design, which follows the general principle that all subjects are included in the analysis once assignments (through randomization, propensity matching, etc.) were made to either the treatment group or the control (comparison) group, regardless of subsequent noncompliance, protocol deviations, and withdrawal (Gupta, 2011). Therefore, we did not remove any ECCP or comparison facilities from the pooled analysis reported below.
Viewing the ECCP Initiative in all seven states as a singleintervention, the Initiative was associated with statisticallysignificant reductions in hospitalizations, potentiallyavoidable hospitalizations, ED visits, and potentiallyavoidable ED visits.
The Initiative was associated with statistically significantreductions in spending on all-cause hospitalizations andpotentially avoidable hospitalizations.
The effect estimates also suggested a reduction in totalMedicare spending and in spending on ED visits, but these estimates were not statistically significant.

208
Also of note, on the magnitudes of the Initiative’s effects on utilization of services and associated expenditures, we do not anticipate the relative effects on the utilization counts to always align with those on expenditures. The smaller relative effects on hospital expenditures (as reported below in Table 4-3) could relate to the mix of Diagnosis Related Groups (DRGs) for those sent to the hospital: if they are more severe cases relative to those kept in the nursing facility, then they would have relatively higher DRG weights and higher costs, and therefore, smaller relative reductions in hospital-related expenditures. In this analysis, we were unable to examine the data at such level of detail.
Utilization. Viewing the Initiative in all seven states as a single intervention, the ECCP intervention was associated with reductions in hospitalizations, potentially avoidable hospitalizations, emergency department (ED) visits, and potentially avoidable ED visits. The estimated Initiative-wide intervention period (2014–2016) annual effect was a 2.6 percentage point lower probability of an all-cause hospitalization, a 2.0 percentage point lower probability of a potentially avoidable hospitalization, a 1.5 percentage point lower probability of an ED visit, and a 0.9 percentage point lower probability of a potentially avoidable ED visit. These effect estimates were all statistically significant (Table 4-1). Similarly, there were statistically significant reductions for utilization counts: 0.044, 0.030, 0.026, and 0.011 fewer hospitalizations, potentially avoidable hospitalizations, ED visits, and potentially avoidable ED visits, respectively, per resident per year (Table 4-2). Based on the overall probabilities and rates of these events over the years 2014 through 2016, these represent meaningful reductions. For example, given the overall probability of a potentially avoidable hospitalization of 11.8 percent, the 2.0 percentage point lower probability associated with the Initiative represents a reduction of 17.0 percent. The relative reduction in the count of potentially avoidable hospitalizations was even higher, at 20.8 percent.
Table 4-1 Initiative-wide ECCP effect on probability of any utilization per resident per year during
intervention period, 2014-2016, all 7 states combined
Probability of having at least one:
Mean, 2014-2016 (percent)
Effect (percentage
points) 90% CI 80% CI p-value
Relative effect (% of mean)
All-cause hospitalization 27.6 –2.6 –3.7 –1.6 –3.5 –1.8 <0.001 –9.5 Potentially avoidable hospitalization
11.8 –2.0 –2.7 –1.3 –2.6 –1.4 <0.001 –17.0
All-cause ED visit 19.6 –1.5 –2.6 –0.4 –2.4 –0.6 0.029 –7.6 Potentially avoidable ED visit
7.0 –0.9 –1.5 –0.3 –1.4 –0.4 0.012 –13.2
NOTE: The 2014-2016 mean is the unadjusted mean across all ECCP and comparison residents during the 3-year intervention period, weighted by the number of residents in each year. Bold text indicates statistical significance at the 0.10 level. Standard statistical practice is to use confidence intervals of 90% or higher; 80% confidence intervals are provided here for comparison purposes only. ECCP = Enhanced Care and Coordination Provider; ED = Emergency Department. SOURCE: RTI analysis of Medicare claims data (RTI program ms06; annual_2016\ms01_xtgee).

209
Table 4-2 Initiative-wide ECCP effect on count of utilization per resident per year during
intervention period, 2014-2016, all 7 states combined
Count of: Mean,
2014-2016 Effect 90% CI 80% CI p-value
Relative effect (% of mean)
All-cause hospitalizations 0.413 –0.044 –0.066 –0.021 –0.061 –0.026 <0.001 –10.6 Potentially avoidable hospitalizations
0.142 –0.030 –0.039 –0.020 –0.037 –0.022 <0.001 –20.8
All-cause ED visits 0.281 –0.026 –0.047 –0.006 –0.042 –0.010 0.035 –9.3 Potentially avoidable ED visits
0.080 –0.011 –0.019 –0.004 –0.017 –0.005 0.014 –13.9
NOTE: The 2014-2016 mean is the unadjusted mean across all ECCP and comparison residents during the 3-year intervention period, weighted by the number of residents in each year. Bold text indicates statistical significance at the 0.10 level. Standard statistical practice is to use confidence intervals of 90% or higher; 80% confidence intervals are provided here for comparison purposes only. ECCP = Enhanced Care and Coordination Provider; ED = Emergency Department. SOURCE: RTI analysis of Medicare claims data (RTI program ms07; annual_2016\ms03_xtgee).
Medicare Expenditures. The finding that the Initiative was associated with reductions in both the probabilities and counts of all-cause hospitalizations and potentially avoidable hospitalizations is further bolstered by the finding that the Initiative was associated with meaningful and statistically significant reductions in expenditures on all-cause hospitalizations and potentially avoidable hospitalizations. The estimated intervention period annual effects on expenditures for ED visits and potentially avoidable ED visits both had negative signs indicating reductions, but were small in magnitude and were not statistically significant. The estimated effect on total Medicare expenditures was a reduction of $714 per resident per year, a 3.1 percent reduction based on average annual spending of $23,311. Although this estimate was not statistically significant, the 90% confidence interval around it suggests most likely a reduction rather than an increase (Table 4-3).
Quality. We evaluated the impact of the Initiative in all seven states as a single intervention on decline in activities of daily living (ADLs) and antipsychotic medication use. These two Minimum Data Set (MDS)-based quality measures showed consistent patterns in the year-specific effects across states and years, with very few exceptions. Therefore, it is more likely to detect a consistent effect of the Initiative in all seven states as a single intervention on these two MDS-based quality measures. We examined the impact of the Initiative on other MDS-based quality measures focused on the state-specific and year-specific effects (see Section 3).
The Initiative was associated with an increase of 0.3 percentage points in the average percent of observed quarters per resident with ADL decline, indicating an undesirable effect, and a decline of 0.6 percentage points in the average percent of observed quarters per resident with use of antipsychotic medications, indicating an improvement in quality (Table 4-4). These effect sizes are small in magnitude, and not statistically significant. These statistically insignificant results,

210
even with the large sample size across states and years, suggest no clear evidence for an impact of the Initiative on MDS-based quality measures. This finding is consistent with the findings from the state-specific and year-specific analyses on all MDS-based quality measures (see Section 3).
Table 4-3 Initiative-wide ECCP effect on Medicare expenditures per resident per year during
intervention period, 2014-2016, all 7 states combined
Medicare expenditures for:
Mean, 2014-2016
($) Effect ($) 90% CI 80% CI p-value
Relative effect (% of mean)
Total 23,311 –714 –1,561 134 –1,374 –53 0.166 –3.1 All-cause hospitalizations 5,467 –512 –780 –245 –721 –304 0.002 –9.4 Potentially avoidable hospitalizations
1,416 –248 –352 –143 –329 –166 <0.001 –17.5
All-cause ED visits 162 –2 –13 10 –11 8 0.835 –0.9 Potentially avoidable ED visits 49 –2 –7 3 –6 2 0.476 –4.3
NOTE: The 2014-2016 mean is the unadjusted mean across all ECCP and comparison residents during the 3-year intervention period, weighted by the number of residents in each year. Bold text indicates statistical significance at the 0.10 level. Standard statistical practice is to use confidence intervals of 90% or higher; 80% confidence intervals are provided here for comparison purposes only. ECCP = Enhanced Care and Coordination Provider; ED = Emergency Department. SOURCE: RTI analysis of Medicare claims data (RTI program ms08; annual_2016\ms04_glm and ms04_tpm).
Table 4-4 Initiative-wide ECCP effect on MDS-based quality measures (percent of observed quarters
with event per resident per year) during intervention period, 2014-2016, all 7 states combined
MDS-based quality measures:
Mean, 2014-2016 (percent)
Effect (percentage
points) 90% CI 80% CI p-value
Relative effect (% of mean)
Decline in ADLs 14.4 0.3 –0.7 1.3 –0.5 1.1 0.620 2.1 Antipsychotic medication use 18.0 –0.6 –1.8 0.6 –1.5 0.3 0.441 –3.3
NOTE: The 2014-2016 mean is the unadjusted mean across all ECCP and comparison residents during the 3-year intervention period, weighted by the number of residents in each year. Bold text indicates statistical significance at the 0.10 level. Standard statistical practice is to use confidence intervals of 90% or higher; 80% confidence intervals are provided here for comparison purposes only. ADL = Activities of Daily Living; ECCP = Enhanced Care and Coordination Provider; MDS = Minimum Data Set. SOURCE: RTI analysis of MDS assessments data (RTI program jw20; annual_2016\qm).

211
SECTION 5 AGGREGATE ESTIMATES OF THE INITIATIVE’S IMPACT ON MEDICARE
EXPENDITURES
In this section, we present the effects of the Enhanced Care and Coordination Provider (ECCP) intervention on aggregate Medicare expenditures. Using the intervention period annual effect estimates (both the state-specific effects as presented in Section 3 and the Initiative-wide effects in Section 4), we calculate the aggregate effects of the Initiative from 2014–2016 based on the number of participants each year, summed over this 3-year period.
In addition, we present estimates of the probability that the Initiative achieved the specific savings objectives: that total Medicare expenditures were reduced, that Medicare expenditures for all-cause hospitalizations were reduced, and that Medicare expenditures for potentially avoidable hospitalizations were reduced. For total Medicare expenditures we account for the grants provided by the Centers for Medicare & Medicaid Services (CMS) to the ECCPs to derive estimates of net savings or costs. There was no set target for program savings or reductions in any of these expenditures. The interest is in the probability of achieving any savings or reductions in spending that are significantly different from zero.
The estimated aggregate impact of the Initiative on total Medicare expenditures based on the Initiative-wide effect estimate was a reduction in spending of $48,036,859 over the 3-year intervention period, 2014–2016 (Table 5-1). However, after accounting for the grants provided to all the ECCPs, the estimated total impact was a net cost of $28,062,442. Neither estimate was statistically significant. When examining the Initiative separately in each state, there were estimated aggregate spending reductions in six out of seven states. After accounting for the grant provided to each ECCP, there were estimated aggregate savings in four out of seven states (statistically significant only in one state).
Using year-specific effect estimates, the estimated aggregate impact of the Initiative on total Medicare expenditures based on the Initiative-wide effect estimate was a reduction in spending of $15,766,161 in 2014 (Table 5-2), $17,090,584 in 2015 (Table 5-3), and $15,404,844 in 2016 (Table 5-4). After accounting for the grants, the estimated total impact was a net cost of $9,410,639 in 2014, $8,305,461 in 2015, and $10,121,612 in 2016. None of these estimates were statistically significant.40
40 The numbers in these tables do not match those presented in tables in the prior Project Year 3 (Table ES-8) and Project Year 4 (Table ES-8) Annual Reports. The cumulative amounts across ECCPs in those reports were computed by summing the effects of the ECCPs as independent Initiatives. As described previously in the introduction of Section 4, where the per resident per year effects were presented, we here treat the aggregate expenditure effects with the single initiative approach, pooling all the Initiative facilities and comparing to the pooled comparison facilities.
Viewing the ECCP Initiative in all seven states as a singleintervention, the estimated aggregate impact on totalMedicare services expenditures was a reduction of$48,036,859 over the three-year intervention period,2014–2016. However, after accounting for the grantsprovided to all the ECCPs, the estimated total impact wasa net cost of $28,062,442 (not statistically significant).
When examining the Initiative separately in each state,there were estimated aggregate reductions in six out ofseven states. After accounting for the grant provided toeach ECCP, there were estimated aggregate savings infour out of seven states (statistically significant only inone state).
There is strong evidence for reductions in Medicareexpenditures for all-cause hospitalizations and potentiallyavoidable hospitalizations.

212
Not accounting for CMS grants to the ECCPs, there is solid evidence for reductions in Medicare expenditures for all-cause hospitalizations and potentially avoidable hospitalizations. Based on the Initiative-wide effect estimate, the estimated aggregate impact of the Initiative on Medicare expenditures for all-cause hospitalizations was a reduction of $34,485,205 (Table 5-5), and a reduction of $16,668,002 for potentially avoidable hospitalizations (Table 5-6). These effect estimates were statistically significant. The estimated aggregate, Initiative-wide, impact on Medicare expenditures for all-cause ED visits (Table 5-7), and potentially avoidable ED visits (Table 5-8), were relatively small and not statistically significant.
For total Medicare expenditures, we estimated a 21 percent probability that the Initiative was cost-saving after accounting for CMS grants given to the ECCPs; the probability of any reduction in total Medicare expenditures, not accounting for CMS grants, is about 92 percent (Table 5-9). For Medicare expenditures on inpatient services, for both all-cause hospitalizations and potentially avoidable hospitalizations, we estimated that the probability of spending reductions, not accounting for the grants, was greater than 99 percent.

213
Table 5-1 Total Medicare expenditures: by state and Initiative-wide total estimates of intervention-associated reduction/increase, 2014–
2016 (Reductions in spending are indicated by negative quantities in parentheses)
State
Number Participants Each Year, Summed,
2014–2016
Intervention Period Effect on Spending:
(Reduction)/Increase Per Participant Per Year
Total ECCP Effect on Spending: (Reduction)/Increase, 2014–2016
Total Grant for Initiative, 2014–2016 $
Total Initiative Net (Savings)/Costs, 2014–2016a
Estimate $ 90% CI 80% CI Estimate $
90% CI 80% CI Estimate $
90% CI 80% CI
AL 9,867 147 (1,286), 1,580 (970), 1,263
1,449,186 (12,686,579), 15,584,951 (9,567,258), 12,465,630
11,368,402 12,817,588 (1,318,177), 26,953,353 1,801,144 , 23,834,032
IN 8,469 (1,589) (2,966), (211) (2,662), (515)
(13,456,242) (25,122,498), (1,789,985) (22,548,120), (4,364,363)
10,042,277 (3,413,965) (15,080,221), 8,252,292 (12,505,843), 5,677,914
MO 6,895 (1,241) (2,403), (79) (2,146), (335)
(8,555,233) (16,565,885), (544,581) (14,798,185), (2,312,281)
11,762,469 3,207,236 (4,803,416), 11,217,888 (3,035,716), 9,450,188
NE 3,976 (1,554) (3,495), 387 (3,066), (41)
(6,177,185) (13,894,632), 1,540,262 (12,191,633), (162,737)
3,454,775 (2,722,410) (10,439,857), 4,995,037 (8,736,858), 3,292,038
NV 9,911 (4,853) (8,096), (1,611) (7,380), (2,327)
(48,102,632) (80,238,518), (15,966,746) (73,147,134), (23,058,130)
10,201,107 (37,901,525) (70,037,411), (5,765,639) (62,946,027), (12,857,023)
NY 20,474 (556) (3,127), 2,014 (2,559), 1,447
(11,386,799) (64,016,935), 41,243,336 (52,403,111), 29,629,513
15,258,509 3,871,710 (48,758,426), 56,501,845 (37,144,602), 44,888,022
PA 7,723 (2,513) (3,929), (1,097) (3,617), (1,409)
(19,407,528) (30,345,287), (8,469,769) (27,931,666), (10,883,390)
14,011,762 (5,395,766) (16,333,525), 5,541,993 (13,919,904), 3,128,372
Allb 67,315 (714) (1,561), 134 (1,374), (53)
(48,036,859) (105,081,386), 9,007,668 (92,493,445), (3,580,273)
76,099,301 28,062,442 (28,982,085), 85,106,969 (16,394,144), 72,519,028
NOTES: Bold numbers indicate statistical significance at the 0.10 level. Standard statistical practice is to use confidence intervals of 90% or higher; 80% confidence intervals are provided here for comparison purposes only. a Total Initiative Net (Savings)/Costs are the net balance between [Total ECCP Effect on Spending: (Reduction)/Increase] and [Total Grant for Initiative]. b Estimates are based on a pooled analysis, treating the Initiative in all seven states as a single intervention (see Section 4 for more detailed explanations). ECCP = Enhanced Care and Coordination Provider. SOURCE: RTI program annual_2016/ms04_glm.

214
Table 5-2 Total Medicare expenditures: by state and Initiative-wide total estimates of intervention-associated reduction/increase, 2014
(Reductions in spending are indicated by negative quantities in parentheses)
State
Number of ECCP
participants 2014
Effect on spending: (reduction)/increase per
participant per year, 2014 Total ECCP effect on spending:
(reduction)/increase, 2014 Total grant for initiative, 2014 $
Total initiative net (savings)/costs, 2014a
Estimate $ 90% CI 80% CI Estimate $
90% CI 80% CI Estimate $
90% CI 80% CI
AL 3,288 (112) (1,569), 1,344 (1,247), 1,023
(369,210) (5,157,639), 4,419,220 (4,100,982), 3,362,563
3,799,179 3,429,969 (1,358,460), 8,218,399 (301,803), 7,161,742
IN 2,949 (1,406) (2,853), 42 (2,534), (278)
(4,145,439) (8,413,538), 122,660 (7,471,702), (819,175)
3,135,477 (1,009,962) (5,278,061), 3,258,137 (4,336,225), 2,316,302
MO 2,302 (79) (1,744), 1,587 (1,377), 1,219
(181,329) (4,015,529), 3,652,872 (3,169,441), 2,806,784
3,608,119 3,426,790 (407,410), 7,260,991 438,678, 6,414,903
NE 1,478 (1,526) (3,879), 827 (3,359), 308
(2,255,325) (5,732,428), 1,221,779 (4,965,141), 454,491
1,032,969 (1,222,356) (4,699,459), 2,254,748 (3,932,172), 1,487,460
NV 3,463 (3,103) (6,266), 60 (5,568), (638)
(10,746,001) (21,698,294), 206,293 (19,281,466), (2,210,535)
3,445,884 (7,300,117) (18,252,410), 3,652,177 (15,835,582), 1,235,349
NY 7,033 (1,316) (4,452), 1,819 (3,760), 1,127
(9,256,912) (31,309,589), 12,795,765 (26,443,253), 7,929,430
5,283,651 (3,973,261) (26,025,938), 18,079,416 (21,159,602), 13,213,081
PA 2,731 (3,861) (5,652), (2,070) (5,257), (2,465)
(10,543,927) (15,435,310), (5,652,543) (14,355,935), (6,731,918)
4,871,521 (5,672,406) (10,563,789), (781,022) (9,484,414), (1,860,397)
Allb 23,244 (678) (1,588), 232 (1,387), 31
(15,766,161) (36,913,992), 5,381,669 (32,247,328), 715,005
25,176,800 9,410,639 (11,737,192), 30,558,469 (7,070,528), 25,891,805
NOTES: Bold numbers indicate statistical significance at the 0.10 level. Standard statistical practice is to use confidence intervals of 90% or higher; 80% confidence intervals are provided here for comparison purposes only. a Total Initiative Net (Savings)/Costs are the net balance between [Total ECCP Effect on Spending: (Reduction)/Increase] and [Total Grant for Initiative]. b Estimates are based on a pooled analysis, treating the Initiative in all seven states as a single intervention (see Section 4 for more detailed explanations). ECCP = Enhanced Care and Coordination Provider. SOURCE: RTI program annual_2016/ms04_glm.
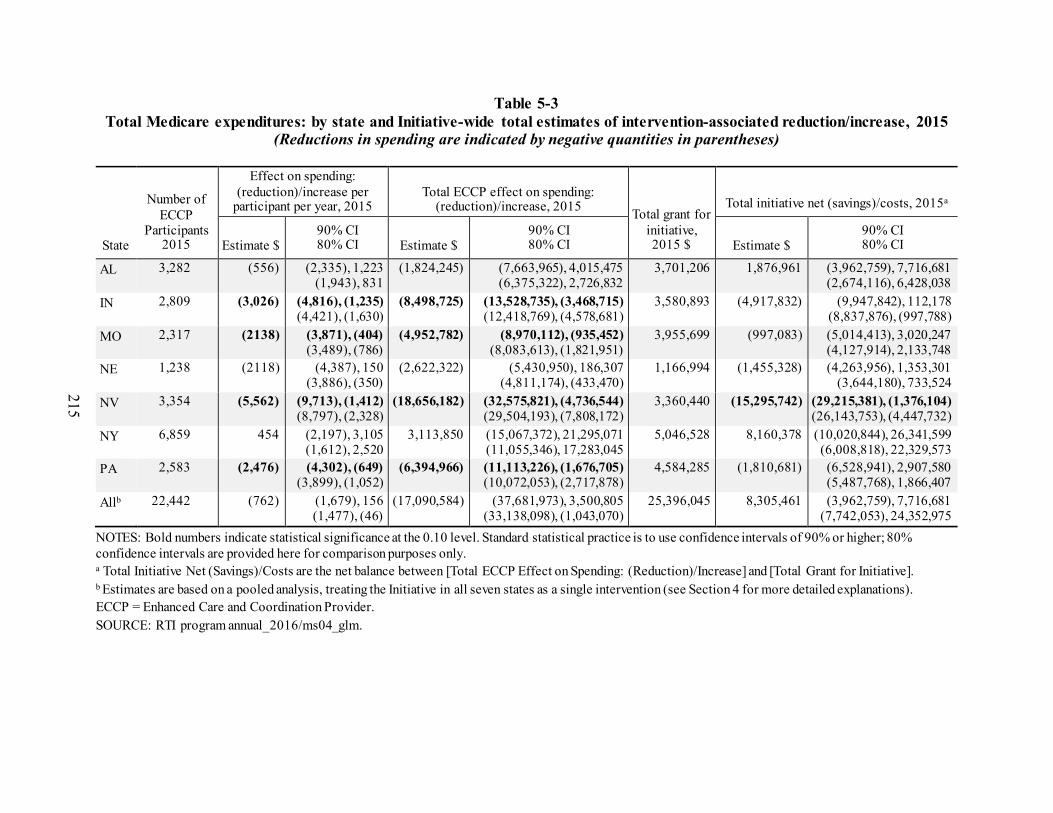
215
Table 5-3 Total Medicare expenditures: by state and Initiative-wide total estimates of intervention-associated reduction/increase, 2015
(Reductions in spending are indicated by negative quantities in parentheses)
State
Number of ECCP
Participants 2015
Effect on spending: (reduction)/increase per
participant per year, 2015 Total ECCP effect on spending:
(reduction)/increase, 2015 Total grant for initiative, 2015 $
Total initiative net (savings)/costs, 2015a
Estimate $ 90% CI 80% CI Estimate $
90% CI 80% CI Estimate $
90% CI 80% CI
AL 3,282 (556) (2,335), 1,223 (1,943), 831
(1,824,245) (7,663,965), 4,015,475 (6,375,322), 2,726,832
3,701,206 1,876,961 (3,962,759), 7,716,681 (2,674,116), 6,428,038
IN 2,809 (3,026) (4,816), (1,235) (4,421), (1,630)
(8,498,725) (13,528,735), (3,468,715) (12,418,769), (4,578,681)
3,580,893 (4,917,832) (9,947,842), 112,178 (8,837,876), (997,788)
MO 2,317 (2138) (3,871), (404) (3,489), (786)
(4,952,782) (8,970,112), (935,452) (8,083,613), (1,821,951)
3,955,699 (997,083) (5,014,413), 3,020,247 (4,127,914), 2,133,748
NE 1,238 (2118) (4,387), 150 (3,886), (350)
(2,622,322) (5,430,950), 186,307 (4,811,174), (433,470)
1,166,994 (1,455,328) (4,263,956), 1,353,301 (3,644,180), 733,524
NV 3,354 (5,562) (9,713), (1,412) (8,797), (2,328)
(18,656,182) (32,575,821), (4,736,544) (29,504,193), (7,808,172)
3,360,440 (15,295,742) (29,215,381), (1,376,104) (26,143,753), (4,447,732)
NY 6,859 454 (2,197), 3,105 (1,612), 2,520
3,113,850 (15,067,372), 21,295,071 (11,055,346), 17,283,045
5,046,528 8,160,378 (10,020,844), 26,341,599 (6,008,818), 22,329,573
PA 2,583 (2,476) (4,302), (649) (3,899), (1,052)
(6,394,966) (11,113,226), (1,676,705) (10,072,053), (2,717,878)
4,584,285 (1,810,681) (6,528,941), 2,907,580 (5,487,768), 1,866,407
Allb 22,442 (762) (1,679), 156 (1,477), (46)
(17,090,584) (37,681,973), 3,500,805 (33,138,098), (1,043,070)
25,396,045 8,305,461 (3,962,759), 7,716,681 (7,742,053), 24,352,975
NOTES: Bold numbers indicate statistical significance at the 0.10 level. Standard statistical practice is to use confidence intervals of 90% or higher; 80% confidence intervals are provided here for comparison purposes only. a Total Initiative Net (Savings)/Costs are the net balance between [Total ECCP Effect on Spending: (Reduction)/Increase] and [Total Grant for Initiative]. b Estimates are based on a pooled analysis, treating the Initiative in all seven states as a single intervention (see Section 4 for more detailed explanations). ECCP = Enhanced Care and Coordination Provider. SOURCE: RTI program annual_2016/ms04_glm.

216
Table 5-4 Total Medicare expenditures: by state and Initiative-wide total estimates of intervention-associated reduction/increase, 2016
(Reductions in spending are indicated by negative quantities in parentheses)
State
Number of ECCP
Participants 2016
Effect on spending: (reduction)/increase per
participant per year, 2016 Total ECCP effect on spending:
(reduction)/increase, 2016 Total grant for initiative, 2016 $
Total initiative net (savings)/costs, 2016a
Estimate $ 90% CI 80% CI Estimate $
90% CI 80% CI Estimate $
90% CI 80% CI
AL 3,297 576 (1,121), 2,272 (747), 1,898
1,897,736 (3,696,882), 7,492,355 (2,462,325), 6,257,798
3,868,017 5,765,753 171,135, 11,360,372 1,405,692, 10,125,815
IN 2,711 (902) (2,588), 783 (2,216), 411
(2,446,313) (7,015,570), 2,122,943 (6,007,278), 1,114,651
3,325,907 879,594 (3,689,663), 5,448,850 (2,681,371), 4,440,558
MO 2,276 (1,376) (2,879), 127 (2,547), (205)
(3,132,065) (6,552,073), 287,943 (5,797,384), (466,746)
4,198,651 1,066,586 (2,353,422), 4,486,594 (1,598,733), 3,731,905
NE 1,260 (2,177) (3,838), (516) (3,471), (883)
(2,742,970) (4,835,524), (650,415) (4,373,763), (1,112,176)
1,254,812 (1,488,158) (3,580,712), 604,397 (3,118,951), 142,636
NV 3,094 (3,925) (7,689), (160) (6,859), (990)
(12,142,589) (23,791,204), (493,973) (21,220,720), (3,064,458)
3,394,783 (8,747,806) (20,396,421), 2,900,810 (17,825,937), 330,325
NY 6,582 573 (2,517), 3,662 (1,835), 2,980
3,768,522 (16,566,323), 24,103,367 (12,079,059), 19,616,104
4,928,330 8,696,852 (11,637,993), 29,031,697 (7,150,729), 24,544,434
PA 2,409 (2217) (3,931), (503) (3,553), (881)
(5,341,097) (9,470,824), (1,211,371) (8,559,522), (2,122,673)
4,555,956 (785,141) (4,914,868), 3,344,585 (4,003,566), 2,433,283
Allb 21,629 (712) (1,720), 295 (1,497), 73
(15,404,844) (37,195,339), 6,385,651 (32,386,859), 1,577,171
25,526,456 10,121,612 (11,668,883), 31,912,107 (6,860,403), 27,103,627
NOTES: Bold numbers indicate statistical significance at the 0.10 level. Standard statistical practice is to use confidence intervals of 90% or higher; 80% confidence intervals are provided here for comparison purposes only. a Total Initiative Net (Savings)/Costs are the net balance between [Total ECCP Effect on Spending: (Reduction)/Increase] and [Total Grant for Initiative]. b Estimates are based on a pooled analysis, treating the Initiative in all seven states as a single intervention (see Section 4 for more detailed explanations). ECCP = Enhanced Care and Coordination Provider. SOURCE: RTI program annual_2016/ms04_glm.

217
Table 5-5 Medicare expenditures for all-cause hospitalizations: By state and Initiative-wide total
estimates of intervention-associated reduction/increase, 2014–2016 (Reductions in spending are indicated by negative quantities in parentheses)
State
Number of Participants Each Year, Summed,
2014–2016
Intervention Period Effect on Spending: (Reduction)/Increase Per Participant
Per Year
Total ECCP Effect on Spending: (Reduction)/Increase,
2014–2016
Estimate $ 90% CI 80% CI Estimate $
90% CI 80% CI
AL 9,867 103 (282), 488 (197), 403
1,017,288 (2,779,469), 4,814,045 (1,941,644), 3,976,219
IN 8,469 (888) (1,446), (330) (1,323), (453)
(7,521,675) (12,248,175), (2,795,175) (11,205,184), (3,838,165)
MO 6,895 (1,153) (1,536), (769) (1,452), (854)
(7,946,791) (10,592,365), (5,301,217) (10,008,570), (5,885,012)
NE 3,976 (802) (1,341), (263) (1,222), (382)
(3,189,627) (5,331,745), (1,047,508) (4,859,047), (1,520,207)
NV 9,911 (1,581) (2,506), (656) (2,302), (860)
(15,672,185) (24,839,240), (6,505,130) (22,816,358), (8,528,012)
NY 20,474 (614) (1,514), 286 (1,315), 87
(12,574,598) (30,995,828), 5,846,631 (26,930,839), 1,781,642
PA 7,723 (1,070) (1,541), (600) (1,437), (704)
(8,267,217) (11,902,854), (4,631,579) (11,100,583), (5,433,850)
Alla 67,315 (512) (780), (245) (721), (304)
(34,485,205) (52,490,087), (16,480,323) (48,516,974), (20,453,437)
NOTES: Bold numbers indicate statistical significance at the 0.10 level. Standard statistical practice is to use confidence intervals of 90% or higher; 80% confidence intervals are provided here for comparison purposes only. a Estimates are based on a pooled analysis, treating the Initiative in all seven states as a single intervention (see Section 4 for more detailed explanations). ECCP = Enhanced Care and Coordination Provider. SOURCE: RTI program annual_2016/ms04_tpm.
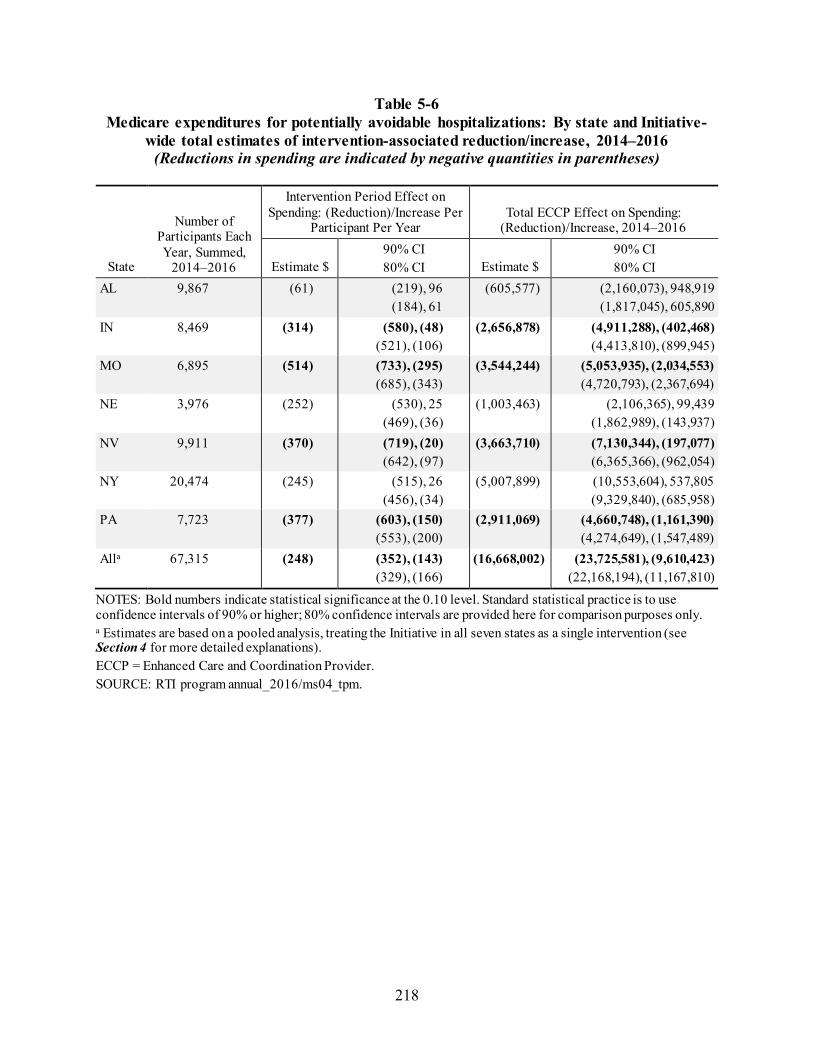
218
Table 5-6 Medicare expenditures for potentially avoidable hospitalizations: By state and Initiative-
wide total estimates of intervention-associated reduction/increase, 2014–2016 (Reductions in spending are indicated by negative quantities in parentheses)
State
Number of Participants Each Year, Summed,
2014–2016
Intervention Period Effect on Spending: (Reduction)/Increase Per
Participant Per Year Total ECCP Effect on Spending:
(Reduction)/Increase, 2014–2016
Estimate $ 90% CI 80% CI Estimate $
90% CI 80% CI
AL 9,867 (61) (219), 96 (184), 61
(605,577) (2,160,073), 948,919 (1,817,045), 605,890
IN 8,469 (314) (580), (48) (521), (106)
(2,656,878) (4,911,288), (402,468) (4,413,810), (899,945)
MO 6,895 (514) (733), (295) (685), (343)
(3,544,244) (5,053,935), (2,034,553) (4,720,793), (2,367,694)
NE 3,976 (252) (530), 25 (469), (36)
(1,003,463) (2,106,365), 99,439 (1,862,989), (143,937)
NV 9,911 (370) (719), (20) (642), (97)
(3,663,710) (7,130,344), (197,077) (6,365,366), (962,054)
NY 20,474 (245) (515), 26 (456), (34)
(5,007,899) (10,553,604), 537,805 (9,329,840), (685,958)
PA 7,723 (377) (603), (150) (553), (200)
(2,911,069) (4,660,748), (1,161,390) (4,274,649), (1,547,489)
Alla 67,315 (248) (352), (143) (329), (166)
(16,668,002) (23,725,581), (9,610,423) (22,168,194), (11,167,810)
NOTES: Bold numbers indicate statistical significance at the 0.10 level. Standard statistical practice is to use confidence intervals of 90% or higher; 80% confidence intervals are provided here for comparison purposes only. a Estimates are based on a pooled analysis, treating the Initiative in all seven states as a single intervention (see Section 4 for more detailed explanations). ECCP = Enhanced Care and Coordination Provider. SOURCE: RTI program annual_2016/ms04_tpm.

219
Table 5-7 Medicare expenditures for all-cause ED visits: By state and Initiative-wide total estimates
of intervention-associated reduction/increase, 2014–2016 (Reductions in spending are indicated by negative quantities in parentheses)
State
Number of Participants Each Year, Summed,
2014–2016
Intervention Period Effect on Spending: (Reduction)/Increase Per Participant Per Year
Total ECCP Effect on Spending: (Reduction)/Increase, 2014–2016
Estimate $ 90% CI 80% CI Estimate $
90% CI 80% CI
AL 9,867 (33) (54), (12) (49), (17)
(326,479) (532,388), (120,570) (486,951), (166,008)
IN 8,469 (15) (48), 18 (41), 11
(126,628) (405,913), 152,656 (344,284), 91,027
MO 6,895 (62) (90), (35) (84), (41)
(430,407) (622,216), (238,597) (579,890), (280,924)
NE 3,976 69 10, 128 23, 115
274,431 40,477, 508,386 92,103, 456,759
NV 9,911 61 1, 121 14, 108
602,797 7,064, 1,198,530 138,523, 1,067,071
NY 20,474 (11) (28), 7 (24), 3
(221,344) (578,956), 136,267 (500,042), 57,353
PA 7,723 (33) (61), (4) (55), (10)
(252,743) (473,227), (32,259) (424,573), (80,913)
Alla 67,315 (2) (13), 10 (11), 8
(100,973) (896,590), 694,645 (721,022), 519,077
NOTES: Bold numbers indicate statistical significance at the 0.10 level. Standard statistical practice is to use confidence intervals of 90% or higher; 80% confidence intervals are provided here for comparison purposes only. a Estimates are based on a pooled analysis, treating the Initiative in all seven states as a single intervention (see Section 4 for more detailed explanations). ECCP = Enhanced Care and Coordination Provider. SOURCE: RTI program annual_2016/ms04_tpm.

220
Table 5-8 Medicare expenditures for potentially avoidable ED visits: By state and Initiative-wide
total estimates of intervention-associated reduction/increase, 2014–2016 (Reductions in spending are indicated by negative quantities in parentheses)
State
Number of Participants Each Year, Summed,
2014–2016
Intervention Period Effect on Spending: (Reduction)/Increase Per
Participant Per Year Total ECCP Effect on Spending:
(Reduction)/Increase, 2014–2016
Estimate $ 90% CI 80% CI Estimate $
90% CI 80% CI
AL 9,867 (10) (20), (0) (18), (3)
(101,403) (199,634), (3,172) (177,958), (24,848)
IN 8,469 (12) (27), 2 (24), (1)
(105,575) (232,003), 20,854 (204,104), (7,045)
MO 6,895 (21) (34), (9) (31), (11)
(146,381) (233,195), (59,567) (214,038), (78,724)
NE 3,976 29 (1), 59 5, 52
113,797 (5,306), 232,900 20,977, 206,618
NV 9,911 40 6, 74 14, 66
397,173 62,412, 731,935 136,283, 658,064
NY 20,474 (4) (11), 3 (9), 2
(74,751) (217,586), 68,085 (186,067), 36,566
PA 7,723 (18) (28), (8) (26), (10)
(140,057) (215,724), (64,390) (199,026), (81,087)
Alla 67,315 (2) (7), 3 (6), 2
(142,169) (470,050), 185,712 (397,697), 113,359
NOTES: Bold numbers indicate statistical significance at the 0.10 level. Standard statistical practice is to use confidence intervals of 90% or higher; 80% confidence intervals are provided here for comparison purposes only. a Estimates are based on a pooled analysis, treating the Initiative in all seven states as a single intervention (see Section 4 for more detailed explanations). ECCP = Enhanced Care and Coordination Provider. SOURCE: RTI program annual_2016/ms04_tpm.

221
Table 5-9 Probability of any (greater than $0) overall savings or reductions in Medicare spending:
Initiative-wide intervention effect during intervention period, 2014–2016, all 7 states combined
Medicare expenditure category Probability of any (greater than $0) savings or spending reductions (%)
Total Medicare expenditures, accounting for CMS grants to ECCPs 20.92 Total Medicare expenditures, not accounting for CMS grants to ECCPs 91.70 Expenditures for all-cause hospitalizationsa 99.92 Expenditures for potentially avoidable hospitalizationsa 99.99
NOTES: Detailed information about how the probability of savings and spending reductions were calculated are provided in Appendix A. a The probabilities of spending reductions for all-cause and potentially avoidable hospitalizations do not take into account CMS grants to ECCPs as it is not possible to determine the amount of each grant that contributed to each of these measures. SOURCES: RTI program annual_2016\ms04_glm and ms04_tpm.

222
[This page intentionally left blank.]

223
SECTION 6 DISCUSSION
6.1 Initiative-Wide Impact of ECCP Interventions
In order to assess the Initiative as a whole, the quantitative data analysis team treated all interventions across the seven Enhanced Care and Coordination Providers (ECCPs) as one single intervention and combined data from all seven states in a pooled analysis.41 The results showed that implementation of the Initiative led to statistically significant reductions in 10 of the 13 Medicare utilization and expenditure measures evaluated for long-stay nursing facility residents participating in the Initiative during the intervention period, 2014–2016, relative to residents in the comparison group (Table 6-1, last column). These reductions were consistently demonstrated in both forms of the utilization measures—probabilities and counts of all-cause hospitalizations, potentially avoidable hospitalizations, all-cause emergency department (ED) visits, and potentially avoidable ED visits—and in Medicare expenditures for all-cause hospitalizations and for potentially avoidable hospitalizations. The effect estimates also point to reductions, although not statistically significant, in total Medicare spending and in spending on all-cause ED visits and potentially avoidable ED visits. Overall, these findings provide persuasive evidence of the Initiative’s effectiveness in reducing hospital inpatient admissions, ED visits, and hospitalization-related Medicare expenditures.
Across all Initiative years, the qualitative data collection team identified several factors that ECCP and facility interviewees highlighted as contributing to the success of the Initiative. Ultimately, the overarching accomplishments of the Initiative hinge on the presence of the ECCP nurses who can provide an “extra set of hands” in facilities. Whether these nurses provide clinical care and education or education only, the facility interviewees generally were very positive about the role of the ECCP nurses and their ability to enhance the quality of care that facility residents receive. Feedback from most facilities indicated that staff and leadership felt the Initiative has had a beneficial effect on reducing avoidable hospitalizations. Interview data suggest there has been a generally positive reception to the Initiative across ECCPs, with facility staff and leadership expressing interest in sustaining many Initiative components as permanent facility functions.
41 As noted earlier, the pooled analysis included all the ECCP and comparison facilities from all seven states, to be consistent with an “intention-to-treat” evaluation design. In Nevada, the comparison group was limited to a small number of non-ECCP facilities not matched on propensity scores, in contrast to the larger, propensity-matched comparison groups used in other states. The contribution of Nevada to the whole group is not a large one.
KEY FINDINGS
During the intervention period (2014–2016), the Initiativeled to statistically significant reductions in 10 of the 13 Medicare utilization and expenditure measures for participating residents relative to residents in the comparison group.
The effectiveness of the Initiative interventions wasenhanced by the consistent presence of ECCP nurses who provided a knowledgeable extra set of hands in facilities, particularly when assisting with clinical care.

224
6.2 Variations in Intervention Effects Across ECCPs and Across Measures
Results from state-specific analyses reveal a great deal of unevenness in the strength of evidence of the Initiative’s impact, both across the ECCPs and across measures (Table 6-1). This would be expected, as the Initiative did vary in specific interventions and challenges across the ECCPs. Judged by the count of favorable (i.e., reductions in measures) and statistically significant effects across the 13 utilization and expenditure measures evaluated for each ECCP during the intervention period, 2014–2016, the ECCP in Missouri stands out as the strongest performer (with favorable and statistically significant effects on all 13 measures), followed by the ECCPs in Pennsylvania (10), Indiana (7), Alabama (7), Nevada (5), New York (3), and Nebraska (1). In Indiana and Pennsylvania, no unfavorable (i.e., increase in an measure) ECCP effect on any measure was observed. In Alabama, two unfavorable effects were observed (suggesting an increase in total Medicare spending and spending on all-cause hospitalizations), but neither of them was statistically significant. In New York, although the ECCP intervention was associated with statistically significant reductions in only 3 measures (probability of all-cause hospitalizations, probability of potentially avoidable hospitalizations, and count of potentially avoidable hospitalizations), findings showed favorable but statistically insignificant effects on the remaining 10 measures. In contrast, both Nebraska and Nevada showed the greatest number of unfavorable effects, suggesting an increase in 6 of the 13 measures (all pertaining to ED visits and related expenditures) in each state, and at least one of them was statistically significant in each state. The observed increases in outpatient ED visits and related expenditures in Nebraska and Nevada should be viewed in the context of decreased hospitalizations and related expenditures, suggesting a possible substitution of outpatient ED visits for inpatient admissions.
The combined evidence from quantitative and qualitative analyses suggests that ECCP models in which nurses provided only education had smaller and less consistent effects, compared to models in which nurses provided regular hands-on clinical care. In particular, the Indiana, Missouri, and Pennsylvania ECCP models included consistent, hands-on clinical care for residents provided by full-time nurses on a daily basis, not just training for facility staff or intermittent clinical care during visits. These models demonstrated greater changes in facility culture, greater support for the need to reduce avoidable hospitalizations, and greater overall buy-in to the Initiative from facility staff, resulting in stronger intervention effects on reducing utilization and expenditures. In contrast, the Alabama and New York ECCP models included full-time nurses at each facility who did not provide direct clinical care; in Nebraska and Nevada, even though ECCP nurses provided direct clinical care, they did so in a less consistent manner by rotating across multiple facilities. Accordingly, these models showed weaker and less consistent effects on reducing utilization and expenditures.
For any given measure, there is wide variability across the seven ECCPs in the effects of the Initiative during the intervention period, 2014–2016. Using graphs, we highlight the variability using the four utilization probability measures (Figures 6-1 through 6-4) and the five expenditure measures (Figures 6-5 through 6-9). These graphs, indicating point estimates and confidence intervals, make it clear that the state-specific evaluation results provide a more nuanced picture of ECCP intervention effects than a pooled analysis that treats all ECCP interventions as one single intervention. Detailed numbers underlying each graph are provided in Section 3 (for state-specific estimates) and Section 4 (for pooled estimates).

225
Table 6-1 Summary of Initiative effects during intervention period, 2014–2016, on Medicare
utilization and expenditures
Measures
ECCP Intervention Period Effect, 2014–2016 Full-time nurse at
each NF performing direct clinical care
Full-time nurse at each NF without
direct clinical care
Nurses rotate across multiple NFs performing
direct clinical care
IN MO PA AL NY NE NV*
Probability of at least one:
All-cause hospitalization ‒ ‒ ‒ ~ ‒ ~ ‒
Potentially avoidable hospitalization ‒ ‒ ~ ‒ ‒ ~ ~
All-cause ED visit ~ ‒ ~ ‒ ~ † † Potentially avoidable ED visit ~ ‒ ‒ ‒ ~ † †
Count of:
All-cause hospitalizations ‒ ‒ ‒ ~ ~ ~ ‒ Potentially avoidable hospitalizations ‒ ‒ ‒ ~ ‒ ~ ~
All-cause ED visits ~ ‒ ~ ‒ ~ † † Potentially avoidable ED visits ~ ‒ ‒ ‒ ~ † †
Medicare expenditures for:
Total ‒ ‒ ‒ † ~ ~ ‒
All-cause hospitalizations ‒ ‒ ‒ † ~ ‒ ‒ Potentially avoidable hospitalizations ‒ ‒ ‒ ~ ~ ~ ‒
All-cause ED visits ~ ‒ ‒ ‒ ~ ‡ ‡ Potentially avoidable ED visits ~ ‒ ‒ ‒ ~ † ‡
NOTE: ECCP = Enhanced Care and Coordination Provider; ED = Emergency Department. SOURCE: RTI analysis of Medicare claims data (RTI programs ms06, ms07, ms08, jw20; annual_2016). *Results for Nevada should be interpreted with caution due to limitations with the comparison group.
Legend: ‒ = Effect estimate is favorable (reduction in measure) and statistically significant (p < 0.10). ~ = Effect estimate is favorable (reduction in measure) but statistically insignificant (p ≥ 0.10). † = Effect estimate is unfavorable (increase in measure) but statistically insignificant (p ≥ 0.10). ‡ = Effect estimate is unfavorable (increase in measure) and statistically significant (p < 0.10).

226
Figure 6-1 ECCP effect on probability of having any hospitalization per resident per year during
intervention period, 2014–2016
NOTE: Dots indicate ECCP-specific effects separately estimated within each state; triangle indicates Initiative-wide effect estimated from a pooled analysis combining data from all states; horizontal bars are 90% confidence intervals. Detailed numbers underlying this figure are provided in Sections 3 and 4. ECCP = Enhanced Care and Coordination Provider. SOURCE: RTI analysis of Medicare claims data (RTI program ms06; annual_2016\ms01_xtgee).

227
Figure 6-2 ECCP effect on probability of having any potentially avoidable hospitalization per resident
per year during intervention period, 2014–2016
NOTE: Dots indicate ECCP-specific effects separately estimated within each state; triangle indicates Initiative-wide effect estimated from a pooled analysis combining data from all states; horizontal bars are 90% confidence intervals. Detailed numbers underlying this figure are provided in Sections 3 and 4. ECCP = Enhanced Care and Coordination Provider. SOURCE: RTI analysis of Medicare claims data (RTI program ms06; annual_2016\ms01_xtgee).

228
Figure 6-3 ECCP effect on probability of having any ED visit per resident per year during
intervention period, 2014–2016
NOTE: Dots indicate ECCP-specific effects separately estimated within each state; triangle indicates Initiative-wide effect estimated from a pooled analysis combining data from all states; horizontal bars are 90% confidence intervals. Detailed numbers underlying this figure are provided in Sections 3 and 4. ECCP = Enhanced Care and Coordination Provider. SOURCE: RTI analysis of Medicare claims data (RTI program ms06; annual_2016\ms01_xtgee).

229
Figure 6-4 ECCP effect on probability of having any potentially avoidable ED visit per resident per
year during intervention period, 2014–2016
NOTE: Dots indicate ECCP-specific effects separately estimated within each state; triangle indicates Initiative-wide effect estimated from a pooled analysis combining data from all states; horizontal bars are 90% confidence intervals. Detailed numbers underlying this figure are provided in Sections 3 and 4. ECCP = Enhanced Care and Coordination Provider. SOURCE: RTI analysis of Medicare claims data (RTI program ms06; annual_2016\ms01_xtgee).

230
Figure 6-5 ECCP effect on total Medicare expenditures per resident per year during intervention
period, 2014–2016
NOTE: Dots indicate ECCP-specific effects separately estimated within each state; triangle indicates Initiative-wide effect estimated from a pooled analysis combining data from all states; horizontal bars are 90% confidence intervals. Detailed numbers underlying this figure are provided in Sections 3 and 4. ECCP = Enhanced Care and Coordination Provider. SOURCE: RTI analysis of Medicare claims data (RTI program ms08; annual_2016\ms04_glm and ms04_tpm).

231
Figure 6-6 ECCP effect on Medicare expenditures for all-cause hospitalizations per resident per year
during intervention period, 2014–2016
NOTE: Dots indicate ECCP-specific effects separately estimated within each state; triangle indicates Initiative-wide effect estimated from a pooled analysis combining data from all states; horizontal bars are 90% confidence intervals. Detailed numbers underlying this figure are provided in Sections 3 and 4. ECCP = Enhanced Care and Coordination Provider. SOURCE: RTI analysis of Medicare claims data (RTI program ms08; annual_2016\ms04_glm and ms04_tpm).

232
Figure 6-7 ECCP effect on Medicare expenditures for potentially avoidable hospitalizations per
resident per year during intervention period, 2014–2016
NOTE: Dots indicate ECCP-specific effects separately estimated within each state; triangle indicates Initiative-wide effect estimated from a pooled analysis combining data from all states; horizontal bars are 90% confidence intervals. Detailed numbers underlying this figure are provided in Sections 3 and 4. ECCP = Enhanced Care and Coordination Provider. SOURCE: RTI analysis of Medicare claims data (RTI program ms08; annual_2016\ms04_glm and ms04_tpm).

233
Figure 6-8 ECCP effect on Medicare expenditures for all-cause ED visits per resident per year during
intervention period, 2014–2016
NOTE: Dots indicate ECCP-specific effects separately estimated within each state; triangle indicates Initiative-wide effect estimated from a pooled analysis combining data from all states; horizontal bars are 90% confidence intervals. Detailed numbers underlying this figure are provided in Sections 3 and 4. ECCP = Enhanced Care and Coordination Provider. SOURCE: RTI analysis of Medicare claims data (RTI program ms08; annual_2016\ms04_glm and ms04_tpm).

234
Figure 6-9 ECCP effect on Medicare expenditures for potentially avoidable ED visits per resident per
year during intervention period, 2014–2016
NOTE: Dots indicate ECCP-specific effects separately estimated within each state; triangle indicates Initiative-wide effect estimated from a pooled analysis combining data from all states; horizontal bars are 90% confidence intervals. Detailed numbers underlying this figure are provided in Sections 3 and 4. ECCP = Enhanced Care and Coordination Provider. SOURCE: RTI analysis of Medicare claims data (RTI program ms08; annual_2016\ms04_glm and ms04_tpm).
6.3 Variations in and Limitations of ECCP Effects Over Time
Within each state, a common pattern emerges from the yearly trends of ECCP effects depicted in Section 3—that is, for most measures the effect size grew larger from 2014–2015, and then either leveled off or somewhat weakened from 2015–2016. This pattern is obvious in Missouri, Indiana, Alabama, and Nevada, where the effects on most measures peaked in 2015; in Missouri, indeed, the magnitude of intervention effects on all the utilization and expenditure measures peaked in 2015. Nebraska and New York exhibit a different pattern, where the ECCP effects on most measures improved somewhat over the years and peaked in 2016, the last year of the Initiative. Pennsylvania follows yet another distinct pattern, where the ECCP effects on virtually all the measures peaked in 2014, weakened considerably in 2015, and largely plateaued in 2016.
It is likely that the leveling off or weakening of intervention effects in 2016 relative to the preceding year across several ECCPs was driven in part by the diversion of resources and staffing toward qualifying for and implementing the Payment Reform Initiative, scheduled to start October 2016. These activities may have drawn focus away from ongoing Initiative activities. This was noted in observations by our qualitative data collection team for several ECCPs.

235
Another possible explanation is that concurrent efforts unrelated to the Initiative but with a similar focus on reducing hospital admissions or readmissions have become more widespread across nursing facilities within each state, including the comparison facilities in this evaluation (all these facilities reported being engaged in such efforts), as reported in Section 2.11. This would reduce the estimated effects of the ECCP interventions. Our 2015 web-based survey of comparison facilities indicates that 95 percent of the responding facilities reported having introduced policies or procedures designed to reduce avoidable hospitalizations of long-stay residents since January 2011. Additionally, in our 2015 web-based survey of ECCP nursing facility administrators, 80 percent of the responding facilities reported being engaged in similar concurrent efforts that were unrelated to the Initiative. When interventions under the Initiative co-occur with other policy or practice changes, it becomes challenging for an evaluation to disentangle potential confounding caused by these efforts and attribute an effect to the Initiative itself. While we acknowledge this limitation, any effect of these policies or practices on the comparison facilities would bias our estimates toward no effect. In addition, the efforts unrelated to the Initiative may be similar to the practices in comparison facilities, especially when these were initiated by the corporations owning facilities in both groups, thereby mitigating potential confounding of such parallel non-Initiative efforts for the estimated ECCP intervention effects. Judging by the challenges we observed, it is unlikely that the concurrent activities in the facilities, implemented without ECCP support and resources, would be as targeted and effective as the ECCP efforts.
A related limitation is that we were not able to rigorously separate the effects of specific components of ECCP models. Instead, we could only evaluate each model as a whole, looking for consistencies in characteristics of more successful implementations. Different ECCPs may have used the same model components (e.g., Interventions to Reduce Acute Care Transfers [INTERACT] tools or medication review) but with different implementation methods. Lastly, only the effects on Medicare services are estimated, as these are the acute care services affected. Full Medicaid data—not available in a timely manner at the conclusion of the Initiative—would show much smaller effects when analyzed. One would expect the Initiative to reduce state cost-sharing payments related to days in the hospital, but increase payments related to residents having more days in the facility.
6.4 ECCP Effects on Quality
Broadly, the rate of avoidable hospitalizations among long-stay nursing facility residents can be viewed as a quality measure, not just a utilization measure, because unnecessary hospital transfers cause distress, disruption in routine care, exposure to potential infections and complications, and adverse health outcomes, all of which are deleterious to patients’ quality of life. Thus, a reduction in avoidable hospitalizations attributable to the Initiative is indicative of improvements in quality.
Although the observed reductions in avoidable hospitalizations indicate improvements in that dimension of quality, the Minimum Data Set (MDS)-based quality measures do not show a clear pattern of change related to the Initiative over the intervention period. This is true regardless of the approach used to conduct the evaluation—through state-specific analyses or in a pooled analysis, or by examination of yearly ECCP effects or the ECCP effect during the intervention period, 2014–2016. Because the Initiative’s focus was mostly on avoiding
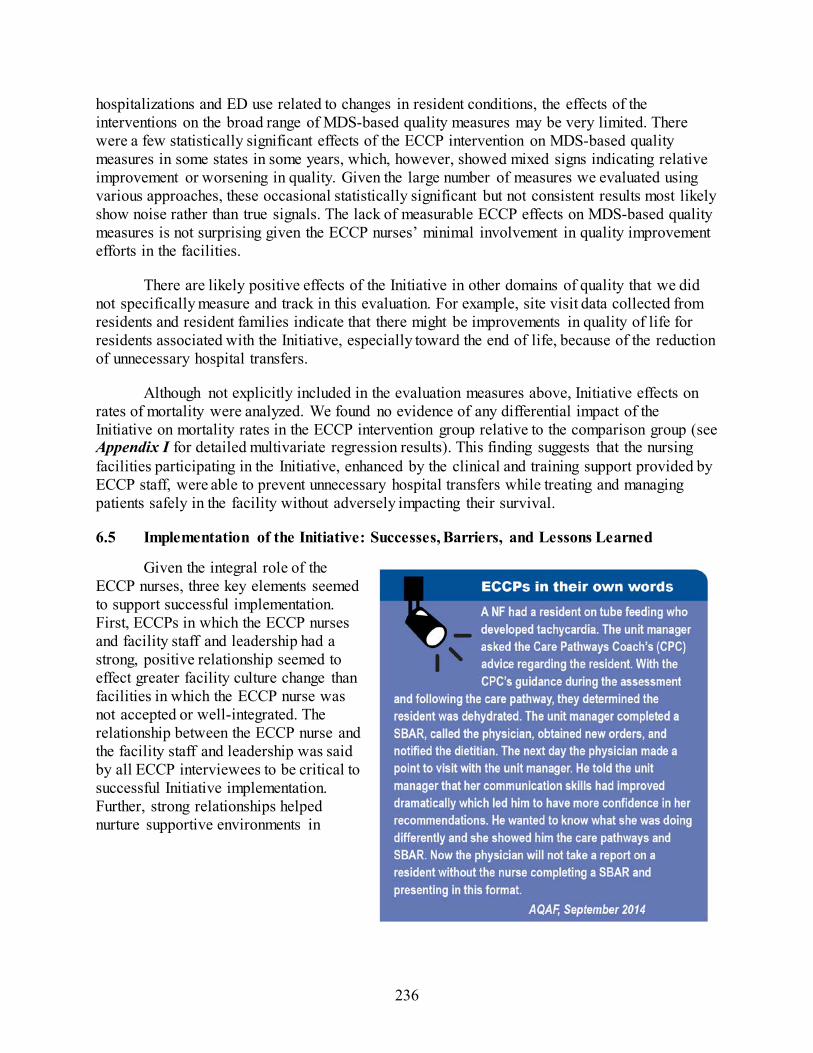
236
hospitalizations and ED use related to changes in resident conditions, the effects of the interventions on the broad range of MDS-based quality measures may be very limited. There were a few statistically significant effects of the ECCP intervention on MDS-based quality measures in some states in some years, which, however, showed mixed signs indicating relative improvement or worsening in quality. Given the large number of measures we evaluated using various approaches, these occasional statistically significant but not consistent results most likely show noise rather than true signals. The lack of measurable ECCP effects on MDS-based quality measures is not surprising given the ECCP nurses’ minimal involvement in quality improvement efforts in the facilities.
There are likely positive effects of the Initiative in other domains of quality that we did not specifically measure and track in this evaluation. For example, site visit data collected from residents and resident families indicate that there might be improvements in quality of life for residents associated with the Initiative, especially toward the end of life, because of the reduction of unnecessary hospital transfers.
Although not explicitly included in the evaluation measures above, Initiative effects on rates of mortality were analyzed. We found no evidence of any differential impact of the Initiative on mortality rates in the ECCP intervention group relative to the comparison group (see Appendix I for detailed multivariate regression results). This finding suggests that the nursing facilities participating in the Initiative, enhanced by the clinical and training support provided by ECCP staff, were able to prevent unnecessary hospital transfers while treating and managing patients safely in the facility without adversely impacting their survival.
6.5 Implementation of the Initiative: Successes, Barriers, and Lessons Learned
Given the integral role of the ECCP nurses, three key elements seemed to support successful implementation. First, ECCPs in which the ECCP nurses and facility staff and leadership had a strong, positive relationship seemed to effect greater facility culture change than facilities in which the ECCP nurse was not accepted or well-integrated. The relationship between the ECCP nurse and the facility staff and leadership was said by all ECCP interviewees to be critical to successful Initiative implementation. Further, strong relationships helped nurture supportive environments in

237
which clinical ECCP nurses42 could assess and treat residents, 43 in turn helping to educate facility staff on changes of condition and appropriate care. Interviewees indicated that these relationships were best supported by scheduling the same ECCP nurse to a given facility for full-time work on the Initiative, as opposed to a rotating schedule of nurses or assigning the same nurse to a facility for only part-time work.
Second, ECCP nurses who have strong experience building relationships and opening lines of communication were more successful in conveying the goals of the Initiative and obtaining facility staff buy-in. Early in the Initiative, most ECCPs focused on hiring nurses with specific clinical experiences (e.g., prior work in long-term care); over time, ECCPs shifted their focus to target more nurses with skills in building relationships. Yet, even despite strong communication skills, some ECCP nurses faced challenges endemic to facilities, such as high rates of staff turnover. Some components of the Initiative (e.g., consistent use of INTERACT tools) were challenging when facility staff were ever-changing. Likewise, Initiative success was hindered when facility staff or leadership resisted aspects of the Initiative or seemed to have low engagement with or use of Initiative components and goals. For example, in ECCP models with health IT components, poor buy-in from facility staff, leadership, or physicians meant limited or nonexistent use of IT tools. These features varied widely across ECCPs, but ECCP nurses who worked determinedly to bridge gaps, encourage communication, and obtain buy-in seemed to have more successes than peers who struggled in these areas, either because of their own skill sets or because of challenges interacting with the facility staff and leadership.
Third, all ECCP interviewees agreed that physician buy-in is critical to success and should be obtained as early in the Initiative as possible. Several interviewees who expressed concern over weak physician buy-in reflected that they wished physicians had been included in the Initiative from the outset, even in the earliest planning phases prior to launching in facilities, to encourage their engagement with the Initiative goals (i.e., keeping residents in the facility for care when possible, rather than relying on hospital transfers for all changes of condition). Facilities and ECCPs that had a good relationship between the ECCP nurse and facility staff and leadership, as well as facility physicians, seemed to show more progress toward reaching Initiative goals than
42 APRNs ability to practice varied by state; for a full summary of the role of APRNs refer to Section 2.
43 ECCP nurses provided clinical care in five ECCPs; only the AQAF and NY-RAH models did not include a clinical care component.

238
those ECCPs and facilities that struggled to build relationships, maintain lines of communication, or obtain buy-in from staff and physicians.
Despite some early successes, interviewees across ECCPs indicated that this Initiative requires a shift in the culture within facilities to achieve both facility engagement with and use of Initiative components, and that this kind of process change takes time. Some ECCP leaders indicated that more time would be needed to observe positive effects of the Initiative than the 4-year time span for the Initiative. Particularly given the fact that ECCP nurses work for the ECCPs, not the facilities, transferring knowledge and skills to existing facility staff was said to be an ongoing challenge that required a substantial investment of time from both the ECCP and the facilities. Interviewees expressed enthusiasm for the opportunity to continue existing efforts through the Payment Reform Initiative, highlighting that additional time likely would produce more concrete findings to demonstrate potential connections between the Initiative and tangible reductions in use and cost of avoidable hospitalizations.
Conceptually, this Initiative was implemented by organizations, ECCPs, coming in as outsiders to assist volunteering facilities in reducing hospitalizations and improving other aspects of care quality. Although there were no financial incentives directly given to the participating facilities, they were expected to encourage staff to participate in the education, trainings, and other activities needed for implementation of the Initiative. In the next phase of the Initiative, the external assistance is being supplemented by direct payment to facilities to treat in the facility residents with any of a defined set of conditions. Practitioners in the facilities also receive extra payment to certify the eligibility of the residents. The degree to which a direct incentive affects the rates of utilization and spending will be evaluated. This is being tested in facilities with continued assistance by the ECCPs and in facilities for which only the payments are an incentive. The Initiative is evolving.

239
REFERENCES
Ersek A, Stevenson D. Integrating palliative care into nursing homes: challenges and opportunities 2013. Available from: http://healthaffairs.org/blog/2013/12/02/integrating-palliative-care-into-nursing-homes-challenges-and-opportunities/
Fateux N, Brand R, Fink JLW, Frelick M, Werrlein D. Charting Nursing’s Future: The Care for Removing Barriers to APRN Practice. March 6, 2017. Available from http://www.rwjf.org/content/dam/farm/reports/issue_briefs/2017/rwjf435543
Gupta, S. K. (2011). Intention-to-treat concept: A review. Perspectives in Clinical Research, 2(3), 109–112. http://doi.org/10.4103/2229-3485.83221
Institute of Medicine. The Future of Nursing: Leading Change, Advancing Health 2010. Available from: http://www.nationalacademies.org/hmd/Reports/2010/The-Future-of-Nursing-Leading-Change-Advancing-Health.aspx.
Kaiser Family Foundation. State Health Facts 2016. Available from: http://kff.org/other/state-indicator/total-number-of-nurse-practitioners-by-gender/?currentTimeframe=0&sortModel=%7B%22colId%22:%22Location%22,%22sort%22:%22asc%22%7D.
Miller SC, Gozalo P, Lima JC, Mor V. The effect of Medicaid nursing home reimbursement policy on Medicare hospice use in nursing homes. Med Care. 2011;49(9):797-802. doi: 10.1097/MLR.0b013e318223c0ae.
Ouslander JG, Bonner A, Herndon L, Shutes J. The Interventions to Reduce Acute Care Transfers (INTERACT) Quality Improvement Program: An Overview for Medical Directors and Primary Care Clinicians in Long Term Care. J Am Med Dir Assoc. 2014;15(3):162-70. doi: http://dx.doi.org/10.1016/j.jamda.2013.12.005.
Ouslander, J. G., Lamb, G., Tappen, R., Herndon, L., Diaz, S., Roos, B. A.,... Bonner, A. (2011, Apr). Interventions to reduce hospitalizations from nursing homes: evaluation of the INTERACT II collaborative quality improvement project. Journal of the American Geriatrics Society, 59(4), 745-753. http://dx.doi.org/10.1111/j.1532-5415.2011.03333.x
Phillips SJ. (2017). 29th Annual APRN Legislative Update. The Nurse Practitioner, 42(1),18-46. doi: 10.1097/01.NPR.0000511006.68348.93
Unroe KT, Cagle JG, Lane KA, Callahan CM, Miller SC. Nursing Home Staff Palliative Care Knowledge and Practices: Results of a Large Survey of Frontline Workers. J Pain Symptom Manage. 2015;50(5):622-9. doi: 10.1016/j.jpainsymman.2015.06.006.
Walsh EG, Freiman M, Haber S, Bragg A, Ouslander J, Wiener J. Cost drivers for dually eligible beneficiaries: potentially avoidable hospitalizations from nursing facility, skilled nursing facility, and home and community based services waiver programs. Waltham (MA): RTI International. 2010.

240
Walsh EG, Wiener JM, Haber S, Bragg A, Freiman M, Ouslander JG. Potentially avoidable hospitalizations of dually eligible Medicare and Medicaid beneficiaries from nursing facility and Home- and Community-Based Services waiver programs. J Am Geriatr Soc. 2012;60(5):821-9. doi: 10.1111/j.1532-5415.2012.03920.x.