death and poverty (avoidable) and taxes (not avoidable) jha cgd tobacco... · death and poverty...
TRANSCRIPT

Death and Poverty (Avoidable) and
Taxes (Not Avoidable)
Prabhat Jha [email protected] Twitter: @Countthedead
Centre for Global Health Research, St. Michael’s Hospital Dalla Lana School of Public Health, University of Toronto

Conclusions • On current patterns: 1 Billion smoking deaths this
century, or about 250 million deaths among those <35 years in just 16 countries
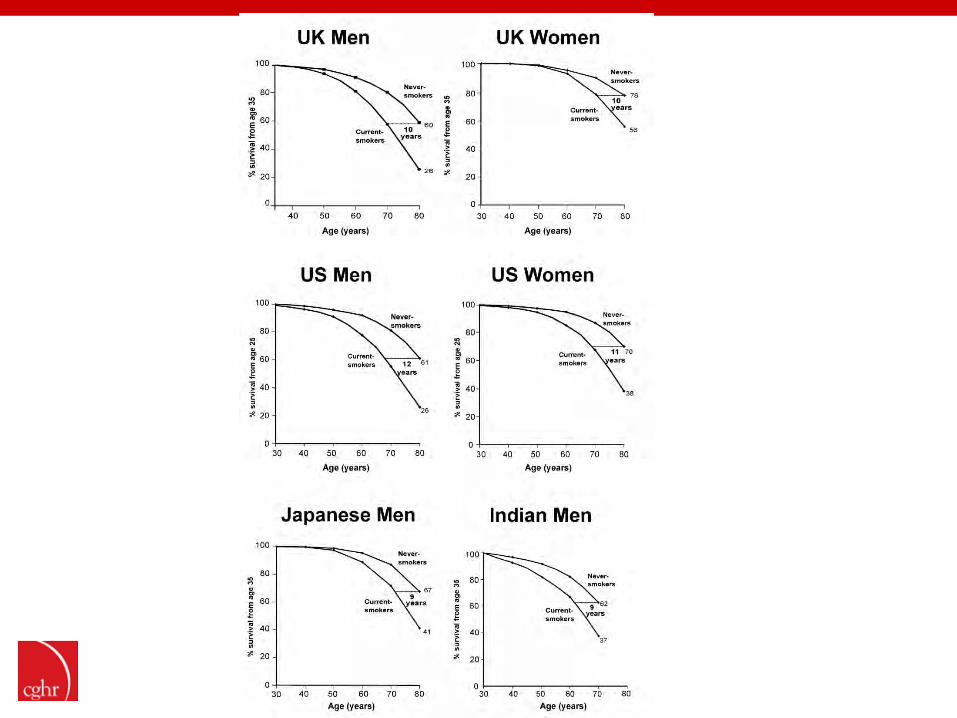
• Prolonged smokers lose about one decade of life
• Cessation by age 40 (and preferably earlier) avoids 90% of the excess risk of continued smoking
• Tripling of excise tax worldwide would reduce smoking by 1/3, avoid over 200 million premature deaths, and raise $100 B more in revenue
• Tobacco control does not hurt the poor
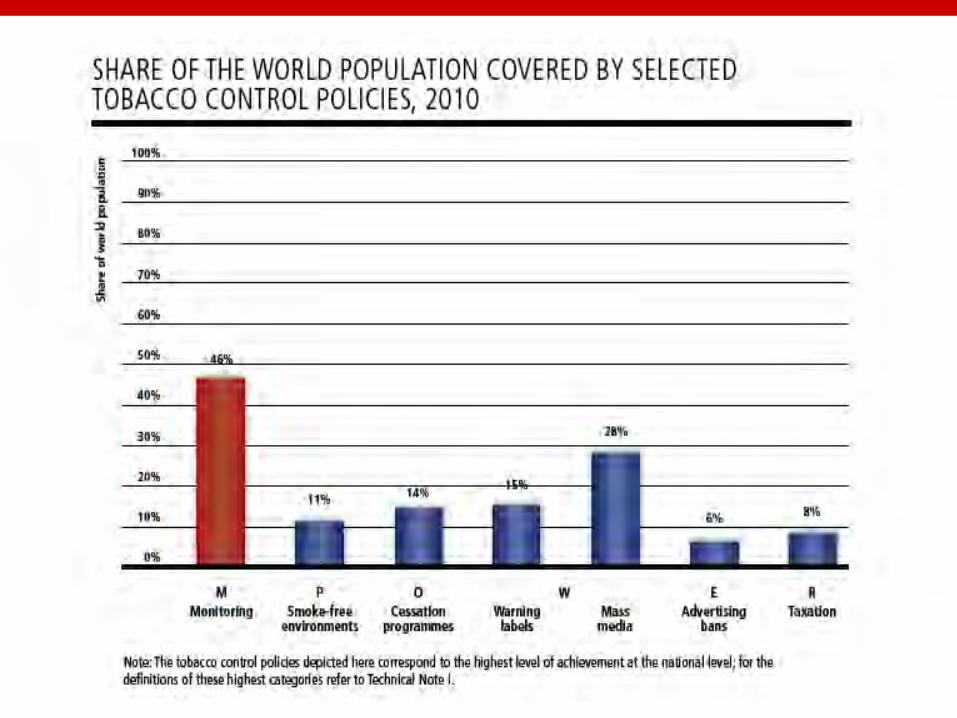
• Monitoring is needed: smoking and death status
Source: Jha and Peto, NEJM, Jan 2, 2014

Worldwide no of substance users B=billions, M=millions
Substance Users Annual deaths Smoking 1.3 B * ~ 5 M
Drinking 2.0 B ~ 2 M
Illicit drugs 0.2 B ~ 0.2 M
Global sales ~6,000 B sticks (vs 5,000 B in 1990)
1 ton of tobacco=1 M sticks=1 death
Source: WHO 2002

2010: Russian president Dmitry Medvedev spearheads new offensive against vodka, blamed for 500,000 deaths a
year
Ice fishermen sip vodka at a lake in Moscow
Sensationalist adverts, steep price rises and bombastic rhetoric pull out all the stops guardian.co.uk Monday 21 June 2010
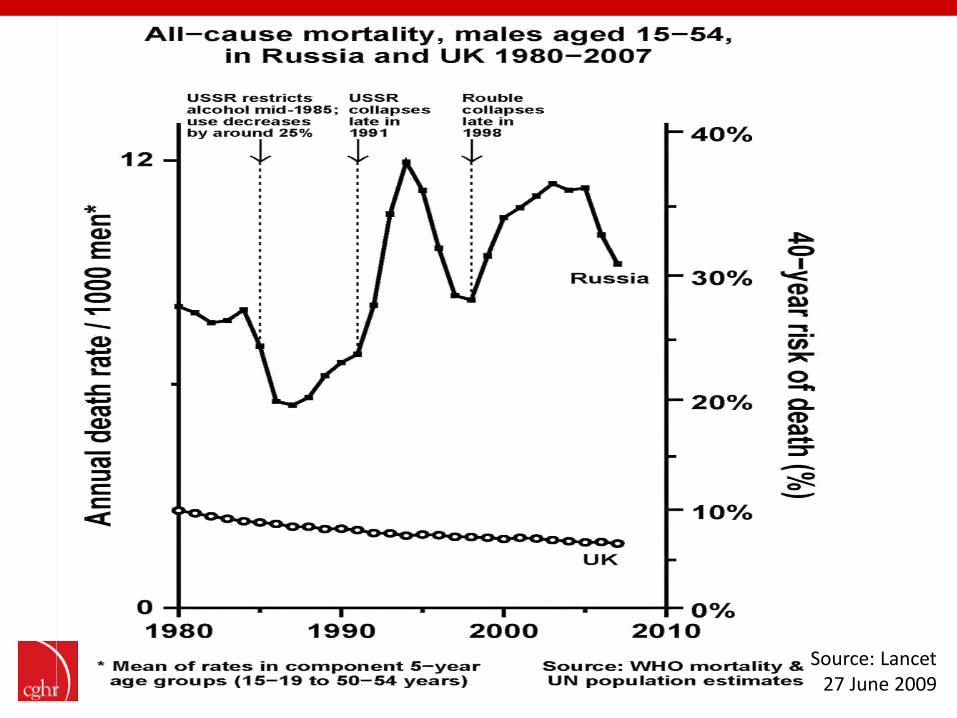
Source: Lancet 27 June 2009

Russian male death rate ratios
~1 bottle of vodka/day
vs <0.5 bottles/week:
2 x any medical cause
4 x road traffic accident
6 x any other accident
8 x suicide
10 x murder
Source: Lancet 27 June 2009

40 50 60 70 80 90 100
Yearly dots
BMI, kg/m2
30-35 (~32) 40-50 (~43)
0
20
40
60
80
100
Age (years)
% s
urvi
val f
rom
age
35
Never- smokers
Cigarette smokers
Prospective Studies Collaboration (males)
0
20
40
60
80
100
40 50 60 70 80 90 100
Male British Doctors’ Study
Yearly dots
Low-mortality BMI Severe obesity
22½-25 (~24)
10 years
Moderate obesity
Life expectancy loss of 3 years with moderate
obesity and 10 years with smoking 2 kg/m2 extra BMI (if overweight) or 10% smoking prevalence shortens life by ~1
yr
Source: Peto, Whitlock, Jha, NEJM, 2010

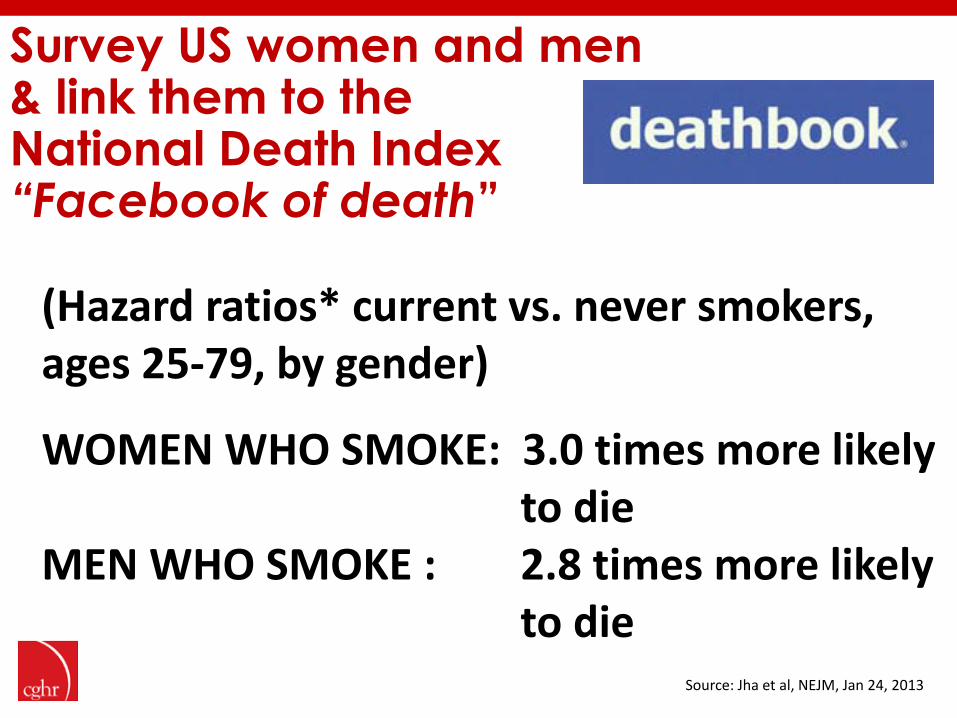
Survey US women and men & link them to the National Death Index “Facebook of death” (Hazard ratios* current vs. never smokers,
ages 25-79, by gender)
WOMEN WHO SMOKE: 3.0 times more likely to die MEN WHO SMOKE : 2.8 times more likely to die
Source: Jha et al, NEJM, Jan 24, 2013

0
500
1000
1500
50-54 55-59 60-64 65-69 70-74 75-79 80-84 85+
Rat
e pe
r 100
,000
Women
2000-2010
1982-1988
1959-1965
Attained Age
US Women, smoker: non-smoker
risks over time
Source: Thun et al, NEJM , Jan 24, 2013
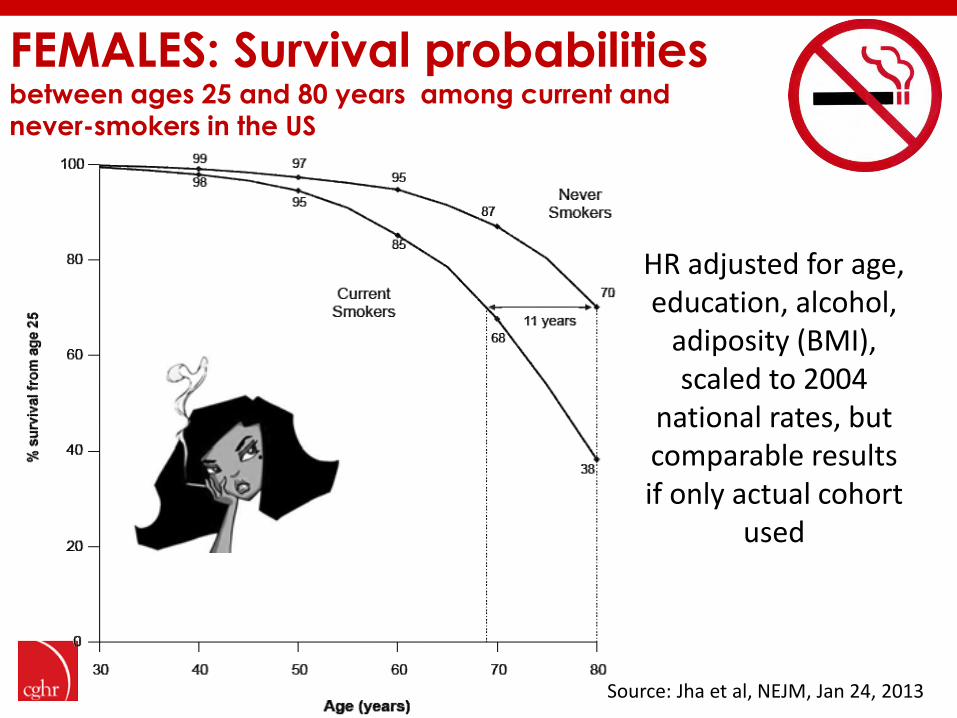
FEMALES: Survival probabilities between ages 25 and 80 years among current and never-smokers in the US
HR adjusted for age, education, alcohol,
adiposity (BMI), scaled to 2004
national rates, but comparable results if only actual cohort
used
Source: Jha et al, NEJM, Jan 24, 2013

MALES: Survival probabilities between ages 25 and 80 years among current and never-smokers in the US
Source: Jha et al, NEJM, Jan 24, 2013
HR adjusted for age, education, alcohol, adiposity (BMI), scaled to 2004 national rates, but comparable results if only actual cohort used

Source: Jha et al, NEJM, Jan 24, 2013
10
9
6
4
25-34
35-44
45-54
55-64
Years gained by quitting smoking by age

Reductions in risk by age stopped, UK
Women (Million Women’s Study)
Source: Pirie et al, Lancet 2012
-0.5 0.5 1.5 2.5 3.5
0 1 2 3
UK/US/Japan
India-cig
Bangladesh-cig/bidi
South Africa-Coloureds
Agincourt-Black
South Africa-White
South Africa-Black
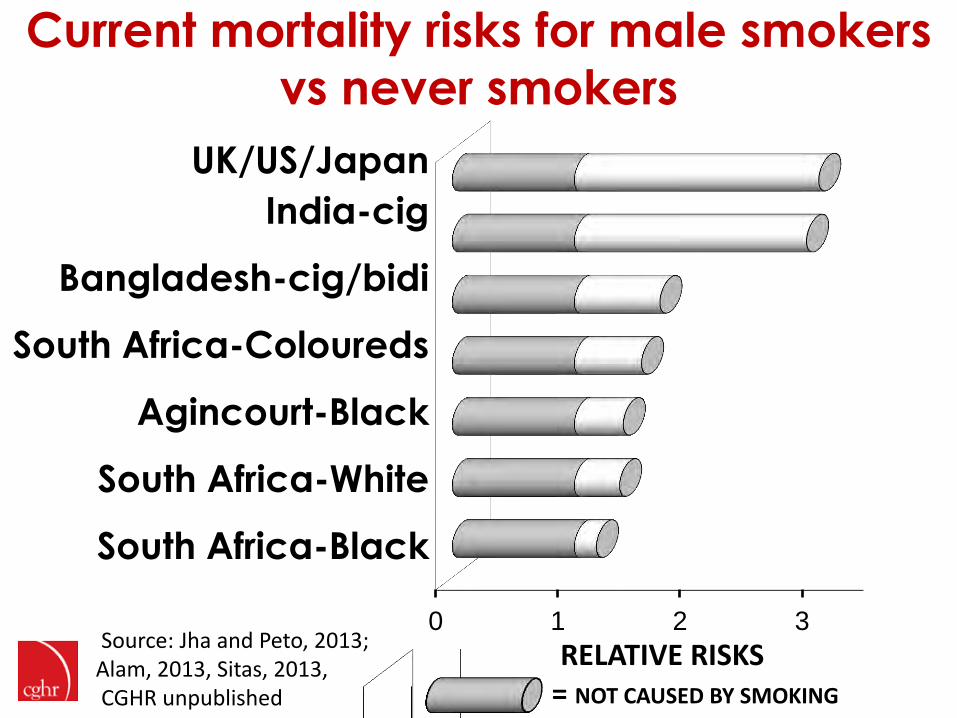
RELATIVE RISKS = NOT CAUSED BY SMOKING
Current mortality risks for male smokers
vs never smokers
Source: Jha and Peto, 2013; Alam, 2013, Sitas, 2013, CGHR unpublished
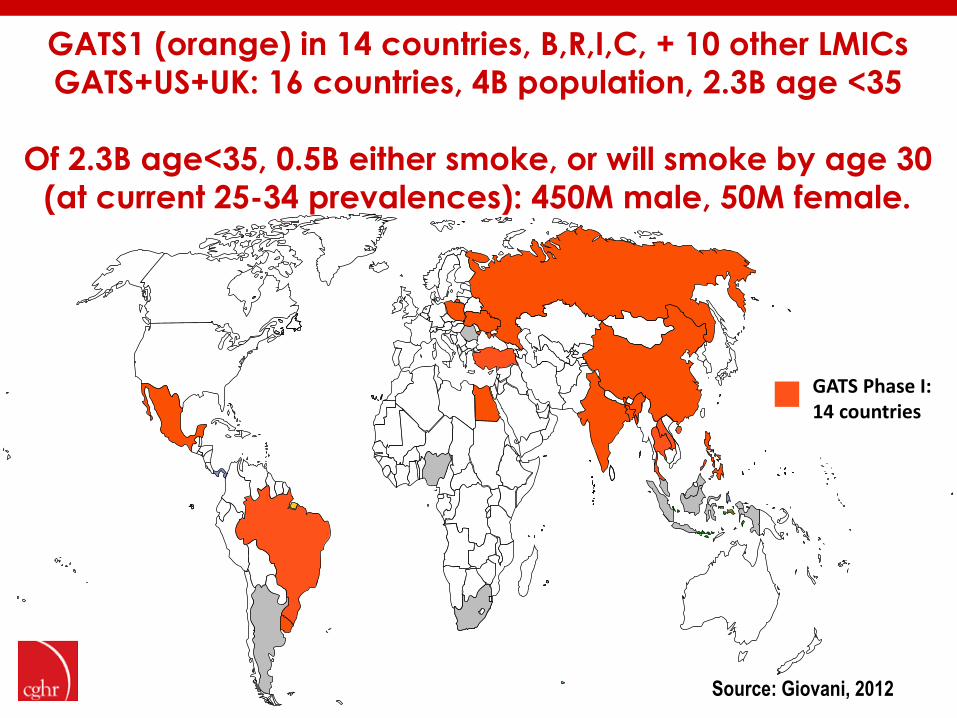
GATS1 (orange) in 14 countries, B,R,I,C, + 10 other LMICs
GATS+US+UK: 16 countries, 4B population, 2.3B age <35
Of 2.3B age<35, 0.5B either smoke, or will smoke by age 30
(at current 25-34 prevalences): 450M male, 50M female.
GATS Phase I: 14 countries
Source: Giovani, 2012

Delayed hazard: observed (1950, 1990) and predicted (2030) proportions of all deaths at
ages 35-69 due to tobacco
US (all adults) China (men)
1950 12% 1990 12%
1990 33% 2030 33%
Source: Peto et al, Nature Medicine, 2001
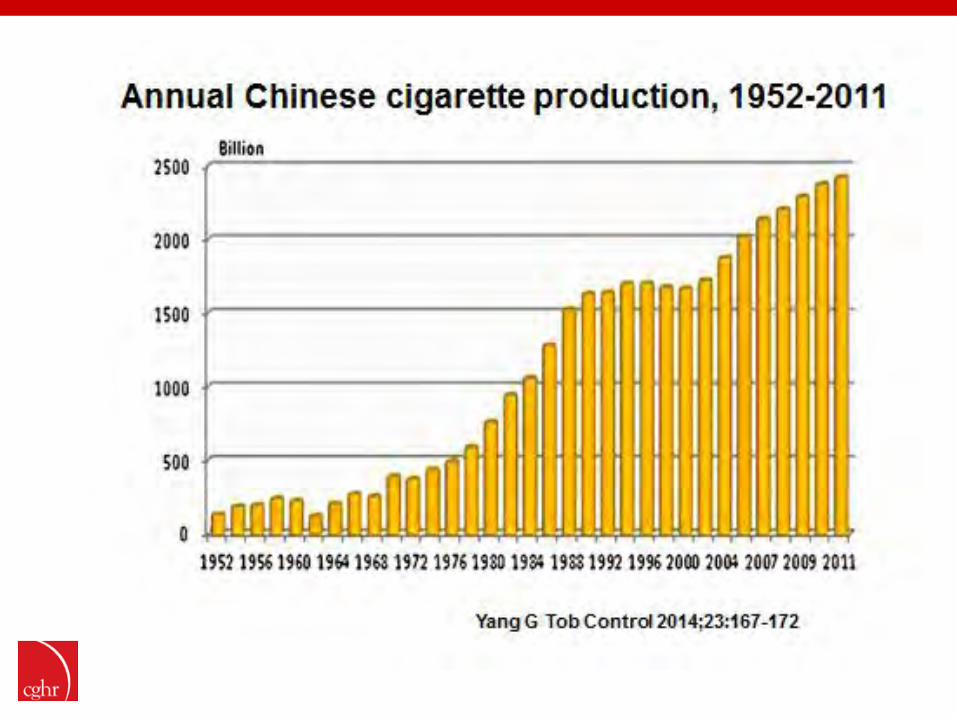
Chinese cigarette increase 40 years after US increase

Men who smoke bidis 6 years
Women who smoke bidis 8 years
Men who smoke cigarettes 10 years
INDIA: Years of life lost among 30 year old smokers* (MDS results)
* At current risks of death versus non-smokers, adjusted for age, alcohol use and education
(note that currently, few females smoke cigarettes)
Source: Jha et al, NEJM, Feb 2009
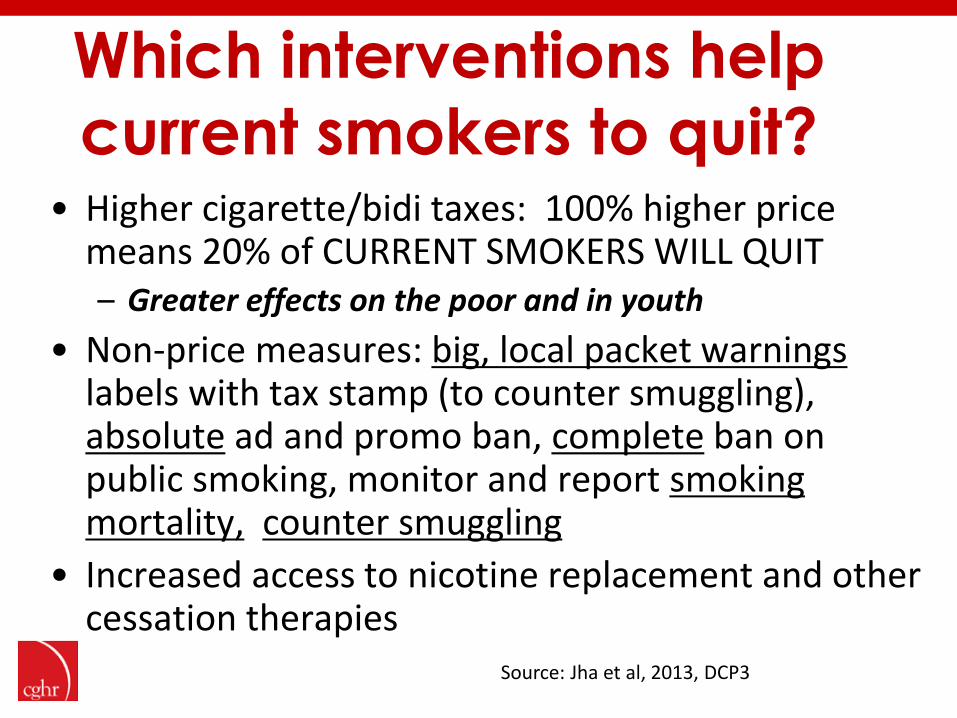
Which interventions help
current smokers to quit? • Higher cigarette/bidi taxes: 100% higher price
means 20% of CURRENT SMOKERS WILL QUIT – Greater effects on the poor and in youth
• Non-price measures: big, local packet warnings labels with tax stamp (to counter smuggling), absolute ad and promo ban, complete ban on public smoking, monitor and report smoking mortality, counter smuggling
• Increased access to nicotine replacement and other cessation therapies
Source: Jha et al, 2013, DCP3
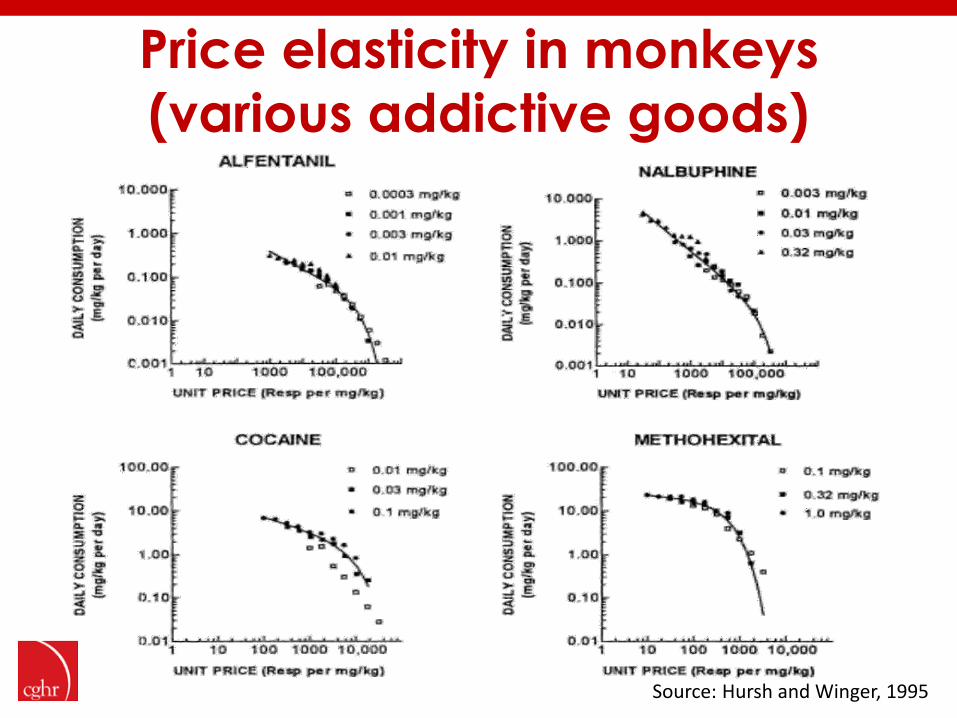
Price elasticity in monkeys
(various addictive goods)
Source: Hursh and Winger, 1995
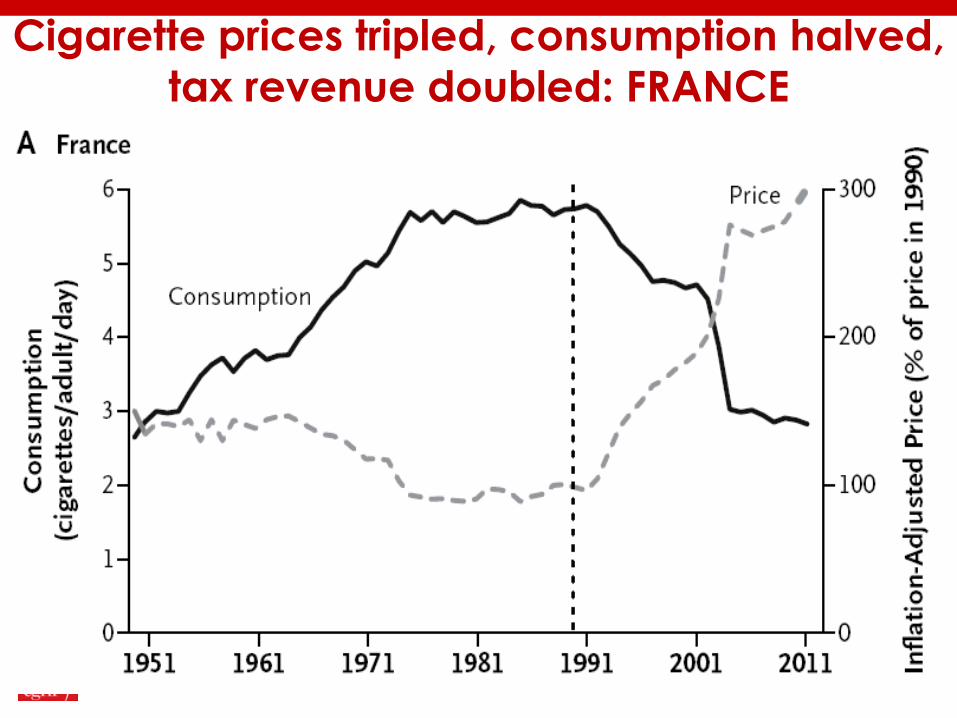
Cigarette prices tripled, consumption halved,
tax revenue doubled: FRANCE

Cigarette prices tripled, consumption halved,
tax revenue doubled: SOUTH AFRICA

UK & France, lung cancer mortality trends (35-44) to
1997, but not beyond
Male

Male
Source: Peto, 2012
UK & France, lung cancer mortality trends (35-44)
after 1997
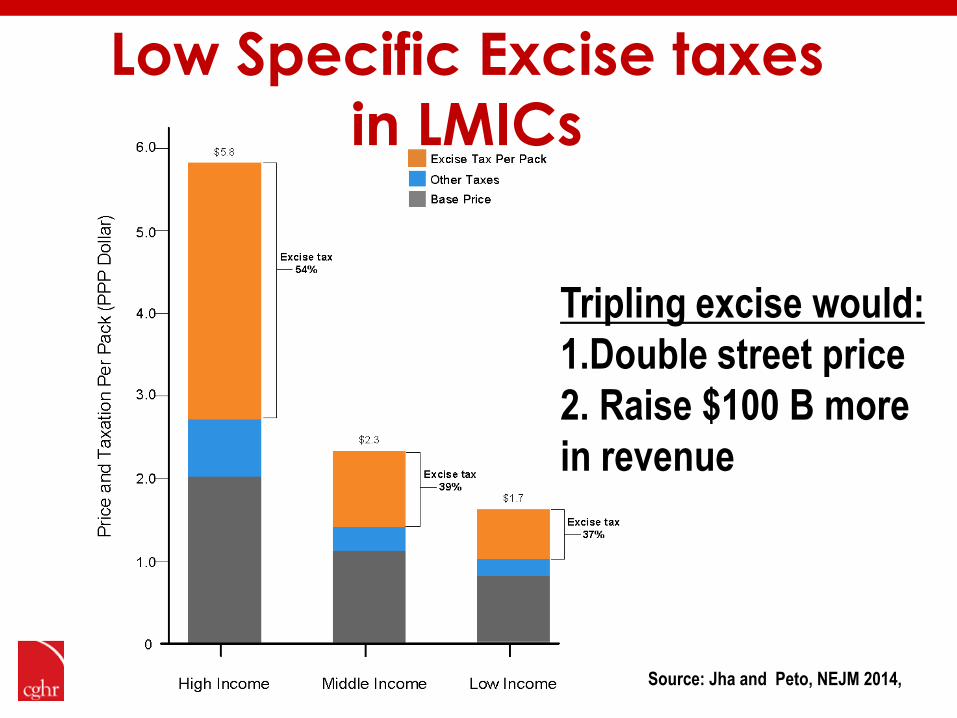
Low Specific Excise taxes
in LMICs
Source: Jha and Peto, NEJM 2014,
Tripling excise would:
1.Double street price
2. Raise $100 B more
in revenue
CGHR.ORG
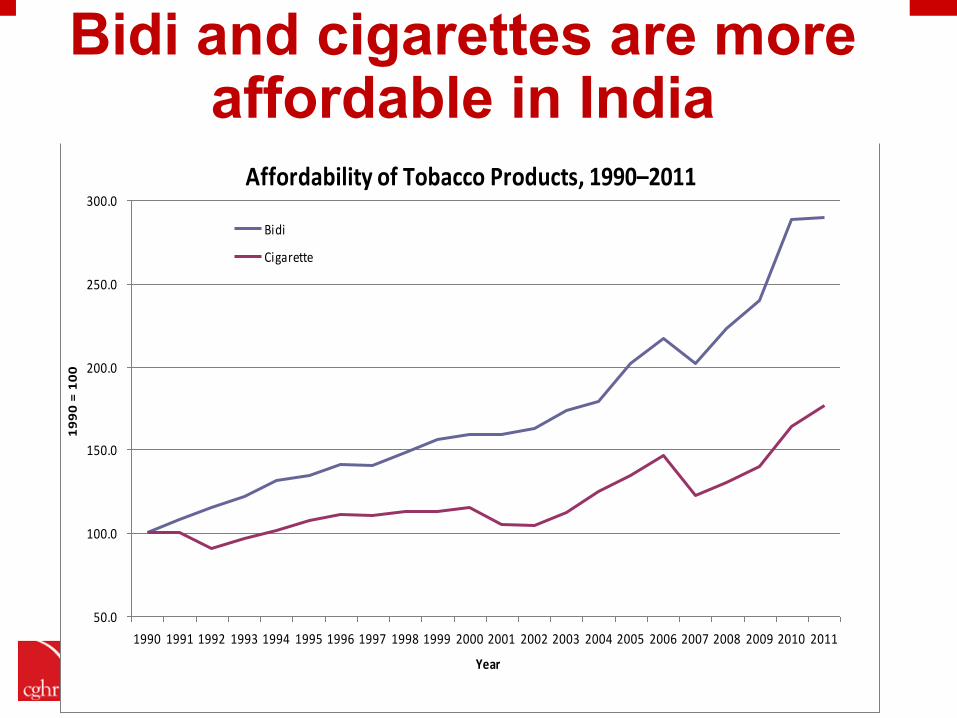
Affordability of Tobacco Products, 1990–2011
50.0
100.0
150.0
200.0
250.0
300.0
1990 1991 1992 1993 1994 1995 1996 1997 1998 1999 2000 2001 2002 2003 2004 2005 2006 2007 2008 2009 2010 2011
Year
19
90
= 1
00
Bidi
Cigarette
Bidi and cigarettes are more affordable in India
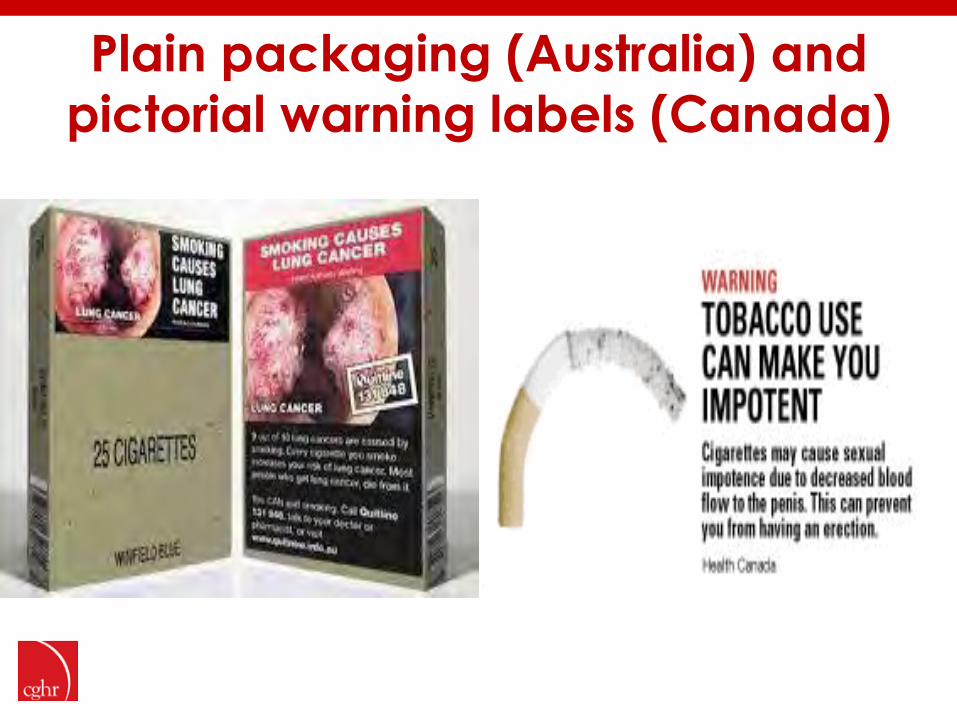
Plain packaging (Australia) and
pictorial warning labels (Canada)
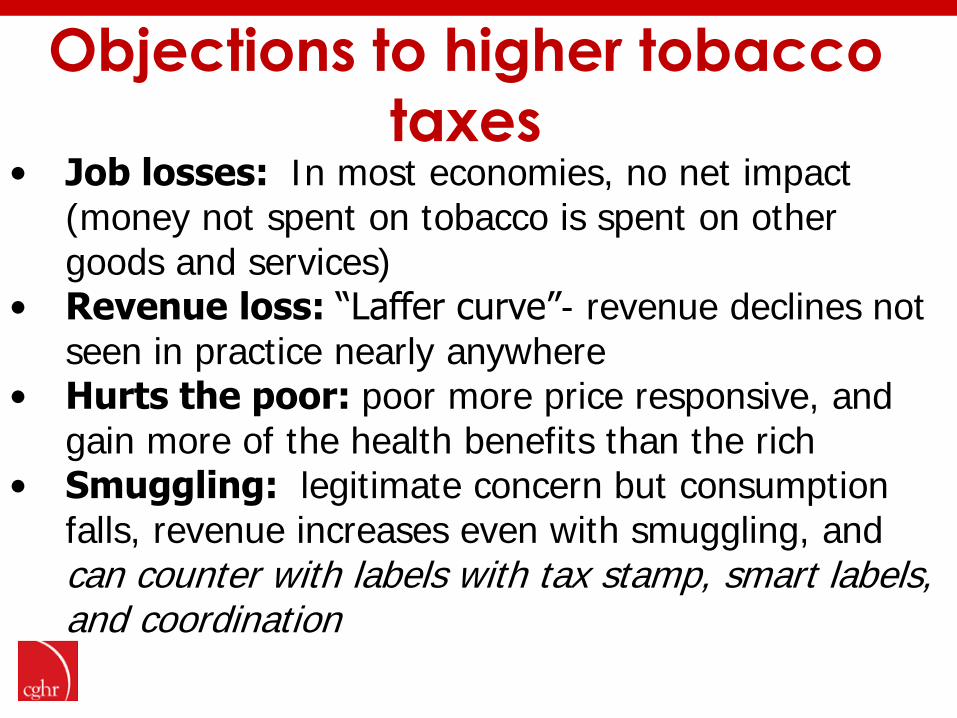
Objections to higher tobacco
taxes • Job losses: In most economies, no net impact
(money not spent on tobacco is spent on other goods and services)
• Revenue loss: “Laffer curve”- revenue declines not seen in practice nearly anywhere
• Hurts the poor: poor more price responsive, and gain more of the health benefits than the rich
• Smuggling: legitimate concern but consumption falls, revenue increases even with smuggling, and can counter with labels with tax stamp, smart labels, and coordination
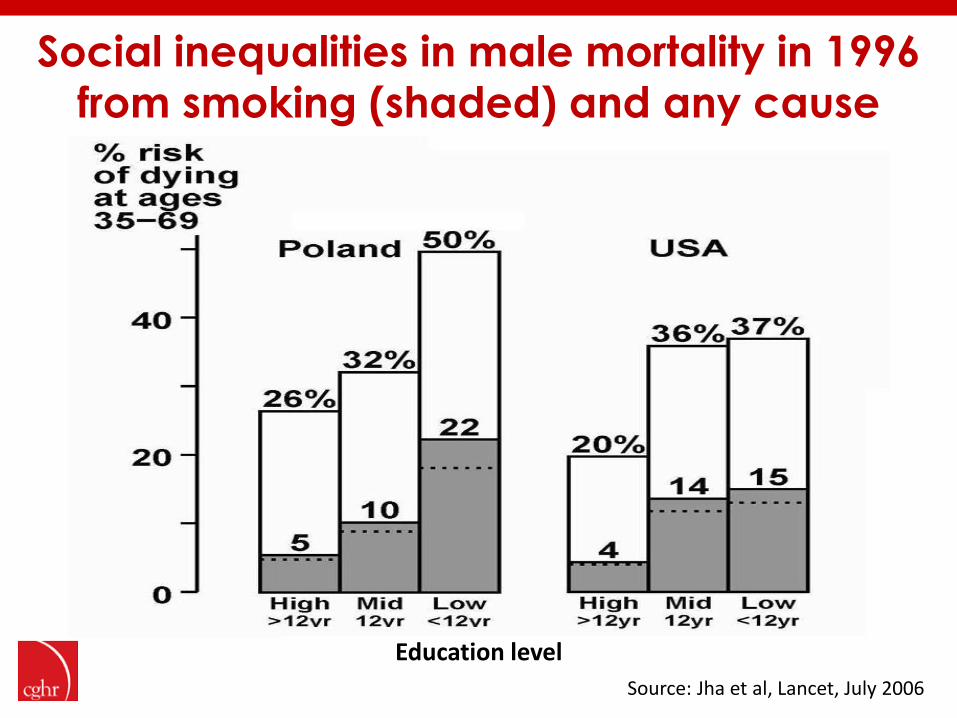
Social inequalities in male mortality in 1996
from smoking (shaded) and any cause
Education level
Source: Jha et al, Lancet, July 2006
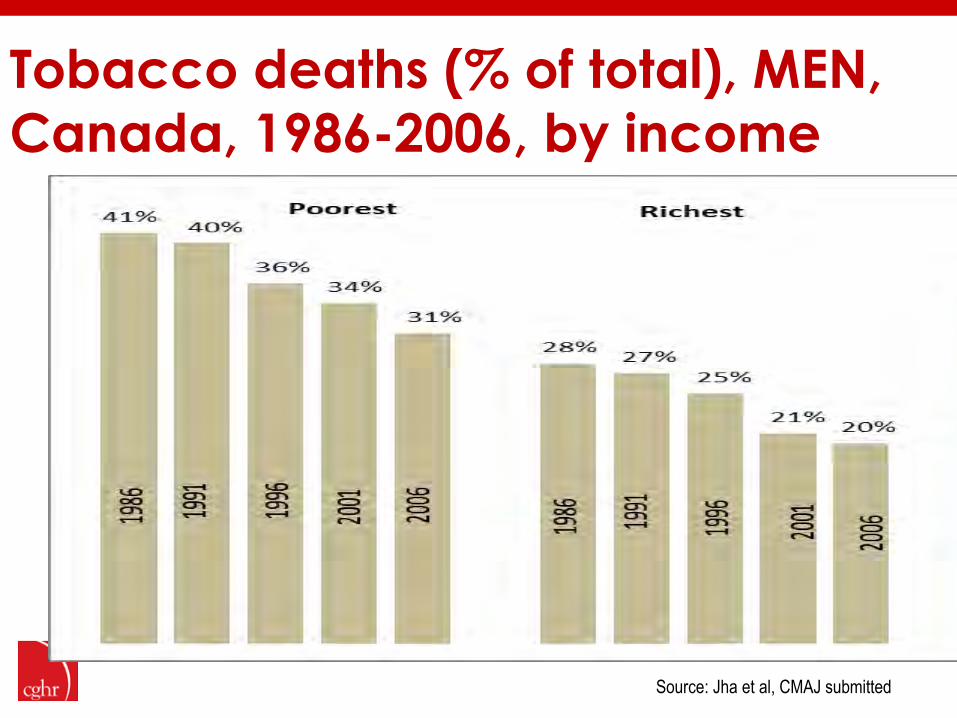
Tobacco deaths (% of total), MEN,
Canada, 1986-2006, by income
Source: Jha et al, CMAJ submitted
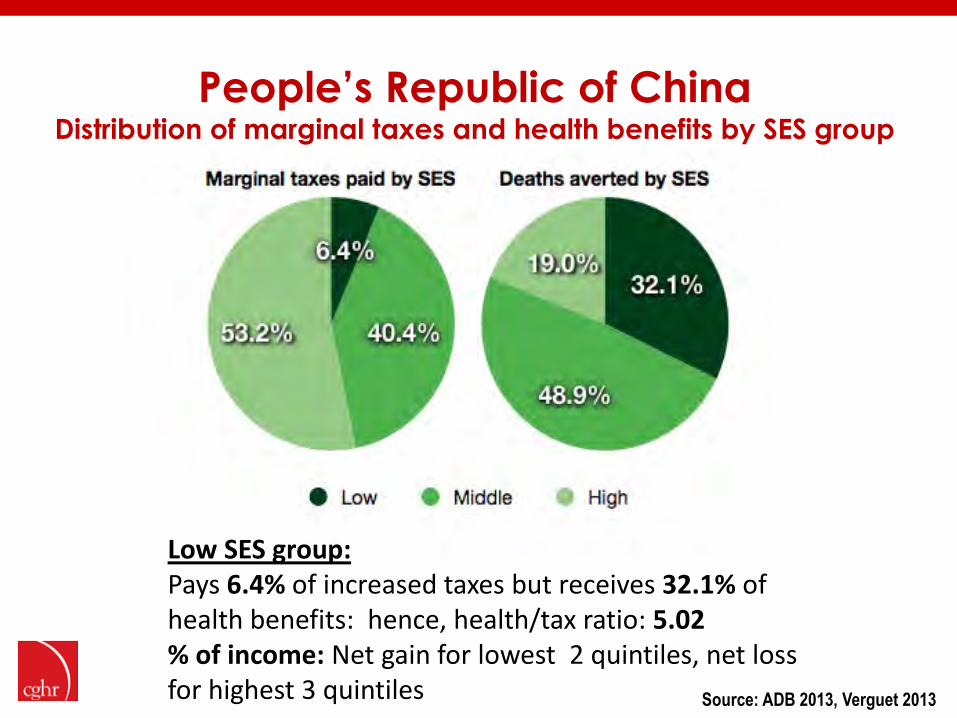
People’s Republic of China Distribution of marginal taxes and health benefits by SES group
Low SES group: Pays 6.4% of increased taxes but receives 32.1% of health benefits: hence, health/tax ratio: 5.02 % of income: Net gain for lowest 2 quintiles, net loss for highest 3 quintiles
Source: ADB 2013, Verguet 2013

CGHR.ORG
United States Distribution of marginal taxes and health benefits by SES group
Low SES group: Pays 12.4% of increased taxes
Receives 34.0% of health benefits Health/tax ratio: 2.74

Global smuggling estimates

Source: World Bank, 2003
Canada Sharply Reduced Taxes in
1993
Tax reduced in an attempt to counter smuggling
IV
-1
2
4
6
8
10
12
1989
1990
1991
1992
1993
1994
1995
Real
price
per
pac
k (US
D)
0
10
20
30
40
50
60
70
80
90
100
Annu
al cig
aret
te co
nsum
ptio
n pe
r ca
pita
(in
pack
s)
Real Price Consumption
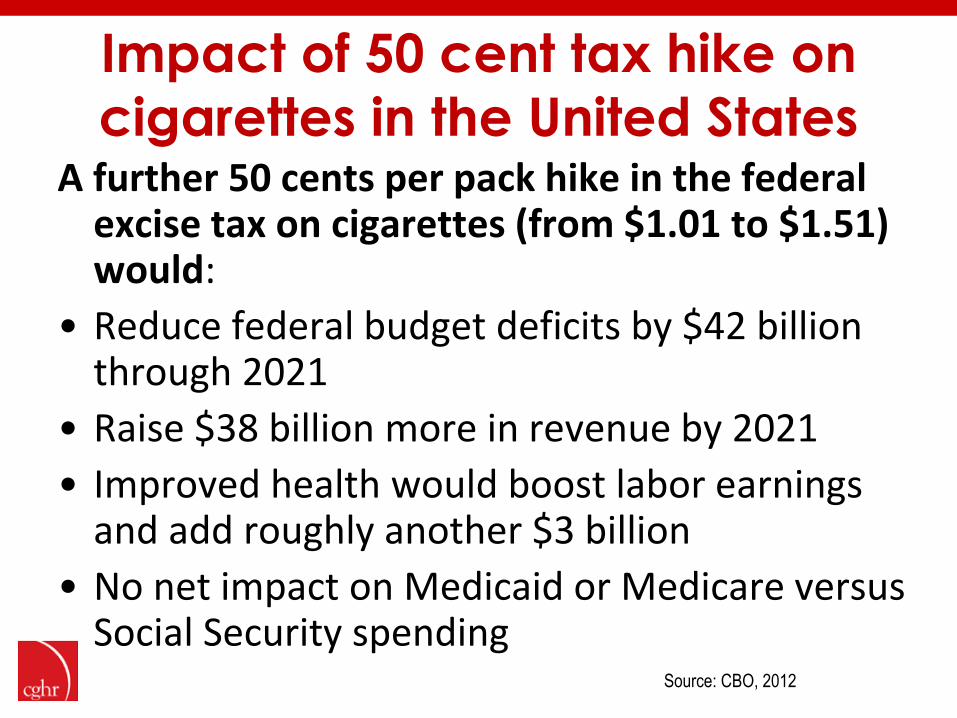
Impact of 50 cent tax hike on
cigarettes in the United States A further 50 cents per pack hike in the federal
excise tax on cigarettes (from $1.01 to $1.51) would:
• Reduce federal budget deficits by $42 billion through 2021
• Raise $38 billion more in revenue by 2021
• Improved health would boost labor earnings and add roughly another $3 billion
• No net impact on Medicaid or Medicare versus Social Security spending
Source: CBO, 2012

Mexico: 7 peso (25%) tax rise, 2010 GOAL: 10 peso hike
• Good epidemiologic analyses – Mexico: ~11 M smokers so 4-6 M will die from smoking
unless they quit – Price elasticities and poverty analyses – Immediate follow up numbers to show increasing revenue,
decreasing consumption, no major smuggling • International seminar with MoF:
• Political visibility – Senator Saro – Organized NGO protests on steps of MoF – Slogan: 10 pesos for 1 million lives saved
• Linked to financing development: – “soft earmarking”- more money focused on poverty
reduction
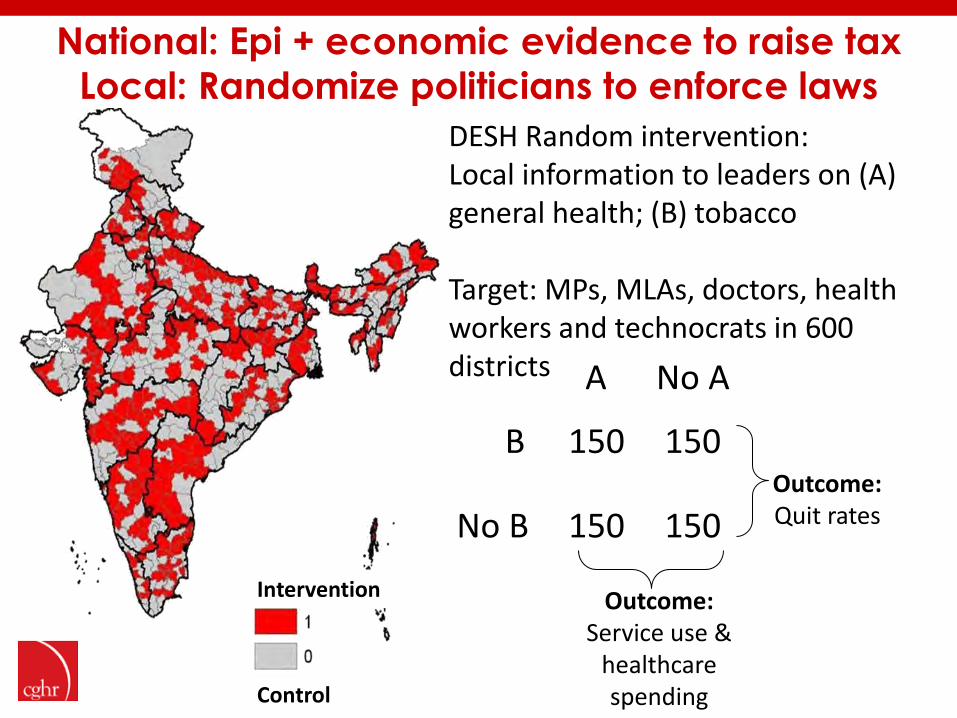
DESH Random intervention: Local information to leaders on (A) general health; (B) tobacco Target: MPs, MLAs, doctors, health workers and technocrats in 600 districts A No A
B 150 150
No B 150 150 Outcome: Quit rates
Outcome: Service use &
healthcare spending Control
Intervention
National: Epi + economic evidence to raise tax
Local: Randomize politicians to enforce laws

0.58
0.24
$0.00
$0.25
$0.50
$0.75
$1.00
$1.25
1965 1970 1975 1980 1985 1990 1995 2000 2005 2010
GD
P p
er
cap
ita
($2
00
5, P
PP,
pe
r d
ay)
Adult Female (15-59 years)
Marginal costs for maximal
child survival are falling
“Critical” incomes is real $ needed to achieve ½ of maximal survival (in that year) from 1970 to 2007
Source: Hum et al, eLife 2012
Child (under 5 years)

0.54
$1.20
0.58
0.24
$0.00
$0.25
$0.50
$0.75
$1.00
$1.25
1965 1970 1975 1980 1985 1990 1995 2000 2005 2010
GD
P p
er
cap
ita
($2
00
5, P
PP,
pe
r d
ay)
Marginal costs for maximal
adult survival are rising
“Critical” incomes is real $ needed to achieve ½ of maximal survival (in that year) from 1970 to 2007; note higher adult costs due in part to HIV and tobacco
Child (under 5 years)
Adult Male (15-59 years)
Source: Hum et al, eLife 2012
Three “hundreds”
by 2030
1. 100 countries/large populations with reliable representative data on causes of death
2. 100 million current smokers quit smoking
3. 100 million existing vascular disease patients on low-cost generic risk pills

Conclusions • On current patterns: 1 Billion smoking deaths this
century, or about 250 million deaths among those <35 years in just 16 countries
• Prolonged smokers lose about one decade of life
• Cessation by age 40 (and preferably earlier) avoids 90% of the excess risk of continued smoking
• Tripling of excise tax worldwide would reduce smoking by 1/3, avoid over 200 million premature deaths, and raise $100 B more in revenue
• Tobacco control does not hurt the poor
• Monitoring is needed: smoking and death status
Source: Jha and Peto, NEJM, Jan 2, 2014

www.cghr.org/tobacco (Don’t buy my books)
@countthedead