evaluation of the hydrological cycle of match driven by ncep
TRANSCRIPT

Atmos. Chem. Phys., 5, 887–908, 2005www.atmos-chem-phys.org/acp/5/887/SRef-ID: 1680-7324/acp/2005-5-887European Geosciences Union
AtmosphericChemistry
and Physics
Evaluation of the hydrological cycle of MATCH driven by NCEPreanalysis data: comparison with GOME water vapormeasurements
R. Lang and M. G. Lawrence
Max-Planck Institute for Chemistry, Mainz, Germany
Received: 15 October 2004 – Published in Atmos. Chem. Phys. Discuss.: 6 December 2004Revised: 7 March 2005 – Accepted: 8 March 2005 – Published: 18 March 2005
Abstract. This study examines two key parameters of thehydrological cycle, water vapor (WV) and precipitation rates(PR), as modelled by the chemistry transport model MATCH(Model of Atmospheric Transport and Chemistry) driven byNational Centers for Environmental Prediction (NCEP) re-analysis data (NRA). For model output evaluation we pri-marily employ WV total column data from the Global OzoneMonitoring Experiment (GOME) on ERS-2, which is theonly instrument capable measuring WV on a global scaleand over all surface types with a substantial data record from1995 to the present. We find that MATCH and NRA WV andPR distributions are closely related, but that significant re-gional differences in both parameters exist in magnitude anddistribution patterns when compared to the observations. Wealso find that WV residual patterns between model and ob-servations show remarkable similarities to residuals observedin the PR when comparing MATCH and NRA output to ob-servations comprised by the Global Precipitation Climatol-ogy Project (GPCP). We conclude that deficiencies in modelparameters shared by MATCH and NRA, like in the surfaceevaporation rates and regional transport patterns, are likely tolead to the observed differences. Monthly average regionaldifferences between MATCH modelled WV columns and theobservations can be as large as 2 cm, based on the analysis ofthree years. Differences in the global mean WV values are,however, below 0.1 cm. Regional differences in the PR be-tween MATCH and GPCP can be above 0.5 cm per day andMATCH computes on average a higher PR than what hasbeen observed. The lower water vapor content of MATCH isrelated to shorter model WV residence times by up to 1 dayas compared to the observations. We find that MATCH hasproblems in modelling the WV content in regions of strong
Correspondence to:R. Lang([email protected])
upward convection like, for example, along the Inter TropicalConvergence Zone, where it appears to be generally too dryas compared to the observations. We discuss possible causesfor this bias and demonstrate the value of the GOME WVrecord for model evaluation.
1 Introduction
The accurate knowledge of the 3-D water vapor (WV) fieldis essential for the understanding of a variety of physical andchemical processes in the atmosphere, and is therefore oneof the key parameters for the accurate modelling of climateforcing and its feedback mechanisms. WV is the strongestgreenhouse gas, because it is the fourth most abundant atmo-spheric constituent, absorbing over large parts of the spec-tral region from the visible up to the infra-red, and becauseof its emission of thermal radiation from the far infrared tothe microwave regions (Learner et al., 2000). WV plays anessential role in the direct and indirect effect of radiativeforcing via its influence on aerosol optical properties andthe formation of clouds and precipitation. WV is a drivingparameter in reactive chemistry related to ozone and HOx.Due to its complex spectroscopic structure, the contributionof WV to the total radiative forcing budget and the vari-ous feedback processes, however, still can not be quantifiedaccurately (Maurellis and Tennyson, 2003; Minschwanderand Desseler, 2004). Detailed parameterizations of aerosoloptical properties and cloud formation in general circula-tion models (GCM) and chemical transport models (CTM)are currently being developed (e.g. in the framework of theEU funded project Particles of Human Origin Extinguish-ing Natural solar radiation In Climate Systems (PHOEN-ICS), or the Global Aerosol Model interCOMparison project
© 2005 Author(s). This work is licensed under a Creative Commons License.

888 R. Lang and M. G. Lawrence: Hydrological cycle of MATCH
(AEROCOM)), but will significantly increase the demand foraccurate knowledge of the 3D-WV distribution in the near fu-ture (Metzger et al., 2002), as well as the demand for data forcross-comparison and model performance evaluation.
Comparisons of global model output to observations of theatmospheric WV distribution from both GCMs and CTMsare still in their early stages due to lack of independent andconsistent observations with global coverage on longer timescales. This paper and a following companion paper willtherefore address the question how well the hydrological cy-cle is represented by a CTM frequently used for modellingof tropospheric ozone and aerosol related chemistry: TheModel of Atmospheric Transport and Chemistry (MATCH).MATCH is, as other CTMs, driven by basic meteorologicalinput data, which are taken from weather center analysis andre-analyses, such as those from the National Centers for En-vironmental Prediction (NCEP) or the European Center forMedium-range Weather Forecasts (ECMWF). In contrast toother CTMs, MATCH is currently, to the best of our knowl-edge, the only CTM where the tropospheric hydrological cy-cle is calculated directly within the model. MATCH maytherefore be characterized as what we call a “semi-offline”CTM. This specific formulation of the MATCH model guar-antees a consistent balance between evaporation fluxes andprecipitation rates (PR), and prevents an under or overesti-mation of the atmospheric WV residence time via a too rapidor too slow conversion of nudged specific humidity in pre-cipitation.
The question posed by this paper is how well are the mainparameters of the hydrological cycle represented by MATCHover longer time series in comparison to data-assimilationmodels like the ECMWF Reanalysis ERA-40 (ERA) and theNCEP/NCAR Reanalysis (NRA). The paper focuses on theevaluation of modelled monthly mean WV content and pre-cipitation amounts computed by MATCH driven by NRA.MATCH has been used for numerous studies of atmosphericchemistry and transport including the chemistry of tropo-spheric ozone and nonmethane hydrocarbons (Rasch et al.,1997; Mahowald et al., 1997a,b; Lawrence and Crutzen,1998, 1999; Lawrence, 2001; Lawrence et al., 1999, 2003a;von Kuhlmann et al., 2003a,b; Bonn et al., 2004; Kunhikr-ishnan et al., 2004a,b; Kunhikrishnan and Lawrence, 2004c;Labrador et al., 2004a,b), and for chemical weather forecast-ing using NCEP reanalysis data (Lawrence et al., 2003b).Differences between model output and observations are ana-lyzed in light of the previously mentioned ongoing studies onnew aerosol and cloud microphysical parameterizations usedin models, which may only be successfully evaluated provid-ing a good understanding of all other parameters and mech-anisms leading to the observed residuals. The evaluation ofthe modelled WV distribution requires appropriate observa-tions on a global scale, preferably from independent sources,which can also be cross-evaluated to help reveal where modeldiscrepancies appear robust in light of measurement errors.The second main purpose of this study is to present such a
set of observations, which we will use to evaluate variousconfigurations of MATCH as well as of the GCM ECHAMversion 5 in subsequent studies.
MATCH and NRA WV distributions will be comparedto independent satellite based remote sensing measurementsfrom the Global Ozone Monitoring Experiment (GOME) onESA’s ERS-2 satellite platform covering the whole globe.GOME WV data retrievals have recently be demonstratedto deliver good results over all surface types and in cloud-free situations (Lang et al., 2003). GOME data is not as-similated in either ERA or NRA and provides a data recordstarting in August 1995 until present, which makes it fa-vorable for model evaluations. The evaluated data periodscover August 1996 to 1998 and January 1996 to 1998, in-cluding the strong El Nino years of 1997 and 1998. The to-tal GOME WV data record available from the GOME WaterVapor Climatology web site (http://www.mpch-mainz.mpg.de/∼saphire/gomeigam/) covers the time period from July2002 to Summer 2003. There is no other instrument witha comparable data record measuring WV on a global scaleand over all surfaces types. Well known instrument suiteslike the TIROS Operational Vertical Sounder (TOVS) and issuccessors (Advanced-TOVS series; 1979 to present), or theSpecial Sensor Microwave Imager (SSM/I) on the DefenseMeteorological Satellite Platform (DMSP) series (1987 topresent) measure WV in the infrared or microwave regionsand are restricted to either land or ocean surfaces (Enge-len and Stephens, 1999). New generations of instrumentslike the Moderate Resolution Imaging Spectroradiometer(MODIS) on the Aqua and Terra platforms (1999–present),the Medium Resolution Imaging Spectrometer (MERIS) andthe SCanning Imaging Absorption spectroMeter for Atmo-spheric CartograpHY (SCIAMACHY) on ESA’s ENVISAT(2002 to present), as well as the instruments more specifi-cally dedicated to WV like the Atmospheric Infrared Sounder(AIRS; 2002 to present) on Aqua and the Infrared Atmo-spheric Sounding Interferometer (IASI) to be launched bythe end of 2005 on EUMETSATs Metop series, will greatlyimprove our knowledge of the tropospheric 3-D WV field.However, the data record of most of these instruments is notyet long enough for valuable model evaluations. It shouldalso be mentioned that, even though significant advances inremote sensing technology have been made in recent yearsand instruments like AIRS and IASI will achieve unprece-dented spatial resolution performances, in order to get thecomplete knowledge of the 3-D WV distribution a combina-tion of data from various sensors as well as radiosondes willstill be required within the foreseeable future. This study willdemonstrate the value as well as the limitations of the GOMEWV data record and that of its successors (SCIAMACHY onENVISAT and GOME-2 on the METOP series) to contributeto blended WV products for model evaluation.
From the model output comparisons to the observationswe find that regional differences in WV residence time(RT) are likely due to differences in the modelled surface
Atmos. Chem. Phys., 5, 887–908, 2005 www.atmos-chem-phys.org/acp/5/887/

R. Lang and M. G. Lawrence: Hydrological cycle of MATCH 889
evaporation rate or the regional transport patterns, whichboth are shared parameters between MATCH and NRA. Wefurther conclude that a too rapid conversion of WV to pre-cipitate in MATCH, especially in instances of strong convec-tion, leads to regionally too dry model results and in turn toregionally and also globally underestimated WV residencetimes.
In Sect. 2 we describe the various sources used forMATCH model output evaluation starting with a detaileddescription of the GOME WV product (Sect.2.1). This isthe first use of the GOME WV-record for model evaluation.Satellite based WV measurements from SSM/I briefly de-scribed in Sect.2.3 are used together with radiosonde datato demonstrate the feasibility of using GOME WV data formodel evaluations over ocean and land surfaces. The me-teorological input parameters from NRA used in MATCHwill be discussed in Sect.4 for their crucial influence on theMATCH hydrological cycle and the specific implementationof the MATCH model employed here is laid out in Sect.5.A more comprehensive and in-depth description of the datasets used here and an additional validation of GOME WVfields employing data from the NASA Water Vapor Project(NVAP) can be found in the earlier, more detailed version ofthe paper (Lang and Lawrence, 2004).
After having evaluated the GOME WV record over thethree years period of interest in Sect.6 we compare monthlyaveraged WV fields computed by MATCH for differentperiods with results from GOME, NVAP and NRA inSect. 7.1. Therein, residuals between rain gauges mea-surements compiled by the Global Precipitation Climatol-ogy Project (GPCP) (Rudolf, 2001) (for a description ofthe GPCP data set see Sect.3) and model as well as re-analysis fields, will be compared to derived residuals fromcomparisons of model WV fields with GOME measure-ments. We will focus on regions like Europe and the South-ern Asian/Indian Ocean area, which are of specific inter-est with respect to the impact of anthropogenic and non-anthropogenic aerosol load on the parameters of the hydro-logical cycle. The results will be discussed in order to dif-ferentiate between MATCH model-related effects on the ob-served residual patterns and differences caused by the in-fluence of NRA data on the model results. We will finallydraw conclusions which will provide a basis for following-up MATCH model sensitivity studies using different sets ofreanalysis data and different assumptions for the basic pa-rameters.
2 Water vapor measurements
In the following we briefly describe the most important as-pect for the data sets employed for model output evaluation.More details on the instruments and the specific data setsused can be found in the provided references and inLangand Lawrence(2004).
2.1 GOME
The Global Ozone Monitoring Experiment (GOME) spec-trometer on the European Space Agency’s ERS-2 satel-lite (ESA, 1995; Burrows et al., 1999) measures backscat-tered solar radiation continuously between between 240 and790 nm with a spectral resolution of on average 0.22 nm inthe visible and near infrared regions. The instrument mea-sures on a spatial resolution of 40 by 320 km at three dif-ferent observation angles, west, nadir and east scanning, re-sulting in a total swath width of 960 km. ERS-2 crosses theequator at about 10:30 local time. Measurements presentedhere make use of the 580 nm absorption band covered by 185detector pixels between 560 and 600 nm. This spectral re-gion also contains additional broad-band absorption featuresof the O3 Chappuis absorption band and a strong absorp-tion by (O2)2 (Lang et al., 2002; Lang and Lawrence, 2004).The forward model employed is the Spectral Structure Pa-rameterization (SSP) model (Maurellis et al., 2000a; Langet al., 2003) including direct-surface and single-scatteringpath contribution. SSP already demonstrated its capability toderive total water vapor column (WVC) values over all sur-face types in cloud-free situation with an accuracy of 0.3 cmfor moderate aerosol-impact scenarios based on more than300 representative GOME retrievals and 0.5 cm in aerosolrich environments (Lang et al., 2003, see also Sect.6). Sofar, WVC from the GOME instrument has been derived forspecific case studies only (Noel et al., 1999; Noel et al., 2002;Maurellis et al., 2000b; Casadio et al., 2000; Wagner et al.,2003; Lang et al., 2002, 2003), which have not yet demon-strated their potential for transport model evaluation overlonger time series. Apart from providing WVC over all sur-face types and in cloud-free situations, GOME WVC are anindependent measurement validation from water vapor fieldsdelivered by the NCEP or ECMWF reanalysis set, which arefrequently used for data assimilation or evaluation in CTMs.In contrast, SSM/I and (A)TOVS WVC are routinely assim-ilated in the mentioned reanalysis sets. The coarse spatialresolution is one of the major disadvantages of the GOMEdata set, resulting in a significant amount of ground pixelsidentified as being affected by clouds and therefore havingto be removed from the analysis. However, with its datarecord of now more than nine years, the instrument data setis well suited for the evaluation of model-parameters fromtransport models or even from general circulation model out-put, where usually monthly averaged quantities of more thansix to seven years are required for meaningful climatologicalcomparisons with measured data.
2.2 GOME cloud mask
The quality of the detection of clouds within the observedslant path is a crucial criterion for the quality of troposphericretrievals from instruments measuring in the visible and in-frared region. Clouds may alter the retrieved total column
www.atmos-chem-phys.org/acp/5/887/ Atmos. Chem. Phys., 5, 887–908, 2005

890 R. Lang and M. G. Lawrence: Hydrological cycle of MATCH
results in two ways: either by blocking the light from trav-elling through the lower regions of the atmosphere leading,in case of WV, to a reduced total column retrieval, or by in-creasing the path length due to multiple scattering inside or atthe cloud edges, which may in contrast lead to an increasedcolumn retrieval depending on cloud height and geometry.The accurate detection of clouds within the line-of-sight ofthe instrument is therefore of crucial importance for the ac-curacy of the retrieved total column values. The standardretrieval of cloud top pressures (CTP) from the GOME in-strument employs the detected optical thickness of molecularoxygen or its collision complex (O2)2. Here we make use ofthe (O2)2 absorption feature with a maximum around 577 nm(Naus and Ubachs, 1999). The retrieved CTP is then used tolabel a measurement being affected by clouds in case the re-trieved value is below a certain limit. The choice of this limitis, however, somewhat arbitrary. From previous studies it isknown that pixels with cloud cover of less than 15% do notaffect the total column values more than other identified sys-tematic measurement biases do (Lang et al., 2003). CTP val-ues from the (O2)2 retrieval are therefore correlated to cloudfraction values from the Fast Retrieval Scheme for Cloudfrom the Oxygen A-band (FRESCO) (Koelemeijer et al.,2001) and for a representative set of GOME retrievals (Langand Lawrence, 2004). From the correlation of both parame-ters we reveal a CTP derived limit of 500 m above the groundcorresponding to pixels with on average less than 15% cloudcover. It has to be noted that the removal of retrievals withcloud cover fractions above 15% significantly reduces thestatistics with respect to the calculation of monthly mean val-ues especially in regions with high cloud coverage like, forexample, the tropics (see Sect.6). For details on the clouddetection scheme and comparisons to FRESCO results werefer the reader toLang and Lawrence(2004).
2.3 SSM/I
The Special Sensor Microwave/Imager (SSM/I) (Hollingeret al., 1990) has been in orbit since 1987 on various plat-forms, predominantly of the Defense Meteorological SpacePrograms (DMSP) F-platform series. For the purpose of thisstudy we use data from the F-13 and F-14 platforms. Thealgorithm used for retrieval results presented here has beendeveloped byWentz(1997). Since the retrieval of WVC issensitive to the retrieved surface brightness the retrievals arerestricted to ocean surfaces only employing climatologicalbrightness values. The rms accuracy of the modelled bright-ness temperature over the ocean is estimated to be between0.5 and 1 K and the rms on the retrieved WVC is estimated tobe 0.12 cm with an bias of 0.6 mm. From a detailed analysisof SSM/I averaging kernels and response functions,Engelenand Stephens(1999) reveal that SSM/I is especially sensitiveto the lower troposphere over ocean surfaces, which is impor-tant for the quality of the total column WV product. SSM/Iretrievals are not affected by clouds except those with heavy
precipitation events. For a more detailed description of theSSM/I WVC data set as used here we refer toWentz(1997);Engelen and Stephens(1999); Lang and Lawrence(2004).
3 Precipitation measurements
The Global Precipitation Climatology Project (GPCP) pro-vides global gridded precipitation estimates from raingaugeand satellite observations on a 2.5◦ by 2.5◦ horizontal grid(Huffman et al., 1997; Rudolf, 2001). The data set com-prises data from geostationary and polar-orbiting satellitesover land and ocean region, as well as analysis of raingaugestations from about 7000 geolocations over land surfaces.Data is available starting from 1979 and is updated on anear real time basis. GPCP precipitation amounts have beencompared to the NCEP-NCAR Climate Prediction CenterMerged Analysis of Precipitation (CMAP) (Xie and Arkin,1997) in various studies (Gruber et al., 2000; Rudolf, 2001).Differences between the two data sets can be as large as0.65 cm per day, where GPCP shows more precipitation overhigh latitude oceans, and less for Indonesia and the tropicalPacific for a case study based on monthly averaged data ofJanuary 1999 (Rudolf, 2001). The agreement between bothdata sets for zonally averaged values is, however, much betterand differences are usually below 0.1 cm in the tropics.
4 The NCEP reanalysis data sets
The NCEP reanalysis (NRA) system described in detail byKalnay et al. (1996) employs the NCEP global spectralmodel with 28 sigma vertical levels and a horizontal trian-gular truncation of 62 nodes, which relates to about 200 km.A 3-dimensional variational (3-D-Var) scheme for assimila-tion of observational data is employed in spectral space us-ing the 6-h forecast results of the model as the initial guessvalues. This also means that in regions with little data for’adjustment’ the analysis is dominated by the model charac-teristics, such as convective parameterization (as discussedin the following section). NRA uses data from upper air raw-insonde observations of temperature, horizontal wind, andspecific humidity, from TOVS vertical temperature sound-ings over ocean except between 20 north and 20 south due torain contamination, and TOVS temperature soundings overland above 100 hPa (for details on the individual data setseeKistler et al., 2001). For the focus period of this paperstarting 1995, all of the named observation sources had beenavailable.
A large set of output parameters are delivered by the re-analysis, a good fraction of which has been calculated online(model predicted) and have not been based on observationaldata directly and are labelled “C” variables (here we adaptthe notation byKistler et al., 2001). Others rely to a sig-nificant portion on the initial guess forecast values and are
Atmos. Chem. Phys., 5, 887–908, 2005 www.atmos-chem-phys.org/acp/5/887/

R. Lang and M. G. Lawrence: Hydrological cycle of MATCH 891
labelled with “B”. Those which are dominated by the ob-servations are labelled “A”. “A” variables are, for example,upper air temperature and wind fields, whereas all moisturevariables and those near the surface are usually labelled “B”.Evaporation and precipitation are “C” variables. Moisture isa generally poorly measured variable in comparison to windsand temperature and is therefore a prototypical “B” variable.To the best of our knowledge little has been done so far toevaluate the water vapor fields of reanalysis model outputwith independent sources. This may be partly due to the lackof WV measurements on global scale which are not alreadyassimilated in the NRA or ERA model.Kistler et al.(2001)report that a comparison of relative humidity between NRAand ERA shows qualitatively good agreement with, however,systematic differences in relative humidity of the order of10%. These are large differences when compared to the in-terannual variability.
For the parameterization of moist convection NRA uses anumber of significantly different parameterization than ap-plied in MATCH (see following section).
5 MATCH
The Model of Atmospheric Transport and Chemistry(MATCH) is an “semi-offline” model, where the most basicmeteorological parameters, apart from those of the hydrolog-ical cycle, come from weather center analysis or reanalysisdata. The model has been described in detail byRasch et al.(1997); Mahowald et al.(1997a,b); Lawrence et al.(1999).Here we use temperature, pressure, horizontal winds, sur-face wind stresses, latent and sensible heat flux from NRA,described before, for model calculations of the months Jan-uary and August between 1996 and 1998. The runs are per-formed at a horizontal resolution of T63 (96 by 192 latitude-longitude grid) corresponding to the resolution of the NRAinput fields provided by NCAR. The terrain following 28 ver-tical sigma layers employed by NRA have been adopted. Themeteorological data is read in every 6 h and is linearly inter-polated to model time steps in between. The model includesrepresentations of resolved scale transport, convective trans-port, boundary layer transport, and scavenging and deposi-tion of soluble gases (Lawrence, 1996; Lawrence et al., 1999;von Kuhlmann et al., 2003a). In contrast to other CTMs,MATCH has the capability of simulating online all cloud pro-cesses such as cloud water and ice content, cloud fraction,fraction of water converted to rain and snow as well as evap-oration of hydrometeors. Using the evaporation at the surfacefrom NRA, MATCH then calculates the full tropospheric hy-drological cycle online. In diagnosed mode, the model runsapproximately 4 times faster than the Commmunity ClimateModel (CCM) of NCAR (Rasch et al., 1997).
For resolved transport of cloud water the model uses theflux-form semi-Lagrangian scheme called SPITFIRE (Raschand Lawrence, 1998) with a correction for the surface-
pressure mismatch between interpolated input and modeldata (for details, seeJockel et al., 2001; von Kuhlmannet al., 2003a). For the parameterization of moist convectionMATCH uses two schemes successively. First, the deep pen-etrative convection scheme byZhang and McFarlane(1995)is applied, reducing convective available potential energy(CAPE) within the total column from the surface to the up-per troposphere. Then, a local convective adjustment schemeby Hack (1994) is used to remove all remaining instabili-ties, representing shallow convection and mid-level convec-tion not originating in the boundary layer. The sensitivity ofMATCH to the NRA input data and the convection parame-terization employed is described in Mahowald et al. (1997a,b).
The parameterization of cloud microphysics in MATCHfollows the parameterization developed byRasch andKristjansson(1998). The cloud fraction parameterizationdepends on relative humidity, vertical motion, static stabil-ity, and convective properties and is based on the work bySlingo(1987). The convective cloud fraction is proportionalto the rate at which mass is detrained from the parameter-ized convective updrafts above 500 mb, and to the convec-tive mass flux for the updraft core cloud fractions. Cloudsare permitted in all tropospheric layers. The total mass ofcondensate within each gridbox is predicted for both liquidand ice clouds and the conversion from condensate to pre-cipitation uses a bulk microphysics model. Precipitation val-ues are then in turn used to drive wet scavenging of solublegases. The scavenging parameterization has been developedand tested inLawrence and Crutzen(1998); Lawrence et al.(1999); Crutzen and Lawrence(2000).
A detailed study of the distribution of MATCH modelledWV with respect to the output of other GCMs or CTMs, andthe distribution of precipitation and WV with respect to mea-surements using meteorological reanalysis input fields hasnot previously been carried out.
Here, in addition to comparing the MATCH WV with ob-servations, we also compare it directly with the WV from theNRA (which is only used to initialize the simulations, butis not read in afterwards). There are significant similaritiesand differences between the MATCH and the NRA model.First, the source of WV to the troposphere is the same, sinceMATCH uses the evapotranspiration rates (converted fromlatent heat fluxes) directly from NRA. Both models includeparameterizations for the main sub-gridscale physical pro-cesses. The two which are most important for the hydro-logical cycle are the large-scale cloud microphysics and thedeep convection. TheRasch and Kristjansson(1998) 4-phasebulk microphysics scheme used in MATCH for the large-scale cloud microphysics is considerably more complex thanthe supersaturation approach with Kessler-based evaporationof precipitation used in NRA. On the other hand the Zhangand McFarlane (1995) scheme used for deep convection inMATCH is based on the same basic principles as thePanand Wu (1994) scheme used in NRA (both being a bulk
www.atmos-chem-phys.org/acp/5/887/ Atmos. Chem. Phys., 5, 887–908, 2005

892 R. Lang and M. G. Lawrence: Hydrological cycle of MATCH
1 2 3 4 5 6
1
2
3
4
5
6
Pearsons r2 = 0.7970 ± 0.0401
b (99% confid.)= 0.9710 ± 0.0165
σ = 0.5135 [cm]
GOME−SSP TWVC [cm]
Rad
ioso
ndes
TW
VC
[cm
]
Fig. 1. Comparison between GOME WVC and radiosonde mea-surements from the ECMWF operational network for January andAugust 1995 to 2000. Values are correlated spatially and within 3 hin time. Pink and blue circles indicate Asian and Indonesian son-des, green circles indicate sondes from Europe, and yellow circlesdenote North American sonde values.
re-formulation of theArakawa and Schubert(1974) plumeensemble quasi- equilibrium scheme, with a closure on thecloud work function, which can be thought of as the con-vective available potential energy (CAPE) applicable to anensemble of entraining plumes). However, there are severaldifferences in the assumptions used in the two convectionschemes, e.g., regarding the distribution of the base mass fluxas a function of the plume entrainment rate. Thus, differenceswhich we note below could be due to either the cloud micro-physics or deep convection schemes (or as well due to theadvective or vertical diffusive transport), which will need tobe investigated in more detail on an individual basis in futurestudies.
6 GOME WV fields
Figure1 shows the comparison between GOME WVC andradiosonde data from the operational weather center sondenetwork provided by ECMWF. The scatter plots comparesdata from August and January between 1996 and 2000. Thedata is taken from launch sites located within the area cov-ered by one GOME ground pixel and with a temporal corre-lation of less than three hours and cloud covers below 15%.Correlations have predominantly been found over Indonesiaand Europe with some additional stations over North Amer-ica. The significant scatter of 0.4 cm is likely related to theproblem in correlating a single sonde measurement to thearea of 40 by 320 km covered by the GOME instrument. Inaddition, the quality of the sonde data can vary significantly
(a)
(b)
Fig. 2. Comparison between GOME WVC and those from theSpecial Sensor Microwave Imager on the Defense MeteorologicalSatellite Platforms F13 and F14 measurements for January (upperpanel) and August (lower panel) 1996 to 1998. Values are correlatedspatially and in time within 4 h until 1997 and 2 h after 1997.
depending on the type of instruments used, on-site monitor-ing of measurements and the post measurement quality checkof the data. Here, only data with more than four measure-ments per launch have been used. Apart from removing datawith physically unrealistic numbers, no additional quality as-surance techniques have been applied, which may cause anumber of measurements to deviate significantly from theGOME measurements. However, quality assurance of ra-diosonde data is a very complex and difficult task requiredfor climate change monitoring (Lanzante et al., 2003) butof less importance for relative short time scale comparisons.The bias of the correlation is found to be below 2.5% witha correlation of 70%, both supporting the high credibility ofGOME data over land surfaces.
Atmos. Chem. Phys., 5, 887–908, 2005 www.atmos-chem-phys.org/acp/5/887/

R. Lang and M. G. Lawrence: Hydrological cycle of MATCH 893
(a) (b)
Fig. 3. GOME-SSP WVC total retrieval error for the monthly mean retrieved values of January (upper panel) and August (lower panel)1996–1998. Missing values due to low statistics (high cloud frequency) or operational instrument calibrations (above Pakistan) are maskedout and indicated in white. The relative error varies between below 5% over the subsidence region, 25% between 50 to 60 (30 to 40) degreeand 50% and more above 70 (60) degree for hemispheric summer (winter).
Over ocean surfaces we compare GOME WVC data withspatially correlated gridded (0.5 by 0.5◦) SSM/I data fromSSM/I descending orbits of the F13 and F14 DMSP satel-lite platforms (see Sect.2.3). Figure2 shows the correla-tion for August 1996 to 2000 and January 1996 to 2000 (ex-cluding January 1999 because of an instrumental problem ofGOME affecting the employed spectral region of the WVabsorption). The standard deviation is smaller than 0.5 cm,which we attribute to the significant differences between theinstruments’ spatial resolution (25 km resolution for SSM/Ias opposed to 40 by 320 km resolution for GOME) and thereduced sensitivity over ocean surfaces for the GOME instru-ment as compared to land surfaces. The bias of this compar-ison is smaller than 1%. This demonstrates the capability ofGOME to achieve good accuracy in WVC also over oceansurfaces, however, associated with an averaged increase inthe retrieval error due to the low reflectivity of the ocean sur-face and therefore an increased contribution of photons scat-tering above the surface. GOME-SSP also exhibits a numberof dry spots along the ITCZ and the Pacific warm pool re-gions, which are not visible in the SSM/I product, most ofwhich can be attributed to unsatisfactory removal of cloudsand low measurement statistics as they are also visible in thethree years averaged comparisons with SSM/I data. For addi-tional comparisons of GOME-SSP WVC with data monthlymean values from the NASA Water Vapor Project we referthe reader toLang and Lawrence(2004).
Figure3shows the global distribution of the monthly meanretrieval error for August and January 1996 to 1998 as pro-vided by the distribution matrix of the individual retrievalsand consisting of an estimate of the model-parameter error,the forward-model error and the retrieval noise contributions(for details on the error analysis, the impact of multiple scat-
tering and aerosol loading on the retrieval, we refer toLanget al., 2003). The forward model error contribution con-tains the impact of aerosol scattering and absorption on theretrieval for two reference maritime and rural aerosol sce-narios employed in dependence of the observed geolocation.The error values delivered by the retrieval are therefore goodestimates of an upper error bound. This is due to the factthat, especially for the rural aerosol case, the employed sce-narios are more an exception than a standard. The figureshows that the error is smallest (below 0.1 cm) in the sub-sidence regions with relatively large WV content and littlecloud cover, i.e., good statistics. For the strongest WV sig-nals along the ITCZ but small number of measurements theerror is around 0.25 cm. The error is largest (up to 0.5 cm) athigh latitudes, where the WV absorption signal is weak bothdue to the low WV content (nearly three orders of magnitudelower at the poles as compared to the ITCZ) and due to largesolar zenith angles (SZA). Large SZA correspond to largeair masses traversed by the detected photons, which in turnlead to high contributions of multiple scattering out and intothe light path, which is not explicitly accounted for by theretrieval model. Therefore we generally restrict the retrievalto latitudes within 70 to 80◦ of the equator. The number ofmeasurements averaged over one month (three years) variesbetween 2 to 5 (6 to 15) measurements along the ITCZ and upto 15 (45) for the highest latitudes. The higher retrieval errorsat high latitudes are partially compensated in the multi-yearaverage by the better statistics in these regions due to over-lapping satellite passes. The relative error varies betweenbelow 5% along side of the ITCZ and the subsidence region,25% between 50 to 60◦ and 100% and more around 70◦ andabove for the hemispheric winter. In the hemispheric sum-mer the relative error at 70 degrees is around 25 to 50%.
www.atmos-chem-phys.org/acp/5/887/ Atmos. Chem. Phys., 5, 887–908, 2005

894 R. Lang and M. G. Lawrence: Hydrological cycle of MATCH
(a) (b)
(c) (d)
(e) (f)
Fig. 4. Monthly averaged WVC for August (left panels) and January (right panels) 1998 from GOME (upper panels) and MATCH (middlepanels). The lower panels show the differences between the monthly mean values. The GOME retrieved cloud-mask has also been appliedto MATCH.
In summary, and as has been discussed in detail inLangand Lawrence(2004), there are four main caveats concern-ing the monthly averaged WVC from GOME as presented
here: First, there are some unusually high column values ataround 15◦ north of the equator over the African continentfor August 1998, which might be related to the impact of
Atmos. Chem. Phys., 5, 887–908, 2005 www.atmos-chem-phys.org/acp/5/887/

R. Lang and M. G. Lawrence: Hydrological cycle of MATCH 895
(a) (b)
(c) (d)
(e) (f)
Fig. 5. Same as Fig.4 but for three years averaged WVC for August (left panel) and January (right panels) 1996 to 1998.
Saharan dust and an increased contribution of multiple scat-tering, which is not accounted for by the retrieval method.Second, the surface albedo retrieval around the 590 nm re-trieval window is a matter of concern, because the retrievalassumes a linear behavior of the albedo over the spectral
region applied, which is usually not the case for predomi-nantly green surfaces in, for example, tropical rainforest re-gions of the spectrum. This may lead to an underestimationof the actual WVC in these areas. Third, GOME exhibits adry bias over oceanic regions at mid to high latitude and for
www.atmos-chem-phys.org/acp/5/887/ Atmos. Chem. Phys., 5, 887–908, 2005

896 R. Lang and M. G. Lawrence: Hydrological cycle of MATCH
(a) (b)
(c) (d)
Fig. 6. Same as Fig.5 but for WVC from NRA. The GOME retrieved cloud-mask has also been applied to NRA.
hemispheric winter when compared to SSM/I data. This biasmay be due to the impact of hygroscopic aerosols (like, forexample, sea salt), which grow significantly under high rela-tive humidity conditions forming haze and thin cloud layers,which is not properly detected by the cloud masking schemeand may therefore lead to an underestimation of the retrievedcolumn. This bias has also been observed in comparisonwith NVAP WV data. Fourth, regions of the ITCZ are pre-dominantly covered by clouds, which leads to a significantlyreduced statistical basis and increased biases in the GOMEdata, as well as to an increased impact of residual cloud con-tamination on the retrieved WVC from GOME. Biases dueto these systematic effects are found to be of the order of 0.4to 0.5 cm and can be as much as 1 cm locally in the case ofcloud contaminated ITCZ regions with high WVC (see alsoLang and Lawrence, 2004).
7 Results
In this section the key results of the comparisons betweenmodelled WV and precipitation fields and the measurementsare presented, including a discussion on the implication ofthese results with regard to the model performance and thequality of the driving reanalysis data.
7.1 Method of comparison
Monthly averaged WVC distributions for August and Jan-uary 1996 to 1998 have been modelled employing theMATCH CTM with driving meteorological input parametersfrom NRA, as has been described in Sect.4 and 5 of thispaper. MATCH results have been written out at 10:30 localtime to achieve maximum temporal overlap with GOME. Forcomparisons between model and measurements we will firstcompare the model results with the observations on a globalscale including globally and zonally averaged comparisonsand then focus on regional scales with two exemplifying re-gions, Europe and the Southern Asian/Indian Ocean region.
Atmos. Chem. Phys., 5, 887–908, 2005 www.atmos-chem-phys.org/acp/5/887/
R. Lang and M. G. Lawrence: Hydrological cycle of MATCH 897
−80 −60 −40 −20 0 20 40 60 800
0.5
1
1.5
2
2.5
3
3.5
4
4.5
5
5.5
[cm
]
Latitude
Zonally averaged WVC August 1998
MATCH NVAP NRA GOME−SSP
(a)−80 −60 −40 −20 0 20 40 60 80
0
0.5
1
1.5
2
2.5
3
3.5
4
4.5
5
5.5
[cm
]
Latitude
Zonally averaged WVC January 1998
MATCH NVAP NRA GOME−SSP
(b)
−80 −60 −40 −20 0 20 40 60 800
0.5
1
1.5
2
2.5
3
3.5
4
4.5
5
5.5
[cm
]
Latitude
Zonally averaged WVC August 1996 to 1998
MATCH NVAP NRA GOME−SSP
(c)−80 −60 −40 −20 0 20 40 60 80
0
0.5
1
1.5
2
2.5
3
3.5
4
4.5
5
5.5
[cm
]
Latitude
Zonally averaged WVC January 1996 to 1998
MATCH NVAP NRA GOME−SSP
(d)
1996 1997 19981.8
1.9
2
2.1
2.2
2.3
2.4
2.5
2.6
2.7
2.8
[cm
]
January
Globally averaged WVC August 1996 to 1998
MATCHNVAPNRAGOME−SSP
(e)1996 1997 1998
1.9
2
2.1
2.2
2.3
2.4
2.5
2.6
[cm
]
January
Globally averaged WVC January 1996 to 1998
MATCHNVAPNRAGOME−SSP
(f)
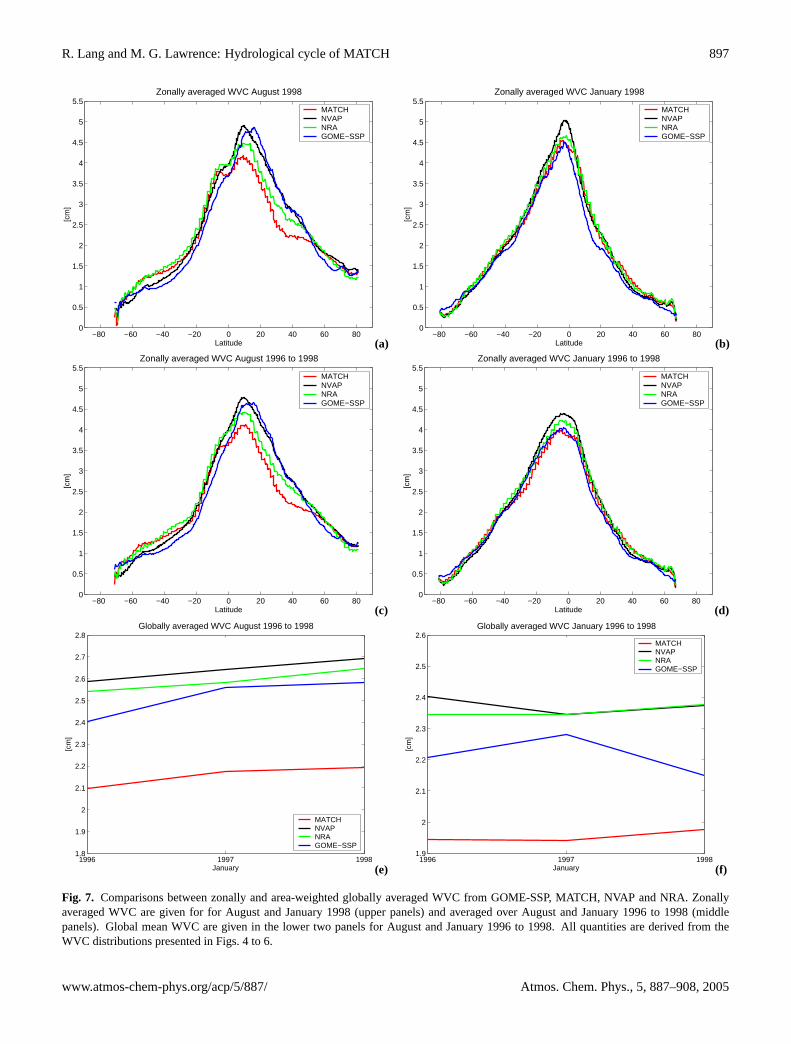
Fig. 7. Comparisons between zonally and area-weighted globally averaged WVC from GOME-SSP, MATCH, NVAP and NRA. Zonallyaveraged WVC are given for for August and January 1998 (upper panels) and averaged over August and January 1996 to 1998 (middlepanels). Global mean WVC are given in the lower two panels for August and January 1996 to 1998. All quantities are derived from theWVC distributions presented in Figs.4 to 6.
www.atmos-chem-phys.org/acp/5/887/ Atmos. Chem. Phys., 5, 887–908, 2005

898 R. Lang and M. G. Lawrence: Hydrological cycle of MATCH
Table 1. Absolute global, hemispheric and tropical area-weighted mean values for WVC modelled by MATCH. WVC mean values fordifferent cloud masking are shown together with their relative differences with respect to the full mean values.
Global 30◦ N–90◦ N 30◦ S–30◦ N 90◦ S–30◦ S
August 1996–1998 [cm] [%] [cm] [%] [cm] [%] [cm] [%]
MATCH all ground pixels 2.38 100 2.05 100 3.24 100 1.03 100MATCH with GOME cloud mask 2.40 100.84 1.98 96.59 3.12 96.29 1.24 120.62MATCH with common cloud mask 2.15 90.33 1.78 86.83 2.81 86.73 0.96 93.39
January 1996–1998
MATCH all ground pixels 2.16 100 0.80 100 3.15 100 1.54 100MATCH with GOME cloud cover 2.22 102.78 0.98 122.50 3.07 97.46 1.55 100.65MATCH with common cloud mask 1.92 88.89 0.75 93.75 2.72 86.35 1.27 82.46
Figures4 to 7 show the monthly averaged global and zonalWVC distribution as modelled by MATCH and NRA andas measured by GOME-SSP in January and August 1998(Figs.4 and7), as well as for the three years average from1996 to 1998 for both months (Figs.5 to 7). It is very im-portant to emphasize that for all comparisons presented herethe cloud-mask derived from the GOME-SSP retrievals hasalso been applied to the model values, including the zonallyand globally averaged results. This has consequences for theaccuracy of the presented absolute values.
Applying a cloud mask reduces the calculated mean WVCvalues as compared to the unmasked model output in thetropics and for hemispheric summer when data up to thehighest latitudes with the smallest WV content are avail-able from the satellite data. In contrast, for instances ofhemispheric winter, cloud masking may lead to an evenhigher hemispheric mean value as compared to the unmaskedmeans. This is because high latitudes with very low WVC(especially for hemispheric winter) see more cloud cover andare therefore masked out applying the GOME cloud mask.These two effects nearly cancel each other out for the globalmean values (see Table1).
The application of cloud-masking of model data also in-fluences the relative comparison between observation andmodel results because of an effect we hereafter will refer toas the “common-cloud-problem”. Table1 denotes an “ar-tificial” moistening effect of the model results by applyingthe GOME cloud mask to the model output. This is becausepixels with cloud contamination are usually corresponding tohigh WVC amounts relative to surrounding clear-sky pixels.However, ground pixels identified as cloudy by the GOMEmeasurement do not necessarily correspond to cloudy pix-els in the model. As a consequence of applying the mea-sured GOME cloud mask to the model, this will generallylead to moister model results as compared to clear-sky sce-nario for the measurements, because the GOME cloud-maskwill partly mask out model clear-sky pixel and leave cloudymodel pixels (with relatively high WVC) in the analysis. Theimpact of the “common-cloud-problem” on the comparisonsis shown by comparing the results of the third row for both
month in Table1 with the results of row two. Row three de-notes model mean values for all pixels which are denoted ascloud-free due to both the model results and the satellite ob-servations. The differences between row two and three are ofthe order of 0.3 cm (10%) when compared to applying onlythe GOME cloud mask to the model results.
7.2 MATCH and GOME WV fields
Figures4 to 6 show that MATCH generally models the globalWV distribution quite well, from the moist ITCZ regions tothe dry polar regions. MATCH also resembles the overallshape of the moist and convective regions. However, sig-nificant differences between MATCH and GOME-SSP existon regional scales and in the magnitude of the WVC distribu-tion. MATCH is systematically lower than what has been ob-served over the Atlantic ITCZ and in the Pacific warm-poolregion for both seasons (Figs.4 and5) and the moist areascommonly extend more to the north and to the south. Themost pronounced features occur in the Western Pacific con-vergence zone. Here, MATCH significantly overestimatesthe southern branch of the Western Pacific split ITCZ inAugust and exhibits a too broad and moist feature in Jan-uary in the same region, when compared to GOME measure-ments. These features become less pronounced when com-paring to the three years averages including also the non-ElNino year 1996 (Fig.5). MATCH is generally moister thanGOME-SSP over the northern hemisphere (NH) landmassesof Canada, as well as wide parts of Russia and the south-ern hemisphere (SH) oceans for August (Figs.4 and5). Thelow bias of GOME-SSP over the SH oceans as observed inthe intercomparisons to SSM/I values is also visible for theMATCH comparisons. Consequently, for January, Figs.4and5 show that MATCH is generally high as compared toGOME-SSP for NH oceans, whereas MATCH agrees gener-ally quite well with what has been observed by GOME overNH land masses, with dry biases for Central Africa and theCentral Amazon region.
Atmos. Chem. Phys., 5, 887–908, 2005 www.atmos-chem-phys.org/acp/5/887/
R. Lang and M. G. Lawrence: Hydrological cycle of MATCH 899
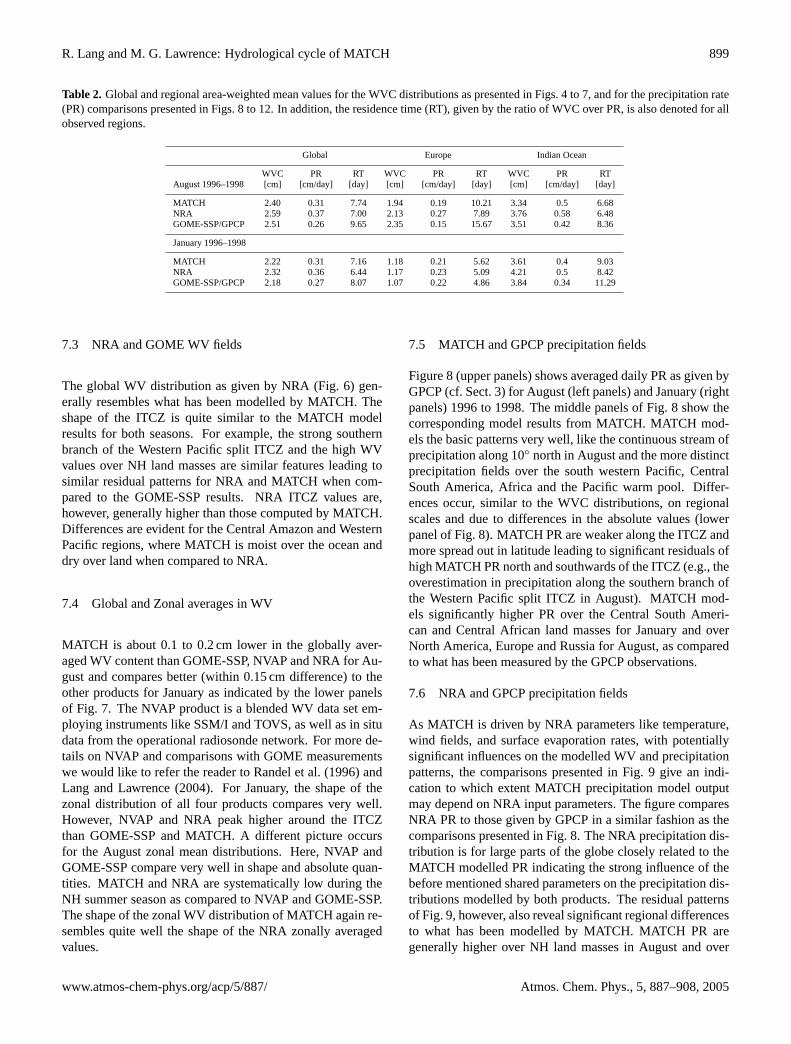
Table 2. Global and regional area-weighted mean values for the WVC distributions as presented in Figs.4 to 7, and for the precipitation rate(PR) comparisons presented in Figs.8 to 12. In addition, the residence time (RT), given by the ratio of WVC over PR, is also denoted for allobserved regions.
Global Europe Indian Ocean
WVC PR RT WVC PR RT WVC PR RTAugust 1996–1998 [cm] [cm/day] [day] [cm] [cm/day] [day] [cm] [cm/day] [day]
MATCH 2.40 0.31 7.74 1.94 0.19 10.21 3.34 0.5 6.68NRA 2.59 0.37 7.00 2.13 0.27 7.89 3.76 0.58 6.48GOME-SSP/GPCP 2.51 0.26 9.65 2.35 0.15 15.67 3.51 0.42 8.36
January 1996–1998
MATCH 2.22 0.31 7.16 1.18 0.21 5.62 3.61 0.4 9.03NRA 2.32 0.36 6.44 1.17 0.23 5.09 4.21 0.5 8.42GOME-SSP/GPCP 2.18 0.27 8.07 1.07 0.22 4.86 3.84 0.34 11.29
7.3 NRA and GOME WV fields
The global WV distribution as given by NRA (Fig.6) gen-erally resembles what has been modelled by MATCH. Theshape of the ITCZ is quite similar to the MATCH modelresults for both seasons. For example, the strong southernbranch of the Western Pacific split ITCZ and the high WVvalues over NH land masses are similar features leading tosimilar residual patterns for NRA and MATCH when com-pared to the GOME-SSP results. NRA ITCZ values are,however, generally higher than those computed by MATCH.Differences are evident for the Central Amazon and WesternPacific regions, where MATCH is moist over the ocean anddry over land when compared to NRA.
7.4 Global and Zonal averages in WV
MATCH is about 0.1 to 0.2 cm lower in the globally aver-aged WV content than GOME-SSP, NVAP and NRA for Au-gust and compares better (within 0.15 cm difference) to theother products for January as indicated by the lower panelsof Fig. 7. The NVAP product is a blended WV data set em-ploying instruments like SSM/I and TOVS, as well as in situdata from the operational radiosonde network. For more de-tails on NVAP and comparisons with GOME measurementswe would like to refer the reader toRandel et al.(1996) andLang and Lawrence(2004). For January, the shape of thezonal distribution of all four products compares very well.However, NVAP and NRA peak higher around the ITCZthan GOME-SSP and MATCH. A different picture occursfor the August zonal mean distributions. Here, NVAP andGOME-SSP compare very well in shape and absolute quan-tities. MATCH and NRA are systematically low during theNH summer season as compared to NVAP and GOME-SSP.The shape of the zonal WV distribution of MATCH again re-sembles quite well the shape of the NRA zonally averagedvalues.
7.5 MATCH and GPCP precipitation fields
Figure8 (upper panels) shows averaged daily PR as given byGPCP (cf. Sect.3) for August (left panels) and January (rightpanels) 1996 to 1998. The middle panels of Fig.8 show thecorresponding model results from MATCH. MATCH mod-els the basic patterns very well, like the continuous stream ofprecipitation along 10◦ north in August and the more distinctprecipitation fields over the south western Pacific, CentralSouth America, Africa and the Pacific warm pool. Differ-ences occur, similar to the WVC distributions, on regionalscales and due to differences in the absolute values (lowerpanel of Fig.8). MATCH PR are weaker along the ITCZ andmore spread out in latitude leading to significant residuals ofhigh MATCH PR north and southwards of the ITCZ (e.g., theoverestimation in precipitation along the southern branch ofthe Western Pacific split ITCZ in August). MATCH mod-els significantly higher PR over the Central South Ameri-can and Central African land masses for January and overNorth America, Europe and Russia for August, as comparedto what has been measured by the GPCP observations.
7.6 NRA and GPCP precipitation fields
As MATCH is driven by NRA parameters like temperature,wind fields, and surface evaporation rates, with potentiallysignificant influences on the modelled WV and precipitationpatterns, the comparisons presented in Fig.9 give an indi-cation to which extent MATCH precipitation model outputmay depend on NRA input parameters. The figure comparesNRA PR to those given by GPCP in a similar fashion as thecomparisons presented in Fig.8. The NRA precipitation dis-tribution is for large parts of the globe closely related to theMATCH modelled PR indicating the strong influence of thebefore mentioned shared parameters on the precipitation dis-tributions modelled by both products. The residual patternsof Fig.9, however, also reveal significant regional differencesto what has been modelled by MATCH. MATCH PR aregenerally higher over NH land masses in August and over
www.atmos-chem-phys.org/acp/5/887/ Atmos. Chem. Phys., 5, 887–908, 2005

900 R. Lang and M. G. Lawrence: Hydrological cycle of MATCH
(a) (b)
(c) (d)
(e) (f)
Fig. 8. Global distribution of precipitation averaged over three years for August 1996 to 1998 (left panels) and January 1996 to 1998 (rightpanels). We compare daily precipitation amounts as provided by GPCP (see Sect.3; upper panels) and as modelled by MATCH (middlepanels). The differences between both products are given in the lower panels.
the Central Amazon and Central African regions for January.There are considerably less differences in the precipitationresiduals for NRA and MATCH over ocean surfaces. Gen-
erally the residuals of Figs.8 and9 differ predominantly inmagnitude and less in shape and geolocation.
Atmos. Chem. Phys., 5, 887–908, 2005 www.atmos-chem-phys.org/acp/5/887/

R. Lang and M. G. Lawrence: Hydrological cycle of MATCH 901
Figure 10 additionally provides the MATCH modelledcontribution of convective to the total (large-scale plus con-vective) amount of precipitation, showing that seasonalchanges in the residual patterns of Figs.8 and 9 are fre-quently related to changes in the relative contribution of con-vective precipitation. Generally, the large model to observa-tion residuals correspond to the shift between north and southin the convective precipitation for hemispheric summer.
7.7 Regional comparisons
Figures11 and12 provide a more detailed look at regionaldifferences between model and measurements for Europeand the Indian Ocean/Southeast Asian region. Residuals be-tween model and observations for WVC (upper panels) andPR (lower panels) distributions are given for the three-yearaverages of August 1996 to 1998, i.e. for the summer sea-son. MATCH and NRA show high atmospheric WV contentover European land masses in August and low biases over theMediterranean ocean and North Africa (Fig.11). The closerelation between NRA and MATCH WVC distribution, ashas been observed before for the global comparisons, is evi-dent from Fig.11. MATCH is, however, generally drier thanNRA but exhibits, in turn, higher PR over Central Europe.NRA and MATCH show similar residual patterns in precipi-tation with an emphasis on regions with high elevations. TheIndian Ocean/Southeast Asian region (Fig.12) exhibits simi-lar relations between WV and precipitation residual patterns.Regions with relatively high WV content as compared to theGOME measurements, over land and south of the Equator,correspond to regions with high PR when compared to theGPCP measurements and vice versa. A detailed discussionof the observed relation between WV and precipitation pat-terns is given in the following discussion section.
7.8 Summary of comparisons
The comparisons presented here are finally summarized inTable2 which presents the area-weighted global and regionalmean values in WVC, PR and RT. The latter has been calcu-lated as the ratio between WVC and PR and serves as an use-ful measure for the modelled and observed mean conversionof WV into precipitation, as discussed further in the follow-ing section.
8 Discussion
8.1 Distribution of WV and precipitation
It is beyond the scope of this paper to analyze the detailedmechanisms behind all of the differences between MATCHand the observations, but the results presented here encour-age us to make those mechanisms subject of follow-up stud-ies. Here, we focus on the question: where are significantdifferences between MATCH and the observations found and
which of those are unique to the MATCH model and there-fore missing in a comparison between GOME-SSP data toNRA data?
Along the ITCZ region MATCH is significantly drier thanNRA, but exhibits generally very similar patterns with re-spect to the reanalysis values in the global WV distribution,as well as in the latitudinal dependence of the zonally aver-aged values for both seasons. In addition, regional distribu-tion patterns of WV are significantly influenced by net trans-port processes (and therefore by the wind-fields delivered byNRA), due to the relatively long residence time of WV ofabout 8.8 days on global average (1996 to 1998) based on theobservations. Differences between NRA and MATCH WVand precipitation fields can therefore be attributed to differ-ences between NRA and MATCH in the modelled produc-tion of clouds and precipitation, as well as the parameteriza-tion of the re-evaporation of hydrometeors. For example, aninefficient re-evaporation of hydrometeors in the modelledprecipitation columns would lead to a too dry model with adecreased WV residence time because of increased precipi-tation, and vice versa.
Figures8 and9 confirm the strong influence of the men-tioned shared parameters (see also previous section) leadingto the strong similarity in the general precipitation patternsbetween both models. A comparison between the residualpanels of Figs.8 and 9 (lower panels) identifies a numberof regions, especially over the oceans, where NRA showsresiduals in precipitation with respect to the observations,which are similar to MATCH. MATCH precipitation patternsalong the ITCZ and also along NH land masses, for exampleCanada, the eastern part of the U.S., as well as Europe andRussia are therefore expected to be significantly influencedby NRA surface evaporation rates and wind fields. It hasbeen pointed out by a number of studies (Kistler et al., 2001;Stendel and Arpe, 1997), that errors in the modelled evap-otranspiration rate over land (evapotranspiration is a “C”-variable derived from vapor pressure, surface temperature,the net irradiation flux, and wind speed, some of which arelabelled as poorly measured “B”-variables) serve as an im-portant source of model error responsible for differences be-tween modelled and observed PR over longer time scales.
In contrast, other regions can be identified, like the Cen-tral Amazon and Central Africa, where MATCH exhibitsstronger residual patterns than NRA. Those areas may beattributed as regions where specific MATCH parameteriza-tions of the hydrological cycle may significantly contributeto the observed differences. The comparisons further revealthat differences in the residuals to the observations betweenMATCH and NRA are often correlated with regions of dom-inant contribution of convective precipitation. For example,strong differences over Central Africa and the Central Ama-zon exist especially for SH summer correlated with the posi-tion of the ITCZ with strong convective updrafts. The differ-ences in the precipitation between MATCH and GPCP overwestern Canada and Siberia are also evident solely for NH
www.atmos-chem-phys.org/acp/5/887/ Atmos. Chem. Phys., 5, 887–908, 2005

902 R. Lang and M. G. Lawrence: Hydrological cycle of MATCH
(a) (b)
(c) (d)
Fig. 9. Same as Fig.8 but for NRA results in comparison to GPCP.
(a) (b)
Fig. 10. Averaged relative contribution of convective to the total (large-scale plus convective) amount of precipitation as modelled byMATCH for August (upper panel) and January (lower panel) 1996 to 1998.
Atmos. Chem. Phys., 5, 887–908, 2005 www.atmos-chem-phys.org/acp/5/887/

R. Lang and M. G. Lawrence: Hydrological cycle of MATCH 903
(a) (b)
(c) (d)
Fig. 11. Differences between MATCH (left panels) and NRA (right panels) modelled WVC and GOME-SSP WVC (upper panels) overEurope and for August 1996 to 1998. The lower panels show the corresponding residuals between the modelled precipitation amounts andthose given by the GPCP observational data set over the same area and for the corresponding time period.
summer, where these regions see significant contributionsof convective precipitation. This points therefore again toa problem related to the parameterization of convection orthe formation of convective precipitation in MATCH, like,for example, the aforementioned inefficient evaporation offalling precipitate leading to too high PR.
8.2 Correlations between WV and precipitation residuals
The regional comparisons of Figs.11 and 12 suggest acorrelation between an overestimation of precipitation byMATCH and NRA with respect to GPCP observations andan overestimation in the modelled WV content when com-pared to the GOME results. We also note the close relation-ship in WV residual pattern between the NRA and MATCHmodel comparisons to GOME observations. These correla-tions additionally support the conclusion drawn before, thatan overestimated WV input by high surface evaporation or
an regional overestimated net-influx of WV may regionallylead to too high availability of precipitable water.
In contrast, a general bias noted in the GOME-SSP datain comparison to sondes and SSM/I (too dry over land andtoo moist over the Mediterranean and North Africa) mayalso explain some of the observed differences. However,GOME-SSP comparisons with the European radiosonde net-work show only very small biases, below 3%, and compari-son with SSM/I data over the Mediterranean region confirma higher WV content as has been modelled by MATCH andNRA over this region. The elevation signal visible in both theNRA and the MATCH WV residual patterns may also pointto problems in comparing the coarse latitudinal model resolu-tion (about 1.8◦) to the relatively high latitudinal resolutionsof the GOME measurements (about 0.4◦). But close rela-tions between WV and precipitation residual patterns as ex-amined, for example, above the Alpes, the Carpatians, Scan-dinavia and the Kaukasus mountains, leads us to question the
www.atmos-chem-phys.org/acp/5/887/ Atmos. Chem. Phys., 5, 887–908, 2005

904 R. Lang and M. G. Lawrence: Hydrological cycle of MATCH
(a) (b)
(c) (d)
Fig. 12. Same as Fig.11but for Southern Asia and the Indian Ocean region.
models performance in regions with orographically inducedconvection. Additionally, other European land regions (e.g.,Germany, Poland, and Russia) also show close relationshipsbetween WV and precipitation residual patterns.
The global atmospheric WV content is strongly influencedby temperature via the Clausius-Clapeyron relationship, pro-viding that the relative humidity stays approximately con-stant. Precipitation is then closely linked to the surface evap-oration rate. However, this strong link only holds for largescale averages not influenced by the local to regional trans-port patterns, the regional net incoming radiation, or dif-ferences in surface types and soil moisture content. Theinfluence of regionally overestimated net influx of WV onthe observed residuals in WVC and PR is further supportedby the fact that too high WVC over European land massesfor NRA and MATCH are balanced by low WVC over theMediterranean and North Africa, in the sense that the meanWV content of NRA and MATCH comes close to what hasbeen observed by GOME-SSP over the entire region (see Ta-
ble 2). However, the MATCH WV residence time is signif-icantly lower than what has been observed by GOME-SSPand GPCP because of the on average higher PR of MATCHwhen compared to the measurements. Table2 shows that thisalso holds for the global mean values, for which MATCH ap-pears to model about one day shorter residence times becauseof the higher mean precipitation-rate values.
Figure 12 confirms the close relation on regional scalesbetween WV and precipitation residual patterns as hasbeen observed before for Europe, but now for the IndianOcean/Southeast Asian ITCZ region for August 1996 to1998. Again, MATCH PR are on average significantly higherthan what has been observed. However, in this region, thedifferences between NRA and MATCH in mean PR aresmall for both August and January (cf. Table2), but, be-cause MATCH is generally drier along the ITCZ regions, theMATCH modelled residence time is again lower when com-pared to the observations. Table2 also shows that MATCHmodelled residence time for Europe and the Indian Ocean
Atmos. Chem. Phys., 5, 887–908, 2005 www.atmos-chem-phys.org/acp/5/887/

R. Lang and M. G. Lawrence: Hydrological cycle of MATCH 905
compare much better to what has been observed and to whathas been provided by NRA in January.
We want to add here that both models, NRA and MATCH,lack a detailed cloud-microphysics scheme. This has numer-ous consequences and may partly explain observed differ-ences to observation for both data sets, for example, in re-gions with high aerosol loading as above Central Europe, In-dia, China and Indonesia. A detailed analysis of the impact ofcloud microphysics on the results, however, requires signif-icantly improved observational data sets (especially with re-spect to spatial resolution), as well as detailed regional stud-ies comprising additional sets of modelled and observed opti-cal parameters (Feichter et al., 2004). This would be valuableto examine in future studies. However, in order to be able toperform a successful study of the consequences of new pa-rameterizations in cloud microphysics and its effect on mod-elling the hydrological cycle, the impact of the applied me-teorological re-analysis data sets and the employed cloud pa-rameterizations on the current model results, as has been laidout in this study, has to be estimated in detail together withthe underlying mechanisms leading to differences betweenmodel output and observations, which will be subject of asubsequent study to what is presented here.
9 Summary
The main objective of this study was to examine how wellkey parameters of the hydrological cycle like WV and pre-cipitation are represented by the semi-offline model MATCHdriven by NRA data and to identify regions with poten-tial problems in the MATCH parameterizations related tothe formation of cloud and precipitation, as well as regionswith potential deficiencies in the employed reanalysis data.The results of this study may therefore be of use in subse-quent model sensitivity studies employing and testing differ-ent convective cloud model parameterizations, different re-analysis data sets (e.g., ERA reanalysis instead of NRA), aswell as new cloud micro-physical schemes for use in CTMsand GCMs. An additional objective of the paper is to demon-strate the capabilities of the GOME WV data record to beused for model evaluations on global and regional scales andas a truly independent source with respect to the reanalysisdata sets.
There are four qualitative conclusions which can be drawnfrom the above comparisons:
i: GOME compares well to independent measurements ofWVC by SSM/I over oceans and reasonably to mea-surements compiled by NVAP over land (cf., Lang andLawrence, 2004).
ii: MATCH models the general global PR and atmosphericWV content quite well with a tendency to be on averagedrier than the observations and the reanalysis data.
iii: The WV distribution patterns as modelled by MATCHare quite similar to those given by NRA, whereas bothMATCH and NRA exhibit significant regional differ-ences to what has been observed by GOME.
iv: The WVC residuals between MATCH and the GOMEobservations are similar to residuals observed in the PRbetween MATCH model results and GPCP observationsfor wide parts of the globe.
The GOME instrument provides a database from 1995 tothe present over all surface types, whereas most other instru-ments measuring WV with a comparable record of data arerestricted to either land or ocean surfaces. However, GOMEretrievals are performed employing a WV absorption around590 nm, which is affected by cloud contamination of the line-of-sight. GOME-SSP retrieved differences to other indepen-dent measurement sources, like those from the SSM/I instru-ment over oceans and the NVAP blended WV database overocean and land, are generally significantly lower than 0.5 cmexcept for regions along the ITCZ, where frequent occur-rence of cloud contaminated ground pixels introduces differ-ences up to 1 cm in the three years averaged monthly WVC.The impact of hygroscopic aerosols (like sea salt) under highrelative humidity conditions probably leads to an observeddry bias of the GOME-SSP retrievals for hemispheric winterover ocean surfaces. This aerosol induced effect on the re-trieval may be studied by employing recent newly developedaerosol modules in model calculations with simple relation-ships between aerosol mass relative humidity and aerosol op-tical properties (Metzger et al., 2002). Such studies are cur-rently underway along with employing improved tempera-ture and pressure profiles from reanalysis data for the calcu-lation of reference absorption line-parameters in SSP.
MATCH calculates both WV and precipitation fieldsonline, whereas for the NRA data set only precipitationamounts are online modelled quantities and not directlyforced by measurements. The shape of the MATCH mod-elled zonally averaged WV closely resembles the shape ofthe zonally averaged NRA data set, because the MATCH ver-sion employed here uses parameters essential for modellingthe hydrological cycle, like temperature, wind fields and la-tent heat fluxes, from NRA. However, regional differences inthe WVC distributions have been identified. MATCH is sig-nificantly drier along the ITCZ than NRA for both seasonsand moderately dry compared to the GOME-SSP observa-tions in August. MATCH appears to have problems in mod-elling the WV content in regions of strong upward convec-tion like along the ITCZ. As a consequence of the relativelydry convergence zone regions, MATCH is globally drier byabout 0.2 cm than the NRA data set in August. GOME-SSPis also biased dry along the ITCZ through reduced monthlyWVC statistics and residual cloud contamination. Therefore,GOME-SSP global mean WVC values are comparable toMATCH global mean values, especially for January where
www.atmos-chem-phys.org/acp/5/887/ Atmos. Chem. Phys., 5, 887–908, 2005

906 R. Lang and M. G. Lawrence: Hydrological cycle of MATCH
the ITCZ regions are predominantly oceanic with longercloud lifetimes. GOME-SSP derived global mean WVC aretherefore generally smaller than those provided by NRA.
Regional differences between MATCH modelled WVcolumns and the observations can be as large as 2 cm onthe basis of monthly averages over three years. This con-clusion also holds for differences observed between GOME-SSP and NRA data, whereas the NRA and MATCH WVdistribution patterns generally closely resemble each other.MATCH and NRA share significant common WVC residu-als to the GOME-SSP observations over NH land masses,especially Canada and the U.S. East Coast, over Europe andwide parts of Russia for August, and over Central Africaand South America for January. There are also a numberof oceanic regions along the ITCZ, like the southern branchof the Eastern Pacific split ITCZ for both seasons and the In-dian Ocean region along the equator in August showing highWVC when compared to GOME observations. NRA WVCresiduals are generally larger than those observed from theMATCH comparisons to the observations. One conclusionthat can be drawn from the comparisons is that either defi-ciencies in the modelled surface evaporation rates or region-ally too high net-influx of WV through overestimated massfluxes may lead to these high WVC values.
This conclusion is further supported by the fact that re-gions of high WVC are generally closely related to regions oftoo high model PR and vice versa for both MATCH and NRAoutput. The latter has been evaluated from a set of PR obser-vations comprised in the GPCP data set. This similarity inWV and precipitation patterns has been observed on a globalscale, as well as over Europe and the Indian Ocean/SoutheastAsian region. Even though GOME-SSP exhibits only smallbiases when compared to accurate data sets like SSM/I andradiosondes, it should be noted here that it might neverthelessbe possible that the observed common biases in the presentedcomparisons might partly be due to biases in the GOME ob-servations, some of which have already been discussed be-fore. Regions like remote hemispheric land masses shouldtherefore be subject of further evaluation of the quality ofGOME retrieved WVC in additional studies.
MATCH generally exhibits too high mean PR when com-pared to both GPCP observations and NRA output. Thisstudy therefore suggests that a too rapid conversion of WVto precipitate in MATCH, especially in instances of strongconvection, could be a main factor leading to regionally toodry model results and in turn to generally too low WV res-idence times when compared to regional and global meanvalues from GOME-SSP and GPCP observations.
In summary we therefore conclude that a study on theusage of a different set of reanalysis data to drive theMATCH model is required to examine the impact on themodelled WVC distribution. In addition, the re-examinationof MATCH cloud formation and precipitation parameteriza-tions for strong convective events is also required in orderto improve MATCH modelled precipitation fields. These re-
sults will be of relevance especially with respect to the re-gional to global scale impact of anthropogenic emissions onweather and climate via the strong link between the hydro-logical cycle and the atmospheric HOx chemistry, wet scav-enging of aerosols and trace gases and it will be of majorimportance for present model sensitivity studies employingand testing new sets of aerosol model parameterizations.
Acknowledgements.The authors would like to thankR. von Kuhlmann for many fruitful discussions and valuablecomments on the manuscript. We would like to thank P. Rasch(NCAR, Boulder, Colorado), and A. N. Maurellis (SRON, Utrecht,The Netherlands) for their careful reading of the manuscriptand very valuable suggestions on earlier drafts. The detailedcomments and constructive critiques of three anonymous refereeswere much appreciated and have contributed significantly tothe readability of the paper. The authors would like to thankB. Steil (MPI-Chemistry, Mainz, Germany) for providing ECMWFoperational radiosonde data sets. M. Allaart (KNMI, Utrecht,The Netherlands) is acknowledged for his support with theinterpretation of radiosonde data. GOME level 1 data has beensupplied by the Netherlands SCIAMACHY Data Center underESA Category 1 Proposal A0-2310. NVAP and SSM/I data wereobtained from the NASA Langley Research Center AtmosphericSciences Data Center. The GPCP combined precipitation datawere developed and computed by the NASA/Goddard Space FlightCenter’s Laboratory for Atmospheres as a contribution to theGEWEX Global Precipitation Climatology Project. NRA data hasbeen provided by the National Center for Atmospheric Researchof the National Centers for Environmental Prediction, Boulder,Colorado. This work is financially supported by the EU funded 5thframework project PHOENICS.
Edited by: U. Poschl
References
Arakawa, A. and Schubert, W. H.: Interaction of a cumulus cloudensemble with large-scale environment. 1, J. Atmos. Sci., 31, 3,674–701, 1974.
Bonn, B., von Kuhlmann, R., and Lawrence, M. G.: High contri-bution of biogenic hydroperoxides to secondary organic aerosolformation, Geophys. Res. Lett., 31, 10, L10108, 2004.
Burrows, J. P., Weber, M., Buchwitz, M., Rozanov, V., Ladstatter-Weienmayer, A., Richter, A., deBeek, R., Hoogen, R., Bramst-edt, K., Eichmann, K.-U., and Eisinger, M.: The Global OzoneMonitoring Experiment (GOME): Mission Concept and FirstScientific Results, J. Atmos. Sci., 56, 151–175, 1999.
Casadio, S., Zehner, C., Piscane, G., and Putz, E.: Empirical Re-trieval of Atmospheric Air Mass Factor (ERA) for the Measure-ment of Water Vapor Vertical Content using GOME Data, Geo-phys. Res. Lett., 27, 1483–1486, 2000.
Crutzen, P. J. and Lawrence, M. G.: The Impact of PrecipitationScavenging on the Transport of Trace Gases: A 3-DimensionalModel Sensitivity Study, J. Atmos. Chem., 37, 81–112, 2000.
Engelen, R. J. and Stephens, G. L.: Characterization of water-vaporretrievals from TOVS/HIRS and SSM/T-2 measurments, Q. J. R.Meteorol. Soc., 125, 331–351, 1999.
Atmos. Chem. Phys., 5, 887–908, 2005 www.atmos-chem-phys.org/acp/5/887/

R. Lang and M. G. Lawrence: Hydrological cycle of MATCH 907
ESA: The Global Ozone Monitoring Experiment Users Manual,edited by: Bednarz, F., ESA Publication SP-1182, ESA Publi-cation Division, ESTEC, Noordwijk, The Netherlands, 1995.
Feichter, J., Roeckner, E., Lohmann, U., and Liepert, B.: Nonlinearaspects of the climate response to greenhouse gas and aerosolforcing, J. Climate, 17, 12, 2384–2398, 2004.
Gruber, A., Su, X. J., Kanamitsu, M., and Schemm, J.: The com-parison of two merged rain gauge-satellite precipitation data sets,Bull. Americ. Meteorol. Soc., 81, 11, 2631–2644, 2000.
Hack, J. J.: Parameterization of moist convection in the NationalCenter for Atmospheric research community climate model(CCM2), J. Geophys. Res., 99, 5551–5568, 1994.
Hollinger, J., Pierce, J., Lo, R., and Poe, G.: SSM/I instrumentevaluation, IEEE Trans. Geosci. Remote Sensing, 28, 781–790,1990.
Huffman, G. J., Adler, R. F., Arkin, P. A., Chang, A., Ferraro, R.,Gruber, A., Janowiak, J., McNab, A., Rudolf, B., and Schneider,U.: The global precipitation climatology project (GPCP) com-bined precipitation data set, Bull. Americ. Meteorol. Soc., 78, 1,5–20, 1997.
Jockel, P., von Kuhlmann, R., Lawrence, M. G., Steil, B., Bren-ninkmeijer, C. A. M., Crutzen, P. J., Rasch, P. J., and Eaton, B.:On a fundamental problem in implementing flux-form advectionschemes for tracer transport in 3-dimensional general circulationand chemistry transport models, Q. J. R. Meteorol. Soc., 127,1035–1052, 2001.
Kalnay, E., Kanamitsu, M., Kistler, R., Collins, W., Deaven, D.,Gandin, L., Iredell, M., Saha, S., White, G., Woollen, J., Zhu, Y.,Chelliah, M., Ebisuzaki, W., Higgins, W., Janowiak, J., Mo, K.C., Ropelewski, C., Wang, J., Leetmaa, A., Reynolds, R., Jenne,R., and Joseph, D.: The NCEP/NCAR 40-year reanalysis project,Bull. Americ. Meteorol. Soc., 77, 3, 437–471, 1996.
Kistler, R., Kalnay, E., Collins, W., Saha, S., White, G., Woollen, J.,Chelliah, M., Ebisuzaki, W., Kanamitsu, M., Kousky, V., van denDool, H., Jenne, R., and Fiorino, M.: The NCEP-NCAR 50-yearreanalysis: Monthly means CD-ROM and documentation, Bull.Americ. Meteorol. Soc., 82, 2, 247–267, 2001.
Koelemeijer, R. B. A., Stammes, P., Hovenier, J. W., and de Haan,J. F.: A fast method for retrieval of cloud parameters using oxy-gen A band measurements from the Global Ozone MonitoringExperiment, J. Geophys. Res., 106(D4), 3475–3490, 2001.
Kunhikrishnan, T., Lawrence, M. G., von Kuhlmann, R., Richter,A., Ladstatter-Weißenmayer, A., and Burrows, J. P.: Analysisof tropospheric NOx over Asia using the Model of AtmopshericTransport and Chemsitry (MATCH-MPIC) and GOME satelliteobservations, Atmos. Environ., 38, 581–596, 2004a.
Kunhikrishnan, T., Lawrence, M. G., and von Kuhlmann, R.: Semi-annual NO2 plumes during the monsoon transition periods overthe central Indian Ocean, Geophys. Res. Lett., 31, L08110,doi:10.1029/2003GL019269, 2004b.
Kunhikrishnan, T. and Lawrence, M. G.: Sensitivity of NOx overthe Indian Ocean top emissions from the surrounding continentsand nonlinearities in atmospheric chemistry responses, Geophys.Res. Lett., 31, doi:10.1029/2004GL020210, 2004c.
Labrador, L. J., von Kuhlmann, R., and Lawrence, M. G.:Strong sensitivity of the global mean OH concentrationand the tropospheric oxidizing efficiency to the source ofNOx from lightning, Geophys. Res. Lett., 31(6), L06102,doi:10.1029/2003GL019229, 2004a.
Labrador, L. J., von Kuhlmann, R., and Lawrence, M. G.: The ef-fects of lightning-produced NOx and its vertical distribution onatmopsheric chemistry: sensitivity simulations with MATCH-MPIC, Atmos. Chem. Phys. Discuss., 4, 6239–6281, 2004b,SRef-ID: 1680-7375/acpd/2004-4-6239.
Lang, R., Maurellis, A. N., van der Zande, W. J., Aben,I., Landgraf, J., and Ubachs, W.: Forward Modeling andRetrieval of Water Vapor from GOME: Treatment of Nar-row Band Absorption Spectra, J. Geophys. Res., 107(D16),doi:10.1029/2001JD001453, 2002.
Lang, R., Williams, J. E., Maurellis, A. N., and van der Zande, W.J.: Application of the Spectral Structure Parameterization Tech-nique: Retrieval of Total Water Vapor Columns from GOME,Atmos. Chem. Phys., 3, 145–160, 2003,SRef-ID: 1680-7324/acp/2003-3-145.
Lang, R. and Lawrence, M. G.: Evaluation of the hydrological cycleof MATCH driven by NCEP reanalysis data: Comparison withGOME water vapor field measurements, Atmos. Chem. Phys.Discuss., 4, 7917–7984, 2004,SRef-ID: 1680-7375/acpd/2004-4-7917.
Lanzante, J. R., Klein, S. A., and Seidel, D. J.: Temporal Ho-mogenization of Monthly Radiosonde Temperature Data, Part I:Methodology, J. Climate, 16, 224–240, 2003.
Lawrence, M. G.: Photochemistry in the tropical pacific tropo-sphere: Studies with a global 3D chemistry-meteorology model,PhD thesis, Ga. Inst. of Technol., Atlanta, 1996.
Lawrence, M. G. and Crutzen, P. J.: The impact of cloud particlegravitational setteling on soluble trace gas distributions, Tellus,Ser. B, 50, 263–289, 1998.
Lawrence, M. G., Crutzen, P. J., Rasch, P. J., Eaton, B. E., and Ma-howald, N. M.: A model for studies of tropospheric photochem-istry: Description, global distributions, evaluation, J. Geophys.Res., 104, 26 245–26 277, 1999.
Lawrence, M. G. and Crutzen, P. J.: Influence of NOx emissionsfrom ships on tropospheric photochemistry and climate, Nature,402, 167–170, 1999.
Lawrence, M. G.: Evaluating trace gas sampling strategies with as-sistance from a global 3D photochemical model: Case studies forCEPEX and NARE O3 profiles, Tellus, 53B, 22–39, 2001.
Lawrence, M. G., Rasch, P., von Kuhlmann, R., Williams, J., Fis-cher, H., Reus, M., Lelieveld, J., Crutzen, P., Schultz, M., Stier,P., Huntrieser, H., Heland, J., Stohl, A., Forster, C., Elbern, H.,Jakobs, H., and Dickerson, R.: Global chemsitry weather fore-casts for field campaign planning: Predictions and observationsof large-scale features during MINOS, CONTRACE, and IN-DOEX, Atmos. Chem. Phys., 3, 267–289, 2003a,SRef-ID: 1680-7324/acp/2003-3-267.
Lawrence, M. G., von Kuhlmann, R., Salzmann, M., and Rasch,P. J.: The balance of effects of deep convective mixingon tropospheric ozone, Geophys. Res. Lett., 30(18), 1940,doi:10.1029/2003GL017644, 2003b.
Learner, R., Schermaul, R., Tennyson, J., Zobov, N., Ballard, J.,Newnham, D., and Wickett, M.: Measurement of H2O Absorp-tion Cross-Sections for the Exploitation of GOME data, ESTECContract No 13312/9/NL/SF, Final Presentation, 2000.
Mahowald, N. M., Prinn, R. G., and Rasch, P. J.: DeducingCCl3F emissions using an inverse method and chemical transportmodels with assimilated winds, J. Geophys. Res., 102, 28 153–28 168, 1997a.
www.atmos-chem-phys.org/acp/5/887/ Atmos. Chem. Phys., 5, 887–908, 2005

908 R. Lang and M. G. Lawrence: Hydrological cycle of MATCH
Mahowald, N. M., Rasch, P. J., Eaton, B. E., Whittlestone, S., andPrinn, R. G.: Transport of222radon to the remote troposphereusing the Model of Atmospheric Transport and Chemistry andassimilated winds from ECMWF and the National center for En-vironmental Prediction/NCAR, J. Geophys. Res., 102, 28 139–28 152, 1997b.
Maurellis, A. N., Lang, R., van der Zande, W. J., Ubachs, W.,and Aben, I.: Precipitable Water Column Retrieval from GOMEData, Geophys. Res. Lett., 27, 903–906, 2000a.
Maurellis, A. N., Lang, R., and van der Zande, W. J.: A New DOASParameterization for Retrieval of Trace Gases with Highly-Structured Absorption Spectra, Geophys. Res. Lett., 27, 4069–4072, 2000b.
Maurellis, A. N. and Tennyson, J.: The climatic effects of watervapour, Physics World, May, 2003.
Metzger, S. M., Dentener, F. J., Lelieveld, J., and Pandis, S. N.:Gas/aerosol Partitioning I: A Computationally Efficient Model,J. Geophys. Res., 107(D16), doi:10.1029/2001JD001102, 2002.
Minschwander, K. and Dessler, A. E.: Water Vapor Feedback in theTropical Upper Troposphere: Model Results and Observations,J. Climate, 17, 1272–1282, 2004.
Naus, H. and Ubachs, W.: Visible absorption bands of the (O2)2-collision complex at pressures below 760 Torr, Appl. Opt., 38,3423–3428, 1999.
Noel, S., Buchwitz, M., Bovensmann, H., Hoogen, R., and Bur-rows, J. P.: Atmospheric Water Vapor Amounts Retrieved fromGOME Satellite Data, Geophys. Res. Lett., 26, 1841–1844,1999.
Noel, S., Buchwitz, M., Bovensmann, H., and Burrows, J.P.: Retrieval of Total Water Vapour Column Amounts fromGOME/ERS-2 Data, Adv. Space Res., 29, 11, 1697–1702, 2002.
Pan, H. L. and Wu, W.-S.: Implementing a mass flux convectiveparameterization package for the NMC medium-range forecastmodel, 10th Conf. on Numerical Weather Prediction, Portland,OR, Amer. Meteor. Soc., 96–98, 1994.
Randel, D. L., Vonder Haar, T. H., Ringerud, M. A., Stephens, G. L.,Greenwald, T. J., and Combs, C. L.: A new global water vapordata set, Bull. Americ. Meteorol. Soc., 77, 6, 1233–1246, 1996.
Rasch, P. J., Mahowald, N. M., and Eaton, B. E.: Representationof transport, convection and the hydrological cycle in chemicaltransport models: Implications for the modeling of short livedand soluble species, J. Geophys. Res., 102, 28 127–28 138, 1997.
Rasch, P. J. and Lawrence, M. G.: Recent developements in trans-port methods at NCAR, in MPI Workshop on CenservativeTransport Schemes, Rep. 265, 65–75, Max-Planck-Inst. Mete-orol., Hamburg, Germany, 1998.
Rasch, P. J. and Kristjansson, J. E.: A Comparison of the CCM3Model Climate Using Diagnosed and Predicted Condensate Pa-rameterizations, J. Clim., 11, 1587–1614, 1998.
Rudolf, B.: Satellite-based global precipitation estimates and val-idation results, Satellite Application Facility Workshop on Cli-mate Monitoring, Dresden, Germany, November 2000, Work-shop Report, 140–149, EUMETSAT, Darmstadt, Germany,ISBN 92-9110-042-0, 2001.
Slingo, J. M.: The developement and verification of a cloud predic-tion scheme for the ECMWF model, Q. J. R. Meterol. Soc., 113,899–927, 1987.
Stendel, M. and Arpe, K.: Evaluation of the hydrological cycle inreanalyses and observations, Max-Planck-Institut fur Meteorolo-gie, Hamburg, Germany, 52, 1997.
von Kuhlmann, R., Lawrence, M. G., Crutzen, P. J., and Rasch, P.J.: A model for studies of tropospheric ozone and nonmethanhydrocarbons: Model description and ozone results, J. Geophys.Res., 108(D9), 4294, doi:10.1029/2002JD002893, 2003a.
von Kuhlmann, R., Lawrence, M. G., Crutzen, P. J., and Rasch, P. J.:A model for studies of tropospheric ozone and nonmethan hydro-carbons: Model evaluation of ozone related species, J. Geophys.Res., 108(D28), 4729, doi:10.1029/2002JD003348, 2003b.
Wagner, T., Heland, J., Zoger, M., and Platt, U.: A fast H2O totalcolumn density product from GOME validation with in-situ air-craft measurements, Atmos. Chem. Phys., 3, 651–663, 2003,SRef-ID: 1680-7324/acp/2003-3-651.
Wentz, F. J.: A well-calibrated ocean algorithm for special sen-sor microwave/imager, J. Geophys. Res., 102(C4), 8703–8718,1997.
Xie, P. and Arkin, P. A.: Global precipitation: A 17-Year monthlyanalysis based on gauge observations, satellite estimates and nu-merical model outputs, Bull. Americ. Meteorol. Soc., 78, 11,2539–2558, 1997.
Zhang, G. J. and McFarlane, N. A.: Sensitivity of climate simula-tions to the parameterization of cumulus convection in the Cana-dian Climate centre general circulation model, Atmos. Ocean,33, 407–446, 1995.
Atmos. Chem. Phys., 5, 887–908, 2005 www.atmos-chem-phys.org/acp/5/887/