evaluation of the assisted outpatient treatment (aot) project · the utah division of substance...
TRANSCRIPT

Evaluation of the Assisted Outpatient Treatment (AOT)
Project
Annual Report October 2018


Evaluation of the Assisted Outpatient Treatment (AOT) Program
Christian M. Sarver, M.S., M.S.W. Jess Shade, MDiv
Derek Mueller, M.S.
Annual Report October 2018
Utah Criminal Justice Center, University of Utah

{THIS PAGE INTENTIONALLY LEFT BLANK}
i
Table of Contents Table of Contents .................................................................................................................................. i Background and Introduction ................................................................................................................. 1 Study Procedures ............................................................................................................................................ 1 Results ................................................................................................................................................................... 2 Administrative Reporting .......................................................................................................................... 2 Consumer Characteristics .......................................................................................................................... 3 Services Provided by AOT ....................................................................................................................... 17 Conclusion......................................................................................................................................................... 26 References ........................................................................................................................................................ 27

ii

1
Background and Introduction
A 2015 survey, conducted by the National Institute of Health (NIH), showed approximately 18% of the adult U.S. population had a diagnosed mental illness; four percent were characterized as having a serious mental illness (SMI). An SMI diagnosis is associated with a decreased level of functioning in the activities of daily life, including finding and sustaining housing and employment, and accessing and engaging in treatment (NIH, 2015). Historically, individuals with SMI who were considered a danger to self or others would be civilly committed to local or state services in order to receive inpatient hospitalization and treatment. Deinstitutionalization has resulted in less availability of state hospital beds, which means individuals with SMI have less access to treatment. Because of this, along with concern for the ethical issues, and financial costs, related to involuntary hospitalization, state and local communities have worked to develop programs to decrease hospitalization, increase willingness to access treatment, and improve outcomes for civilly committed individuals (Testa & West, 2010). Assisted outpatient treatment (AOT) is court-supervised mental health treatment provided in community-based, rather than institutional, settings. Central to the AOT model is the use of the courts to maintain consumer engagement with their treatment plan. While treatment plans are individualized, typical services include therapy, medication management, and case management. In practice, AOT combines evidence-based treatment models, such as Assertive Community Treatment (ACT), with court oversight. AOT was designed to serve SMI consumers with a history of treatment repeated hospitalization or criminal justice contacts. Past research has shown that AOT is associated with decreased hospitalizations (Guido & Stavis, 2007; Hamilton, et al., 2015; Munetz, et al., 2014), arrests or incarceration (Constantine, et al., 2012), and homelessness (Kirst, et al., 2015). The Utah Division of Substance Abuse and Mental Health (DSAMH) has requested that the Utah Criminal Justice Center (UCJC) evaluate the Utah Assisted Outpatient Treatment (AOT) program, which has been implemented in two sites (Davis Behavioral Health (DBH) and Weber Human Services (WHS)). The AOT project is designed to improve the treatment outcomes of adults with SMI, who are under civil commitment, with a history of treatment non-compliance. The goal of AOT is to enhance the relationships, communication, and coordination of in-person services for individuals civilly committed, with mental illness, including those with co-occurring substance use disorders.
Study Procedures
This annual report provides an overview of consumer characteristics, services, and outcomes, since project inception. All analyses in the current report are based on the following data sources:
Center for Mental Health Services National Outcome Measures (NOMs) Consumer-level Measures for Discretionary Programs Providing Direct Services to Adults (self-report)

2
Utah Department of Health, Division of Substance Abuse and Mental Health (DSAMH), behavioral health treatment records
Utah Administrative Office of the Courts, court filing and disposition records for district and justice courts
Utah Homeless Management Information System (UHMIS) emergency shelter stay records (pulled by local sites)
Department of Public Safety, Bureau of Criminal Investigation (BCI), statewide arrest records
Results from administrative data sources are integrated alongside NOMs self-report data. Table headings as well as narrative descriptions clarify the data source.
Results This annual report describes the first 24 months of AOT (October, 2016 through September, 2018). During the period covered in this report, the AOT program enrolled 138 consumers across both sites. Administrative Reporting A total of six baseline assessments were conducted during the current reporting quarter (Table 1). Of those, four were at Davis Behavioral Health (DBH) and two were at Weber Human Services (WHS).
Table 1 Assessments, NOMs
Site DBH WHS Both Sites
Quarter Total Quarter Total Quarter Total
Assessment Type (n)
Baseline 4 67 2 71 6 138 6-month 1 28 6 33 7 61 12-month 1 18 2 12 3 30 18-month 1 1 5 6 6 7 Discharge 3 24 1 28 4 52 TOTAL 10 138 16 150 26 288 1 Includes all NOMs assessments, whether or not interview was conducted
Table 2 shows the number of assessments for which an interview was conducted. For most of the report (excluding the next three tables), only assessments with an interview were used. Of the 288 NOMs assessments, 232 (81%) were based on an interview. This report will rely on data collected at baseline, 6-month, 12-month, and discharge assessments.

3
Table 2 Assessments with Interviews, NOMs1
Site DBH WHS Both Sites
Quarter Total Quarter Total Quarter Total
Assessment Type (n)
Baseline 4 56 2 69 6 125 6-month 0 19 6 32 6 51 12-month 1 14 2 12 3 26 18-month 1 1 5 5 6 6 Discharge 1 4 1 20 2 24 TOTAL 7 94 16 138 23 232 1 Includes all NOMs assessments with and interview
Consumer Characteristics
Demographics. Consumer demographics, collected on the baseline NOMs assessment, are presented in tables 3 and 4. When comparing the sites, WHS enrolled a relatively higher percentage of total consumers who identified as male (75% compared to 51%; Table 3). The majority of consumers at both sites identified as heterosexual (80%) and white (78%).
Table 3 Consumer Characteristics at Baseline, NOMs1
Site DBH WHS Both Sites Quarter Total Quarter Total Quarter Total
Sample (n) 4 67 2 71 6 138
Gender2 (%) Male 75 51 100 75 83 63 Female 25 43 0 24 17 33 Transgender 0 2 0 1 0 1 Ethnicity (%) Hispanic/Latino 0 12 0 17 0 15 Race (%) Black 0 5 0 3 0 4 Native3 0 5 0 3 0 4 Asian 25 2 0 4 18 3
White 75 81 50 75 67 78 Sexual identity (%) Heterosexual 100 73 100 87 100 80 Gay 0 3 0 3 0 3 Bi-sexual 0 3 0 6 0 4 Other 0 2 0 1 0 1 1 Totals within columns may not add to 100% due to missing data, including client’s refusal to answer. 2 Other options for gender included: Transgender and other. 3 Native includes: Alaskan Native, American Indian, and Hawaiian Native.
When looking at consumers’ age at enrollment (Table 4), the majority were less than 50 years old (between 16 and 44). However, WHS tended to enroll younger individuals: 61%

4
of consumers at WHS were between 16 and 34 years, while 34% of DBH consumers were in that age range. Across both sites, there were very few consumers older than 55 at enrollment (12%).
Table 4 Age at Baseline, NOMs Site DBH WHS Both Sites
Quarter Total Quarter Total Quarter Total
Sample Size (n) 4 67 2 71 6 138
Age (%)
16 to 25 years 0 15 50 30 17 23 26 to 34 years 50 19 0 31 33 26 35 to 44 years 0 24 0 16 0 20 45 to 54 years 0 18 0 17 0 17 55 to 64 years 0 12 50 7 17 9 65 to 74 years 0 6 0 0 0 3 1 Columns may not add to 100% due to missing data.
Military involvement. On baseline NOMs assessments, very few (2%) AOT
consumers reported ever serving in the military. Of those that had served, none were currently on active duty. Just over one-third of consumers (37%) had a family member or someone close to them who was in the military (includes active duty and retired).
Health and well-being. At baseline and follow-up NOMs, consumers were asked a series of questions rating overall health and well-being, including daily functioning and experience of psychiatric symptoms. Table 5 shows one-third of consumers (33%) rated their health as fair or poor at baseline; this figure was unchanged at the 6-month follow-up (34% rated health as fair or poor). At baseline and 6-months, roughly one-quarter of consumers rated their health as excellent or very good (26% and 22% respectively).
Table 5 Overall Health, NOMs1
Site DBH WHS Both Sites
Assessment Baseline 6-mos Baseline 6-mos Baseline 6-mos 12-mos Dx
Sample (n) 56 19 69 32 125 51 26 24
How would you rate your overall health right now? (%)
Excellent 14 5 4 6 9 6 15 13 Very good 14 5 20 22 17 16 19 21 Good 39 58 42 38 41 45 35 46 Fair 16 26 22 28 19 28 15 8 Poor 16 5 12 6 14 6 12 13 1 Columns may not add to 100 due to missing data.
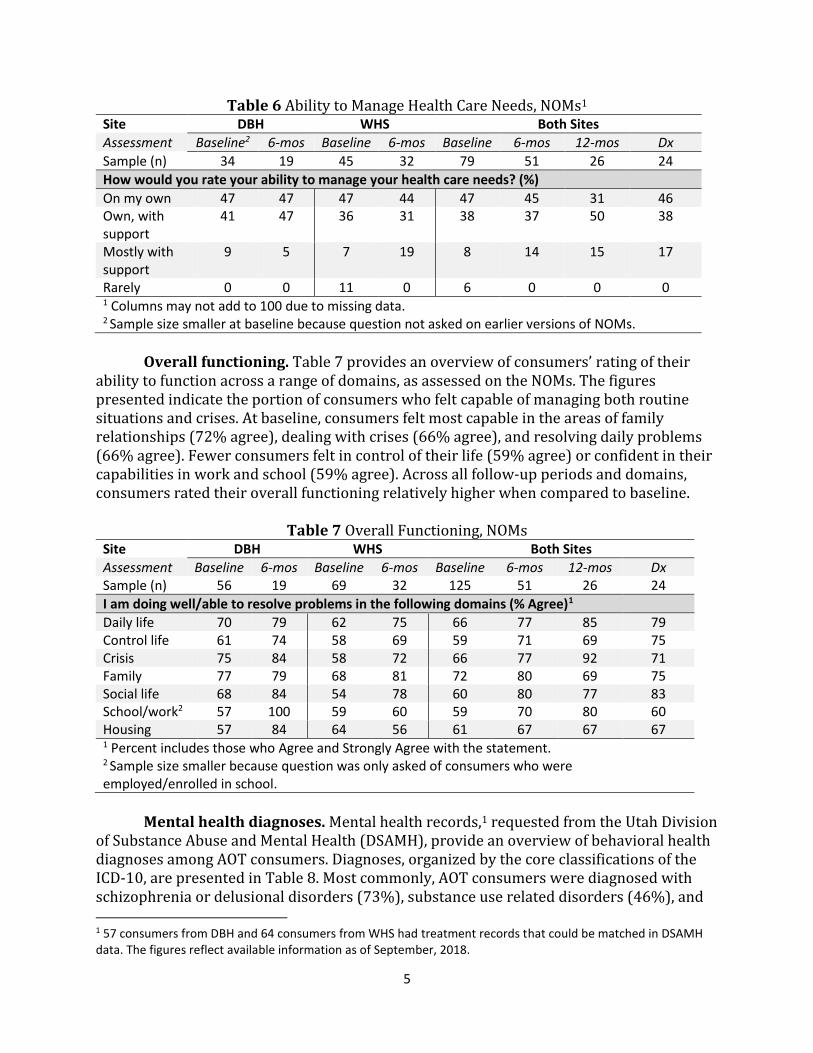
Table 6 presents consumers’ perception of their ability to manage their own health care needs, as assessed on NOMs. At the 6-month follow-up, the majority of consumers (82%) indicated they felt able to manage their health care needs on their own or with support from others. These numbers were similar for the 12-month follow-up and discharge assessments (81% and 84%, respectively).
5
Table 6 Ability to Manage Health Care Needs, NOMs1
Site DBH WHS Both Sites
Assessment Baseline2 6-mos Baseline 6-mos Baseline 6-mos 12-mos Dx
Sample (n) 34 19 45 32 79 51 26 24
How would you rate your ability to manage your health care needs? (%)
On my own 47 47 47 44 47 45 31 46 Own, with support
41 47 36 31 38 37 50 38
Mostly with support
9 5 7 19 8 14 15 17
Rarely 0 0 11 0 6 0 0 0 1 Columns may not add to 100 due to missing data. 2 Sample size smaller at baseline because question not asked on earlier versions of NOMs.
Overall functioning. Table 7 provides an overview of consumers’ rating of their
ability to function across a range of domains, as assessed on the NOMs. The figures presented indicate the portion of consumers who felt capable of managing both routine situations and crises. At baseline, consumers felt most capable in the areas of family relationships (72% agree), dealing with crises (66% agree), and resolving daily problems (66% agree). Fewer consumers felt in control of their life (59% agree) or confident in their capabilities in work and school (59% agree). Across all follow-up periods and domains, consumers rated their overall functioning relatively higher when compared to baseline.
Table 7 Overall Functioning, NOMs
Site DBH WHS Both Sites
Assessment Baseline 6-mos Baseline 6-mos Baseline 6-mos 12-mos Dx Sample (n) 56 19 69 32 125 51 26 24
I am doing well/able to resolve problems in the following domains (% Agree)1
Daily life 70 79 62 75 66 77 85 79 Control life 61 74 58 69 59 71 69 75 Crisis 75 84 58 72 66 77 92 71 Family 77 79 68 81 72 80 69 75 Social life 68 84 54 78 60 80 77 83 School/work2 57 100 59 60 59 70 80 60 Housing 57 84 64 56 61 67 67 67 1 Percent includes those who Agree and Strongly Agree with the statement. 2 Sample size smaller because question was only asked of consumers who were employed/enrolled in school.
Mental health diagnoses. Mental health records,1 requested from the Utah Division
of Substance Abuse and Mental Health (DSAMH), provide an overview of behavioral health diagnoses among AOT consumers. Diagnoses, organized by the core classifications of the ICD-10, are presented in Table 8. Most commonly, AOT consumers were diagnosed with schizophrenia or delusional disorders (73%), substance use related disorders (46%), and 1 57 consumers from DBH and 64 consumers from WHS had treatment records that could be matched in DSAMH data. The figures reflect available information as of September, 2018.

6
affective disorders (46%). The majority of consumers (71%) had multiple diagnoses, ranging from one to six, and averaged 2.3 diagnoses per person (not shown in table). One-fifth of consumers (22%) were diagnosed with both affective and schizophrenia/delusional disorders; 58% of those had a co-occurring substance use disorder (not shown in table).
Table 8 Mental Health Diagnoses, DSAMH Site DBH WHS Both Sites
Sample Size (n) 57 64 121
ICD-10 Category1 (% (n))
Affective2 54 39 46 Neurotic, stress-related, somatoform3 37 31 34 Personality4 16 16 16 Schizophrenia, delusional5 63 81 73 Substance use6 40 52 46 Other7 14 11 12 1 Percent of consumers ever diagnosed with at least one disorder in the category. 2 Mood disorders, including bipolar affective disorder, depressive disorder, and manic and depressive episodes 3 Includes anxiety disorders, obsessive disorders, stress and adjustment disorders, dissociative disorders, and somatoform disorders. 4 Includes disorders of personality, including personality changes not attributable to brain damage and disease, and habit and impulse disorders. 5 Includes schizophrenia, schizotypal disorder, schizoaffective disorder, delusional disorders, and psychotic disorders. 6 Mental and behavioral disorders due to psychoactive substance use. 7 Other includes disorders with onset in childhood or adolescence, mental retardation, organic disorders, and disorders of psychological development.
Psychiatric symptoms. At baseline and follow-up NOMs, consumers were asked to
characterize the prevalence and impact of recent psychiatric symptoms. Results are presented in Table 9 and show the percent of consumers who experienced the symptom at any point during the previous 30 days. The symptoms assessed included feelings of nervousness, hopelessness, restlessness, depression, effort expended to accomplish daily tasks, and worthlessness. At baseline, consumers most commonly endorsed feelings of nervousness (83%), restlessness (76%), and that daily life was an effort (77%); those continued to be the most commonly experienced symptoms, albeit by fewer individuals, at subsequent follow-up and discharge. Table 9 also provides an overview of the impact of psychiatric symptoms. The first row shows that 56% of consumers were at least moderately bothered by their symptoms at baseline. Of those who reported symptoms, 33% endorsed extreme or considerable impact of their symptoms on daily life at baseline while eight percent did at discharge (last row of Table 9).

7
Table 9 Psychiatric Symptoms, NOMs
Site DBH WHS Both Sites
Assessment Baseline 6-mos Baseline 6-mos Baseline 6-mos 12-mos Dx
Sample (n) 56 19 69 32 125 51 26 24
My symptoms are NOT bothering me (% Strongly Agree or Agree)
Daily life 38 63 49 53 44 57 58 79
During the past 30 days, did you feel (% Any endorsement)
Nervous 84 79 83 78 83 78 81 71 Hopeless 55 26 62 47 59 39 46 42 Restless 75 53 77 66 76 61 69 67 Depressed 39 26 58 47 50 39 39 46 Lethargic 75 68 78 84 77 78 69 46 Worthless 41 32 49 47 46 41 31 38 Impact psych probs1, 2
44 5 22 16 33 12 4 8
1 Sample size smaller at baseline because question was not on earlier versions of NOMs (n=77). 2 Percent of clients who indicated they were Extremely or Considerably bothered by symptoms in the preceding 30 days.
History of violence and trauma. On the baseline NOMs, consumers were asked
about their lifetime experience of violence and trauma. Results are presented in Table 10 and show that 58% of consumers had a lifetime history of trauma. Of those who were impacted by violence or trauma, the majority reported experiencing psychological symptoms as a result of the incident(s), most commonly avoidant behavior (64%). Consumers were also asked if they had any recent experience of physical violence; six percent reported experiencing at least one episode in the 30 days prior to the baseline assessment and four percent experienced at least one episode at the 6-month follow-up (not shown in table).
Table 10 Violence and Trauma, NOMs
Site DBH WHS Both Sites
Sample (n) 56 69 125
Have you ever experienced violence or trauma in any setting (%)
Yes 70 49 58
If yes, have you experienced the following as a result? (%)1
Nightmares/intrusive thoughts 59 53 56 Avoidant behavior 67 62 64 Constantly on guard 56 53 55 Numb/detached 56 53 55 1 Of those who experienced violence or trauma (n = 73).
Recent quality of life. At each NOMs assessment, consumers were asked to rate
their recent quality of life, including satisfaction with health and relationships. Results are presented in Table 11. Across both sites and reporting periods, consumers expressed the least satisfaction with having enough energy for everyday life (47% satisfied at baseline). Consumers’ rating of their satisfaction with their ability to perform the activities of daily

8
living differed between sites, with a higher percentage of DBH consumers endorsing satisfaction at baseline (80%) and 6-months (95%) compared to WHS (64% at baseline and 69% at 6-months). DBH consumers also expressed higher satisfaction with overall quality of life (100%) compared to WHS (66%) at the 6-month follow-up.
Table 11 Recent Quality of Life, NOMs
Site DBH WHS Both Sites
Assessment Baseline1 6-mos Baseline1 6-mos Baseline1 6-mos 12-mos Dx
Sample (n) 34 19 45 32 79 51 26 24
In the past four weeks, rate your (% Very Satisfied and Satisfied)
Overall quality of life
68 100 60 66 63 78 65 79
Energy level 41 57 51 53 47 55 50 67 Activities of daily living
80 95 64 69 71 78 69 79
Health 62 58 68 72 65 67 62 75 Self 68 74 67 63 67 67 62 63 Relationships 67 84 56 63 59 71 69 83 1 Sample size smaller at baseline because question not asked on earlier versions of NOMs.
Recent substance use. At baseline and follow-up NOMs, consumers were asked to
characterize their recent substance use. Results are presented in Table 12, which shows the percent of consumers who reported any substance use in the previous month. The most frequently used substance was tobacco, at both baseline (65%) and discharge (63%). Consumers at WHS reported higher recent methamphetamine use at baseline (25%) when compared to DBH consumers (4%). Nearly one-fifth of consumers reported recent use of sedatives at baseline (19%), with fewer consumers reporting recent use at discharge (4%). Among those who reported alcohol use at baseline (25%), over half of male consumers (55%) and over one-third of female consumers (36%) reported at least one recent episode of binge drinking (five or more drinks at one time for males and four or more drinks at one time for females; not shown in table). Fewer consumers reported any alcohol use at the 6-month follow-up (18%); however, alcohol use varied across sites, with no consumers endorsing use at DBH and 28% endorsing use at WHS at the 6-month follow-up. When looking at frequency of illegal substance use at baseline (excluding alcohol and tobacco), 15% of consumers reported weekly use and 25% reported daily use (not shown in table). Those figures were slightly lower at the 6-month follow-up, with 10% reporting weekly use and 24% reporting daily use.

9
Table 12 Recent Substance Use, NOMs
Site DBH WHS Both Sites
Assessment Baseline 6-mos Baseline 6-mos Baseline 6-mos 12-mos Dx
Sample (n) 56 19 69 32 125 51 26 24
In the past 30 days, have you ever used1 (%)
Alcohol 16 0 32 28 25 18 23 17 Cannabis 7 0 33 34 22 22 19 25 Cocaine 0 0 4 3 2 2 0 4 Hallucinogens 0 0 0 3 0 2 4 0 Inhalants 0 0 0 0 0 0 0 0 Meth 4 0 25 28 15 18 15 17 Opioid, Rx 7 0 9 3 8 2 4 8 Opioid, Street 0 0 7 0 4 0 4 0 Sedatives 23 0 16 9 19 6 4 4 Stimulants, Rx 5 0 6 3 6 2 0 4 Tobacco 52 47 75 72 65 63 54 63 1 Percent includes those who responded Daily, Weekly, or Once or Twice.
Housing. At baseline and follow-up NOMs, consumers were asked to characterize
their current housing situation, including any nights spent homeless or institutionalized. Results are presented in tables 13-16. Table 13 shows that most consumers entered AOT after a period of hospitalization (53% had been hospitalized for mental health care in the month prior to baseline) or subsequent to an emergency room visit for mental health concerns (38% in the month prior to baseline). For average number of nights out of the home, the figures were lower at follow-up for all types of institutionalization except inpatient detoxification; however, very few consumers received this type of service overall. At baseline, a higher percentage of WHS consumers had experienced homelessness (15% compared to 4% at DBH) and fewer had been hospitalized (46% compared to 61% at DBH) or in an emergency room (32% compared to 45% at DBH) for mental health reasons.
Table 13 Nights Spent Out of Home, NOMs Site DBH WHS Both Sites
Assessment Baseline 6-mos Baseline 6-mos Baseline 6-mos 12-mos Dx
Sample (n) 56 19 69 32 125 51 26 24
In the past 30 days, have you spent any time (%)
Homeless 4 5 15 9 10 8 12 4 Nights (Mn)1 7 1 24 11 21 8 21 23 Hospital/MH 61 5 46 22 53 16 4 25 Nights (Mn)1 17 28 8 8 12 11 18 5 Facility/SA 4 0 6 6 5 4 4 4 Nights (Mn)1 19 -- 13 5 15 5 2 27 Correctional 0 0 4 3 2 2 4 4 Nights (Mn)1 -- -- 4 10 4 10 1 10 ER/MH 45 0 32 13 38 8 8 21 Times (Mn)1 1 -- 2 4 1 4 3 2 1 Average number of nights/times for those with any time spent in setting.

10
Table 14 characterizes consumers’ living arrangements at baseline and follow-up NOMs. The majority of consumers had been living on their own (34%) or in someone else’s home (family or friend; 24%) at baseline. Of note, this figure reflects consumers’ living arrangements for the majority of the previous 30 days; it does not characterize long-term living arrangements. When compared to Table 13, which showed that 61% of DBH consumers had spent at least one night in a psychiatric hospital, Table 14 shows that, for 34% of DBH consumers, that hospitalization was relatively long-term. In contrast, 46% of WHS consumers had been hospitalized for psychiatric reasons in the month prior to baseline; however, Table 14 shows that only six percent had been living primarily in a hospital during that time.
Table 14 Living Arrangements, NOMs
Site DBH WHS Both Sites
Assessment Baseline 6-mos Baseline 6-mos Baseline 6-mos 12-mos Dx
Sample (n) 56 19 69 32 125 51 26 24
In the past 30 days, where have you lived most of the time (%)
Own/rent1 30 90 38 50 34 65 58 46 Someone else’s home
20 5 28 31 24 22 19 38
Homeless 0 0 12 3 6 2 8 4 Group/transition 2 0 13 9 8 6 8 8 Hospital/MH 34 5 6 3 18 4 4 0 Nursing home 2 0 0 0 1 0 4 0 Correctional 0 0 0 0 0 0 0 0 Facility/SA 2 0 1 0 1 0 0 4
In the last 4 weeks, how satisfied were you with the conditions of your living place? (%)2
Satisfied 61 89 61 66 61 75 73 64 1 Includes subsidized housing. 2 Percent responded Satisfied or Very Satisfied.
While NOMs assessments characterize consumers’ living arrangements and institutionalization in the month prior to the interview, DSAMH records characterize consumers’ living arrangements over time. When looking at DSAMH records, the majority of AOT consumers lived in private residences before and after enrollment.2 The figures in Table 15 indicate that more than half of consumers (between 54 and 57%) lived independently at some point and a similar figure (between 48 and 51%) lived in a private home with support. Overall, less than one-fifth of consumers had ever spent time in a correctional setting (15% before enrollment and 8% after); however, those figures were higher for WHS when compared to DHS.
2 The results only indicate that a consumer lived in the setting at some point; they do not specify duration. As such, consumers can be represented in multiple living arrangements in each timeframe.

11
Table 15 Living Arrangements, DSAMH1
Site DBH WHS Both Sites
Timeframe 2 Yt Prior After 2 Yr Prior After 2 Yr Prior After
Sample Size (n) 53 57 60 59 113 116
Living arrangement2 (%)
Homeless 0 2 10 15 5 9 Private, independent 64 68 45 46 54 57 Private, dependent 49 44 47 58 48 51 Correctional setting 8 5 22 10 15 8 Institutional, psychiatric 6 7 13 10 10 9 24-hour residential3 0 0 20 24 11 12 1 DSAMH records were available for 90% of consumers in the two years prior to enrollment and 93% of consumers after enrollment. 2 In DSAMH data, living arrangements are collected at admission and updated at each 6-month evaluation; this fact likely explains discrepancies with NOMs records, as presented in Table 14, and UHMIS records, as presented in Table 16. 3 This is an alternative to hospitalization that provides 24-hour stabilization services to treat crises and acute symptoms. This category does not directly correlate with NOMs living arrangement categories presented in Table 14.
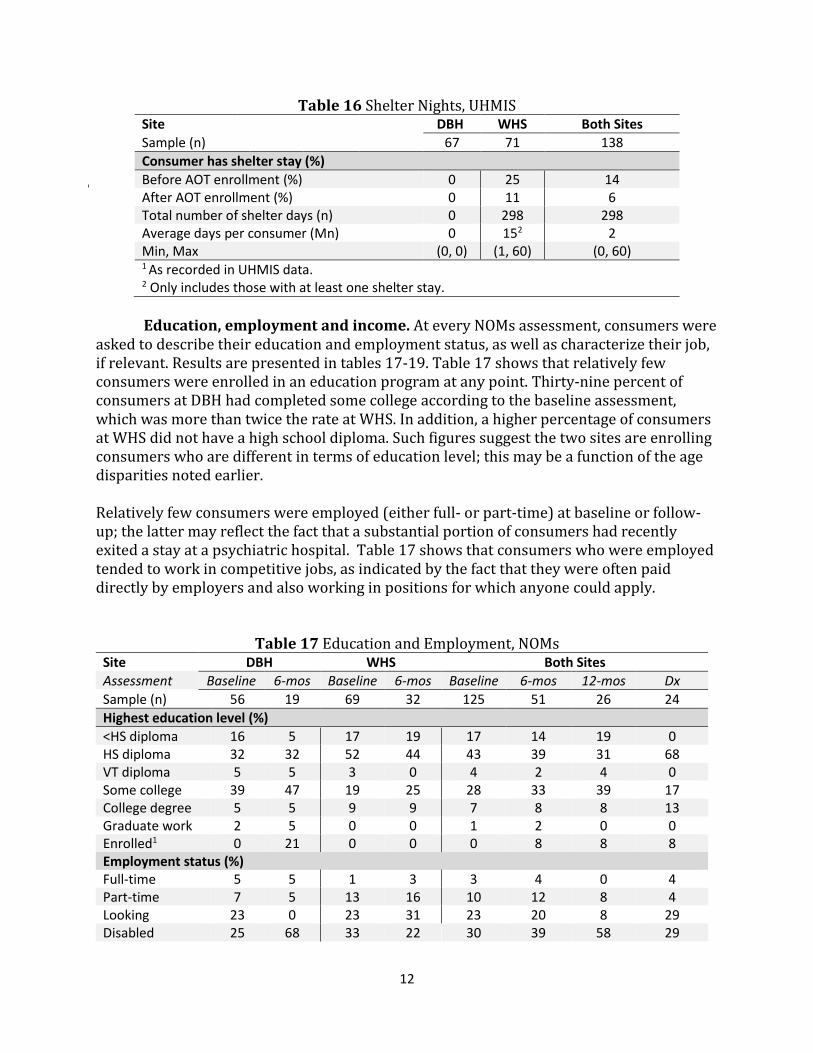
One indicator of stability is the number of different types of settings in which consumers resided (of note, this measure refers to types of settings rather than actual residences; as such, someone who lived in three different private residences would appear to have one type of residence). In the two years prior to AOT enrollment, consumers averaged 1.5 different types of living arrangements (ranging from one to four); during that same timeframe, one-third of consumers (35%) lived in at least two different types of settings (not in table). After enrollment, AOT consumers averaged 1.4 different types of living arrangements (ranging from one to six), with 35% living in at least two different types of placements. These figures suggest that a sub-population of consumers experience ongoing and substantial disruptions to their housing stability, including institutionalization in correctional or mental health settings. Table 16 presents nights spent by consumers in emergency homeless shelters, as collected by program staff from the Utah Homeless Management Information System (UHMIS). None of the DBH consumers had spent any nights in an emergency shelter, either before or after enrollment. While Table 13 showed that a small portion of DBH consumers were homeless in the month prior to enrollment, Table 16 indicates those housing crises were resolved without use of emergency shelters. One-fourth of WHS consumers spent at least one night in shelter in the two years prior to enrollment. The average days spent in shelter for WHS consumers was 15 and the longest shelter stay, before or after enrollment, was 60 days.
12
Table 16 Shelter Nights, UHMIS
Site DBH WHS Both Sites
Sample (n) 67 71 138
Consumer has shelter stay (%)
Before AOT enrollment (%) 0 25 14 After AOT enrollment (%) 0 11 6 Total number of shelter days (n) 0 298 298 Average days per consumer (Mn) 0 152 2 Min, Max (0, 0) (1, 60) (0, 60) 1 As recorded in UHMIS data. 2 Only includes those with at least one shelter stay.
Education, employment and income. At every NOMs assessment, consumers were
asked to describe their education and employment status, as well as characterize their job, if relevant. Results are presented in tables 17-19. Table 17 shows that relatively few consumers were enrolled in an education program at any point. Thirty-nine percent of consumers at DBH had completed some college according to the baseline assessment, which was more than twice the rate at WHS. In addition, a higher percentage of consumers at WHS did not have a high school diploma. Such figures suggest the two sites are enrolling consumers who are different in terms of education level; this may be a function of the age disparities noted earlier. Relatively few consumers were employed (either full- or part-time) at baseline or follow-up; the latter may reflect the fact that a substantial portion of consumers had recently exited a stay at a psychiatric hospital. Table 17 shows that consumers who were employed tended to work in competitive jobs, as indicated by the fact that they were often paid directly by employers and also working in positions for which anyone could apply.
Table 17 Education and Employment, NOMs
Site DBH WHS Both Sites
Assessment Baseline 6-mos Baseline 6-mos Baseline 6-mos 12-mos Dx
Sample (n) 56 19 69 32 125 51 26 24
Highest education level (%)
<HS diploma 16 5 17 19 17 14 19 0 HS diploma 32 32 52 44 43 39 31 68 VT diploma 5 5 3 0 4 2 4 0 Some college 39 47 19 25 28 33 39 17 College degree 5 5 9 9 7 8 8 13 Graduate work 2 5 0 0 1 2 0 0 Enrolled1 0 21 0 0 0 8 8 8 Employment status (%) Full-time 5 5 1 3 3 4 0 4 Part-time 7 5 13 16 10 12 8 4 Looking 23 0 23 31 23 20 8 29 Disabled 25 68 33 22 30 39 58 29
13
Site DBH WHS Both Sites
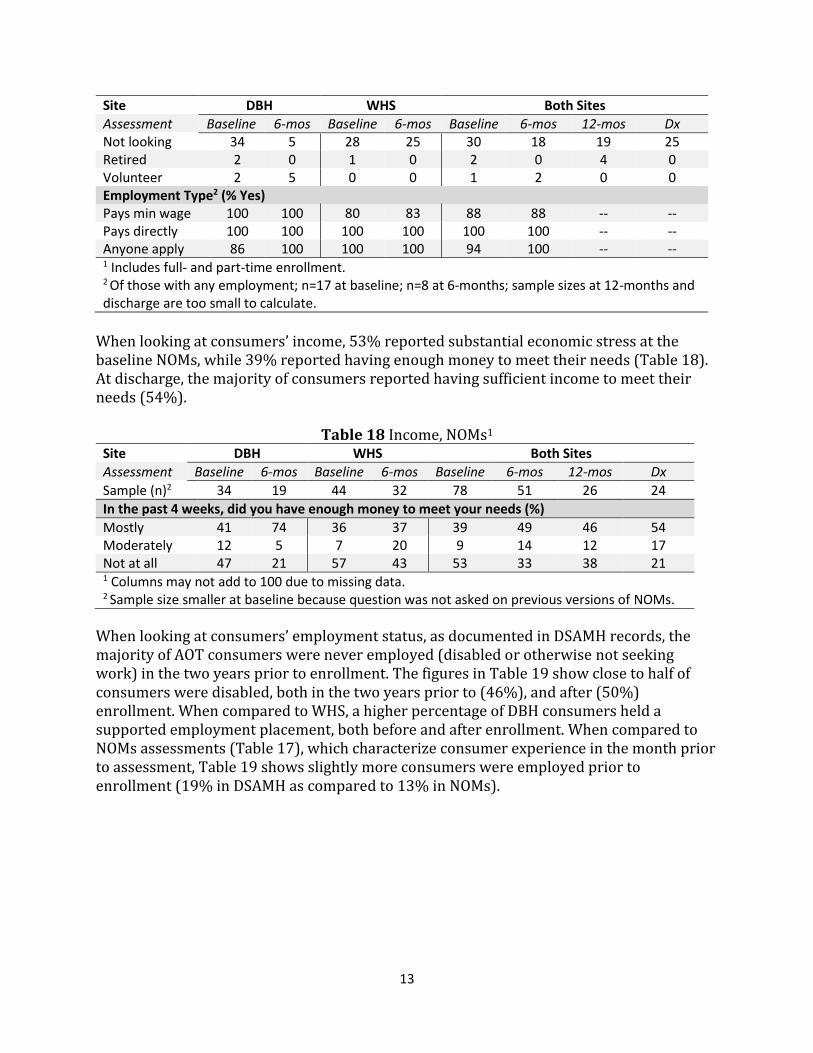
Assessment Baseline 6-mos Baseline 6-mos Baseline 6-mos 12-mos Dx Not looking 34 5 28 25 30 18 19 25 Retired 2 0 1 0 2 0 4 0 Volunteer 2 5 0 0 1 2 0 0 Employment Type2 (% Yes) Pays min wage 100 100 80 83 88 88 -- -- Pays directly 100 100 100 100 100 100 -- -- Anyone apply 86 100 100 100 94 100 -- -- 1 Includes full- and part-time enrollment. 2 Of those with any employment; n=17 at baseline; n=8 at 6-months; sample sizes at 12-months and discharge are too small to calculate.
When looking at consumers’ income, 53% reported substantial economic stress at the baseline NOMs, while 39% reported having enough money to meet their needs (Table 18). At discharge, the majority of consumers reported having sufficient income to meet their needs (54%).
Table 18 Income, NOMs1
Site DBH WHS Both Sites
Assessment Baseline 6-mos Baseline 6-mos Baseline 6-mos 12-mos Dx
Sample (n)2 34 19 44 32 78 51 26 24
In the past 4 weeks, did you have enough money to meet your needs (%)
Mostly 41 74 36 37 39 49 46 54 Moderately 12 5 7 20 9 14 12 17 Not at all 47 21 57 43 53 33 38 21 1 Columns may not add to 100 due to missing data. 2 Sample size smaller at baseline because question was not asked on previous versions of NOMs.
When looking at consumers’ employment status, as documented in DSAMH records, the majority of AOT consumers were never employed (disabled or otherwise not seeking work) in the two years prior to enrollment. The figures in Table 19 show close to half of consumers were disabled, both in the two years prior to (46%), and after (50%) enrollment. When compared to WHS, a higher percentage of DBH consumers held a supported employment placement, both before and after enrollment. When compared to NOMs assessments (Table 17), which characterize consumer experience in the month prior to assessment, Table 19 shows slightly more consumers were employed prior to enrollment (19% in DSAMH as compared to 13% in NOMs).

14
Table 19 Employment Status, DSAMH Site DBH WHS Both Sites
Timeframe 2 Yr Prior After 2 Yr Prior After 2 Yr Prior After
Sample Size (n) 53 57 60 59 113 116
Employment status (%)
Employed1 21 21 17 20 19 21 Seeking employ 26 30 25 25 26 28 Not seeking employ 28 30 55 39 43 35 Disabled 49 42 43 58 46 50 Supported employ 36 28 15 7 25 17 1 Includes full- and part-time.
Social connectedness. At all NOMs assessments, consumers were asked to rate the
quality of their personal and community relationships. Results are presented in Table 20 and show the percent of consumers who were satisfied with their social life across several domains. At baseline, consumers reported the strongest positive feelings with respect to having family and friends who were supportive of recovery (78% of consumers endorsed). That perception was similarly high at discharge (88%). Also at discharge, consumers expressed the belief that they had support during crises (83%) and were happy with their friendships (88%). Relatively fewer consumers endorsed feeling part of their community (across sites and reporting periods, close to one-third of consumers were either undecided or did not feel a sense of community belonging).
Table 20 Social Connectedness, NOMs
Site DBH WHS Both Sites
Assessment Baseline 6-mos Baseline 6-mos Baseline 6-mos 12-mos Dx
Sample (n) 56 19 69 32 125 51 26 24
Do you have satisfying (% Strongly Agree or Agree)
Friendships 71 95 67 75 69 82 77 88 Social life 82 79 61 72 70 75 77 67 Community belonging
61 84 54 59 57 69 65 42
Crisis support 77 84 65 81 70 82 65 83 Recovery support1
82 95 76 81 78 86 73 88
Accomplish goals1
79 84 71 78 75 80 81 75
1 Sample size smaller at baseline because question not asked on previous versions of NOMs; baseline n=79.
Criminal justice involvement. Both self-report data (NOMS) and administrative
records were collected to characterize consumers’ criminal justice involvement, including statewide arrests (Bureau of Criminal Investigation (BCI)) and court cases (Administrative Office of the Courts (AOC)). Results are presented in tables 21-24.

15
Self-reported criminal justice involvement. At all NOMs assessments, consumers were asked to identify their recent arrest history. As shown in Table 21, very few AOT consumers reported any recent arrest history on the baseline NOMs (3%). The mean number of arrests in any 30-day period across sites was one.
Table 21 Recent Arrests, NOMs Site DBH WHS Both Sites
Assessment Baseline 6-mos Baseline 6-mos Baseline 6-mos 12-mos Dx
Sample (n) 56 19 69 32 125 51 26 24
In the past 30 days, have you ever been arrested (%)
Yes (%) 2 0 4 3 3 2 0 4 Number (Mn)1 1 -- 1 1 1 1 -- 1 1 Average number of arrests for those with any arrest.
Statewide arrests. BCI records3, presented in Table 22, provide an overview of
consumers’ arrest history in the two years prior to, and after, enrollment4. The figures in Table 22 show that one-third of consumers (32%) were arrested in the 24 months prior to AOT, with an average number of arrests of Mn=.60. Most commonly, consumers were arrested for property (14%), public order (14%), and drug crimes (13%). Those were also the most common charge types after enrollment, though fewer consumers had been arrested. The average number of days post-enrollment was Mn=546, which is somewhat fewer days than the pre-enrollment period.
Table 22 Arrests by Type, BCI
Site DBH WHS Both Sites
Timeframe 2-Yr Before After 2-Yr Before After 2-Yr Before After
Sample (n) 62 74 136
Consumer arrests
Arrest (%) 16 15 46 20 32 18 (Mn)2 0.32 0.31 0.82 0.35 0.60 0.33
Drug 5 0 19 9 13 5 (Mn)2 0.06 0 0.30 0.16 0.19 0.09
DUI 0 2 7 1 4 1 (Mn)2 0 0.02 0.08 0.01 0.04 0.02
Obstruction 2 3 9 3 6 3 (Mn)2 0.02 0.03 0.09 0.04 0.06 0.04
Person 8 8 12 4 10 6 (Mn)2 0.08 0.11 0.15 0.04 0.12 0.07
3 Sample sizes for BCI and AOC records differ from the SPARS sample (n=138) due to the time need to request data from other sources; some consumer records had not yet been entered into SPARS and were not part of the data request. Those consumers will be included data requests and report figures in the next report. 4 Consumers can have multiple charges during a single arrest. In this case, the arrest is counted only once; however, each charge type is recorded in the appropriate category.

16
Site DBH WHS Both Sites
Timeframe 2-Yr Before After 2-Yr Before After 2-Yr Before After
Sample (n) 62 74 136
Consumer arrests Property 8 8 19 9 14 8
(Mn)2 0.16 0.15 0.23 0.12 0.20 0.13 Public Order 8 2 19 11 14 7
(Mn)2 0.10 0.10 0.23 0.12 0.17 0.11 Traffic/non-DUI 2 0 0 0 1 0
(Mn)2 0.02 0 0 0 0.01 0 1 Average number of arrests for entire sample
Civil and criminal court involvement. In addition to self-reported criminal activity and BCI arrests, AOC records characterize consumers’ court involvement. Results are presented in tables 23 and 24 and show close to one-half of consumers (46%) had at least one criminal court case prior to enrollment (this figure captures court cases filed in 2014, or two years prior to program inception, or later). Those figures were higher for WHS (53%) compared to DBH (39%), as were the average number of cases (Mn=1.8 at WHS and Mn=1.1 at DBH). When looking at civil cases, relatively few consumers at either site had a civil case in either timeframe (10% or less)5.
Table 23 Court Cases by Type, AOC
Site DBH WHS Both Sites
Timeframe Before After Before After Before After
Sample (n) 62 74 136
Consumer who have at least one
Civil case1 (%) 7 8 10 7 7 7 Number (Mn)2 .11 .11 .10 .07 .10 .09 Criminal case (%) 39 21 53 22 46 21 Number (Mn)2 1.1 .39 1.8 .42 1.5 .40 1 Includes civil cases related to overall stability, including small claims, debt collection, evictions, and Department of Workforce Services liens. 2 Average number of cases during timeframe
Table 23 further characterizes AOT consumers’ court involvement by charge type. The figures in Table 23 show that 34% of AOT consumers had at least one misdemeanor case before enrollment; that number was higher for WHS (42%) compared to DBH (24%). One-quarter (25%) of consumers had court cases related to infractions (non-DUI traffic citations are included in this category); those figures were higher at DBH (29%) compared to WHS (22%). The Stability category refers to civil cases related to issues of economic or housing instability: evictions, small claims court, debt collection, and liens. Other civil matters—such as divorce or child custody—were not included.
5 Because of the delay between arrest date and filing date, for arrests in which charges are filed, these figures represent consumers’ involvement with the courts since 2014; arrest records (BCI) provide a more accurate profile of behavior at a given point in time.

17
Table 24 Court Cases by Charge Type, AOC
Site DBH WHS Both Sites
Timeframe Before After Before After Before After
Sample (n) 62 74 136
Consumer who have at least case involving
Felony (%) 7 3 15 3 11 3 Number (Mn)1 .11 .03 .18 .04 .15 .04 Infraction (%) 29 15 22 7 25 10 Number (Mn)1 .60 .16 .47 .09 .53 .13 Misdemeanor (%) 24 15 42 18 34 16 Number (Mn)1 .37 .19 1.1 .28 .79 .24 Stability (%) 7 8 10 7 8 7 Number (Mn)1 .11 .11 .10 .07 .10 .10 1 Average number of cases during timeframe
Services Provided by AOT Program
Perception of care. Table 24 describes consumers’ perception of the care they received from the AOT program, as assessed on 6-month, 12-month, and discharge NOMs assessments. Overwhelmingly, consumers reported satisfaction with their care (more than 80% responded positively to the vast majority of items).
Table 24 Perception of Care, NOMs
Site DBH WHS Both Sites
Assessment 6-mos 6-mos 6-mos 12-mos Dx
Sample (n) 19 32 51 26 24
Rate your agreement with the following statements (% Strongly Agree or Agree)
Staff here believe I can recover 84 91 88 89 92 I feel free to complain 90 88 88 69 88 I was given info about my rights 68 84 78 65 75 I was encouraged to take responsibility for how I live my life
84 88 86 89 88
I was told what side effects to look for 68 69 69 65 75 Staff respect my privacy when sharing tx info 90 97 94 85 83 Staff are culturally sensitive 95 91 92 85 88 Staff helped me get info to manage my illness 90 91 90 89 75 Encouraged to use consumer run programs 95 97 96 81 96 Comfortable asking questions 90 94 92 81 88 I decided my own tx goals 84 66 73 73 75 I like the services I received 93 84 90 92 83 I would choose this agency again 74 63 67 69 75 I would recommend this agency to others 79 72 75 85 67
18
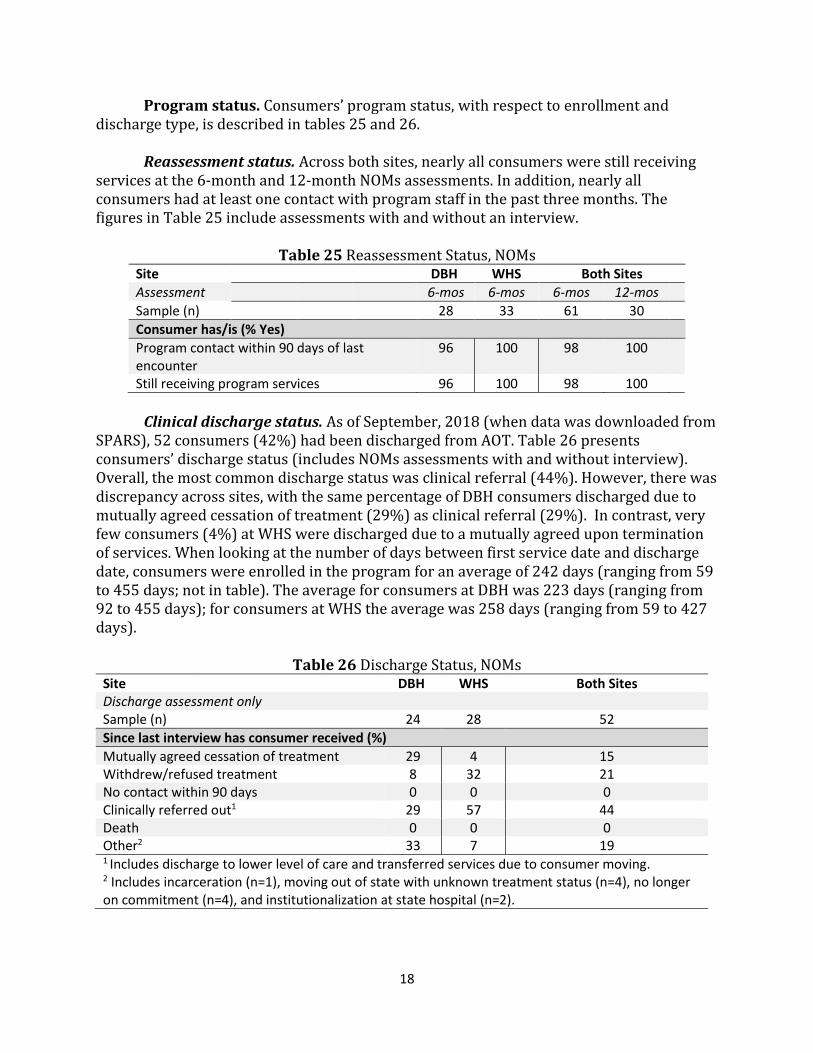
Program status. Consumers’ program status, with respect to enrollment and discharge type, is described in tables 25 and 26.
Reassessment status. Across both sites, nearly all consumers were still receiving services at the 6-month and 12-month NOMs assessments. In addition, nearly all consumers had at least one contact with program staff in the past three months. The figures in Table 25 include assessments with and without an interview.
Table 25 Reassessment Status, NOMs
Site DBH WHS Both Sites
Assessment 6-mos 6-mos 6-mos 12-mos
Sample (n) 28 33 61 30
Consumer has/is (% Yes)
Program contact within 90 days of last encounter
96 100 98 100
Still receiving program services 96 100 98 100
Clinical discharge status. As of September, 2018 (when data was downloaded from
SPARS), 52 consumers (42%) had been discharged from AOT. Table 26 presents consumers’ discharge status (includes NOMs assessments with and without interview). Overall, the most common discharge status was clinical referral (44%). However, there was discrepancy across sites, with the same percentage of DBH consumers discharged due to mutually agreed cessation of treatment (29%) as clinical referral (29%). In contrast, very few consumers (4%) at WHS were discharged due to a mutually agreed upon termination of services. When looking at the number of days between first service date and discharge date, consumers were enrolled in the program for an average of 242 days (ranging from 59 to 455 days; not in table). The average for consumers at DBH was 223 days (ranging from 92 to 455 days); for consumers at WHS the average was 258 days (ranging from 59 to 427 days).
Table 26 Discharge Status, NOMs
Site DBH WHS Both Sites Discharge assessment only Sample (n) 24 28 52
Since last interview has consumer received (%)
Mutually agreed cessation of treatment 29 4 15 Withdrew/refused treatment 8 32 21 No contact within 90 days 0 0 0 Clinically referred out1 29 57 44 Death 0 0 0 Other2 33 7 19 1 Includes discharge to lower level of care and transferred services due to consumer moving. 2 Includes incarceration (n=1), moving out of state with unknown treatment status (n=4), no longer on commitment (n=4), and institutionalization at state hospital (n=2).

19
Services. Services provided by the AOT program, collected on follow-up NOMs assessments, are described in tables 27 and 28 (includes assessments with and without interview). When looking at core services (Table 27), the vast majority of consumers received services related to mental health and psychopharmacological needs. Relatively fewer consumers received screening, services to treat co-occurring substance use disorders, or trauma-specific services. Of note, there was some discrepancy in the types of services provided across sites, with relatively fewer consumers at WHS receiving assessment and pharmacological services and relatively more receiving treatment planning and case management.
Table 27 Core Services, NOMs
Site DBH WHS Both Sites
Assessment 6-mos 6-mos 6-mos 12-mos Dx
Sample (n) 28 33 61 30 52
Since last interview has consumer received (% Yes)
Screening 25 15 20 30 29 Assessment 75 55 64 73 62 Treatment planning 50 85 69 60 81 Psychopharmacological services 96 79 87 70 87 Mental health treatment 96 100 98 93 94 Co-occurring services 36 33 34 50 27 Case management 64 91 79 77 75 Trauma-specific services 4 3 3 23 6 Been referred out for core services 7 0 3 10 12
When looking at support services, the majority of consumers received services related to transportation, housing, and social recreational needs (Table 28). Again, services differed substantially across sites, with WHS providing relatively more medical care, employment assistance, transportation, education and recreational services and relatively fewer consumer-operated programs.
Table 28 Support Services, NOMs
Site DBH WHS Both Sites
Assessment 6-mos 6-mos 6-mos 12-mos Dx
Sample (n) 28 33 61 30 52
Since last interview has consumer received (% Yes)
Medical care 14 49 33 37 21 Employment 21 61 43 20 31 Family 7 18 13 10 14 Child care 0 0 0 0 0 Transportation 50 79 66 63 58 Education 21 36 30 20 14 Housing 43 52 48 47 40
20
Site DBH WHS Both Sites
Assessment 6-mos 6-mos 6-mos 12-mos Dx
Sample (n) 28 33 61 30 52
Since last interview has consumer received (% Yes) Social/recreational 54 64 59 40 33 Consumer-operated 54 18 34 53 25 HIV-testing 0 3 2 0 2 Referred out for support services 14 3 8 37 21
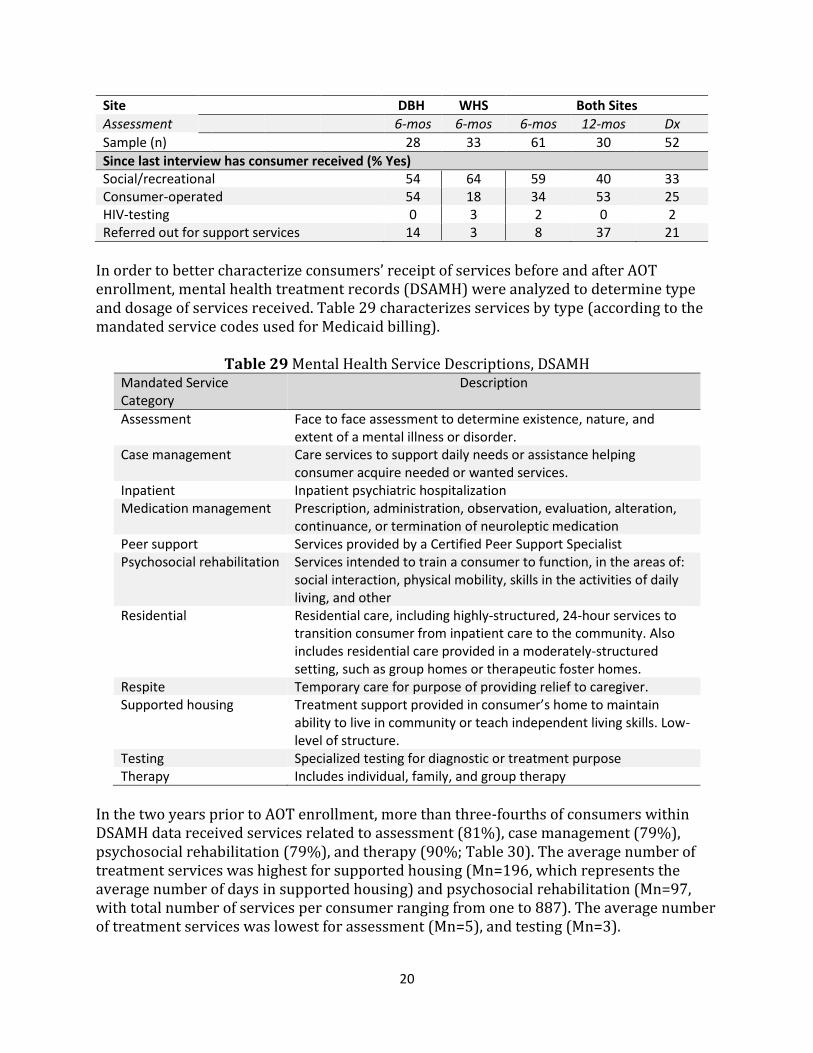
In order to better characterize consumers’ receipt of services before and after AOT enrollment, mental health treatment records (DSAMH) were analyzed to determine type and dosage of services received. Table 29 characterizes services by type (according to the mandated service codes used for Medicaid billing).
Table 29 Mental Health Service Descriptions, DSAMH Mandated Service Category
Description
Assessment Face to face assessment to determine existence, nature, and extent of a mental illness or disorder.
Case management Care services to support daily needs or assistance helping consumer acquire needed or wanted services.
Inpatient Inpatient psychiatric hospitalization Medication management Prescription, administration, observation, evaluation, alteration,
continuance, or termination of neuroleptic medication Peer support Services provided by a Certified Peer Support Specialist Psychosocial rehabilitation Services intended to train a consumer to function, in the areas of:
social interaction, physical mobility, skills in the activities of daily living, and other
Residential Residential care, including highly-structured, 24-hour services to transition consumer from inpatient care to the community. Also includes residential care provided in a moderately-structured setting, such as group homes or therapeutic foster homes.
Respite Temporary care for purpose of providing relief to caregiver. Supported housing Treatment support provided in consumer’s home to maintain
ability to live in community or teach independent living skills. Low-level of structure.
Testing Specialized testing for diagnostic or treatment purpose Therapy Includes individual, family, and group therapy
In the two years prior to AOT enrollment, more than three-fourths of consumers within DSAMH data received services related to assessment (81%), case management (79%), psychosocial rehabilitation (79%), and therapy (90%; Table 30). The average number of treatment services was highest for supported housing (Mn=196, which represents the average number of days in supported housing) and psychosocial rehabilitation (Mn=97, with total number of services per consumer ranging from one to 887). The average number of treatment services was lowest for assessment (Mn=5), and testing (Mn=3).

21
After enrollment into AOT, more than three-fourths of consumers received services related to case management (95%), medication management (88%), psychosocial rehabilitation (93%), and therapy (99%; Table 30). The average number of treatment services continued to be highest for supported housing (Mn=199, which represents the average number of nights spent in supported housing). Additionally, number of services was high for medication management (Mn=60, with total number of services per consumer ranging from one to 574). Overall, Table 30 shows that most consumers were highly engaged with mental health treatment services prior to AOT, as would be expected given the target population.
Table 30 Mental Health Services, Both Sites, DSAMH1 Timeframe 2 Yr Pre-Enroll AOT Enroll
Sample Size (n) 113 116
Mandated Service Category %1 Mn (min, max)2 %1 Mn (min, max)2
Assessment 81 5 (1, 48) 58 4 (1, 37) Case management 79 21 (1, 130) 95 16 (1, 95) Inpatient5 25 20 (3, 110) 17 12 (1, 31) Medication management 73 79. (1, 698) 88 60 (1, 574) Peer support 58 19 (1, 111) 68 25 (1, 299) Psychosocial rehabilitation 79 97 (1, 887) 93 58 (1, 454) 24-hour residential 69 43 (1, 205) 66 35 (1, 308) Respite 0 --- 0 --- Supported housing 22 196 (5, 653) 23 199 (3, 455) Testing 3 3 (2, 5) 3 2 (1, 3) Therapy 90 42 (1, 260) 99 49 (1, 352) Individual therapy 100 24 (1, 119) 100 29 (1, 284) Family Therapy 28 5 (1, 24) 22 3 (1, 8) Group Therapy 71 23 (1, 164) 73 25 (1, 168) Behavior management 23 5 (1, 31) 22 4 (1, 25) 1 Percent of consumers who received service at least once during timeframe (2 years prior to AOT enrollment or after AOT enrollment). 2 Average number of events, by type and timeframe (Mn), and minimum and maximum number of events by type and timeframe. For inpatient treatment, residential care, and supported housing and event is a single day in the setting.
In order to characterize treatment dosage more specifically, the total number of hours (or days, depending on service type) were summed and averaged across the full sample (Table 31). When looking at service dosage in the two years prior to AOT, the services with the highest dosage (per consumer who received that service) were supported housing (Mn=196 days per consumer) and psychosocial rehabilitation (Mn=66 hours per consumer). After enrolling in AOT, medication management was the second highest dosage service, with an average of 52 hours per consumer. Medication management represented the greatest range (.08 hours to 1077 hours). The highest dosage service after AOT enrollment remained supported housing with an average of 199 days per consumer who received the service.

22
Table 31 Mental Health Service Dosage, Both Sites, DSAMH1 Timeframe 2 Yr Pre-Enroll AOT Enroll
Sample Size (n) 113 116
Mandated Service Category Mn (min, max)2 Mn (min, max)2
Assessment 4 (.5, 24) 4 (.25, 36) Case management 17 (.25, 133) 12 (.24, 88) Inpatient2 20 (3, 110) 12 (1, 31) Medication management 50 (.08, 679) 52 (.08, 1077) Peer support 13 (.75, 68) 18 (.33, 164) Psychosocial rehabilitation 66 (.25, 453) 44 (.5, 418) 24-hour residential2 43 (1, 205) 35 (1, 308) Supported housing2 196 (5, 653) 199 (3, 455) Testing 6 (4, 10) 3 (2.5, 3) Therapy 32 (.11, 177) 39 (.41, 238) 1 For those with any service, average hours of services provided by type (Mn); minimum and maximum hours of service provided by type (min, max). 2 Reflects days rather than hours
Davis Behavioral Health. When looking at services by site, the majority of DBH consumers had received assessment (75%), case management (79%), medication management (56%), peer support (60%), psychosocial rehabilitation (79%), 24-hour residential care (68%), and therapy (96%) at least once during the two years prior to AOT enrollment (Table 32). The percent of consumers receiving those services was higher post-enrollment when looking at case management (98%), medication management (82%), peer support (70%), psychosocial rehabilitation (96%), and therapy (100%). Fewer consumers received an assessment (63%) or 24-hour residential care (63%) after enrollment. A higher percentage of DBH consumers had an inpatient psychiatric hospitalization (18%).6
Table 32 Mental Health Services, DBH, DSAMH
Timeframe 2 Yr Pre-Enroll AOT Enroll
Sample Size (n) 53 57
Mandated Service Category %1 Mn (min, max)2 %1 Mn (min, max)2
Assessment 75 2 (1, 12) 63 2 (1, 15) Case management 79 20 (1, 66) 98 20 (1,95) Inpatient 11 14 (4, 23) 18 16 (4, 31) Medication management 56 110 (1, 645) 82 62 (1, 574) Peer support 60 28 (2, 111) 70 38 (1, 299) Psychosocial rehabilitation 79 170 (2, 887) 96 86 (1, 454) 24-hour residential 68 54 (2, 205) 63 30 (1, 231) Respite 0 --- 0 --- Supported housing 21 363 (52, 653) 25 281 (15, 455) Testing 0 --- 0 ---
6 The difference between these figures and those reported on NOMs assessments, Table 30, are likely due to differences between self-report data (NOMs) and Medicaid billing codes (DSAMH). For example, nights spent in a 24-hour residential setting may be experienced by the consumer as an inpatient hospitalization; they would not be counted as such for billing purposes.

23
Timeframe 2 Yr Pre-Enroll AOT Enroll
Sample Size (n) 53 57
Mandated Service Category %1 Mn (min, max)2 %1 Mn (min, max)2
Therapy 96 50 (1, 260) 100 43 (1, 344) Individual therapy 100 24 (1, 119) 100 27 (1, 151) Family Therapy 8 5 (1, 15) 4 2 (1, 2) Group Therapy 69 34 (1, 164) 67 22 (2, 168) Behavior management 38 6 (1, 31) 39 4 (1, 25) 1 Percent of consumers who received service at least once during timeframe (2 years prior to AOT enrollment or after AOT enrollment). 2 Average number of events, by type and timeframe (Mn), and minimum and maximum number of events by type and timeframe.
When looking at treatment dosage at DBH prior to AOT enrollment, consumers received the highest dosage for supported housing (Mn=363 days; Table 33) and medication management (Mn=103 hours). Consumers spent a greater number of days in residential settings (M=54 days) and supported housing (Mn=363 days) prior to enrollment when compared to post-enrollment (Mn=30 days and Mn=281 days, respectively).
Table 33 Mental Health Service Dosage, DBH, DSAMH
Timeframe 2 Yr Pre-Enroll AOT Enroll
Sample Size (n) 53 57
Mandated Service Category Mn (min, max)1 Mn (min, max)1
Assessment 3 (1, 12) 3 (.5, 15) Case management 14 (.58, 49) 14 (.24, 88) Inpatient2 14 (4, 23) 16 (4, 31) Medication management 103 (.08, 679) 92 (.08, 1077) Peer support 19 (1, 68) 27 (.33, 164) Psychosocial rehabilitation 83 (2, 453) 49 (.5, 418) 24-hour residential2 54 (2, 205) 30 (1, 231) Supported housing2 363 (52, 653) 281 (15, 455) Testing --- --- Therapy 32 (.11, 176) 27 (.41, 201) 1 For those who received any service, average hours of services provided by type (Mn); minimum and maximum hours of service provided by type (min, max). For those who received any service. 2 Reflects days rather than hours.
Weber Human Services. The majority of WHS consumers had received assessment (87%), case management (78%), medication management (83%), psychosocial rehabilitation (78%), 24-hour residential care (70%), and therapy (85%) at least once during the two years prior to AOT enrollment (Table 34). The percent of consumers receiving those services was higher post-enrollment for case management (92%), medication management (93%), psychosocial rehabilitation (90%), and therapy (98%). In addition, the majority of consumers received peer support (66%) after enrollment. Fewer consumers received an assessment (53%) after enrollment. When compared to DBH, more

24
WHS consumers received family therapy in both timeframes (49% and 40% respectively, compared to less than ten percent at DBH).
Table 34 Mental Health Services, WHS, DSAMH
Timeframe 2 Yr Pre-Enroll AOT Enroll
Sample Size (n) 60 59
Mandated Service Category %1 Mn (min, max)2 %1 Mn (min, max)2
Assessment 87 6 (1, 48) 53 5 (1, 37) Case management 78 22 (1, 130) 92 11 (1, 46) Inpatient 37 22 (3, 110) 27 10 (1, 28) Medication management 83 59 (1, 698) 93 59 (3, 270) Peer support 48 7 (1, 41) 66 11 (1, 118) Psychosocial rehabilitation 78 33 (1, 179) 90 29 (2, 208) 24-hour residential 70 33 (1, 165) 69 40 (1, 308) Respite 0 -- 0 -- Supported housing 24 65 (5, 305) 22 111 (3, 365) Testing 5 3 (2, 5) 5 2 (1, 3) Therapy 85 35 (3, 96) 98 54 (2, 352) Individual therapy 100 24 (1, 67) 100 31 (2, 284) Family Therapy 49 5 (1, 24) 40 3 (1, 8) Group Therapy 73 13 (1, 60) 79 27 (1, 109) Behavior management 6 1 (1, 2) 5 1 (1, 2) 1 Percent of consumers who received service at least once during timeframe (2 years prior to AOT enrollment or after AOT enrollment). 2 For those who received any services, average number of events, by type and timeframe (Mn), and minimum and maximum number of events by type and timeframe.
When looking at dosage post-AOT enrollment, WHS consumers received the greatest dosage of services in supported housing (Mn=111 days), therapy (Mn=51 hours), 24-hour residential care (Mn=40 days), and psychosocial rehabilitation (Mn=39 hours; Table 35). Of note, both the percent of consumers with an inpatient psychiatric hospitalization, and the length of that stay, was lower post-enrollment (37% vs. 27% of consumers; with an average stay of 22 vs. 10 days). The percent of consumers with a stay in a 24-hour residential setting remained the same, but the average length of stay was longer post-enrollment (33 vs. 40 days), which may indicate that AOT enrollment increased use of this type of service as an alternative to hospitalization.7
7 The difference between these figures and those reported on NOMs assessments, Table 30, are likely due to differences between self-report data (NOMs) and Medicaid billing codes (DSAMH). For example, nights spent in a 24-hour residential setting may be experienced by the consumer as an inpatient hospitalization; they would not be counted as such for billing purposes.

25
Table 35 Mental Health Service Dosage, WHS, DSAMH
Timeframe 2 Yr Pre-Enroll AOT Enroll
Sample Size (n) 60 59
Mandated Service Category Mn (min, max)1 Mn (min, max)1
Assessment 5 (.5, 24) 5 (.25, 36) Case management 19 (.25, 133) 9 (.25, 41) Inpatient2 22 (3, 110) 10 (1, 28) Medication management 16 (.25, 177) 19 (1, 111) Peer support 5 (.75, 45) 8 (.5, 103) Psychosocial rehabilitation 52 (.25, 402) 39 (.5, 354) 24-hour residential2 33 (1, 165) 40 (1, 308) Supported housing2 65 (5, 305) 111 (3, 365) Testing 6 (4, 10) 3 (2.5, 3) Therapy 31 (2, 102) 51 (1, 238) 1 For those with any services, average hours of services provided by type (Mn); minimum and maximum hours of service provided by type (min, max). 2 Reflects days rather than hours.
Funding of Behavioral Health Services Prior to AOT, more than half of consumers (64%; Table 36) were enrolled in Medicaid at some point (determined because at least one mental health service was paid for by Medicaid). After AOT enrollment, 71% of consumers received Medicaid at some point. Of note, close to one-fourth (19% after AOT; 26%, prior to AOT) of consumers who had Medicaid were also classified as unfunded during the same timeframe (not in table). Similarly, 17% of consumers were both insured and unfunded prior to enrollment; 14% were insured and unfunded at some point after enrollment (not in table). Such figures highlight the difficulty of maintaining access to health care with this population, who may struggle to complete tasks necessary to maintain Medicaid enrollment, despite eligibility.
Table 36 Behavioral Health Funding, Both Sites, DSAMH1
Timeframe 2 Yr Pre-Enroll AOT Enroll
Sample Size 113 116
Payment Type (%)1
Medicaid 64 71 Insurance 40 40 Unfunded 50 35 1 Percent of consumers with at least one service paid by Medicaid, insurance, or unfunded respectively.
When examining service payment by site as presented in Table 37, a larger percentage of consumers received at least one Medicaid service at WHS compared to DBH. This was the case both pre- and post-enrollment (72% and 81% of consumers at WHS; 55% and 60% of consumers at DBH, respectively).

26
Table 37 Behavioral Health Funding, By Site, DSAMH1
Site DBH WHS
Timeframe 2 Yr Pre-Enroll AOT Enroll 2 Yr Pre-Enroll AOT Enroll
Sample Size (n) 53 57 60 59
Payment Type (%)1
Medicaid 55 60 72 81 Insurance 28 33 50 46 Unfunded 47 33 52 37 1 Percent of consumers with at least one service paid by Medicaid, insurance, or unfunded respectively.
Conclusion
As of September 24, 2018, the AOT project enrolled 138 consumers across both sites. The majority of consumers had been diagnosed with schizophrenia or delusional disorders; nearly three-fourths had multiple diagnoses. Close to half had at least one criminal court case in the two years prior to enrollment. The majority had spent some nights out of the home in the month prior to AOT enrollment, most commonly due to a stay in a psychiatric hospital. While the majority of consumers did not endorse recent substance use at baseline, a sub-population of those who did use reported binge drinking and/or regular drug use. When looking at services provided, consumers received appropriate services, per the program’s goals. Data from multiple sources (NOMs and DSAMH) support that the consumers receiving services present with mental health concerns as well as struggle to maintain consistency with housing and healthcare funding. Furthermore, one-fifth of consumers were resistant to treatment and either refused or withdrew from services; given the target population, this was not surprising. While the number of clients who have been discharged to date is small, clients’ rating on many measures of well-being is improved at discharge when compared to baseline NOMs assessments. Service utilization for intensive care such as emergency room visits and inpatient hospitalizations also seem to reduce over time. Administrative records show that consumers’ criminal justice involvement was reduced after enrollment as well. Finally, consumers gave strong positive ratings for the quality of care received.

27
References
Angelo, F. N., McDonell, M. G., Lewin, M. R., Srebnik, D., Lowe, J., Roll, J., & Ries, R. (2013).
Predictors of stimulant abuse treatment outcomes in severely mentally ill
outpatients. Drug Alcohol Depend, 131(1-2), 162-165.
Catalano, R., Snowden, L., Shumway, M., & Kessell, E. (2007). Unemployment and civil
commitment: a test of the intolerance hypothesis. Aggress Behavior, 33(3), 272-280.
Center for Behavioral Health Statistics and Quality. (2014). The NSDUH report: 3.1 million
adults with mental illness were unemployed. Retrieved from
http://www.samhsa.gov/ data/
Constantine, R. J., Robst, J., Andel, R., & Teague, G. (2012). The impact of mental health
services on arrests of offenders with a serious mental illness. Law Hum Behavior,
36(3), 170-176.
Utah Division of Substance Abuse and Mental Health. (2013). Annual report. Retrieved from
https://dsamh.utah.gov/pdf/Annual%20Reports/Annual%20report%202013%
20Final%20web%20version%202-5.pdf
Forgeard, M. J., Pearl, R. L., Cheung, J., Rifkin, L. S., Beard, C., & Bjorgvinsson, T. (2016).
Positive beliefs about mental illness: Associations with sex, age, diagnosis, and
clinical outcomes. Journal of Affective Disorders, 204, 197-204.
Hamilton, I., Lloyd, C., Bland, J. M., & Savage Grainge, A. (2015). The impact of assertive
outreach teams on hospital admissions for psychosis: a time series analysis. Journal
of Psychiatric Mental Health Nursing, 22(7), 484-490. doi:10.1111/jpm.12239
Herman, D. B. (2013). Transitional support for adults with severe mental illness. Research
on Social Work Practice, 24(5), 556-563.

28
Kirst, M., Zerger, S., Misir, V., Hwang, S., & Stergiopoulos, V. (2015). The impact of a Housing
First randomized controlled trial on substance use problems among homeless
individuals with mental illness. Drug Alcohol Dependence, 146, 24-29.
Kontos, N., Freudenreich, O., & Querques, J. (2016). Poor insight: A capacity perspective on
treatment refusal in serious mental illness. Psychiatric Services, 67(11), 1254-1256.
Luskin, M. L. (2013). More of the same? Treatment in mental health courts. Law and Human
Behavior, 37(4), 255-266.
McGurk, S. R., Mueser, K. T., Xie, H., Welsh, J., Kaiser, S., Drake, R. E., Becker, D.R., Bailey, E.,
Fraser, G., Wolfe, R., & McHugo, G. J. (2015). Cognitive enhancement treatment for
people with mental illness who do not respond to supported employment: a
randomized controlled trial. American Journal of Psychiatry, 172(9), 852-861.
Morgan, R. D., Flora, D. B., Kroner, D. G., Mills, J. F., Varghese, F., & Steffan, J. S. (2012).
Treating offenders with mental illness: a research synthesis. Law and Human
Behavior, 36(1), 37-50.
Munetz, M. R., Ritter, C., Teller, J. L. R., & Bonfine, N. (2014). Mental health court and
assisted outpatient treatment: perceived coercion, procedural justice, and program
impact. Psychiatric Services, 65(3), 7.
Ramchand, R., Griffin, B. A., Slaughter, M. E., Almirall, D., & McCaffrey, D. F. (2014). Do
improvements in substance use and mental health symptoms during treatment
translate to long-term outcomes in the opposite domain? Journal of Substance Abuse
Treatment, 47(5), 339-346.
Rosenberg, L. (2014). Assisted outpatient treatment: we can do better. Journal of
Behavioral Health Services & Research, 43(3), 251-253.

29
Rugkasa, J. (2016). Effectiveness of community treatment orders: the international
evidence. The Canadian Journal of Psychiatry, 6(11), 15-24.
Somers, J. M., Moniruzzaman, A., & Palepu, A. (2015). Changes in daily substance use among
people experiencing homelessness and mental illness: 24-month outcomes
following randomization to Housing First or usual care. Addiction, 110(10), 1605-
Tamburello, A. C. and Sehi, Z. (2013). Commentary: bridging the gaps for former inmates
with serious mental illness. Journal of American Academy of Psychiatry and the Law,
41 (5), 510-513.
Weinstein, N. M. (2014). The legal aspects of conditional release in the criminal and civil
court system. Behavioral Sciences and the Law, 32(5), 666-680.
Zanni, G. R. and Stavis, P. F. (2007). The effectiveness and ethical justification of psychiatric
outpatient commitment. The American Journal of Bioethics, 7(11), 31-41.