evaluation of surface sampling method performance … · wayne einfeld, ray m. boucher, matt s....
TRANSCRIPT

SANDIA REPORT SAND2011-4085 Unlimited Release Printed June 2011
Evaluation of Surface Sampling Method Performance for Bacillus Spores on Clean and Dirty Outdoor Surfaces
Wayne Einfeld, Ray M. Boucher, Matt S. Tezak, Mollye C. Wilson and Gary S. Brown Prepared by Sandia National Laboratories Albuquerque, New Mexico 87185 and Livermore, California 94550 Sandia National Laboratories is a multi-program laboratory managed and operated by Sandia Corporation, a wholly owned subsidiary of Lockheed Martin Corporation, for the U.S. Department of Energy's National Nuclear Security Administration under contract DE-AC04-94AL85000. Approved for public release; further dissemination unlimited.

2
Issued by Sandia National Laboratories, operated for the United States Department of Energy by Sandia Corporation. NOTICE: This report was prepared as an account of work sponsored by an agency of the United States Government. Neither the United States Government, nor any agency thereof, nor any of their employees, nor any of their contractors, subcontractors, or their employees, make any warranty, express or implied, or assume any legal liability or responsibility for the accuracy, completeness, or usefulness of any information, apparatus, product, or process disclosed, or represent that its use would not infringe privately owned rights. Reference herein to any specific commercial product, process, or service by trade name, trademark, manufacturer, or otherwise, does not necessarily constitute or imply its endorsement, recommendation, or favoring by the United States Government, any agency thereof, or any of their contractors or subcontractors. The views and opinions expressed herein do not necessarily state or reflect those of the United States Government, any agency thereof, or any of their contractors. Printed in the United States of America. This report has been reproduced directly from the best available copy. Available to DOE and DOE contractors from U.S. Department of Energy Office of Scientific and Technical Information P.O. Box 62 Oak Ridge, TN 37831 Telephone: (865) 576-8401 Facsimile: (865) 576-5728 E-Mail: [email protected] Online ordering: http://www.osti.gov/bridge Available to the public from U.S. Department of Commerce National Technical Information Service 5285 Port Royal Rd. Springfield, VA 22161 Telephone: (800) 553-6847 Facsimile: (703) 605-6900 E-Mail: [email protected] Online order: http://www.ntis.gov/help/ordermethods.asp?loc=7-4-0#online
3
SAND2011-4085 Unlimited Release Printed June 2011
Evaluation of Surface Sampling Method Performance for Bacillus Spores on Clean and Dirty Outdoor Surfaces
Wayne Einfeld, Ray M. Boucher, Matt S. Tezak, Mollye C. Wilson and Gary S. Brown Chemical and Biological Systems Department
Sandia National Laboratories P.O. Box 5800
Albuquerque, New Mexico 87185-0734
Abstract Recovery of Bacillus atrophaeous spores from grime-treated and clean surfaces was measured in a controlled chamber study to assess sampling method performance. Outdoor surfaces investigated by wipe and vacuum sampling methods included stainless steel, glass, marble and concrete. Bacillus atrophaeous spores were used as a surrogate for Bacillus anthracis spores in this study designed to assess whether grime-coated surfaces significantly affected surface sampling method performance when compared to clean surfaces. A series of chamber tests were carried out in which known amounts of spores were allowed to gravitationally settle onto both clean and dirty surfaces. Reference coupons were co-located with test coupons in all chamber experiments to provide a quantitative measure of initial surface concentrations of spores on all surfaces, thereby allowing sampling recovery calculations. Results from these tests, carried out under both low and high humidity conditions, show that spore recovery from grime-coated surfaces is the same as or better than spore recovery from clean surfaces. Statistically significant differences between method performance for grime-coated and clean surfaces were observed in only about half of the chamber tests conducted.
.

4
ACKNOWLEDGMENTS
This work was funded by the Department of Homeland Security Science and Technology Directorate as a part of the Inter-agency Biological Restoration Demonstration (IBRD). Mr Lance Brooks was the program manager. This work of authorship was prepared as an account of work sponsored by an agency of the United States Government. Accordingly, the United States Government retains a nonexclusive, royalty-free license to publish or reproduce the published form of this contribution, or allow others to do so for United States Government purposes. Neither Sandia Corporation, the United States Government, nor any agency thereof, nor any of their employees makes any warranty, express or implied, or assumes any legal liability or responsibility for the accuracy, completeness, or usefulness of any information, apparatus, product, or process disclosed, or represents that its use would not infringe privately-owned rights. Reference herein to any specific commercial product, process, or service by trade name, trademark, manufacturer, or otherwise does not necessarily constitute or imply its endorsement, recommendation, or favoring by Sandia Corporation, the United States Government, or any agency thereof. The views and opinions expressed herein do not necessarily state or reflect those of Sandia Corporation, the United States Government or any agency thereof. Sandia is a multiprogram laboratory operated by Sandia Corporation, a Lockheed Martin Company, for the United States Department of Energy under contract DE-AC04-94AL85000.

5
CONTENTS
Acknowledgments........................................................................................................................... 4
1. Introduction ................................................................................................................................ 7
2. Study Objectives ........................................................................................................................ 9
3. Methods and Materials ............................................................................................................. 11 3.1 Spore Matrix……………………………………………………………………..11 3.2 Grime Formulation and Application……………………………………………..11 3.3 Reference and Test Coupons. …………………………………………………...12 3.4 Exposure Chamber. ……………………………………………………………..12 3.5 Test Configuration………………………………………………………………13 3.6 Sampling, Extraction and Enumeration…………………………………………14 3.7 Recovery Efficiency Calculations……………………………………………….17
4. Results and Discussion ............................................................................................................ 17 4.1 Grime Formulation……………………………………………………………….17 4.2 Spore Distribution in Chamber…………………………………………………..18 4.3 Method Recoveries for Dirty and Clean Surfaces……………………………….21 4.4 Potential Background Biological Effects from Grime Components…………….22 4.5 Extended Spore-Coupon Exposure Intervals…………………………………….23
5. Conclusions .............................................................................................................................. 23
6. References ................................................................................................................................ 24
Appendix A: Example Appendix Title ......................................... Error! Bookmark not defined. Distribution [can go on an even or an odd page] .......................................................................... 28
FIGURES Figure 1. Diagram of exposure chamber showing spore aerosol generator, particle counter and primary/intermediate chambers.....................................................................................................12 Figure 2. Diagram of primary chamber floor showing layout of grime-coated, clean and reference coupons for a typical test……………………………………………………………...15 Figure 3. The bottom drawer of the primary exposure chamber showing test and reference coupon layout……………………………………………………………………………………16 Figure 4. The vacuum filter sock and associated disposable cardboard suction tube……………………………………………………………………………………………….16 Figure 5. Scatter plot showing particle counter reading at start of chamber experiment just prior to the 24-hour gravitational settling period versus average reference coupon spore density as determined by sampling…………………………………………………………………………18

6
Figure 6. Three dimensional plot of spore surface concentrations showing the degree of homogeneity on reference coupons for a typical chamber test…………………………………19 Figure 7. Three dimensional plot of spore surface concentrations showing the degree of homogeneity on 24 stainless steel dirty and clean test coupons…………………………………19 Figure 8. Histogram from a typical chamber experiment showing the variation in reference coupon spore deposition density over the 24 coupons in the chamber…………………………..20 Figure 9. Histogram from a typical chamber experiment showing the variation in dirty/clean test coupon spore deposition density over the 24 coupons in the chamber………………………….20
Tables Table 1. Summary of wipe and vacuum sampling recoveries and statistical analyses for clean and grime-coated stainless steel, marble and concrete coupons…………………………………21

7
1. INTRODUCTION Surface sampling is an important component of the response activity following a biological agent release such as Bacillus anthracis, and sampling method performance significantly influences the overall understanding of the nature of the contamination event and related public health risk, particularly with respect to verification that cleanup goals have been met and that affected facilities are suitable for re-occupancy. Many studies have been carried out to investigate the recovery efficiency of various surface sampling techniques on a variety of environmental surfaces and most have focused on the determination of detection levels and spore recovery. Most of these controlled laboratory studies have examined only clean surfaces 2-5,7,8,10,12. Recent case-studies have been undertaken to investigate contamination potential from a wide-area urban outdoor release of Bacillus anthracis where both outdoor and indoor surfaces are expected to be contaminated by gravitational settling of spores. Under these types of agent release scenarios, both indoor and outdoor areas will require surface sampling in order to characterize contamination levels. The inclusion of outdoor contaminated surfaces in these wide-area contamination scenarios is complicated by the fact that outdoor urban surfaces are commonly coated with an urban grime layer composed of airborne crustal material, sea salts (in coastal areas), vehicular exhaust, and other aerosol materials such as vehicular tire debris and other urban pollutant aerosols 14,15. In light of these outdoor surface sampling conditions, the extent to which grime-coated surfaces may influence spore recovery during surface sampling using conventional methods such as wipes, swabs, and vacuum techniques is an important consideration and was investigated in this study.

8
9
2. STUDY OBJECTIVES The focus of this particular study was to compare the performance of conventional wipe and vacuum surface spore sampling techniques on clean and grime-coated surfaces commonly found in the outdoor urban environment, and to provide insight into the question: do grime-coated surfaces significantly influence spore recovery efficiency when compared to method performance on clean surfaces? A synthetic grime formulation was developed for this study that was informed by a combination of literature publications and limited laboratory analyses of urban grime samples. The study was carried out in a controlled-environmental laboratory exposure chamber in order to account for other potentially influential variables such as temperature and ambient relative humidity. The study design incorporated the use of surface-treated Bacillus atrophaeus as a surrogate organism for Bacillus anthracis.
.

10

11
3. METHODS AND MATERIALS 3.1 Spore Matrix The spore material used as the test agent in this study was a powdered matrix containing B. atrophaeus (ATCC 9372; formerly Bacillus subtilis var niger and subsequently Bacillus globigii) and silicon dioxide particles obtained from U.S. Army Dugway Proving Ground, Life Science Division. The spore material was prepared by cultivating B. atrophaeus in tryptic soy both (Difco, Detroit, MI) containing 3 mg/L MnSO4 (Fisher Scientific, Pittsburg, PA). After 80 to 90% sporulation, the spore suspension was centrifuged to obtain a spore suspension containing approximately 20% solids. Dry spore material was then prepared from the unwashed spore suspension with a laboratory spray dryer. The spore material was dry blended with Aerosil R812S fumed silica particles (Degussa, Frankfurt, Germany) at 80% dry spore material to 20% silica and jet milled to a uniform particle size. The final powdered matrix contained approximately 1011 viable spores per g. The B. atrophaeus spore material was designed to enhance aerosol suspension and inhalation characteristics. The removal, extraction, and recovery characteristics of other Bacillus species, native or otherwise treated may differ.
3.2 Grime Formulation and Application A synthetic grime mixture was prepared that contained the following principal components: Arizona Road Dust (ISO 12103-1, A1 Ultrafine Test Dust, Analysis 5430, Powder Technology Inc., www.powdertechnologyinc.com), 94% w/w; soot mixture, 3%; and biological mixture, 3% . The soot mixture contained the following components: carbon black, 83.3% w/w (Vulcan XC-723, Cabot Corp, Boston, MA); diesel particulate matter, 8.3 % (NIST Catalog No. 2975); new 10W30 motor oil, 4.2 %; alpha pinene, (Catalog No. AC13127-2500, Acros Organics, www.acros.be), 4.2%. The biological mixture contained the following components: Lycopodium powder, (Catalog No. 215B, Duke Scientific, Palo Alto, CA), 33% w/w; Ragweed pollen, (Catalog No 214B, Duke Scientific), 33%; and Bermuda grass smut spores, (Catalog No. 419, Duke Scientific), 33%. Note that Bermuda grass spores are a US Dept of Agriculture-regulated plant pathogen requiring permits and contained handling procedures. The final grime mixture was as prepared as follows: 94 grams of Arizona Dust, 3 grams of the soot mixture, and 3 grams of the biological material (only included in selected tests) were placed in a sealed glass jar and mixed for 48 hours at 150 rpm in a rubber ball mill drum. Application of grime to test coupons was done via a spray technique. Five grams of the final grime mix was added to a polyethylene screw cap bottle along with 95g of acetonitrile and sonicated for 15min. This mixture was sprayed onto the test coupon surfaces using a high-volume, low-pressure spray gun (Transtar Autobody Technolgies Inc., Part No. 6618, www.tat-co.com). The plant pathogens were included in the grime mixture in only a limited number of test cases, and in these instances coupon spraying was done in a HEPA-filtered glove box (LANCS Industries Glove Bag #L1-3-1, www.lancsindustries.com). A laboratory fume hood was used for coupon spraying when the plant pathogens were not included in the grime mixture. Grime mass loading on the test coupons, following evaporation of the acetonitrile solvent, was in the range of 30 ± 3 mg per coupon (3 ± 0.3 g/m2).
12
3.3 Reference and Test Coupons Stainless steel coupons measuring 1.25 x 5 cm (6.25 cm2) were used as reference surfaces in these chamber studies and were cut from 1.2-mm-thick 316-L steel (Neeley Plastic Fabrication Inc., Albuquerque, NM). Reference coupons were re-used throughout the test series and prior to and after each use were treated with a hydrogen peroxide based sporicide (EasyDECON Catalog No. DF200-531X, EFT Holdings Inc., Huntsville, AL) and then washed in a powdered detergent solution (Alcojet, Alconox Inc., New York, NY), rinsed in de-ionized water and air dried. Test coupons measuring 10 x 10 cm (100 cm2) were fabricated from 15-mm-thick floor grade polished marble, stainless steel (same source as reference coupons) and 4-mm-thick window glass. Marble test coupons were re-used throughout the test series and were pre-cleaned and handled in the same manner as the reference coupons. Circular concrete coupons, 10.1 cm diameter x 2 cm thickness (81cm2) were prepared from a mortar mix containing Portland cement and sand (Quikcrete, No. 1102, www.quickrete.com ) and cured for 60 days prior to use. Concrete coupons were prepared in plastic molds with the smooth side of the coupon adjacent to the mold used for grime application and sampling. The concrete and glass test coupons were single-use and disinfected and discarded after use. 3.4 Exposure Chamber Principle components of the coupon exposure chamber system included a fluidized bed aerosol generator (TSI 3400A, TSI Inc, www.tsi.com) connected by ¼-inch ID stainless steel tubing to a primary aerosol chamber as illustrated in Figure 1.
Figure 1 Diagram of exposure chamber showing spore aerosol generator, particle counter and primary/intermediate chambers.
The 90 x 90 x 90 cm (0.73 m3) exposure chamber was fabricated from polypropylene sheets that were plastic-seam-welded at the chamber edges. Access doors, located on opposite ends of the chamber, and windows on the other walls and chamber ceiling were constructed of 12-mm-thick,
13
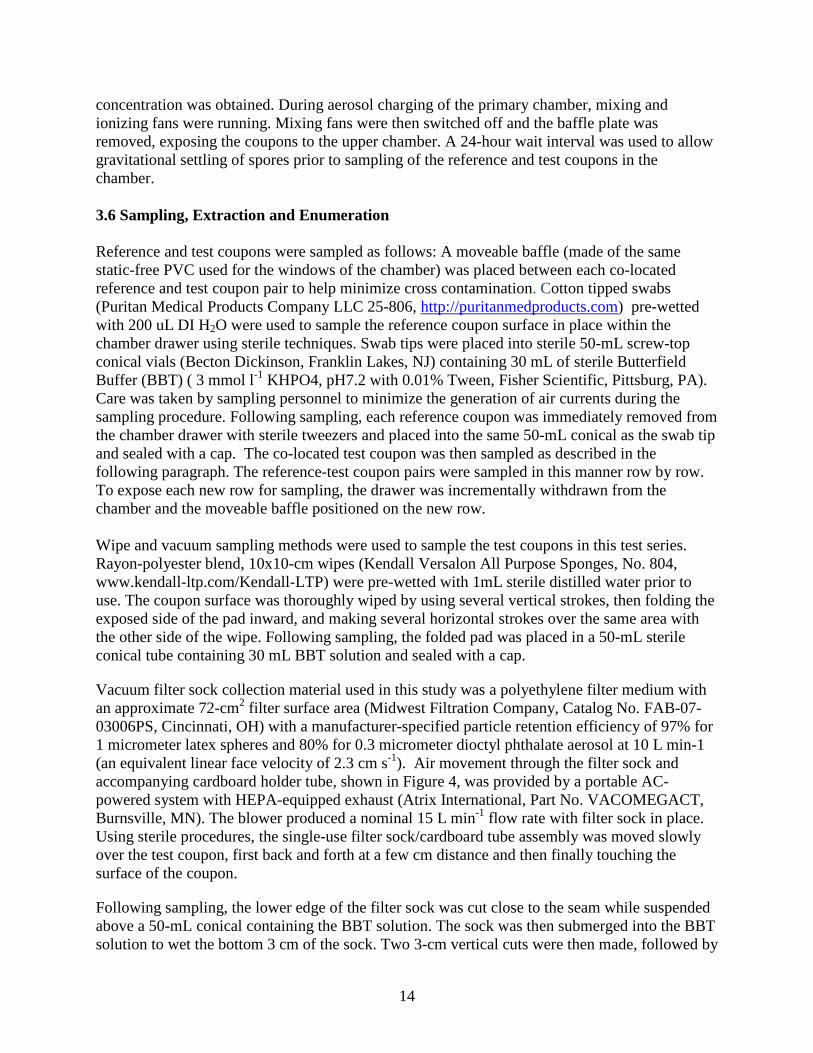
static-free polyvinyl chloride. A feed through port from the aerosol generator was located at the top of the chamber. Four mixing fans (Orion Fans Model #0A80A0-11-1WB, www.orionfans.com) were positioned in the inside upper corners of the chamber. In addition, two static discharge mixing fans (SIMCO minION2 Ionizing Air Blower, www.simco-static.com) were positioned on the interior ceiling of the chamber. These six fans were used to mix the aerosol contents of the chamber and minimize static charge effects prior to a 24-hour quiescent interval during which the aerosol contents of the chamber were allowed to settle onto the reference and test coupons. The bottom of the chamber included a pull-out drawer into which the reference and test coupons were arranged prior to each test. Immediately above the coupon drawer was a stainless steel removable baffle panel that was used to isolate the reference and test coupons from the upper exposure chamber during initial aerosol charging of the chamber. Once the desired aerosol concentration was reached in the upper chamber, the mixing fans were turned off and after a 15-second delay, the baffle panel between the upper chamber and the coupon drawer was removed, allowing the aerosol to settle onto the coupons over a 24-hour interval. A secondary chamber was also connected to the fluidized bed aerosol generator via stainless steel tubing and ball valves. This chamber was used for stabilization of the output of the fluidized bed system in preparation for aerosol delivery to the primary chamber. Once a stable output from the aerosol generator was obtained, the output from the generator was routed directly to the primary aerosol chamber containing the test and reference coupons. A laser velocimetry particle sizer (TSI Model 3110A Aerodynamic Particle Sizer, TSI Inc., www.tsi.com) was used to monitor the stability of aerosol generator output and final mixed aerosol concentration of aerosol in the primary chamber during each test. Humidity control in the tests was achieved to ±5% RH of a target set point (typically 15% and 90% RH) by using a sensor-controlled humidifier housed within a second walk-in containment chamber that enclosed the primary chamber. 3.5 Test Configuration Prior to each test, the primary chamber was sterilized with a hydrogen peroxide-based sporicide. Following decontamination, the floor of the chamber was covered with double-sided, adhesive-coated plastic film (3M Inc, Catalog No. 415DCW, www.solutions.3m.com) to minimize re-aerosolization of settled spores during sampling activities. Prior to each test, chamber floor and wall surfaces were also treated with a de-ionizing gun (MEECH Static Eliminators, Model 904 Power Supply, Model 954 Static Discharge Gun) to minimize surface static charges. Coupon placement during each test was carried out as follows: Twelve clean test coupons and 12 grime-coated test coupons were arranged within the primary chamber, as shown in Figure 2. A reference coupon was also co-located with each clean or dirty test coupon. All coupons were positioned on 2.5-cm-high riser blocks and affixed with double-sided adhesive tape. Raising coupon height further minimized the potential for coupon cross contamination via spore re-aerosolization during sampling procedures. A typical configuration of the clean and grime-coated test and reference coupons just prior to exposure and sampling is shown in Figure 3.
Following coupon placement within the chamber drawer, the chamber baffle was inserted to isolate the coupons from the upper chamber. Spores from the aerosol generator were then routed into the secondary chamber and monitored with the particle counter until they were stabilized at the desired input concentration. Generator output was then routed directly into the primary chamber and further monitored with the particle counter until the desired primary chamber
14
concentration was obtained. During aerosol charging of the primary chamber, mixing and ionizing fans were running. Mixing fans were then switched off and the baffle plate was removed, exposing the coupons to the upper chamber. A 24-hour wait interval was used to allow gravitational settling of spores prior to sampling of the reference and test coupons in the chamber. 3.6 Sampling, Extraction and Enumeration Reference and test coupons were sampled as follows: A moveable baffle (made of the same static-free PVC used for the windows of the chamber) was placed between each co-located reference and test coupon pair to help minimize cross contamination. Cotton tipped swabs (Puritan Medical Products Company LLC 25-806, http://puritanmedproducts.com) pre-wetted with 200 uL DI H2O were used to sample the reference coupon surface in place within the chamber drawer using sterile techniques. Swab tips were placed into sterile 50-mL screw-top conical vials (Becton Dickinson, Franklin Lakes, NJ) containing 30 mL of sterile Butterfield Buffer (BBT) ( 3 mmol l-1 KHPO4, pH7.2 with 0.01% Tween, Fisher Scientific, Pittsburg, PA). Care was taken by sampling personnel to minimize the generation of air currents during the sampling procedure. Following sampling, each reference coupon was immediately removed from the chamber drawer with sterile tweezers and placed into the same 50-mL conical as the swab tip and sealed with a cap. The co-located test coupon was then sampled as described in the following paragraph. The reference-test coupon pairs were sampled in this manner row by row. To expose each new row for sampling, the drawer was incrementally withdrawn from the chamber and the moveable baffle positioned on the new row. Wipe and vacuum sampling methods were used to sample the test coupons in this test series. Rayon-polyester blend, 10x10-cm wipes (Kendall Versalon All Purpose Sponges, No. 804, www.kendall-ltp.com/Kendall-LTP) were pre-wetted with 1mL sterile distilled water prior to use. The coupon surface was thoroughly wiped by using several vertical strokes, then folding the exposed side of the pad inward, and making several horizontal strokes over the same area with the other side of the wipe. Following sampling, the folded pad was placed in a 50-mL sterile conical tube containing 30 mL BBT solution and sealed with a cap.
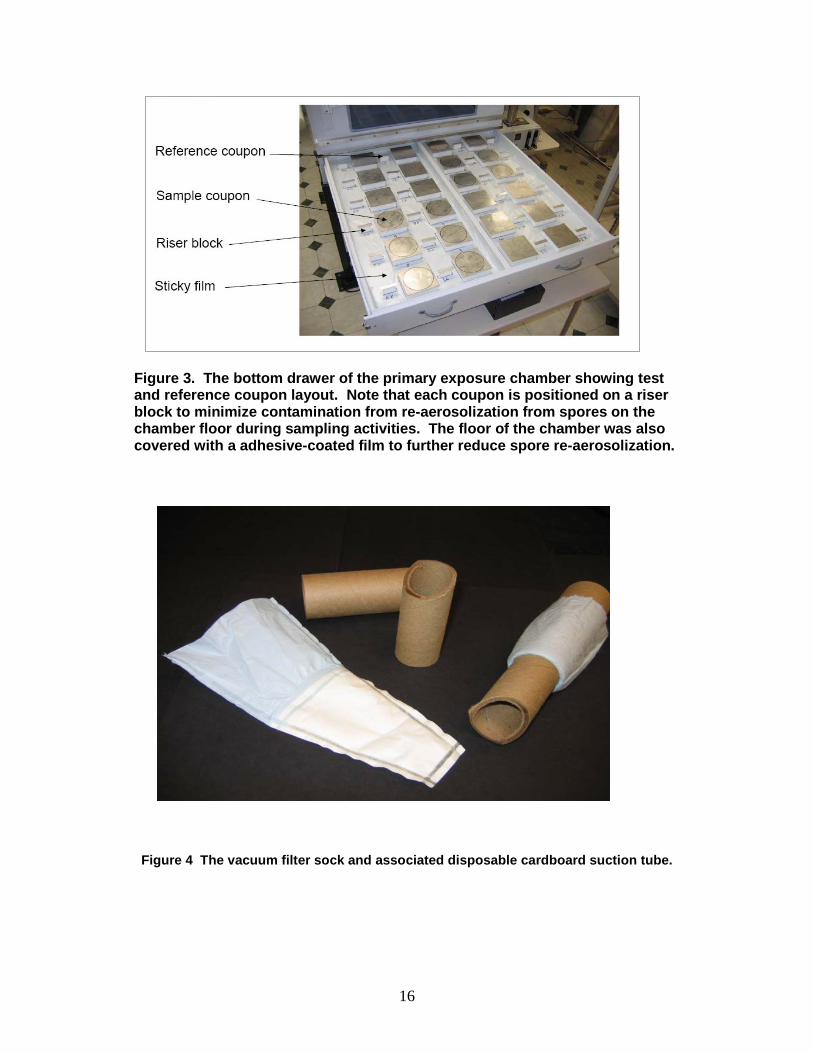
Vacuum filter sock collection material used in this study was a polyethylene filter medium with an approximate 72-cm2 filter surface area (Midwest Filtration Company, Catalog No. FAB-07-03006PS, Cincinnati, OH) with a manufacturer-specified particle retention efficiency of 97% for 1 micrometer latex spheres and 80% for 0.3 micrometer dioctyl phthalate aerosol at 10 L min-1 (an equivalent linear face velocity of 2.3 cm s-1). Air movement through the filter sock and accompanying cardboard holder tube, shown in Figure 4, was provided by a portable AC-powered system with HEPA-equipped exhaust (Atrix International, Part No. VACOMEGACT, Burnsville, MN). The blower produced a nominal 15 L min-1 flow rate with filter sock in place. Using sterile procedures, the single-use filter sock/cardboard tube assembly was moved slowly over the test coupon, first back and forth at a few cm distance and then finally touching the surface of the coupon.
Following sampling, the lower edge of the filter sock was cut close to the seam while suspended above a 50-mL conical containing the BBT solution. The sock was then submerged into the BBT solution to wet the bottom 3 cm of the sock. Two 3-cm vertical cuts were then made, followed by

15
a horizontal cut which allowed this bottom 3-cm section to drop into the conical. This process was repeated at 3 cm intervals until all collection surfaces of the sock were cut and submerged into the BBT solution. Following reference and test coupon sample collection, spores were extracted from the sampling media into the BBT solution by sonication (VWR Model 250T Ultrasonic Bath, Tempe, AZ) for 15 min at sweeping frequencies between 38.5 and 40.5 kHz and an average power setting of 180W. The extraction suspension was then heat treated at 65 °C for 60 min to kill any bacterial vegetative and fungal cells and to activate the Bacillus spores for rapid germination 9,20,25. The suspension was subsequently vortexed for 15 s followed by the preparation of five log-serial dilutions (10-1 to 10-5) in sterile de-ionized water. A 1.0-mL aliquot of the undiluted suspension and each of the serial dilutions was applied to Petrifilm® Aerobic Plate Count Media (3M Microbiology Products, St Paul, MN) in triplicate. The plates were incubated at 37 °C for 48 h and then counted using an automated plate reader (3M Petrifilm Plate Reader, Model 6499, www.3m.com/product/information/Petrifilm-Plate-Reader). Plate counts were exported to a spreadsheet for further data analysis.
Figure 2 Diagram of primary chamber floor showing layout of grime-coated, clean and reference coupons for a typical test.
Grime-coatedCoupon
Co-locatedReferenceCoupon
CleanCoupon
16
Figure 3. The bottom drawer of the primary exposure chamber showing test and reference coupon layout. Note that each coupon is positioned on a riser block to minimize contamination from re-aerosolization from spores on the chamber floor during sampling activities. The floor of the chamber was also covered with a adhesive-coated film to further reduce spore re-aerosolization.
Figure 4 The vacuum filter sock and associated disposable cardboard suction tube.

17
3.7 Recovery Efficiency Calculations Recovery efficiency was calculated as the number of CFU per unit area counted from the wipe, swab or vacuum sock relative to the CFU count per unit area from the co-located reference coupon. Mean recovery efficiency was calculated using the following equation:
where ηr is the mean recovery, Si is the average count per coupon area from three replicate platings, Ri is the average reference count per area from three replicate platings, and n is the total number of test-reference coupon pairs in the test. Standard deviation, standard error and confidence intervals were calculated using standard statistical methods and assuming normally distributed data.
4. RESULTS AND DISCUSSION 4.1 Grime Formulation
As a part of this study, the characteristics of urban grime were assessed in the literature both in terms of composition and loading levels 1,6,11,14,15. Primary constituents of urban aerosol include crustal material, combustion aerosol, soot and semi-volatile carbon species from vehicles and other combustion sources, marine sea salt aerosol (in coastal cities) and other location-dependant point or area sources (e.g. fireplace and industrial emissions). Considerable variability is noted in the literature with regard to the composition of surface grimes and films 14,15. The results from a number of studies that examined the composition of pollution films on outdoor glass surfaces in an urban environment were used as a guideline to define the relative contribution of major urban pollution sources (crustal, vehicular/combustion, and biological) for this particular study. Lam et.al. reported the composition of window film as 94% inorganic compounds with the remainder 5% reported as organic carbon13. Organic carbon was further differentiated as 35% aliphatic hydrocarbons, 20% aromatic hydrocarbons, 10% carbonyls and 5% carbohydrates. The grime weight composition selected for use in this study was similar, with road dust at 94%, combustion emission particles (organic carbon) at 3% and biological material at 3%. Outdoor surface grime loading data reported in the literature are limited and those available vary considerably with many influential factors being reported 1,6,11,14,16-18,22 . The composition of deposited particles is dissimilar from that of airborne urban aerosols and deposition density is influenced by the surface orientation and degree of weather exposure. Reported grime loading levels range from below 0.1 to in excess of 30 g m-2. For this study a loading level of 3g m-2 was targeted which was toward the upper end of the range encountered in the literature. Most of the grime loading levels reported in the literature are from vertical glass surfaces. Higher loading levels are expected on horizontal surfaces based on the influence of aerosol gravitational settling. Throughout the entire test series the mean coupon loading level was 3.00 g m-2 with an accompanying 95-percent confidence interval for all coated coupons of 2.69 to 3.31.

18
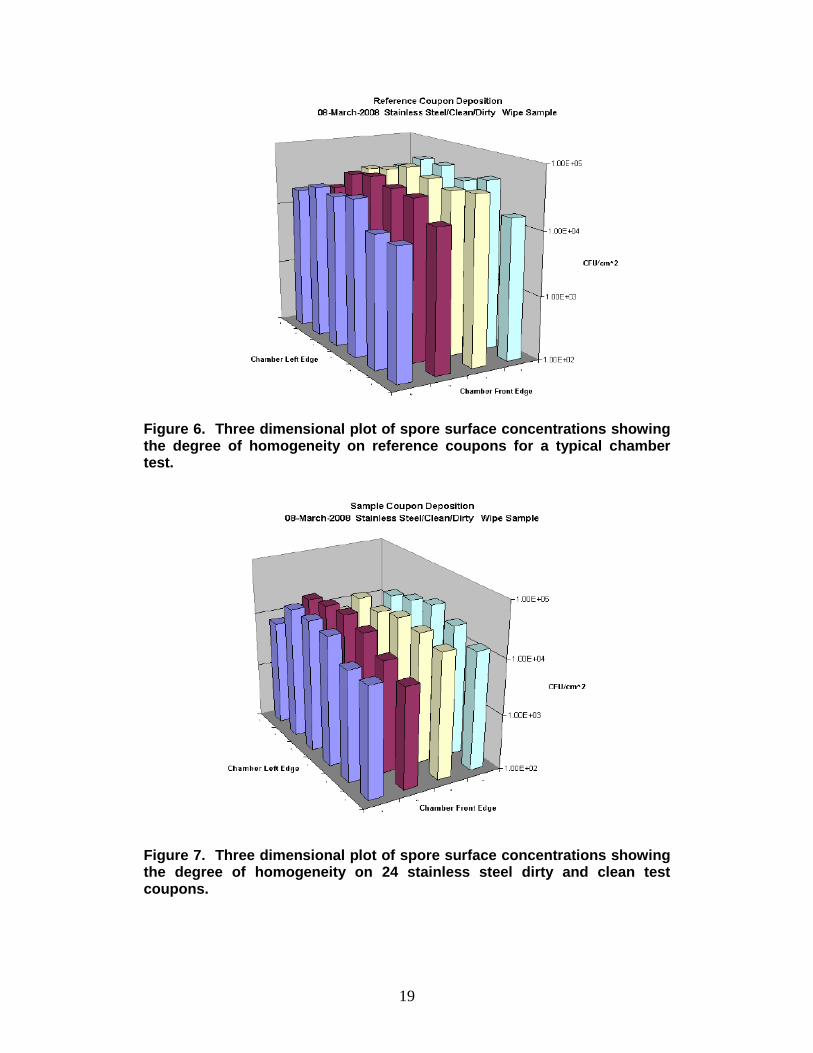
4.2 Spore Distribution in Chamber A scatter plot of airborne particle concentration within the chamber just prior to the start of the 24-hour quiescent settling period versus the average reference coupon spore loading as determined through sampling for nearly all chamber tests is shown in Figure 5. As expected, a direct correlation is observed between airborne particle concentration and deposited spores, although considerable variability is observed in the data. The aerosol released into the chamber is composed of unwashed spores along with fumed silica particles. Both are counted with the real-time particle spectrometer, so a direct correlation between instrument particle counts and deposited spores is not possible. Three dimensional plots of typical spatial distribution of spore concentrations over the coupons within the chamber are shown in Figures 6 and 7 for reference and clean/dirty test coupons. These data reveal a relatively homogeneous distribution of spores over the coupons. Statistical analysis of spore surface concentration values from 24 reference or 24 clean/dirty test coupons are summarized for a typical chamber test in Figures 8 and 9. In the reference case shown, mean spore concentration from 24 reference coupons was 3.3x10⁴ CFU/cm2 with a 95-percent confidence interval of 2.8 – 3.9x10⁴. For the test coupon case shown, the mean spore concentration was 1.9x10⁴ with a 95-percent confidence interval of 1.5 – 2.2x10⁴ CFU/cm2.
Figure 5 Scatter plot showing particle counter reading at start of chamber experiment just prior to the 24-hour gravitational settling period versus average reference coupon spore density determined by sampling.
19
Figure 6. Three dimensional plot of spore surface concentrations showing the degree of homogeneity on reference coupons for a typical chamber test.
Figure 7. Three dimensional plot of spore surface concentrations showing the degree of homogeneity on 24 stainless steel dirty and clean test coupons.
20
Figure 8 Histogram from a typical chamber experiment showing the variation in reference coupon spore deposition density over the 24 coupons in the chamber.
Figure 9 Histogram from a typical chamber experiment showing the variation in dirty/clean test coupon spore deposition density over the 24 coupons in the chamber.
0
1
2
3
4
5
6
10,000 15,000 20,000 25,000 30,000 35,000 40,000 45,000 50,000 55,000
Freq
uenc
y
Reference Coupon Spore Concentration, CFU/cm2
Normal Fit(Mean=33321.5, SD=12588.7)
0123456789
10
0 5,000 10,000 15,000 20,000 25,000 30,000 35,000
Freq
uenc
y
Test Coupon Spore Concentration, CFU/cm2
Normal Fit(Mean=18724.7, SD=7609.4)
21
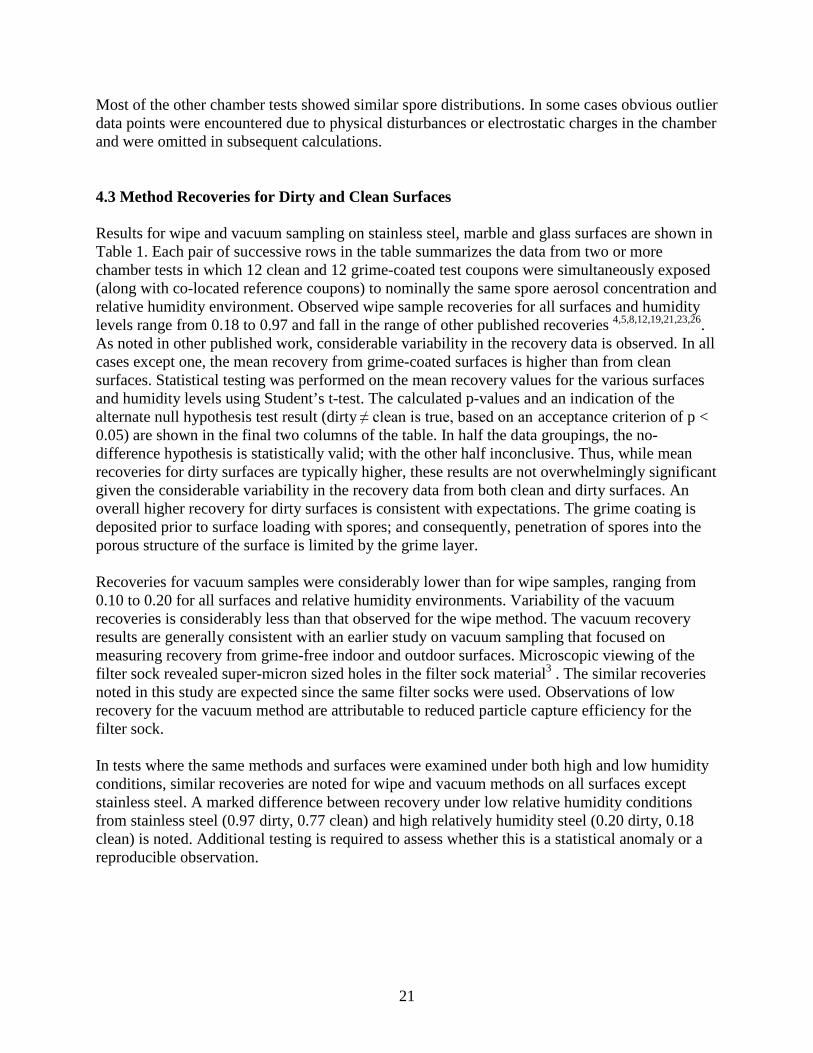
Most of the other chamber tests showed similar spore distributions. In some cases obvious outlier data points were encountered due to physical disturbances or electrostatic charges in the chamber and were omitted in subsequent calculations. 4.3 Method Recoveries for Dirty and Clean Surfaces Results for wipe and vacuum sampling on stainless steel, marble and glass surfaces are shown in Table 1. Each pair of successive rows in the table summarizes the data from two or more chamber tests in which 12 clean and 12 grime-coated test coupons were simultaneously exposed (along with co-located reference coupons) to nominally the same spore aerosol concentration and relative humidity environment. Observed wipe sample recoveries for all surfaces and humidity levels range from 0.18 to 0.97 and fall in the range of other published recoveries 4,5,8,12,19,21,23,26. As noted in other published work, considerable variability in the recovery data is observed. In all cases except one, the mean recovery from grime-coated surfaces is higher than from clean surfaces. Statistical testing was performed on the mean recovery values for the various surfaces and humidity levels using Student’s t-test. The calculated p-values and an indication of the alternate null hypothesis test result (dirty ≠ clean is true, based on an acceptance criterion of p < 0.05) are shown in the final two columns of the table. In half the data groupings, the no-difference hypothesis is statistically valid; with the other half inconclusive. Thus, while mean recoveries for dirty surfaces are typically higher, these results are not overwhelmingly significant given the considerable variability in the recovery data from both clean and dirty surfaces. An overall higher recovery for dirty surfaces is consistent with expectations. The grime coating is deposited prior to surface loading with spores; and consequently, penetration of spores into the porous structure of the surface is limited by the grime layer. Recoveries for vacuum samples were considerably lower than for wipe samples, ranging from 0.10 to 0.20 for all surfaces and relative humidity environments. Variability of the vacuum recoveries is considerably less than that observed for the wipe method. The vacuum recovery results are generally consistent with an earlier study on vacuum sampling that focused on measuring recovery from grime-free indoor and outdoor surfaces. Microscopic viewing of the filter sock revealed super-micron sized holes in the filter sock material3 . The similar recoveries noted in this study are expected since the same filter socks were used. Observations of low recovery for the vacuum method are attributable to reduced particle capture efficiency for the filter sock. In tests where the same methods and surfaces were examined under both high and low humidity conditions, similar recoveries are noted for wipe and vacuum methods on all surfaces except stainless steel. A marked difference between recovery under low relative humidity conditions from stainless steel (0.97 dirty, 0.77 clean) and high relatively humidity steel (0.20 dirty, 0.18 clean) is noted. Additional testing is required to assess whether this is a statistical anomaly or a reproducible observation.

22
Table 1 Summary of Wipe and Vacuum Sampling Recoveries and Statistical Analyses for Clean and Grime-coated Stainless Steel, Marble and Concrete Coupons
Sample
Description
n
Mean
Recovery
95% CI
SE
SD
P
Dirty≠Clean Significant?
Stainless Steel, Wipe, Low RH† Dirty 36 0.968 0.872 – 1.065 0.047 0.285
0.026 Yes Clean 34 0.797 0.676 – 0.917 0.059 0.344
Stainless Steel, Wipe, High RH Dirty 28 0.198 0.146 – 0.249 0.025 0.133
0.621 No Clean 31 0.180 0.126 – 0.233 0.026 0.145
Glass, Wipe, High RH Dirty 24 0.547 0.367 – 0.727 0.087 0.426
0.043 Yes Clean 24 0.333 0.219 – 0.447 0.055 0.270
Marble, Wipe, Low RH Dirty 58 0.595 0.481 – 0.709 0.057 0.434
0.116 No Clean 60 0.482 0.393 – 0.570 0.044 0.342
Marble, Wipe, High RH Dirty 59 0.685 0.514 – 0.855 0.085 0.656
0.010 Yes Clean 60 0.436 0.354 – 0.518 0.041 0.318
Marble, Vacuum, Mid RH Dirty 33 0.100 0.056 – 0.144 0.021 0.123
0.583 No Clean 36 0.119 0.067 – 0.171 0.056 0.154
Marble, Vacuum, High RH Dirty 36 0.170 0.142 – 0.199 0.014 0.085
0.009 Yes Clean 35 0.121 0.067 – 0.171 0.012 0.069
Concrete, Vacuum, High RH Dirty 59 0.197 0.170 – 0.225 0.014 0.104
0.064 No Clean 58 0.165 0.144 – 0.187 0.011 0.082
†Relative humidity ranges were as follows: Low RH 15-35%; Mid RH 35-65%; High RH 65-90%. Note: Outlier data values in excess of 3x the inter-quartile range of each dirty or clean data set were excluded from further statistical analyses.
4.4 Potential background biological effects from grime components As a result of the handling constraints associated with the USDA-regulated Bermuda grass spores, the grime mixture that included the biological component was used in only a limited number of tests. The effects of inclusion or exclusion of biological component in the grime mixture on the overall method performance was not formally examined in this study; however, the extracted material from the sampling media was heat shocked to kill any live organisms in the biological mixture which would eliminate the potential false positives from vegetative organisms. The potential of the road dust component of the grime material to contribute background spore counts was investigated by plating and counting a control sample of bulk road dust. A known mass of road dust was mixed into a 50 mL conical containing 30 mL of PBS. Following vortex

23
and sonication steps, the sample was split. Half was heat shocked for 48 h at 37 deg C and the other half was not heat shocked. Replicate dilution plates were then prepared from both splits on the same Petrifilm media used for the coupon tests. Average counts from six replicates for the no-heat-shock sample was 20,800 CFU g-1, and the average count for the heat-shocked samples was 970 CFU g-1. Approximately 30 mg of road dust was applied to each test coupon, which translates to about 27 background spores per coupon from road dust. Typical spore loading during the chamber tests was on the order of 5 x10 5 CFU/per coupon. Thus the contribution of post-heat shock background spores to the grime-coated test coupons is insignificant at the test spore loading levels used in this study. Background spore contribution from grime constituents could play a more important role if sampling is being done near the method detection limit which for the wipe method is on the order of 10-20 spores per 100 cm2 coupon and higher for the vacuum method. Furthermore, the degree of variability of background spore concentration in the various grime constituents would be an influential factor. Bacteria and spore content are expected to vary widely based on the composition of the grime and its geographic locale. The DNA material from background biological content could potentially impact the sensitivity of polymerase chain reaction (PCR) analyses via inhibition reactions. Collaborative studies by Lawrence Livermore National Laboratory focused on the quantitative impacts of this grime recipe, both with and without added biologicals, on the PCR process. Results from these studies indicate that no inhibition occurs in PCR methods for B. anthracis Sterne and B. atrophaeus at low (10-20 spores per sample) levels with grime loadings up to 0.5 g13. This amount of grime per sample is significantly higher than loadings observed in field studies. 4.5 Extended spore-coupon exposure intervals Spore-loaded coupons on both grime-coated and clean surfaces were held in the chamber under high humidity conditions for 7 and 14 days prior to sampling in order to investigate the possibility of spore activation under these prolonged exposure conditions. The limited data from these tests give no evidence of spore germination prior to sampling and enumeration steps. If spore germination were to occur during these extended hold intervals, a low-biased plate count in the enumeration step would result. These limited data suggest that without key nutrients, spore germination on grime-coated surfaces does not occur even in high humidity conditions25 .
5. CONCLUSIONS
Spore recovery tests to assess wipe and vacuum method performance on grime-coated outdoor surfaces reveal that method recoveries are generally better on grime-coated stainless steel, marble, glass and concrete surfaces when compared with clean surfaces under the same test conditions. Statistical testing reveals statistically significant differences in only about half the tests conducted. Relative humidity effects on spore recovery were insignificant on all surfaces except for stainless steel. The large difference in recovery on stainless steel surfaces may be a statistical anomaly. Further testing would be required to confirm this.

24
6. REFERENCES 1. Brimblecombe, P. 1992. A Brief History of Grime Accumulation and Removal of Soot Deposits. Proceedings of the International Conference: Stone Cleaning and the Nature of Soiling and Decay Mechanisms of Stone. Edinburgh, UK, pp 53-62. 2. Brown, G. S., R. G. Betty, J. E. Brockmann, D. A. Lucero, C. A. Souza, K. S. Walsh, R. M. Boucher, M. Tezak, M. C. Wilson, and T. Rudolph. 2007a. Evaluation of a Wipe Surface Sample Method for Collection of Bacillus Spores from Nonporous Surfaces. Applied and Environmental Microbiology 73:706-710. 3. Brown, G. S., Rita G. Betty, John E. Brockmann, Daniel A. Lucero, Caroline A. Souza, Kathryn S. Walsh, Raymond M. Boucher, Matthew S. Tezak, and M. C. Wilson. 2007c. Evaluation of Vacuum Filter Sock Surface Sample Collection Method for Bacillus Spores from Porous and Non-porous Surfaces. Journal of Environmental Monitoring 9:666-671.
4. Buttner, M. P., P. Cruz, L. D. Stetzenbach, A. K. Klima-Comba, V. L. Stevens, and T. D. Cronin. 2004a. Determination of the Efficacy of Two Building Decontamination Strategies by Surface Sampling with Culture and Quantitative PCR Analysis. Applied and Environmental Microbiology 70:4740-4747. 5. Buttner, M. P., P. Cruz-Perez, and L. D. Stetzenbach. 2001. Enhanced Detection of Surface-Associated Bacteria in Indoor Environments by Quantitative PCR. Applied and Environmental Microbiology 67:2564-2570. 6. Diamond, M. L., S. E. Gingrich, K. Fertuck, B. E. Mccarry, G. A. Stern, B. Billeck, B. Grift, D. Brooker and T. D. Yager. 2000. Evidence for Organic Film on an Impervious Urban Surface: Characterization and Potential Teratogenic Effects. Environmental Science and Technology 34: 2900-2908.
7. Edmonds, J. M., P. J. Collett, E. R. Valdes, E. W. Skowronski, G. J. Pellar, and P. A. Emanuel. 2009. Surface Sampling of Spores in Dry-Deposition Aerosols. Applied and Environmental Microbiology 75:39-44. 8. Estill, C. F., P. A. Baron, J. K. Beard, M. J. Hein, L. D. Larsen, L. Rose, F. W. Schaefer III, J. Noble-Wang, L. Hodges, H. D. A. Lindquist, G. J. Deye, and M. J. Arduino. 2009. Recovery Efficiency and Limit of Detection of Aerosolized Bacillus anthracis Sterne from Environmental Surface Samples. Applied and Environmental Microbiology 75:4297-4306.
9. Foerster, H. F., and J. W. Foerster. 1966. Response of Bacillus spores to combinations of germinative compounds. J. Bacteriol. 91:1168–1177. 10. Frawley, D. A., M. N. Samaan, R. L. Bull, J. M. Robertson, A. J. Mateczun, and P. C. B. Turnbull. 2008. Recovery Efficiencies of Anthrax Spores and Ricin from Nonporous or Nonabsorbent and Porous or Absorbent Surfaces by a Variety of Sampling Methods. Journal of Forensic Sciences 53:1102-1107.

25
11. Gingrich, S. E., M. L. Diamond, G. A. Stern, and B. E. McCarry. 2001. Atmospherically Derived Organic Surface Films along an Urban-Rural Gradient. Environmental Science and Technology 35: 4031-4037. 12. Hodges, L. R., L. J. Rose, A. Peterson, J. Noble-Wang, and M. J. Arduino. 2006. Evaluation of a Macrofoam Swab Protocol for the Recovery of Bacillus anthracis Spores from a Steel Surface. Applied and Environmental Microbiology 72:4429-30. 13. Kane, S., G. Murphy, and S. Létant. 2009. Demonstration of High Throughput Sample Processing and Analysis of Outdoor Environmental Media: Rapid Viability (RV) PCR Protocols - Final Report. August 13. LLNL-TR-416059. 13. Lam, B., M. L. Diamond, A. J. Simpson, P. A. Makar, J. Truong, N. A. Hernandez-Martinez. 2005. Chemical composition of surface films on glass windows and implications for atmospheric chemistry. Atmospheric Environment 39: 6578–6586. 14. Liu, Q., R. Chen, B. E. McCarry, M. L .Diamond, and B. Bahavar. 2003. Characterization of Polar Organic Compounds in the Organic Film on Indoor and Outdoor Glass Windows. Environmental Science and Technology 37: 2340-2349. 15. Lombardo, T., T., A. Ionescub, R.A. Lefe`vre, A. Chabas, P. Ausset, H. Cachier. 2005.Soiling of silica-soda-lime float glass in urban environment: measurements and modeling. Atmospheric Environment 39: 989–997. 16. Matthias-Maser, S., M. Kramer, J. Brinkmann, W. Schneider. 1997. A Contribution of Primary Biological Aerosol Particles as Insoluble Component to the Atmospheric Aerosol over the South Atlantic Ocean.1997. Journal of Aerosol Science 28: S3-S4. 17. Mølhave, L., T. Schneider, S. K. Kjaergaard, L. Larsen, S. Nord, O. Jorgensen. 2000. House Dust in Seven Danish Offices. Atmospheric Environment 34: 4767-4779. 18. Nellen, J., P. Rettberg, G. Horneck, and W. R. Streit. 2006. Planetary Protection - Approaching Uncultivable Microorganisms. Advances in Space Research 38:1266-1270. 19. Preston, R. A., and H. A. Douthit. 1984. Stimulation of germination of unactivated Bacillus cereus spores by ammonia. J. Gen. Microbiol. 130:1041– 1050. 20. Price, P. N., M. D. Sohn, K. S. H. Lacommare, and J. A. McWilliams. 2009. Framework for Evaluating Anthrax Risk in Buildings. Environmental Science and Technology 43:1783-1787. 21. Raynor, G. S., L. A. Cohen, J. V. Hayes and E. C. Ogden. 1966. Dyed Pollen Grains and Spores as Tracers in Dispersion and Deposition Studies. Journal of Applied Meteorology 5: 728-737.

26
22. Rose, L., B. Jensen, A. Peterson, S. N. Banerjee, and M. J. Arduino. 2004. Swab Materials and Bacillus anthracis Spore Recovery from Nonporous Surfaces. Emerging Infectious Diseases 10:1023-1029. 23. Setlow, P. 2003. Spore Germination. Current Opinion in Microbiology 6:550–556. 24. Turnbull, P. C. B., D. A. Frawley, and R. L. Bull. 2007. Heat Activation/Shock Temperatures for Bacillus anthracis Spores and the Issue of Spore Plate Counts Versus True Numbers of Spores. Journal of Microbiological Methods 68:353-357. 25. Valentine, N. B., M. G. Butcher, Y. F. Su, K. H. Jarman, M. Matzke, B. J. Webb-Robertson, E. A. Panisko, B. A. B. Seiders, and K. L. Wahl. 2008. Evaluation of Sampling Tools for Environmental Sampling of Bacterial Endospores from Porous and Nonporous Surfaces. Journal of Applied Microbiology 105:1107-1113.
27
.
NOMENCLATURE APS Aerodynamic Particle Sizer BBT Butterfield Buffer Solution CFU Colony forming units DOE US Department of Energy HEPA High-efficiency particulate air IBRD Inter-agency Biological Restoration Demonstration PCR Polymerase Chain Reaction RE Recovery efficiency RH Relative humidity SNL Sandia National Laboratories USDA US Department of Agriculture

28
DISTRIBUTION 1 MS0899 Technical Library 9536 (electronic copy)

29
