evaluation of solid sorbents as a retrofit … library/research/coal...evaluation of solid sorbents...
TRANSCRIPT

© 2016 ADA-ES, Inc., An Advanced Emissions Solutions, Inc. CompanyAll rights reserved.
Evaluation of Solid Sorbents as a Retrofit Technology for CO2 Capture
March 30, 2016, Rev June 15, 2016
Cooperative AgreementAward No. DEFE0004343
© 2016 ADA-ES, Inc. All rights reserved. ‐2‐
Project Review
Overview of Project and Technology
Project Execution
Review of Project Objectives and Achievement
Conclusions

© 2016 ADA-ES, Inc. All rights reserved. ‐3‐
Project Objective and Goals
► The overall objective was to validate solid sorbent-based post combustion CO2 capture through pilot testing
► Project Goals:• Achieve 90% CO2 Capture • Reduce costs of carbon capture
Progress towards <35% LCOE Goal• Generate a high purity CO2 stream• Successfully scale sorbents
Cooperative Agreement (Award No. DEFE0004343)American Recovery and Reinvestment Act of 2009Administered by DOE-NETL: Project Manager Bruce Lani

© 2016 ADA-ES, Inc. All rights reserved. ‐4‐
Project Participants • DOE – NETL
o Project Sponsor• ADA-ES, Inc.
o Project Managemento Developed Process Concepto Sorbent Evaluation & Selectiono Process Validation Testingo Techno-Economic Assessmento Primary Cost Share
• Technip Stone and Webster Process Technology
o Detailed Engineering Services• Stantec Consulting, Ltd.
o Cost Analysis, Plant Integration• McAbee Construction
o Pilot Fab and Installation
• EPRIo Technical Advisoro Cost Shareo Independent Performance
Evaluation and Techno-Economic Assessment
• Southern Companyo Host Site, Cost Share
• Luminanto Cost Share
• Southern Research Instituteo Operations personnel
• Element 1 Engineeringo Operations Personnel
• URSo Operations Personnel
• National Carbon Capture Centero CEMS

© 2016 ADA-ES, Inc. All rights reserved. ‐5‐
Project TeamDOE-NETL
Project ManagerBruce Lani
Program ManagerSharon Sjostrom
Project Eng. Mgr.Jayson Denney
Pilot OperationsADA & Multiple
Contractors
Pilot and Process Design
Technip
Process Modeling, Conceptual Design, & Economic AssessmentStantec Consulting
Module Fabrication & Onsite Erector
McAbee ConstructionSorbent BN
Manufacture
Technical AdvisorsIndustry Participants(Southern Company,
Luminant, etc…)
Host SiteProject Manager
Curtis Smith

© 2016 ADA-ES, Inc. All rights reserved. ‐6‐
Overview of ADAsorb Process
TSA Process (40°C 120°C)Sorbent: Amine-based ion-exchange polymer
Sorbent BN Isotherms

© 2016 ADA-ES, Inc. All rights reserved. ‐7‐
Principal Flue gas passes
through Adsorber module where sorbent particle adsorbs CO2
Regenerable solid sorbent cycles between Adsorber and Regenerator. Raising the temperature of the of the sorbent releases CO2
Flue Gas
Flue Gas Preparation
CO2Adsorber
Baghouse
Regenerator
Baghouse CO2Compression
CO2StorageFlue Gas
CO2
Solid Sorbent Heat Exchanger
Process Blower
Process Conceptual Design
Non-CO2 Flue GasCO2
Sorbent

© 2016 ADA-ES, Inc. All rights reserved. ‐8‐
Advantages
► Heat transfer
- Isothermal operation
► Mass transfer favorable
► Proven at the industrial scale
► Approaches counter-current gas/solids contacting
► Process Flexibility
- Can be applied to cycling plant “load following”
ADAsorb™ CO2 Capture Process
Challenges
► Pressure drop
► Solids circulation
► Sorbent attrition
► Water adsorption
► Heat recovery

© 2016 ADA-ES, Inc. All rights reserved. ‐9‐
Project Tasks and Timeline Overview
• Sorbent Selection• 500 MW Conceptual
Design• Design 1MW Pilot for
Validation Testing
Scale down to 1 MW
• Detailed Engineering• Manufacture Sorbents• Fabricate and Install 1
MW pilot• Commission Pilot
Manufacture and
Construction • Pilot Testing• Refine 500 MW
Design• Conduct Techno-
economic analysis
Demonstration Phase
Period 1:21 months
Period 2:27 months
Period 3:12 months
Oct ‘10 – June ‘12 July ‘12 – Sep ‘14 Oct ‘14 – Sept ‘15

© 2016 ADA-ES, Inc. All rights reserved. ‐10‐
Project Schedule
StartFri 9/10/10
FinishThu 9/30/15
M6 ‐ Substantial Mechanical CompletionFri 1/31/14
M1 ‐ Develop Process Model & Select
SorbentWed 12/22/10
M2 ‐ Review Initial Full‐Scale Design
Thu 5/12/11
M3 ‐ 1 MWnet Pilot Design ‐ Review
MeetingSun 9/11/11
M4 ‐ Submit RFP PackagesThu 11/17/11
BP2 Continuation Application SubmittalFri 1/20/12
Start of Budget Period 2Thu 9/27/12
M5 ‐ Start Site Work for 1 MWnet Pilot
Mon 2/18/13
M7 ‐ Substantial Electrical Completion
Mon 1/20/14
BP3 Continuation Application SubmittalMon 6/30/14
M8 ‐ Demonstrate Pilot Operation
Fri 9/26/14
M9 ‐ Begin Continuous Performance Testing
Mon 9/29/14
Start of Budget Period 3Wed 10/1/14
M10 ‐ Complete Field Testing
Fri 6/26/15
M11 ‐ Complete Techno‐Economic
AssessmentThu 9/30/15

© 2016 ADA-ES, Inc. All rights reserved. ‐11‐
Project Budget
$777,035
$3,084,300
$3,828,823
$12,439,676
$1,214,801 $1,716,852
BP1 Cost ShareBP1 Federal FundsBP2 Cost ShareBP2 Federal FundsBP3 Cost ShareBP3 Federal Funds
BP1
BP2
BP3
Project Total $23.0MCost Share $5.8MFederal Share $17.2M

© 2016 ADA-ES, Inc. All rights reserved. ‐12‐
Project Review
Overview of Project and Technology
Pre-Construction 500 MW Process Concept
Final Sorbent Selection and Characterization
1 MW Pilot Design
Construction (Budget Period 2)
Testing and Performance Review (Budget Period 3)
Review of Project Objectives and Achievement
Conclusions

© 2016 ADA-ES, Inc. All rights reserved. ‐13‐
500MW Design Concept A 500MWnet conceptual power plant incorporating CO2
capture was designed considering: Capital cost Footprint Pressure drop Gas solids contacting Operability (O&M) Constructability

© 2016 ADA-ES, Inc. All rights reserved. ‐14‐
500MW Design: Concept Development
Several reactor designs were considered
Fixed beds – stationary systems with internal heat transfer
Entrained reactors – sorbent simultaneously reacts and is conveyed using
Moving beds – densely packed sorbent moves in the opposite direction as the gas
Trickle down reactor – sorbent with significant mobility flows counter current to gas
Staged fluidized beds – a series of fluidized beds in the bubbling regime
Selected for heat and mass transfer characteristics, and industry experience with large-scale commercial, fluidized-bed systems

© 2016 ADA-ES, Inc. All rights reserved. ‐15‐
500MW Concept – Preliminary TEA TEA by Stantec Consulting
Solid Sorbent concept resulted in lower LCOE than MEA
Largest contributor – capital costs
Case 10 Methodology – Solid-Sorbent CO2
Capture Design
Case 10 - PC Subcritical w/ CO2
Capture (MEA)Gross Power Output kWe 650,900 672,700Total Parasitic Power kWe 147,702 122,740Net Power Output kWe 549,960 549,960BP Turbine kWe 46,761 0Coal Flow Rate lbm/hr 540,263 614,994Thermal Input kWth 1,847,139 2,102,644 CO2 Captured Rate lbm/hr 1,154,200 1,313,960 Regneration Energy Requirement
Btu/lbm CO2 1130* 1,530
Raw Water Cons. 1000 gal/day 6,404 8,081
Capital Cost for CO2 Capture $ 215,761,624 302,505,839LCOE ¢/kWh 14.36 14.77Incremental Increase in LCOE compared to Case 9
% 80 85
© 2016 ADA-ES, Inc. All rights reserved. ‐16‐
Sorbent Selection and Characterization
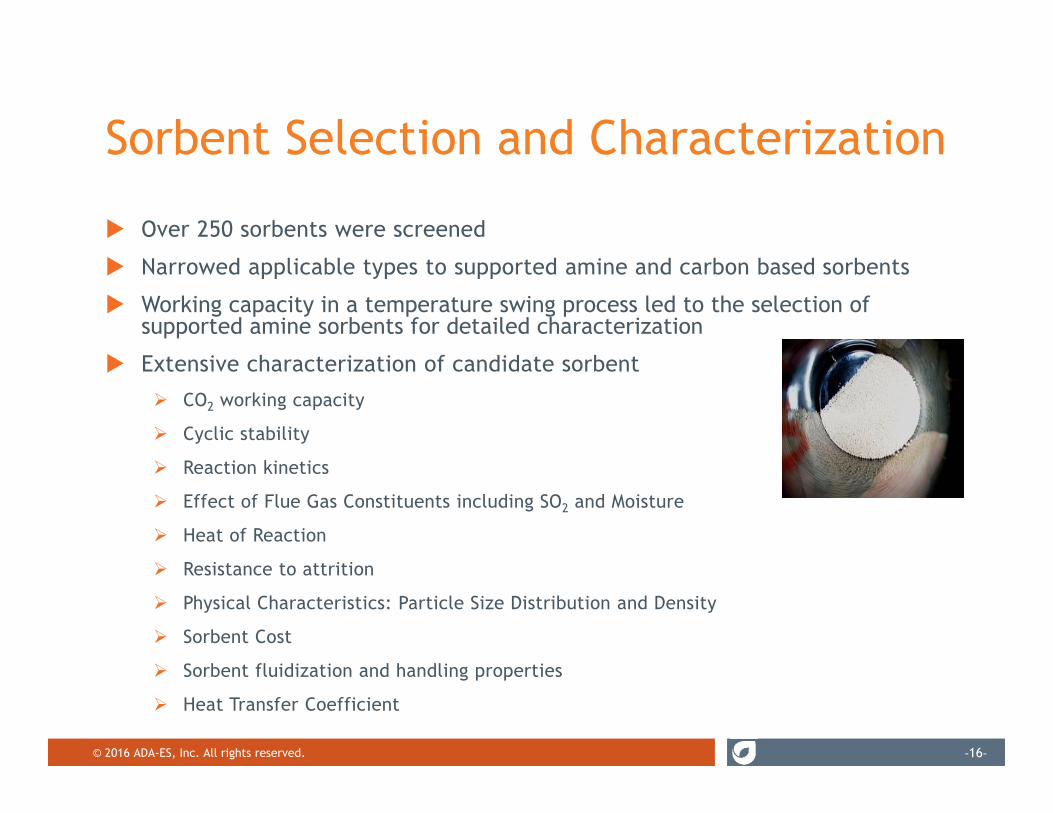
Over 250 sorbents were screened
Narrowed applicable types to supported amine and carbon based sorbents
Working capacity in a temperature swing process led to the selection of supported amine sorbents for detailed characterization
Extensive characterization of candidate sorbent CO2 working capacity
Cyclic stability
Reaction kinetics
Effect of Flue Gas Constituents including SO2 and Moisture
Heat of Reaction
Resistance to attrition
Physical Characteristics: Particle Size Distribution and Density
Sorbent Cost
Sorbent fluidization and handling properties
Heat Transfer Coefficient

© 2016 ADA-ES, Inc. All rights reserved. ‐17‐
Sorbent Selection and Characterization Supported Amines
Pros• Higher CO2 delta loading• Demonstrated performance in high moisture environments
Concerns• Effect of flue gas constituents (SO2 was specifically a concern, similar to aqueous
amine CO2 capture systems)• Some, although not all, supported amines were not cyclically stable• Sorbent cost
Activated Carbons Pros
• Demonstrated performance in high moisture environments – a small decrease in CO2capacity was observed due to moisture, but for many materials the effect was not dramatic
• Not chemically affected by the presence of SO2 and other flue gas contaminants• Consistent cyclic stability• Acceptable sorbent cost
Concerns• CO2 delta loading• Selectivity and CO2 purity

© 2016 ADA-ES, Inc. All rights reserved. ‐18‐
Sorbent Isotherms
Capture
Regen.
CO2 Working Capacity
0
2
4
6
8
10
12
14
0.0 0.2 0.4 0.6 0.8 1.0
CO2
Load
ing
(wt%
)
CO 2 Partial Pressure (bar)
Adsorption Temp (40ºC, 104ºF)
Regeneration Temp (120ºC , 248ºF)

© 2016 ADA-ES, Inc. All rights reserved. ‐19‐
Properties of Sorbent BN
Sorbent BN Modified for Fluidized BedGeldart Classification A/B TransitionSauter Mean Particle Size 158 um90% size Distribution 80 umParticle Sphericity 90 unitlessParticle Density 0.71 g/ccParticle Porosity 0.39 unitlessBulk Density (Fluffed) 0.38 g/ccVoid Fraction (Fluffed) 0.46 FractionBulk Density (Packed) 0.42 g/ccVoid Fraction (Packed) 0.41 Fraction
Minimum Fluidization Velocity 0.86 ft/sParticle Aspect Ratio 0.74 unitlessHeat of reaction 82 kJ/mol CO2
Photo of BN (ion-exchange resin) after larger spherical particles were dried and ground

© 2016 ADA-ES, Inc. All rights reserved. ‐20‐
Cold-Flow Modeling► Cold-flow model was designed and fabricated to
characterize sorbents in system similar to 1 MW pilot ► Fluidization characterization included: Fluid bed density Bubble volume fraction Entrainment rate Heat transfer coefficient Sorbent size distribution Loop seal ratios Fluidization regime (e.g., bubbling, slugging,
fast fluidization, etc.) at different gas velocities Gas velocity required to achieve the desired fluidization regime Quality of fluidization determined both visually, and by means of
high frequency ΔPbed fluctuation measurements
Cold-flow model in ADAProcess Lab

© 2016 ADA-ES, Inc. All rights reserved. ‐21‐
Preliminary Design of 1MW Pilot The pilot was designed based on:
Properties of the fully characterized sorbent Steam properties at host site Water properties at host site Flue gas composition at host site Geographic considerations of host site
► Considerations: Minimize heated sorbent exposure to oxygen Water temperature effect on cooling coil surface area Minimizing exposure to SO2
Adsorber inlet flue gas temperature Modular construction Minimizing cost

© 2016 ADA-ES, Inc. All rights reserved. ‐22‐
1MW Pilot Process

© 2016 ADA-ES, Inc. All rights reserved. ‐23‐
Flue Gas Flow
13723 lbs/hr136 °F14.7 psia
13703 lbs/hr104 °F14.3 psia
12542 lbs/hr104 °F22.0 psia
9972 lbs/hr104 °F14.7 psia

© 2016 ADA-ES, Inc. All rights reserved. ‐24‐
CO2 Flow
1879 lbs/hr190 °F20.6 psia
500 lbs/hr190 °F20.6 psia
2570 lbs/hr190 °F20.6 psia
2319lbs/hr104 °F14.7 psia

© 2016 ADA-ES, Inc. All rights reserved. ‐25‐
Cooling Water Flow
125 gpm81 gpm
60 gpm
553 gpm
327 gpm
327 gpm

© 2016 ADA-ES, Inc. All rights reserved. ‐26‐
Steam and Waste Water Flow
To Sump
Steam In2.0 gpm
0.4 gpm
6.8 gpm
0.5 gpm
3139 lbs/hr

© 2016 ADA-ES, Inc. All rights reserved. ‐27‐
Project Review
Overview of Project and Technology
Pre-Construction (Budget Period 1)
Final Design and Construction Detailed Engineering – 1 MW Pilot
Manufacture Sorbent
Fabricate, Install and Commission Pilot
Testing and Performance Review (Budget Period 3)
Review of Project Objectives and Achievement
Conclusions

© 2016 ADA-ES, Inc. All rights reserved. ‐28‐
Detailed Engineering of 1MW Pilot
► Detailed engineering was conducted by Technip Stone and Webster Process Technology
• Process engineering• Structural engineering• Electrical engineering• Detailed drawings• Equipment specification• 3D modeling• HASOP

© 2016 ADA-ES, Inc. All rights reserved. ‐29‐
Pilot Design Basis
Design BasisFlue Gas Flow Rate 1808 acfm
Gas Velocity in Adsorber 4.2 ft/secSorbent Circulation Rate 31107 lb/hr
% CO2 Captured 90.0% Weight %
CO2 Working Capacity 7.0%gCO2/g Sorbent
H2O Working Capacity 1.0%gH2O/g Sorbent
Water Usage
Scrubber demister pad 15 gpmCooling for scrubber 125 gpmE‐101 84 gpmBottom ADS bed 327 gpmMiddle ADS bed 327 gpmTop ADS bed 553 gpmE‐102 60 gpmE‐103 6 gpm
CO2
Fluidizing 343 acfmTransfer to REG 67 acfmTransfer to ADS 252 acfmTotal used in Process 662 acfmProduct 375 acfmCO2 Removed witin Adsorber 2172 lbs/hr
SteamHigh Pressure 3139 lbs/hr
lb/lb CO2 1.4 lb/lb CO2
Density
Bottom ADS bed 15 lbs/cfMiddle ADS bed 15 lbs/cfTop ADS bed 15 lbs/cfRegenerator 26 lbs/cf
Temp
Bottom ADS bed 104 FMiddle ADS bed 104 FTop ADS bed 104 FRegenerator 248 F
Caustic Scrubber 2 gpm
Adsorber InCO2 13.1 %O2 5.65 %H2O 4.85 %
Adsorber OutCO2 1.58 %O2 6.73 %H2O 0.78 %
Regenerator OutCO2 (dry) 93.4 % (dry)
O2 0.38 %H2O 7.2 %

© 2016 ADA-ES, Inc. All rights reserved. ‐30‐
Gas Sampling Locations
Gas(es) Sampled Frequency of Sampling
Analyzer Location
Used for Mass Balance
CO2,O2, SO2 Continuous Adsorber Inlet Yes
CO2,O2, SO2 Intermittent Fluidized Bed Overhead No
H2O Intermittent Fluidized Bed Overhead Yes
CO2,O2, SO2 Continuous Adsorber Outlet Yes
H2O Intermittent Adsorber Outlet Yes
CO2,O2 Continuous Regenerator Outlet Yes
H2O, O2 Intermittent Regenerator Outlet Yes

© 2016 ADA-ES, Inc. All rights reserved. ‐31‐
Manufacture and Prepare Sorbent► Procured 20,000 lbs of raw sorbent
At this small quantity sorbent could not economically be manufactured to desired particle size
► Particle size Cold flow modeling was used to determine optimal size
distribution Pin milling and screening was used to achieve size
distribution Sorbent needed to be less than 12% moisture for milling
► Drying process Raw sorbent is 44% moisture Multiple drying processes were tested Limited to 120°F in ambient oxygen Low temperature fluidized bed drying was implemented

© 2016 ADA-ES, Inc. All rights reserved. ‐32‐
Fabricate and Install Pilot
► Fabrication and installation was completed by McAbee Construction Modules were fabricated at an offsite
fabrication shop and module yard and transported via barge to the host site
Onsite foundation and utility work began while the modules were being fabricated
Installation and tie in work was completed during the first quarter of 2014

© 2016 ADA-ES, Inc. All rights reserved. ‐33‐
Pilot Commissioning
► All sub systems of the pilot unit were brought online and verified functional.
► Maximum and minimum flows were verified► Heating and cooling capabilities were verified► Measurements and corresponding calculations
were verified► Data logging and display were verified► Sorbent circulation was verified► Process control loops were tuned► HMI control was verified

© 2016 ADA-ES, Inc. All rights reserved. ‐34‐
Project Review
Overview of Project and Technology
Pre-Construction (Budget Period 1) Sorbent, 500 MW Process Concept, 1 MW Pilot Design
Construction (Budget Period 2)
Testing and Performance Review Overview of 2014 testing
Overview of 2015 testing
Review of Project Objectives and Achievement
Conclusions

© 2016 ADA-ES, Inc. All rights reserved. ‐35‐
Overview of Pilot Operating PeriodsDates Comments
Round 1 9/29/14 –11/11/14
Due to pilot balance of plant issues, only 21 days of operation was possible in 2014 of which allperformance data generated was subject to static interference • The data generated was usable to identify trends
and verified that the process and sorbent were behaving as anticipated
• SO2 scrubber demister pad failure resulted in contamination and failure of the flue gas fluidizing blower
• Temperatures below freezing caused pilot shut-down for the winter
Round 2a 4/4/15 –6/6/15
Scrubber and blower repaired, residual grounding issues resolved, minor modifications and minimal fluidization to cyclone dipleg to increase stability
Round 2b 6/6/15 –6/26/15
Relatively stable continuous operating period

© 2016 ADA-ES, Inc. All rights reserved. ‐36‐
Pilot Testing: Evaluated Parameters
► CO2 delta loading► H2O delta loading► Enthalpy of reaction/adsorption► Reaction kinetics
- CO2 uptake limiting factors in the adsorber
- CO2 release limiting factors in the regenerator
► Effective heat transfer coefficients- Cooling water requirements- Steam requirements
► CO2 partial pressure in the regenerator
► Reactor pressure drop► Isothermal operation of the
adsorber and regenerator
► Identify sorbent bed height requirements
► Confirm key fluid bed design parameters:
- Bed density
- Dipleg density
- Riser lift gas requirement
- Standpipe density and aeration gas requirement
► Overall feasibility of using solid sorbent BN for CO2 capture in ADAsorb™ Pocess

© 2016 ADA-ES, Inc. All rights reserved. ‐37‐
Pilot Results: June 6 – June 26, 2015

© 2016 ADA-ES, Inc. All rights reserved. ‐38‐
Pilot performance was limited, primarily due to limits in delta capacity across the adsorber, and sorbent handling issues.
Potential reasons for lower-than-predicted delta CO2 loading across the adsorber:
► Sorbent Stability: Did sorbent degrade in the pilot?
► Sorbent Kinetics: Are sorbent kinetics slower than expected? Is the residence time in the adsorber sufficient?
► Did the sorbent adsorb CO2 in the transport line between the regenerator and adsorber?
► Did insufficient regeneration temperature or elevated adsorption temperature in top bed (gas outlet) affect working capacity?
Review – and Assessment
38

© 2016 ADA-ES, Inc. All rights reserved. ‐39‐
Sorbent Stabilityand
Sorbent Kinetics

© 2016 ADA-ES, Inc. All rights reserved. ‐40‐
TGA Analysis of Sorbent Performance
BN 18: sample from the pilot in December, 2014 BN 17: sample from the pilot in October, 2014 BN 13: as received fresh sample tested in March, 2014 Note: Lab data indicates that the material capacity differs from batch to batch, ±20 %
Results indicate sorbent did not degrade from pilot operations

© 2016 ADA-ES, Inc. All rights reserved. ‐41‐
TGA Results and Kinetic Predictions - Updated
10
10.2
10.4
10.6
10.8
11
11.2
11.4
140 160 180 200 220 240 260
Wei
ght (
mg)
Cycling between 40oC/0.15 bar CO2 and 120oC/0.8 bar CO2
Condition Cycle
Time to 80% Capacity
Equilibrium (minutes)
Time to 90% Capacity
Equilibrium (minutes)
CO2 Loading (g CO2/ 100g
Fresh Sorbent)
Delta Loading (g CO2/ 100g Fresh
Sorbent)Desorption
117.46 22.78 5.22
Adsorption 8.27 10.69 12.14 6.92Desorption
26.26 6.98 4.96
Adsorption 7.30 9.96 12.03 7.07Desorption
35.77 6.74 4.89
Adsorption 8.16 11.30 11.98 7.08
Desorption72
7.08 7.83 5.08Adsorption 8.29 10.77 11.78 6.71Desorption
736.91 7.08 5.06
Adsorption 8.47 10.95 11.77 6.72Desorption
747.10 7.79 5.06
Adsorption 8.75 11.05 11.77 6.72
120°C
40°C
Results suggest less than 15 minutes should be sufficient to achieve desired working capacity

© 2016 ADA-ES, Inc. All rights reserved. ‐42‐
Test Run
Inlet CO2
Conc. (%)Outlet CO2
Conc. (%)Change in Sorbent Loading During Run(wt CO2/sorbent, %)
Sorbent Loading at Outlet of Bed(wt CO2/sorbent, %)
Sorbent Temp. (°C) [(°F)]
1 3.0 1.2 1.6% 1.6% 40 [105]2 4.5 3.0 1.3% 2.9% 47 [117]3 5.5 4.5 0.9% 3.8% 43 [109]4 6.7 5.6 1.0% 4.8% 45 [113]5 7.2 6.6 0.5% 5.3% 41 [106]6 8.1 7.4 0.6% 5.9% 37 [99]7 8.6 8.1 0.4% 6.4% 37 [99]
*Heating and CO2 Treatment of Sorbent Overnight8* 12.5 9.5 2.6% NA 37 [99]9 9.2 8.6 0.5% NA 42 [107]10 10.3 9.0 1.1% NA 42 [107]
Laboratory Counter-Current Reactor Test
SORBENT DISTRIBUTION SCREENS
FEEDER HOPPER
FEEDERCRUBBED AS OUT
TEMP 5
TEMP 3
TEMP 1
GAS ANALYZER
SORBENT COLLECTION
Gas In1.68 m/s (5.5 ft/sec)
Gas Out
~1.9 seconds residence time/run
0.45 kg/min (1 lb/min)
• Tests conducted in “runs” to simulate longer reactor section
• Run 1 = 90% capture outlet conditions (low CO2, regenerated sorbent)
• Run 10 = near inlet conditions (high CO2, loaded sorbent)
Results suggest reaction kinetics are relatively fast

© 2016 ADA-ES, Inc. All rights reserved. ‐43‐
Working Capacityand
Pre-Loading of Sorbent

© 2016 ADA-ES, Inc. All rights reserved. ‐44‐
Impact of Mass Ratio on CO2 Removal
Large variation in data set at given conditions
Delta capacity across adsorberlimited to ~5.4% CO2/sorbent
0%
10%
20%
30%
40%
50%
60%
70%
80%
90%
100%
0 5 10 15 20 25 30 35 40 45 50
CO2Ca
ptured
Weigh
t %
Sorbent Circulation Rate (lbs/hr)/(lbs CO2/hr) into Adsorber
300‐400
400‐500
500‐600
600‐700
700‐800
900‐1000
1000‐1100
1100‐1200
1200‐1300
1300‐1400
1400‐1500
1500‐1600
1600‐1700
1700‐1800
1800‐1900
1900‐2000
1900‐2000
2100‐2200

© 2016 ADA-ES, Inc. All rights reserved. ‐45‐
RESULTS: CO2 Removal Across Adsorber
The model fits the data with a R2 value equal to 77%. At any given adsorber flow rate, an increase in sorbent flow rate produces increased CO2 removal. The most optimal conditions
for CO2 capture exist at low adsorber flow rates and high sorbent flow rates
Representative at 40oC only

© 2016 ADA-ES, Inc. All rights reserved. ‐46‐
Statistical Model Results: Working Capacity
A Pareto chart of the effects determines the magnitude and the importance of an effect. The chart displays the absolute value of the effects and draws a reference line on the chart. Any
effect that extends past this reference line is statistically significant. This shows that the sorbent flow rate has the greatest impact (by an order of magnitude) on working capacity.

© 2016 ADA-ES, Inc. All rights reserved. ‐47‐
Factors influencing removal –Sorbent flow rate
Lower sorbent flow rates correlate to data representing the sorbent capacity limit for the pilot test

© 2016 ADA-ES, Inc. All rights reserved. ‐48‐
Potential Contributors to CO2 Pre-loading
CO
2-ric
h ga
s

© 2016 ADA-ES, Inc. All rights reserved. ‐49‐
Why Use CO2-Rich Carrier Gas?
• CO2 was selected as carrier gas to prevent degradation of sorbent at elevated temperatures
• Carrier gas was not maintained at 120°C• Intermittent measurements indicate conditions in the transport line
between the regenerator and the adsorber were nominally 75°C and 80% to 90% CO2.
• At 75°C and 0.8 bar partial pressure loading is 8.5 g CO2/100 g sorbent, compared to 3.43 g CO2/100 g sorbent at regeneration conditions.
Impact of exposure to oxygen at elevated temperatures on BN performance

© 2016 ADA-ES, Inc. All rights reserved. ‐50‐
Mass Balance Model

© 2016 ADA-ES, Inc. All rights reserved. ‐51‐
Pilot Results Compared to Model
Model appears to represent pilot results fairly well

© 2016 ADA-ES, Inc. All rights reserved. ‐52‐
Sorbent Flow, Working Capacity, and Residence Time
Sorbent capacity limited by sorbent/CO2 ratio, NOTadsorption kinetics

© 2016 ADA-ES, Inc. All rights reserved. ‐53‐
Pilot Design: 2038 lb/hr CO2, Eq. capacity = 0.07 g CO2/g sorb min circulation = 26,202 lb/hr 12.8 ratio Sorbent/CO2
• CO2 in the transport gas limits CO2 removal from flue gas• Three stages are required to achieve 90% CO2
removal at the “lowest” sorbent circulation rate
Ads delta CO2 loading = 1/ sorbent circulation rateincoming CO2 ∗ % removal
Minimum circulation rate =incoming CO2∗ % removalequilibrium delta loading
Modeled CO2 Removal by Stage

© 2016 ADA-ES, Inc. All rights reserved. ‐54‐
Regenerator and Adsorber Temperatures
© 2016 ADA-ES, Inc. All rights reserved. ‐55‐
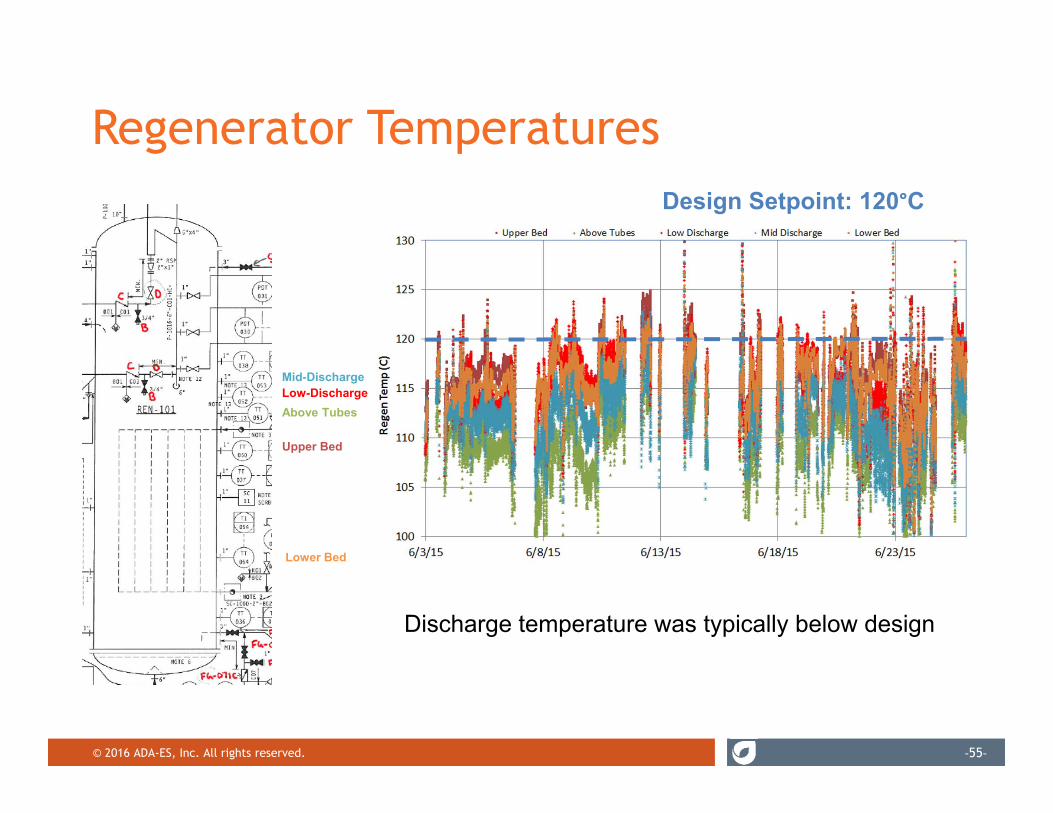
Regenerator Temperatures
Mid-DischargeLow-DischargeAbove Tubes
Upper Bed
Lower Bed
Design Setpoint: 120°C
Discharge temperature was typically below design

© 2016 ADA-ES, Inc. All rights reserved. ‐56‐
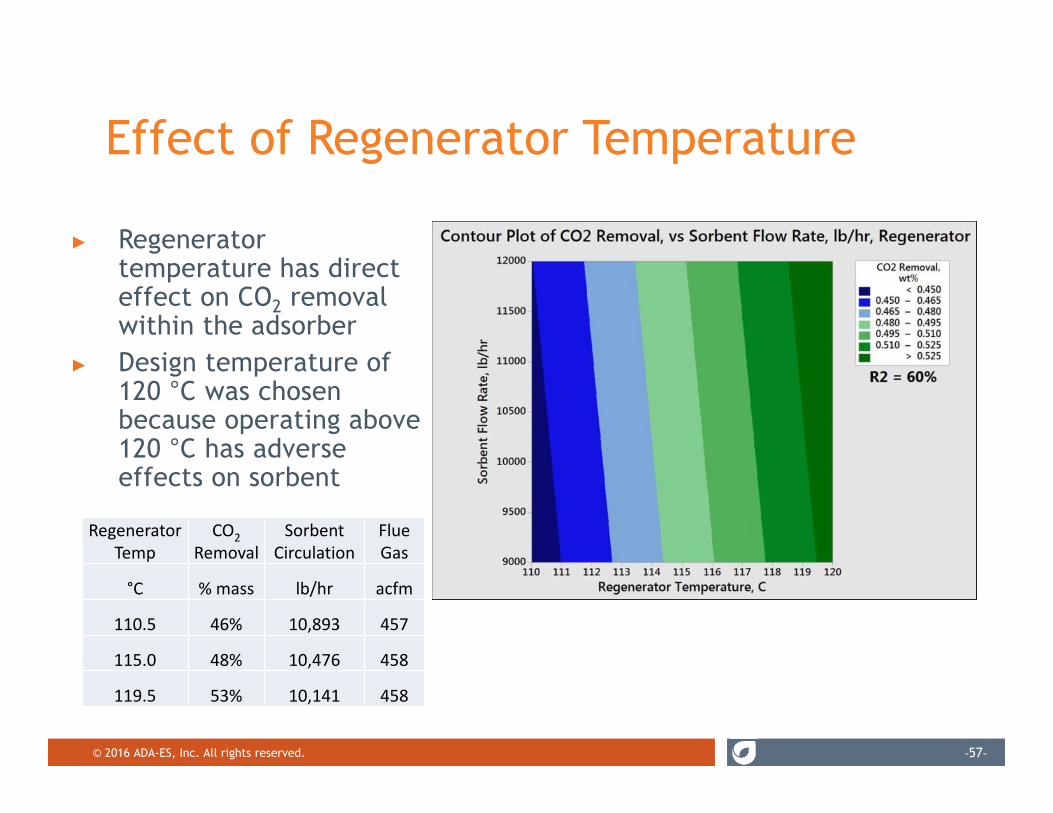
Effect of Regenerator Temperature
► Regenerator temperature has direct effect on CO2 removal within the adsorber
► Design temperature of 120 °C was chosen because operating above 120 °C has adverse effects on sorbent
Regenerator Temp
CO2Removal
Sorbent Circulation
Flue Gas
°C % mass lb/hr acfm
110.5 46% 10,893 457
115.0 48% 10,476 458
119.5 53% 10,141 458
© 2016 ADA-ES, Inc. All rights reserved. ‐57‐
Effect of Regenerator Temperature
► Regenerator temperature has direct effect on CO2 removal within the adsorber
► Design temperature of 120 °C was chosen because operating above 120 °C has adverse effects on sorbent
Regenerator Temp
CO2Removal
Sorbent Circulation
Flue Gas
°C % mass lb/hr acfm
110.5 46% 10,893 457
115.0 48% 10,476 458
119.5 53% 10,141 458

© 2016 ADA-ES, Inc. All rights reserved. ‐58‐
Adsorber Top Bed Temperatures
Temperature at outlet location was typically at design temperature
Design Setpoint: 40°C

© 2016 ADA-ES, Inc. All rights reserved. ‐59‐
The CCSI model predicted an overall removal of CO2 from the process gas stream of 58.07% and an achieved working load of 4.5 g CO2 /100 g sorbent, compared to the design condition of 7 g CO2/100 g sorbent.
► Possible reasons for the poor modeled performance of this process.
1. Predicted non-isothermal behavior of the regenerator due to strong cooling effect as cool sorbents loaded with CO2 were introduced, compounded by endothermic reaction during regeneration. Predicted solid outlet temperature = 104°C.
• ADA added a baffle to the regenerator to reduce impact of sorbent addition.
• Results from testing indicate reduced temperatures, but not as extreme as predicted. Increasing sorbent circulation may increase impact. A cross heat exchanger could mitigate most of this effect.
2. Slow predicted kinetics of adsorption. Note that the CCSI team was not provided with all of the kinetic studies conducted by ADA. The model predicted that the uptake of CO2 appears to be approaching to 85% of the equilibrium loading. This would suggest that the performance of the adsorbercould be improved slightly with faster kinetics or longer residence times, but that improvement might be uneconomical.
Review of CCSI Insights

© 2016 ADA-ES, Inc. All rights reserved. ‐60‐
Effects of Moisture
Moisture Working Capacity► Design basis 1.0%► Measured 0.3% - 0.9%
Design Measured ValuesFlue Gas Flow Rate 1808 1611 779 824 428 415 350 acfmSorbent Circulation Rae 31107 18439 15103 10070 13183 9876 17993 lb/hr
% CO2 Captured 90.0% 13.6% 52.0% 42.0% 94.0% 82.0% 87.0% Weight %
H2O Working Capacity 1.0% 0.53% 0.86% 0.28% 0.27% gH2O/g Sorbent

© 2016 ADA-ES, Inc. All rights reserved. ‐61‐
CO2 Product Purity► Regenerator outlet stream diluted with more oxygen
than expected► Calculated 55% air in leakage, 45% flue gas carry over► If air in leakage is eliminated product would have been
92.4%(dry) based on original value of 89.4%(dry)
► Pipeline typical requirement is 95%(dry)
► Lower than predicted due to lower working capacity
Design Measured ValuesFlue Gas Flow Rate 1808 1611 779 824 428 415 350 acfmSorbent Circulation Rae 31107 18439 15103 10070 13183 9876 17993 lb/hrCO2 Removed witin Adsorber 2172 267 496 439 521 423 390 lbs/hr
Regenerator OutletCO2 (dry) 93.4 89 96.8 85.5 88.8 85.5 89.9 % (dry)
O2 0.38 1.1 3.2 2.3 1.9 2.4 1.1 %H2O 7.2 8.79 10.85 6.56 6.74 %

© 2016 ADA-ES, Inc. All rights reserved. ‐62‐
Environmental Testing: Liquid Discharge► Liquid discharge samples
All condensate locationsAll discharge points Collected bi-weekly from both the regenerator and the adsorber
• Total suspended solids• HEM / “Oil and Grease”
Date
Minimum Recordable
Limit 6/10/2015 6/10/2015 UnitsLocation D‐101 ScrubberArsenic 0.05 ‐ ‐ mg/LBarium 0.005 0.01 0.011 mg/LCadmium 0.005 ‐ ‐ mg/LChromium 0.005 ‐ ‐ mg/LLead 0.02 ‐ ‐ mg/LMercury 0.0002 ‐ ‐ mg/LSelenium 0.02 0.02 ‐ mg/LSilver 0.005 ‐ ‐ mg/LZink 0.01 0.01 ‐ mg/LTotal S. Solids 4 8.8 9 mg/LHEM 6 ‐ ‐ mg/L

© 2016 ADA-ES, Inc. All rights reserved. ‐63‐
Environmental Testing: Sorbent Samples
► Sorbent samplesCollected bi-weekly from both the regenerator and the adsorber
• RCRA 8 Metals• If over RCRA 8 threshold, test TCLP
Date
Minimum Recordable
Limit 10/2/2014 4/8/2015 5/22/2015 5/22/2015 5/26/2015 5/29/2015 6/10/2015 6/10/2015 UnitsLocation ADS ADS ADS REG ADS ADS ADS REGArsenic 5 ‐ ‐ ‐ ‐ ‐ ‐ ‐ ‐ mg/kgBarium 0.5 2.06 ‐ ‐ 0.528 ‐ ‐ 0.046 0.011 mg/kgCadmium 1 ‐ ‐ ‐ ‐ ‐ ‐ ‐ ‐ mg/kgChromium 2.5 ‐ ‐ ‐ ‐ ‐ ‐ 0.005 ‐ mg/kgLead 2.5 ‐ ‐ ‐ ‐ ‐ ‐ ‐ ‐ mg/kgMercury 0.05 ‐ ‐ ‐ ‐ ‐ ‐ ‐ ‐ mg/kgSelenium 2.5 ‐ ‐ ‐ ‐ ‐ ‐ ‐ ‐ mg/kgSilver 2.5 ‐ ‐ ‐ ‐ ‐ ‐ ‐ ‐ mg/kg
© 2016 ADA-ES, Inc. All rights reserved. ‐64‐
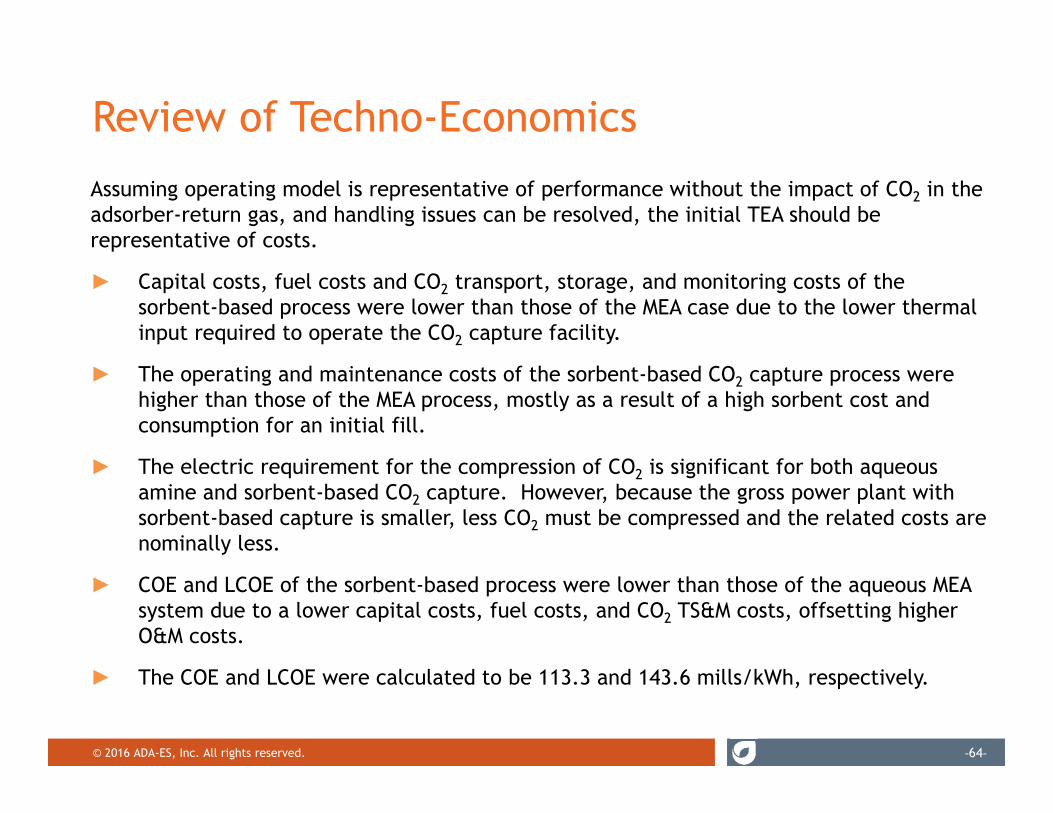
Review of Techno-EconomicsAssuming operating model is representative of performance without the impact of CO2 in the adsorber-return gas, and handling issues can be resolved, the initial TEA should be representative of costs.
► Capital costs, fuel costs and CO2 transport, storage, and monitoring costs of the sorbent-based process were lower than those of the MEA case due to the lower thermal input required to operate the CO2 capture facility.
► The operating and maintenance costs of the sorbent-based CO2 capture process were higher than those of the MEA process, mostly as a result of a high sorbent cost and consumption for an initial fill.
► The electric requirement for the compression of CO2 is significant for both aqueous amine and sorbent-based CO2 capture. However, because the gross power plant with sorbent-based capture is smaller, less CO2 must be compressed and the related costs are nominally less.
► COE and LCOE of the sorbent-based process were lower than those of the aqueous MEA system due to a lower capital costs, fuel costs, and CO2 TS&M costs, offsetting higher O&M costs.
► The COE and LCOE were calculated to be 113.3 and 143.6 mills/kWh, respectively.

© 2016 ADA-ES, Inc. All rights reserved. ‐65‐
Description Unit Econamine1 Econamine2 Sorbent1 Sorbent2 20‐hr Pilot TestBEC as per DOE BEC based on
experienceBEC as per DOE BEC based on
experienceBEC as per DOE
Gross Power Output kWe 672,700 672,700 656,125 656,125 718,738Electrical Output – BP Turbine
kWe 0 0 47,369 47,369 32,525
Auxiliary Load Summary kWe 122,740 122,740 153,534 153,534 201,293
Net Power Output kWe 549,960 549,960 549,960 549,960 549,970Thermal Input kWth 2,102,644 2,102,644 1,865,320 1,865,320 2,383,129Coal Flow Rate lb/hr 614,994 614,995 545,581 545,581 697,032Net Plant HHV Efficiency % 26.2 26.2 29.5 29.5 23.1
Net Plant HHV Heat Rate Btu/kWh 13,046 13,046 11,573 11,573 14,785
CO2 Capture Profile CO2 Produced lb/hr 1,459,838 1,459,838 1,295,067 1,295,067 1,651,831 CO2 Captured lb/hr 1,313,960 1,313,960 1,165,561 1,165,561 1,486,648 CO2 Emission lb/hr 145,878 145,878 129,507 129,507 165,183Circulating Cooling Water Demand†
gpm 540,000 540,000 399,276 399,276 487,120
Raw Water Consumption 1000 gal/D 8,081 8,081 6,460 6,460 7,802
CO2 Capture Facility Regen. Energy Btu/lb CO2 1,530 1,530 1,139 1,139 2,042 Total Energy MMBtu/hr 2,010 2,010 1,328 1,328 3,036 Steam Flow lb/hr 2,219,454 2,219,454 1,429,730 1,429,730 2,709,721 Sorbent Amount lb/hr N/A N/A 16,610,220 16,610,220Capital CostBare Erected Cost $ 1,415,831,000 1,931,818,999 1,294,480,737 1,662,613,151 3,377,994,721Total Plant Cost 2015$ 1,847,389,582 2,613,159,050 1,673,687,989 2,218,697,156 4,724,953,270Total Overnight Cost 2015$ 2,266,414,272 3,204,167,189 2,071,764,559 2,741,840,062 5,991,041,269Total As‐Spent Cost 2015$ 2,583,712,271 3,652,750,595 2,361,811,597 3,125,697,670 6,355,138,125Operating & Maintenance Cost
Initial Cost
Annual Cost
Initial Cost
Annual Cost
Initial Cost
Annual Cost
Initial Cost
Annual Cost
Initial Cost
Annual Cost
Total Fixed Op Costs $M 61.0 81.2 56.8 71.2 141.3
Total Var. Op. Costs $M 3.1 42.8 3.1 51.2 13.0 73.2 13.0 62.9 132.0
Fuel Costs $ 99,798,307 99,798,307 87,671,276 88,534,219 113,110,975CO2 TS&M Costs $ 27,112,268 27,112,268 23,815,777 24,050,194 30,675,509COE contribution (2015$) mills/kWh 125.0 160.3 121.8 143.3 283.9
Capital Costs mills/kWh 68.7 97.0 62.8 83.1 181.4 Fixed Op. Costs mills/kWh 14.9 19.9 13.9 17.4 34.5 Variable Op.
Costsmills/kWh 10.4 12.5 17.8 15.4 32.9
Fuel Costs mills/kWh 24.4 24.4 21.4 21.6 27.6 CO2 T&SM Costs mills/kWh 6.7 6.7 5.8 5.9 7.5LCOE (2015$) mills/kWh 158.7 203.2 154.3 181.6 359.9
Review of Techno-Economics
© 2016 ADA-ES, Inc. All rights reserved. ‐66‐
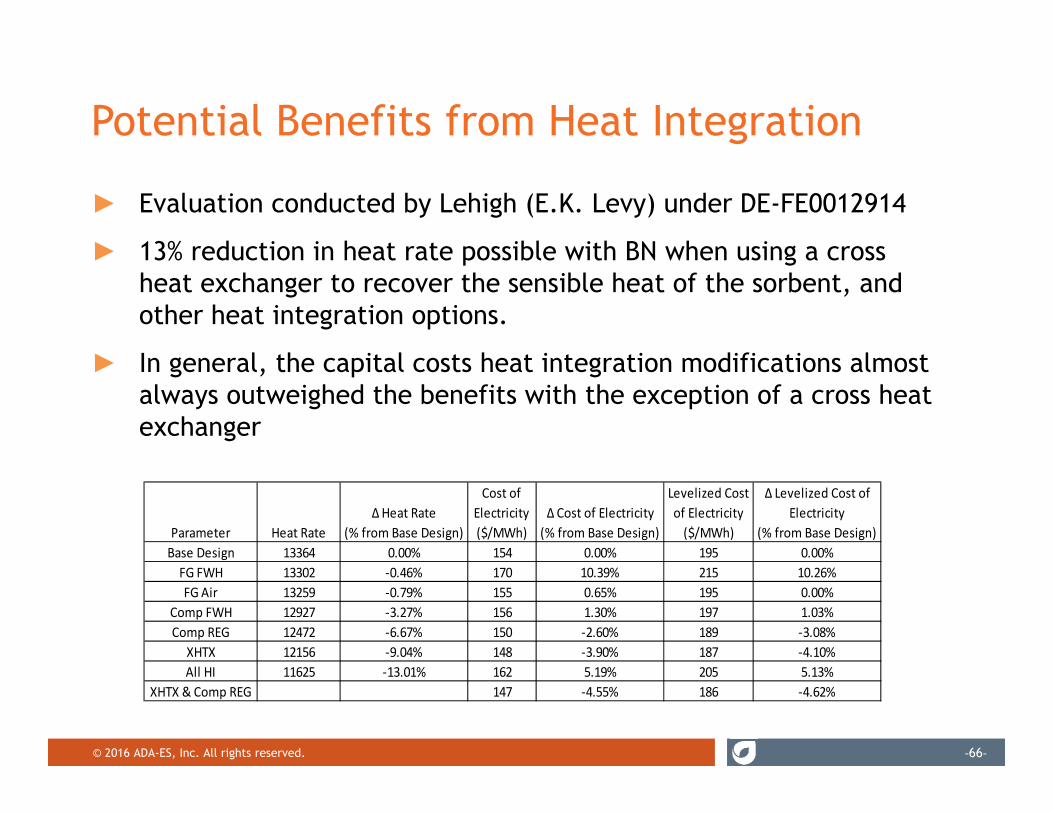
► Evaluation conducted by Lehigh (E.K. Levy) under DE-FE0012914
► 13% reduction in heat rate possible with BN when using a cross heat exchanger to recover the sensible heat of the sorbent, and other heat integration options.
► In general, the capital costs heat integration modifications almost always outweighed the benefits with the exception of a cross heat exchanger
Potential Benefits from Heat Integration
Parameter Heat RateΔ Heat Rate
(% from Base Design)
Cost of Electricity ($/MWh)
Δ Cost of Electricity (% from Base Design)
Levelized Cost of Electricity ($/MWh)
Δ Levelized Cost of Electricity
(% from Base Design)Base Design 13364 0.00% 154 0.00% 195 0.00%FG FWH 13302 ‐0.46% 170 10.39% 215 10.26%FG Air 13259 ‐0.79% 155 0.65% 195 0.00%
Comp FWH 12927 ‐3.27% 156 1.30% 197 1.03%Comp REG 12472 ‐6.67% 150 ‐2.60% 189 ‐3.08%
XHTX 12156 ‐9.04% 148 ‐3.90% 187 ‐4.10%All HI 11625 ‐13.01% 162 5.19% 205 5.13%
XHTX & Comp REG 147 ‐4.55% 186 ‐4.62%

© 2016 ADA-ES, Inc. All rights reserved. ‐67‐
Project Review
Overview of Project and Technology
Pre-Construction (Budget Period 1) Sorbent, 500 MW Process Concept, 1 MW Pilot Design
Construction (Budget Period 2) Detailed Engineering - Pilot, Manufacture Sorbent, Fabricate,
Install and Commission Pilot
Testing and Performance Review (Budget Period 3)
Review of Project Key Operational Challenges, Objectives and Achievements
Conclusions

© 2016 ADA-ES, Inc. All rights reserved. ‐68‐
Recommendations Based on Pilot Operational Challenges
► Plan for more balance of plant issues on first-of-a-kind pilots than expected− Inherent instability of fluidized beds
− SO2 scrubber operation and subsequent blower issues
− Electrical grounding issues
− Unseasonably cold weather and inadequate freeze protection
− Supply water contamination
− Analyzer reliability
− Insufficient fluidization within transfer lines, sorbent carryover
► Conduct additional lab tests, extrapolate performance, and build in contingency− Changes in sorbent behavior at high temperatures
− Better use of performance models to test assumptions.
− Limit adsorption in carrier gas lines

© 2016 ADA-ES, Inc. All rights reserved. ‐69‐
Project Objective and Goals
► The overall objective was to validate solid sorbent-based post combustion CO2 capture through pilot testing
► Project Goals:• Achieve 90% CO2 Capture • Reduce costs of carbon capture
Progress towards <35% LCOE Goal• Generate a high purity CO2 stream• Successfully scale sorbents

© 2016 ADA-ES, Inc. All rights reserved. ‐70‐
Project Goals – CO2 Capture► Achieve 90% CO2 Capture
− 90% CO2 capture was achieved at flow rates less than 1MW equivalent
− Target flue gas flow rate during 90% capture was ~12500lbs/hr
− Sustainable flue gas flow rate during 90% capture was ~3000lbs/hr
Future Development Areas• Development of sorbents capable of higher CO2
delta loading• Modify pilot for better high temperature sorbent
handling• Modify pilot and pilot operation to limit
adsorption of CO2 onto sorbent prior to entering adsorber.

© 2016 ADA-ES, Inc. All rights reserved. ‐71‐
Project Goals - LCOE► Reduce costs of carbon capture
Progress towards <35% LCOE Goal The process technology developed by
ADA and the project team functioned as expected after resolving start-up issues and considering adsorption in carrier gas line from regenerator to adsorber.
Although the specific sorbent tested in the pilot did not demonstrate the ability to reduce costs for carbon capture compared to MEA during pilottesting, modeling suggests it should with pilot modifications.
Sorbent properties were identified that will lead to development of sorbents capable of reduced costs for carbon capture

© 2016 ADA-ES, Inc. All rights reserved. ‐72‐
Sorbent Properties► Summary of Sorbent BN performance
− Predicted CO2 working capacity was 7%− Maximum CO2 working capacity calculated with
pilot operation results is 5.4%− Sorbent BN adsorption of CO2 across adsorber was
limited due to adsorption in carrier line between regenerator and adsorber
− Flowability properties at elevated temperatures lead to sorbent transfer limitations and pluggage in cyclone diplegs
► Future Development and Focus Areas • Characterize sorbent flow properties for entire
range of expected temperatures• Expand analysis of interplay between H20 and CO2
capacities and the effect on CO2 working Capacity• Modify pilot and pilot operation to mitigate CO2
adsorption onto sorbent prior to entering adsorber

© 2016 ADA-ES, Inc. All rights reserved. ‐73‐
Project Goals – Scale Sorbent► Successfully Scale Sorbents:
− Over 250 sorbents were screened
− Multiple sorbents were characterized in detail
− Manufacturing and processing of the selected sorbent was successfully accomplished
− Sorbent in quantities needed for pilot demonstration were delivered on time for the pilot demonstration
Future Development Areas• Develop manufacturing which minimizes processing, reduces costs and possibly
retains original spherical shape to minimize attrition
• Identify domestic manufacturer of sorbent

© 2016 ADA-ES, Inc. All rights reserved. ‐74‐
Project Goals – Product Purity► Generate High Purity CO2 Stream
− A high purity CO2 stream was generated− Target CO2 Concentration during 90% capture was ~95.0%vol CO2
− Sustainable CO2 Concentration during 90% capture was ~89.4%vol CO2+/-5.75%
Future Development Areas• Design consideration for blower
air-in leakage will need to be considered

© 2016 ADA-ES, Inc. All rights reserved. ‐75‐
Overall Conclusions► A solid sorbent-based post-combustion CO2 capture TSA process
using a 2010-vintage sorbent, produced at large volumes specifically for pilot testing and subsequently modified for testing in a fluidized bed, successfully removed 90% of CO2 from an incoming flue gas stream from a coal-fired power plant
► Based on pilot results, the sorbent tested at the pilot is competitive with MEA post-combustion capture systems
► Solid sorbents can adsorb CO2 selectively from coal derived flue gas without concentrating other harmful trace elements such as mercury or selenium
► Laboratory data can be very valuable for design details and predicting performance of larger scale systems

© 2016 ADA-ES, Inc. All rights reserved. ‐76‐
Additional Slides

© 2016 ADA-ES, Inc. All rights reserved. ‐77‐
Design Measured UnitsFlue Gas Adsorber In 1808 1611 779 824 428 415 350 acfmSorbent Circulation Rate 31107 18439 15103 10070 13183 9876 17993 lb/hr
Sorbent/CO2 Ratio ADS Inlet 15.5 9.3 17.1 10.3 25.9 20.0 43.8 lb/lbCO2 Inlet (%) ADS Inlet 13% 13% 13% 13% 13% 13% 13% %CO2 % Capture 90.0% 13.6% 52.0% 42.0% 94.0% 82.0% 87.0% Weight %
CO2 Working Capacity 7.0% 1.5% 3.3% 4.4% 4.0% 4.3% 2.2% % CO2|SorbentH2O Working Capacity 1.0% 0.53% 0.86% 0.28% 0.27% %H2O|Sorbent
CO2 Fluidizing 343 262 267 195 237 229 306 acfmTransfer to REG 67 114 90 90 100 90 115 acfmTransfer to ADS 252 240 250 254 254 255 213 acfm
Density Bottom ADS bed 15 15.3 19.8 19.3 20.7 22.4 23.3 lbs/cfMiddle ADS bed 15 14.2 21.6 20.8 23.9 23.3 24.5 lbs/cfTop ADS bed 15 15.7 20.4 20 22.3 22.2 23.5 lbs/cfRegenerator 26 18 17.3 19 18.6 18.6 17.5 lbs/cf
Bed Height Bottom ADS bed 13.3 11.5* 10.5 9 10.5* 7.5 7.8 ftMiddle ADS bed 13.3 9.5* 7.5 8 8* 6 6 ftTop ADS bed 28.9 18* 17 21.5 22.5* 23 17.9 ftRegenerator 17 18* 17 16 20.5 15.5 15.9 ft
Temp Bottom ADS bed 40 40 43 40 42 37 40 CMiddle ADS bed 40 39 43 41 45 41 44 CTop ADS bed 40 43 51 42 43 41 46 CRegenerator 120 114 119 118 121 117 119 C
Adsorber In BLW 101 Outlet 5.9 6.9 6 7 7 6.8 6 psigCO2 13.1 13.1 13.7 13.8 13.8 13.1 14 %
Adsorber Out ADS Outlet 1.0 1.43 0.38 0.45 0.32 0.32 0.3 psigCO2 1.58 10.4 6.5 7.8 0.9 2.4 1.8 %
Regen Out CO2 (dry) 93.4 89 96.8 85.5 88.8 85.5 89.9 % (dry)
Pilot Design and Actual Performance