evaluation of solid sorbent sampling methods by
TRANSCRIPT

See discussions, stats, and author profiles for this publication at: https://www.researchgate.net/publication/221729364
Analytical Performance Issues: Flow Resistance of Samplers
for Personal Monitoring in Work Areas and Requirements for
Sampling Pump Performance
Article in Journal of Occupational and Environmental Hygiene · February 2012
DOI: 10.1080/15459624.2011.640302 · Source: PubMed
CITATIONS
16READS
808
1 author:
Some of the authors of this publication are also working on these related projects:
Air Monitoring Methods View project
Method development for the evaluation of bitumen fumes exposure in road paving construction sites View project
Dietmar Breuer
Institut für Arbeitsschutz
245 PUBLICATIONS 528 CITATIONS
SEE PROFILE
All content following this page was uploaded by Dietmar Breuer on 23 May 2014.
The user has requested enhancement of the downloaded file.

Ann occup. Hyg.. Vol. 37, No. 1, pp. 65-88, 1993 0003-4878/93 S600+000Primed in Great Britain. Pcrgamon Press Ltd
© 1993 British Occupational Hygiene Society.
oEVALUATION OF SOLID SORBENT SAMPLING METHODS
BY BREAKTHROUGH VOLUME STUDIES
MARTIN HARPER
SKC Inc., R.R. No. 1 Box 334, Eighty Four, PA 15330-9614, U.S.A.
(Received 4 July 1991 and in final form 11 August 1992)
Abstract—Organic vapours in air can be sampled by concentration on a solid sorbent. A knownquantity of air is passed through a tube containing the sorbent, and the adsorbed vapours cansubsequently be desorbed and analysed. To match sorbent and sorbate correctly, the maximumvolume of air that can be sampled without significant breakthrough of the sorbate into the effluentstream must be known. Many factors might influence the course of breakthrough, including vapourconcentration, temperature, humidity, interferences, flow-rate and sorbent bed geometry. Athorough investigation of the effects of these factors on the breakthrough of organic vapours on twoporous polymers is presented. The dependence of breakthrough volume on concentration that ispredicted by existing theories of frontal (gas-solid) chromatography is confirmed, and therelationship is shown to be closely linked to the shape of the adsorption isotherm. The results werechecked using sample tubes with back-up sections to detect breakthrough. Sample rates as low as20 ml min"1 confirmed predicted breakthrough volumes. Breakthrough volumes determined usingthe technique of continuous vapour assault under carefully controlled 'worst-case' conditions (the'direct' method) can be used to predict safe sample volumes, according to NIOSH and OSHAprotocols. Safe sample volumes derived from breakthrough volumes determined using a techniquebased on chromatographic retention volumes (the 'indirect' method) are not comparable. To avoidconfusion when referring to values obtained by the indirect technique the term 'safe sample volume'should not be used. Where sample tubes without back-up sections are employed, so thatbreakthrough cannot be detected, there must be confidence that sample loss has not occurred.
I N T R O D U C T I O N
To PROTECT the health of workers in industry, and to monitor and control the generalenvironment, it is important to know the concentrations of chemical pollutants in theair. Sample tubes containing solid sorbents which trap certain gases and vapours forsubsequent analysis are commonly used to measure these concentrations (CRISP, 1980).A calibrated pump draws air through the tube so that the average concentration overthe period of sampling is the quantity of material collected divided by the volume of airsample. Pre-concentration by this method is particularly useful where a time-weightedaverage is required, for instance to meet occupational hygiene regulations, or whereconcentrations in the air are low and the requisite analytical sensitivity can be achievedonly with a larger sample.
Many sorbent materials have been proposed for this purpose (CRISP, 1980; HARPER
and PURNELL, 1990). Some are coated with reagents which form stable, specific andanalysable derivatives, and this is the most efficient method of collection, butunfortunately such methods are often specific to a single chemical or class of chemicals.Porous materials that collect molecules by physical adsorption are very popular, sincea wide variety of compounds may be collected on a single substrate. Collectionefficiency varies, however, with the nature and strength of the adsorptive forces, withthe concentrations of the compounds sampled, and with the environmental conditionsprevailing during sampling. Sorbents commonly used include charcoal, silica gel,
65
at CD
C P
ublic Health Library &
Information C
enter on Septem
ber 16, 2011annhyg.oxfordjournals.org
Dow
nloaded from
66 M. HARPER
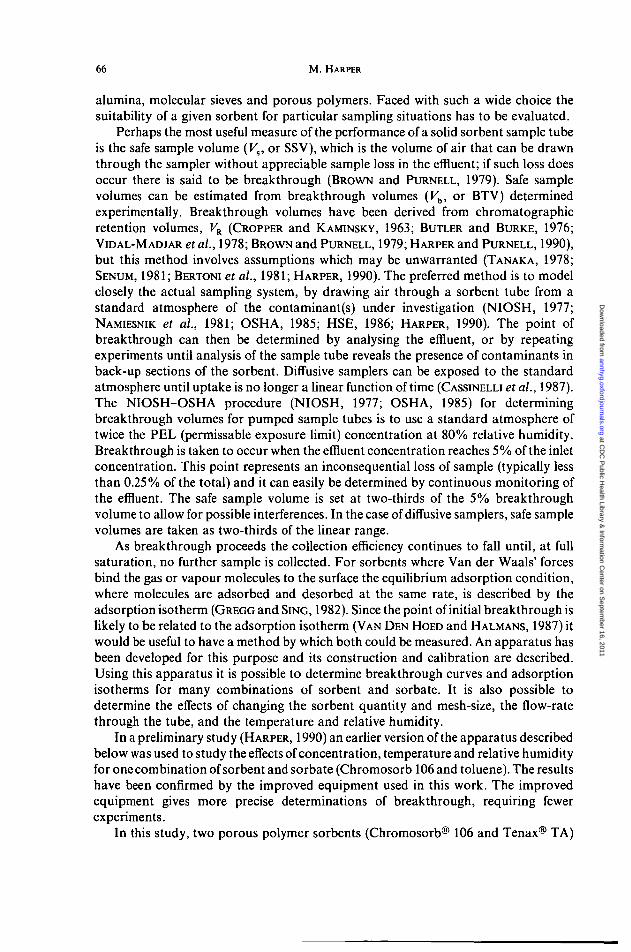
alumina, molecular sieves and porous polymers. Faced with such a wide choice thesuitability of a given sorbent for particular sampling situations has to be evaluated.
Perhaps the most useful measure of the performance of a solid sorbent sample tubeis the safe sample volume (Ks, or SSV), which is the volume of air that can be drawnthrough the sampler without appreciable sample loss in the effluent; if such loss doesoccur there is said to be breakthrough (BROWN and PURNELL, 1979). Safe samplevolumes can be estimated from breakthrough volumes (Kb, or BTV) determinedexperimentally. Breakthrough volumes have been derived from chromatographicretention volumes, KR (CROPPER and KAMINSKY, 1963; BUTLER and BURKE, 1976;VIDAL-MADJAR et al., 1978; BROWN and PURNELL, 1979; HARPER and PURNELL, 1990),but this method involves assumptions which may be unwarranted (TANAKA, 1978;SENUM, 1981; BERTONI et al., 1981; HARPER, 1990). The preferred method is to modelclosely the actual sampling system, by drawing air through a sorbent tube from astandard atmosphere of the contaminant(s) under investigation (NIOSH, 1977;NAMIESNIK et al, 1981; OSHA, 1985; HSE, 1986; HARPER, 1990). The point ofbreakthrough can then be determined by analysing the effluent, or by repeatingexperiments until analysis of the sample tube reveals the presence of contaminants inback-up sections of the sorbent. Diffusive samplers can be exposed to the standardatmosphere until uptake is no longer a linear function of time (CASSINELLI et al., 1987).The NIOSH-OSHA procedure (NIOSH, 1977; OSHA, 1985) for determiningbreakthrough volumes for pumped sample tubes is to use a standard atmosphere oftwice the PEL (permissable exposure limit) concentration at 80% relative humidity.Breakthrough is taken to occur when the effluent concentration reaches 5% of the inletconcentration. This point represents an inconsequential loss of sample (typically lessthan 0.25% of the total) and it can easily be determined by continuous monitoring ofthe effluent. The safe sample volume is set at two-thirds of the 5% breakthroughvolume to allow for possible interferences. In the case of diffusive samplers, safe samplevolumes are taken as two-thirds of the linear range.
As breakthrough proceeds the collection efficiency continues to fall until, at fullsaturation, no further sample is collected. For sorbents where Van der Waals' forcesbind the gas or vapour molecules to the surface the equilibrium adsorption condition,where molecules are adsorbed and desorbed at the same rate, is described by theadsorption isotherm (GREGG and SING, 1982). Since the point of initial breakthrough islikely to be related to the adsorption isotherm (VAN DEN HOED and HALMANS, 1987) itwould be useful to have a method by which both could be measured. An apparatus hasbeen developed for this purpose and its construction and calibration are described.Using this apparatus it is possible to determine breakthrough curves and adsorptionisotherms for many combinations of sorbent and sorbate. It is also possible todetermine the effects of changing the sorbent quantity and mesh-size, the flow-ratethrough the tube, and the temperature and relative humidity.
In a preliminary study (HARPER, 1990) an earlier version of the apparatus describedbelow was used to study the effects of concentration, temperature and relative humidityfor one combination of sorbent and sorbate (Chromosorb 106 and toluene). The resultshave been confirmed by the improved equipment used in this work. The improvedequipment gives more precise determinations of breakthrough, requiring fewerexperiments.
In this study, two porous polymer sorbents (Chromosorb® 106 and Tenax® TA)
at CD
C P
ublic Health Library &
Information C
enter on Septem
ber 16, 2011annhyg.oxfordjournals.org
Dow
nloaded from

Evaluation of solid sorbent sampling methods 67
were used to sample a number of polar and non-polar organic solvent vapours(2-propanol, ethyl acetate, 2-butanone, hexane and toluene) at concentrations up totwice the OSHA PEL concentration. The effects on breakthrough volume of changes insorbent bed depths, flow-rates, relative humidities and temperatures, were alsoinvestigated. Safe sample volumes are defined according to the NIOSH-OSHAprocedure described above. The adsorption isotherms were constructed by plotting theweight of organic vapour adsorbed per gramme of adsorbent at equilibrium saturationagainst the organic vapour concentration, from experiments under dry air conditions.
ATMOSPHERE GENERATION SYSTEMTwo air streams are regulated to form the wet and dry air supplies. The dry stream
is passed through a drier and a charcoal trap. The wet stream is first passed through acharcoal trap and is then bubbled through a large pot of distilled water heated in awater bath to 30°C. The humidified air is then passed through two condensers in achamber held at 25°C, condensation indicating saturation at this temperature. The wetstream is then mixed with the dry stream go give the desired relative humidity at anappropriate flow-rate (around 4000 ml min"1). This air is passed into a heatedmanifold where organic liquids are injected to give the desired atmosphere. Themanifold is normally kept a few degrees above 25°C to ensure that condensation doesnot take place; higher temperatures can be used to vaporize less volatile liquids, theapparatus has multiple injection ports for the addition of interfering substances thatcannot be mixed and injected from a single syringe. Syringes from 1 /zl to 10 ml can beused in the syringe drives, and to maintain each syringe at the desired temperature coolair is passed through their insulated hollow steel jackets. Throughout all parts of theequipment temperatures are regulated by copper-constantan thermocouples con-nected to microprocessor controllers. Except where mentioned, all tubing is 6.2 mm(| in.) OD, and in most cases made of PTFE, but in parts of stainless steel. Wherenecessary, PTFE tubing is connected by PTFE fittings. A flow diagram of theapparatus is shown in Fig. 1.
BREAKTHROUGH VOLUME EQUIPMENT
A standard atmosphere produced by the method described above is drawn througha sample tube containing the sorbent under investigation, and part of the effluent isthen fed to the flame ionization detector (FID) of a gas chromatograph. Air from theatmosphere generation system is led first into a chamber in which diffusive samples canbe collected, or from which samples can be drawn. Air leaving the chamber is led to afour-way connector: one line leads to the vent, and is used to maintain the chamberatmosphere at ambient atmospheric pressure; one passes to a Miran i.r. spectrometerfor calibration purposes; and one to the breakthrough study. This last line leads to aswitching circuit designed to avoid pressure fluctuations caused by switching thesorbent tube in and out of line: one branch contains the tube with sorbent, and theother a similar tube containing an equivalent quantity of glass beads of the same meshsize as the sorbent. The effluent from the sorbent tube passes through a digitalflowmeter and is then divided into two 3.1 mm (̂ in.) OD Teflon tubes. One tube is
at CD
C P
ublic Health Library &
Information C
enter on Septem
ber 16, 2011annhyg.oxfordjournals.org
Dow
nloaded from

DRIER/CHARCOAL
COMPRESSOR FILTER/DRIER/CHARCOAL
REFRIGERATOR
ROTAMETER
DRIER/CHARCOAL CONDENSORS
ROTAMETER
oooooo
TEMPERATURE CONTROLLEDSYRINGE DRIVE UNITS
so
3
TO MXINO/EXPOSURE CHAMBER
HUMIDIFIER IN TEMPERATURECONTROLLED WATERBATH
I. Dynamic atmosphere generation system.
at CD
C P
ublic Health Library &
Information C
enter on Septem
ber 16, 2011annhyg.oxfordjournals.org
Dow
nloaded from

MRANIRSPECTROPHOTOMETER
> VENT TEMPERATURE CONTROLLEDCHAMBER
CHARCOALTRAP
FROM ATMOSPHERE-GENERATION SYSTEM
TEMPERATUflE CONTROLLEDMHONG CHAMBER
ROTAMETER
rn
o.
i•a
eroa.
FIG. 2. Equipment for breakthrough determinations.
8
at CD
C P
ublic Health Library &
Information C
enter on Septem
ber 16, 2011annhyg.oxfordjournals.org
Dow
nloaded from

70 M. HARPER
connected via a charcoal trap and needle valve to a vacuum pump which is used tocontrol the flow through the sorbent tube. The other tube is connected via a miniaturepump, a flow controller, and a rotameter to the FID of a gas chromatograph. Thenormal operating condition is a flow of 200 ml min" ' through the sorbent tube, afterwhich 40 ml min"1 is diverted to the FID.
PREPARATION OF SAMPLE TUBES AND ATMOSPHERE CALIBRATION
There are three methods of determining the concentration of the atmosphereproduced by this equipment. Firstly by calculation from the quantity of liquid injectedinto a known volume of air, secondly by means of the Miran, and finally, by use ofsample tubes. The third method is preferred, since the syringe drives and flow meters ofthe equipment, and also the Miran, require calibration. The use of sample tubesprovides an excellent external check on the calculated concentration. The principle useof the Miran is to ensure constant concentration during the experiments.
Both for calibration purposes and for the experimental investigations sample tubesare made of 6.2 mm (£ in.) ID stainless steel and are 15 cm long. Adsorbent material isheld in place by coarse mesh stainless steel screens at each end of the tube. The sorbentmaterials used include porous polymers such as Chromosorb 106 and Tenax TAcleaned according to a proprietary process and available from SKC Inc. The tubes areweighed empty and full, and then baked overnight under a nitrogen atmosphere andreweighed. The initial weight is calculated to give a final weight typically within 0.5% ofthat required. The tubes are tightly capped before use and again immediately after use.They are weighed again and the contents are solvent desorbed as soon as possible, orthe tube is refrigerated overnight and desorbed and analysed the following day.
Figure 3 shows the correlation between the calculated concentration (Ccalc) and theexperimentally determined concentration (Cexp) for atmospheres containing400-2400 m g m " 3 toluene (equivalent to 107-640 ppm at NTP; OSHA PEL is100 ppm or 375mgm~ 3) generated using a 10 ml syringe. According to NIOSH—OSHA protocols, breakthrough experiments should be conducted at 2 x PEL(750 m g m " 3 toluene), which is well within the calibration range of Fig. 3. With300 mg Chromosorb 106 and 10 ml carbon disulphide as the desorbing solvent themean desorption efficiency for toluene over a wide range of loading was determined tobe 99.7%. Figure 4 is a calibration curve for the 0.25 ml syringe with toluene; sampletube uptakes were determined by analysis.
Relative humidity is stated as the ratio of moist air to total air flowing through theinjection block. This is checked frequently in the following manner. A low-flow pumppulls 0.5-O.8 1. of the atmosphere through pre-weighed sample tubes containing600 mg total weight of molecular sieve 5A (SKC Inc. 226-12-06). Since most of theorganic compounds used in these experiments are unable to enter the intracrystallineporosity of this sieve (BARRER, 1978), any sorption will not be a significant addition tothe 7-11 mg water uptake. The concentration of water vapour can then be determinedby dividing the increase in weight of the tube by the volume of air sampled. By thismethod the nominal 80% relative humidity has been shown to vary across an extremerange of 71-84% with the majority of determinations falling in the range 76-78%.
at CD
C P
ublic Health Library &
Information C
enter on Septem
ber 16, 2011annhyg.oxfordjournals.org
Dow
nloaded from

Evaluation of solid sorbent sampling methods 71
3000-,
IP
! 2000
1
1000
1000 2000 3000CALCULATED CONCENTRATION (mg m>)
FIG. 3. Calibration of dynamic atmosphere 1. Toluene concentrations from 400 to 2400 mg m"3.
80-
35 6 0 -
_J
40
20-
20 40 60CALCULATED CONCENTRATION (mg mJ)
80
FIG. 4. Calibration of dynamic atmosphere 2. Toluene concentrations from < 10 to 70 mg m~
at CD
C P
ublic Health Library &
Information C
enter on Septem
ber 16, 2011annhyg.oxfordjournals.org
Dow
nloaded from

72 M. HARPER
THE EFFECT OF BED DEPTH AND FLOW-RATE ON BACK PRESSURE
The pressure difference (AP) required to draw the contaminated air through thesorbent bed depends on the quantity of sorbent in the tube and on the flow-rate, andwas measured at different bed weights and flow-rates by a manometer placed beforeand after the sorbent tube. Tubes containing various quantities of the two porouspolymer sorbents were tested in this manner. The results are presented in Figs 5-7.
Figure 5 shows that, as expected, the relationship between the quantity of sorbent(Chromosorb 106) and the pressure difference for any given flow-rate through the tubeis linear, but neither for Chromosorb 106 (Fig. 6) nor for Tenax TA (Fig. 7) is therelationship between pressure difference and air flow-rate linear. The pressuredifference required to effect a particular volume flow-rate increases more rapidly thanexpected at higher flow-rates. This is due to a change from laminar to turbulent flowconditions. The results have been modelled precisely using the Ergun equation fromengineering theory, where flow through a column containing closely packed particles isconsidered as flow through a bundle of tangled tubes of wierd cross-section (BIRD et al.,1958). The Ergun equation consists of a laminar flow term added to a turbulent flowterm. At its simplest, the pressure drop per unit bed length {AP/L) is equal to a constant(Kt) times the linear velocity (v0) plus a second, much smaller constant (K2) times thesquare of the linear velocity {v$). At flow-rates less than about 200 ml min"1 thelaminar flow term (A!\i;0) dominates, but as the flow-rate increases, the turbulent flowterm (K2v$) assumes much greater importance. NIOSH (1977) recommends that thepressure difference should not exceed 25 mm Hg (340 mm H2O) at a flow-rate of1000 ml min ~ i. This pressure difference is exceeded only when 6.2 mm (̂ in.) diameter
: -10-
o.<]
1000 ml min1
800 ml min1
600 ml min'
400 ml min'
200 ml min1
250 500 750 1000
QUANTITY OF SORBENT (mg)
FIG. 5. Effect of sorbent quantity on sample tube back pressure. Chromosorb 106.
at CD
C P
ublic Health Library &
Information C
enter on Septem
ber 16, 2011annhyg.oxfordjournals.org
Dow
nloaded from

Evaluation of solid sorbent sampling methods 73
250 500
FLOW RATE (ml min1)
750
900 mg
NIOSHRECOMMENDED
MAXIMUM
700 mg
600 mg
300 mg
100 mg
1000
FIG. 6. Effect of air flow-rate on sorbent tube back pressure. Chromosorb 106.
NIOSH RECOMMENDED MAXIMUM
400 mg
250 mg
130 mg
250 500FLOW RATE (ml min1)
750 1000
FIG. 7. Effect of air flow-rate on sorbent tube back pressure. Tenax TA.
at CD
C P
ublic Health Library &
Information C
enter on Septem
ber 16, 2011annhyg.oxfordjournals.org
Dow
nloaded from

74 M. HARPER
tubes are filled with 900 mg of 20/40 mesh Chromosorb 106. The amount of Tenax TArequired is much less (around 600 mg) because the pressure difference appears to be afunction of sorbent bed depth rather than weight, and Tenax TA is rather less densethan Chromosorb 106.
EFFECT OF TUBE DIAMETER ON BACK PRESSURE AND BREAKTHROUGH
Reducing the tube diameter from 6.2 to 3.1 mm results in an approximately200-fold increase in linear velocity through the tube. The pressure difference across a3.1 mm ( | in.) stainless steel tube containing 250 mg of Chromosorb 106 thereforeexceeds the NIOSH limit at flow-rates under 200 ml min~1. To assess the effect of thispressure difference on breakthrough an experiment was carried out using glass tubes of4, 5, 6, 8 and 9 mm ID, each containing 250 mg Chromosorb 106. An atmosphere of1300 mgm"3 hexane was pulled through the tubes at 200mlmin"1. The break-through curves for the 6, 8 and 9 mm ID tubes were very similar, but the breakthroughtime increased markedly for the 5 mm ID tube, and again for the 4 mm ID tube. Thisresult is in accord with experience in gas chromatography, where it was noticed earlythat moving from 6.2 to 3.1 mm ID columns resulted in an improved column efficiency.This effect was also noted by BUTLER and BURKE (1976) during their investigation ofsample tubes. However, because of the large increase in back-pressure over NIOSHspecifications encountered in the use of small diameter tubes no further experimentshave been carried out in this area.
ENVIRONMENTAL EFFECTS ON BREAKTHROUGH
This section details the results of investigations into the effects of vapourconcentration, flow-rate, humidity and temperature on breakthrough. The resultsobtained are summarized in Figs 8-17. Figure 8 combines the results of experimentsusing deep beds (900 mg Chromosorb 106), together with low flow-rates, to illustrateclearly the dependence of breakthrough volume on concentration for five organicvapours of different polarity, molecular weight and boiling point. Figure 9 shows thecorresponding adsorption isotherms. All isotherms were found to be non-linear andconcave to the concentration (pressure) axis over the range of concentrations studied.The breakthrough curves also show a dependence on concentration, the degree ofcurvature being apparently related to curvature of the adsorption isotherm. Both theadsorption isotherm and the breakthrough curve are related to parameters such as themolecular weight and boiling point of the adsorbates. However, as will be seen, thekinetic equilibrium of breakthrough is affected by parameters such as the sorbent bed-depth, while the saturation equilibrium represented by the adsorption isotherm is not.In all other experiments described here the adsorption isotherm curves did not deviatefrom those shown in Fig. 9, except where the temperature was varied in Fig. 17.
Figures 10 and 11 show breakthrough curves for toluene on Tenax TA. The 400 and130 mg bed weights were chosen to provide comparison with data from GALLANT et al.(1978) and BROWN and PURNELL (1979). Note the difference in concentration rangecovered in these figures and Fig. 8. Even at relatively low flow-rates, high tolueneconcentrations broke through the Tenax TA beds too quickly to give usable results.The other vapours chosen for investigation could not be used as breakthrough was
at CD
C P
ublic Health Library &
Information C
enter on Septem
ber 16, 2011annhyg.oxfordjournals.org
Dow
nloaded from

Evaluation of solid sorbent sampling methods 75
100-1
60-
40-
20-
• — • TOLUENE (200 ml min')
©—o ETHYL ACETATE (160 ml min')
• — * HEXANE (210 ml mm1)
+ - + 2-BUTANONE (120 ml min')
. — . 2-PROPANOL (90 ml min1)
1000 2000CONCENTRATION (mg m')
3000
FIG. 8. Dependence of breakthrough on concentration. Five per cent breakthrough volumes of selectedvapours on 900 mg Chromosorb 106.
almost instantaneous, even at low concentrations. Too little toluene was adsorbed bythe Tenax TA to provide an accurate isotherm by gravimetry.
Figure 12 shows the effect of the quantity of Chromosorb 106 in the sorbent bed (i.e.bed depth) on the breakthrough of hexane at different concentrations. Figure 13 showssimilar results for the effect of bed depth on the breakthrough of toluene on Tenax TA.Increasing the quantity of sorbent increases the breakthrough volume by more thanwould be expected from a simple linear relationship in both cases.
Figure 14 shows no effect of flow-rate on hexane breakthrough for 900 mg ofChromosorb 106 at flow-rates up to 1 1. min"'. This was confirmed by experimentsusing hexane on 300 mg same sorbent, and toluene on 400 mg Tenax TA. Figure 13also includes points derived from experiments at different flow-rates (110 and 200 mlmin ~'), with no significant differences between the results. All other experiments werecarried out at 200 ml min"!, the flow-rate of primary choice in the OSHA protocol.The sample tube breakthrough experiments described later provide strong evidencethat the linear relationship holds to flow-rates as low as 20-30 ml min"'.
Figure 15 illustrates the effect of relative humidity on the breakthrough of ethylacetate, a relatively polar and water soluble compound, on Chromosorb 106. Theresults are in line with previous observations (HARPER, 1990) involving a non-polar
at CD
C P
ublic Health Library &
Information C
enter on Septem
ber 16, 2011annhyg.oxfordjournals.org
Dow
nloaded from

76 M. HARPER
1OOn
TOLUENE
75-
fs
50-
25-
1000 2000 3000
CONCENTRATION (mg ms)
FIG. 9. Adsorption isotherms of organic vapours on Chromosorb 106.
compound (toluene), and strongly suggest that the presence of water vapour has noeffect on the sampling of organic vapours on this sorbent. Figure 16 illustrates the effectof temperature on the breakthrough of ethyl acetate on Chromosorb 106, and Fig. 17illustrates the effect on the adsorption isotherm. As the amount adsorbed atequilibrium is reduced, so too is the breakthrough volume.
CONFIRMATORY EXPERIMENTS
These results can be applied usefully only if breakthrough can be predicted foractual sampling situations. Using standard equipment, samples can be collected fromthe sampling ports on an exposure chamber, and breakthrough determined on a two-section adsorbent sampling tube by sampling successively larger air volumes andanalysing the front and back sections separately. Samples were collected by SKC Inc.pumps (models 222-3 or 222-4), modified to give flow-rates in the range10-40 ml min"', and calibrated by bubble flowmeter with sampling tube in line. Thesampling tubes contained either Chromosorb 106 (300 mg front section, 150 mg backsection) or Tenax TA (130 mg front section, 65 mg back section). Each section ofChromosorb 106 was desorbed in 2 ml carbon disulphide and each section of TenaxTA was desorbed in 2 ml acetone. Analysis was by GC-FID using a Poropak Q
at CD
C P
ublic Health Library &
Information C
enter on Septem
ber 16, 2011annhyg.oxfordjournals.org
Dow
nloaded from

Evaluation of solid sorbent sampling methods 77
40-,
30-
5?LI
20-
10
20 40 GOCONCENTRATION (mg mJ)
FIG. 10. Five per cent breakthrough volume against concentration. Toluene on 400 mg Tenax TA.
column for ethyl acetate and toluene and a Porapak T column for 2-butanone.Unfortunately, the loadings of toluene on the Tenax tubes were very low, and theanalytical precision was poor. Nevertheless, the results were in line with those obtainedusing Chromosorb 106, where the relative standard deviation of triplicate analyses wasgenerally less than 2%.
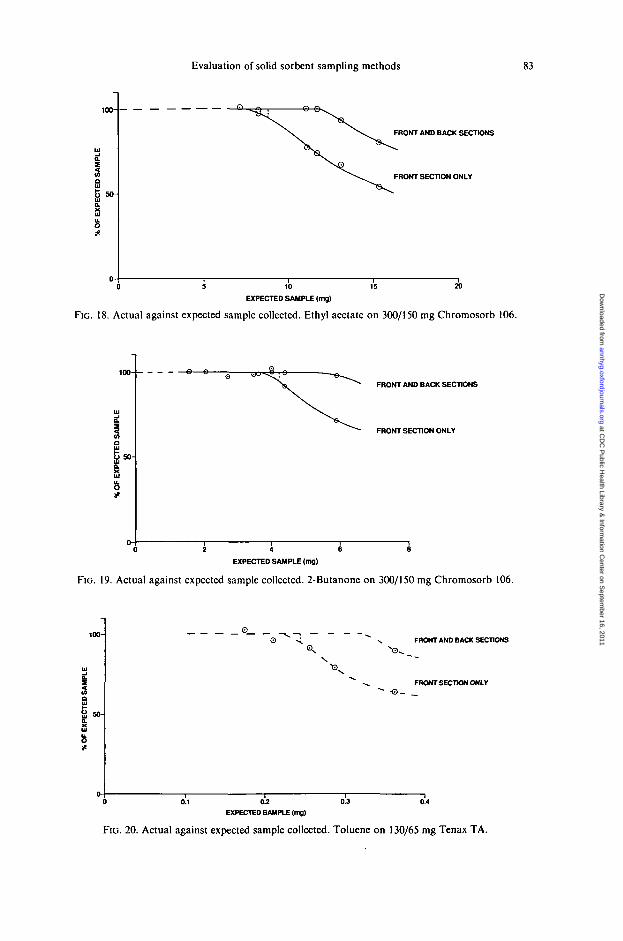
The area under the breakthrough curve is proportional to the amount of samplelost, which can be determined for any point along its length. A number of curves wereanalysed and it was found that 5% breakthrough volume (the point at which the outletconcentration reaches 5% of the assault concentration) represents a sample loss to therear section of approximately 0.25% of the total sample, which is a difficult point toidentify using the technique described above. Further examination showed that the33% breakthrough volume corresponds to a sample loss of 5%. In Figs 18-20 twopoints have been plotted for each sample tube, the percentage of total expected samplein the first section, and the percentage of total expected sample in the two sectionscombined. From these two curves the point of 5% sample loss to the back-up sectioncan be easily recognized and compared with the corresponding 33% breakthroughvolume. The three experiments were deliberately chosen to cover a wide range ofsorbent, sorbate, sorbate concentration and humidity. The results are given in Table 1.
The differences between the two measures do not appear to be significant,
at CD
C P
ublic Health Library &
Information C
enter on Septem
ber 16, 2011annhyg.oxfordjournals.org
Dow
nloaded from

78 M. HARPER
12-
10-
i
DCm
—i—20
— I —40
— I —60
CONCENTRATION (mg nv1)
FIG. 11. Five per cent breakthrough volume against concentration. Toluene on 130 mg Tenax TA.
suggesting that the results obtained by the breakthrough apparatus can be used todetermine the potential for sample loss from adsorbent tubes used to sample realatmospheres. Incidently, the results also confirm the conventional wisdom that a twosection sample tube collects sample efficiently until 25% of the total sample is found inthe back-up section (which contains 33% of the sorbent).
DISCUSSIONThe results of these experiments may be understood by reference to the theories of
gas chromatography, and, in particular, those pertaining to gas-solid (adsorption)chromatography. In gas-liquid (partition) chromatography the conditions are such
at CD
C P
ublic Health Library &
Information C
enter on Septem
ber 16, 2011annhyg.oxfordjournals.org
Dow
nloaded from

Evaluation of solid sorbent sampling methods 79
50-i
40-
UJ 30-
0 — 0 300 mg irr3
H — B 700 mg nv3
A — A 1300 mgnv3
V — V 1900 mgnr"
300 600 900
QUANTITY OF SORBENT (mg)
FIG. 12. Five per cent breakthrough volume against quantity of sorbent. Hexane on Chromosorb 106.
that the isotherms can be assumed linear and equivalent to the Henry's law relationshipfor the solution of gases in liquids. In adsorption chromatography, on the other hand,there is frequently no region of concentrations in which the isotherm is linear(KEULEMANS, 1959, pp. 105-112). With linear isotherms the retention volume of avapour is independent of its concentration, while in the non-linear case the retentionvolume depends on the concentration. In adsorption chromatography the isothermsare normally concave to the pressure (concentration) axis and the retention volumedecreases as the concentration increases (KEULEMANS, 1959, pp. 205-207). The passageof a continuous atmosphere of vapour through an air sampling adsorbent tube has itscounterpart in the technique of frontal analysis in adsorption chromatography.
There is a direct relationship between the shape of a chromatographic profile infrontal analysis and the shape of the equilibrium adsorption isotherm (GALLANT et al.,1978). Where isotherms are concave to the pressure axis, zones of high concentrationmove faster along the sorbent bed than zones of low concentration, so that a band withcontinuously changing concentration will sharpen its front entirely. However, theresultant frontal profile is modified by kinetic band broadening effects (GIDDINGS,
1965) so that the rise of the profile is always less abrupt than the sharp increase in the
at CD
C P
ublic Health Library &
Information C
enter on Septem
ber 16, 2011annhyg.oxfordjournals.org
Dow
nloaded from

80 M. HARPER
30-
ffi 20-
10-
A82 mg m3
100 200 300
QUANTITY OF SORBENT (mg)
400
FIG. 13. Five per cent breakthrough volume against quantity of sorbent. Toluene on Tenax TA.
original concentration at the inlet of the chromatograph. These kinetic effects includeeddy diffusion, molecular diffusion, resistance to mass transfer and wall effects. Thediffuse and distinctly asymmetric elution bands which result from these effects mark thecondition of non-linear, non-ideal chromatography, which is the most difficult case totreat mathematically (KEULEMANS, 1959, pp. 105-112).
It is often suggested that very small values of contaminant concentration wouldresult in approximately constant retention volumes since the initial part of curvedisotherms can be considered linear (KEULEMANS, 1959, pp. 205-207). It has beenassumed that the low concentrations encountered in workplace atmosphere fall in thisregion, so that variation of breakthrough volume with concentration could be ignored.In recent years, many authors (CROPPER and KAMINSKY, 1963; BUTLER and BURKE,
at CD
C P
ublic Health Library &
Information C
enter on Septem
ber 16, 2011annhyg.oxfordjournals.org
Dow
nloaded from

Evaluation of solid sorbent sampling methods 81
12-
200 400 600
FLOW RATE (ml mirv1)
FIG. 14. Five per cent breakthrough volume against flow rate. Hexane on 900 mg Chromosorb 106.
12-
£ 10-
S
2-
0 0% RELATIVE HUMIDITY
+ 80% RELATIVE HUMIDITY
1000 ^ 2000
CONCENTRATION (mg nr1)
3000
FIG. 15. Five per cent breakthrough volume against concentration. Effect of relative humidity on thebreakthrough of ethyl acetate on 300 mg Chromosorb 106.
at CD
C P
ublic Health Library &
Information C
enter on Septem
ber 16, 2011annhyg.oxfordjournals.org
Dow
nloaded from

82 M. HARPER
3 10
0 — 0 25°C
Q—G 40°C
1000 2000CONCENTRATION (mg m')
3000
FIG. 16. Five per cent breakthrough volume against concentration. Effect of temperature on thebreakthrough of ethyl acetate on 300 mg Chromosorb 106 (200 ml min" ') .
1000 2000 3000CONCENTRATION (mg m1)
FIG. 17. Adsorption isotherm of ethyl acetate on Chromosorb 106. Effect of temperature.
at CD
C P
ublic Health Library &
Information C
enter on Septem
ber 16, 2011annhyg.oxfordjournals.org
Dow
nloaded from
Evaluation of solid sorbent sampling methods 83
FRONT AND BACK SECTIONS
FRONT SECTION ONLY
5 10 15
EXPECTED SAMPLE (mg)
FIG. 18. Actual against expected sample collected. Ethyl acetate on 300/150 mg Chromosorb 106.
100
FRONT AND BACK SECTIONS
FRONT SECTION ONLY
2 4 6 8
EXPECTED SAMPLE (mg)
FIG. 19. Actual against expected sample collected. 2-Butanone on 300/150 mg Chromosorb 106.
O -4. FRONT AND BACK SECTIONS
FRONT SECTION ONLY
0.1 0.2 0.3
EXPECTED SAMPLE (mg)
FIG. 20. Actual against expected sample collected. Toluene on 130/65 mg Tenax TA.
at CD
C P
ublic Health Library &
Information C
enter on Septem
ber 16, 2011annhyg.oxfordjournals.org
Dow
nloaded from

84 M. HARPER
TABLE 1.
Sorbent
Chromosorb 106Chromosorb 106Tenax TA
COMPARISON OF 5%
Sorbate
Ethyl acetate2-ButanoneToluene
SAMPLE LOSS WITH
Concentration*(mgm~3)
1790920
40
3 3 % BREAKTHROUGH VOLUMES
Flow-rate(ml min~')
302030
RH(%)
5080
0
33% Vb
(1)
5.324.706.32
5% loss(1)
5.334.916.25
Concentrations adjusted for desorption efficiency: Chromosorb 106—ethyl acetate 93.3%; Chromosorb106-2-butanone 93.6%; Tenax-toluene 100% (assumed).
1976; VIDAL-MADJAR et al., 1978; BROWN and PURNELL, 1979) have suggested the useof breakthrough volumes derived from gas chromatographic retention volumeexperiments using uncontrolled concentrations from small plug injections of liquid orvapour. These experiments are normally performed at elevated temperatures and theresults extrapolated to room temperature. This is reasonable where the sorbentmaterial consists of liquid-coated inert supports, as in the original work of CROPPER
and KAMINSKY (1963), but most subsequent work has employed porous polymeradsorbents which do not necessarily exhibit linear isotherms. Chromosorb 106 has alarge surface area of 700-800 m2 g"1, indicating considerable microporosity. Adsorp-tion in micropores is enhanced at low concentrations which results in isotherms ofType I in the classification of Brunauer et al. The adsorption isotherms described inthis work are all non-linear Type I with curvature in the region of concentration ofinterest to the occupational hygienist, and breakthrough volumes are stronglydependent on the concentration of the vapour.
GALLANT et al. (1978) were disturbed by the lack of agreement between retentionvolumes by direct frontal chromatography and those determined by gas chromato-graphic elution studies. Other studies have shown that breakthrough on porouspolymers is dependent on concentration (BERTONI et al., 1981; NAMIESNIK et al., 1981)and that indirect measurements of breakthrough refer to very low vapour concentra-tions ('near infinite dilution'—BERTONI et al., 1981). The results presented here confirmthis view. For example, 20 1. is the safe sample volume given for ethyl acetate onChromosorb 106, this volume having been derived from breakthrough volumes by theindirect method (HSE, 1992). By the direct method described here the correspondingsafe sample volume (two-thirds of the breakthrough volume at twice the PELconcentration) is 2.2 1. Similar discrepancies were noted with hexane, toluene and2-butanone.
The importance of these observations made it necessary to broaden the scope of theinvestigation. Single experiments under standard conditions were carried out with arange of other vapours to assess the differences between the direct and indirectmethods. The results were presented in a recent symposium (HARPER, 1992) and havebeen included here in Table 2. The differences are partly a result of the PELconcentrations used in the experiments. The results given by the direct method wouldapproach those given by the indirect method as the concentration is reduced. Thebreakthrough curves of hexane and ethyl acetate are almost identical, but the safesample volumes are very different as a result of the different PEL concentrations. Theresults in Table 2 refer to different temperatures, but the 5°C difference is unlikely toaccount for more than a few per cent of the observed discrepancy. This is confirmed by
at CD
C P
ublic Health Library &
Information C
enter on Septem
ber 16, 2011annhyg.oxfordjournals.org
Dow
nloaded from

Evaluation of solid sorbent sampling methods 85
TABLE 2. COMPARISON OF SAFE SAMPLE VOLUMES BY DIRECT AND INDIRECT METHODS (300 mg CHROMOSORB106)
Compound
Aliphatic hydrocarbonsHexaneHeptane
Aromatic hydrocarbonsTolueneEthyl benzene
Chlorinated hydrocarbons1,1,1 -Trichloroethane
Ketones2-Butanone (MEK)Methyl isobutyl ketone
EstersEthyl acetaten-Butyl acetate
Alcohols1-Butanol2-Butanol2-Ethoxyethanol
2xOSHA PEL(ppm)
100800
200200
700
400100
. 800300
sot100400
Vs indirect*(1)
30160
801200
28
10250
20730
503075
Vs directt(1)
5.24.0
8.712.7
0.9
1.712.1
2.29.4
9.14.09.5
•Results at 20°C. From HSE (1992).fResults at 25°C. From author's work.JOSHA ceiling limit.
Fig. 16, where a 15°C reduction in temperature is not sufficient to double thebreakthrough volume of ethyl acetate.
In previous studies using the indirect technique it has been the practice to quotebreakthrough volumes and safe sample volumes in terms of unit sorbent weight, whichcould lead to an impression that these figures are automatically transferable betweendifferent samplers. The dependence of breakthrough on sample tube geometry, andsorbent bed depth observed during the course of this study suggest that this may not beso, and caution is strongly advised. The variation of breakthrough with bed-depth isparticularly interesting, since the equilibrium adsorption quantity per unit weight doesnot change. The effect can be thought of as premature breakthrough at low sorbentbed-depths. The linear velocity of the air through the tube is sufficiently high thatmolecules may not be efficiently removed from the air stream. In particular, this may bedue to the enhanced velocity caused by wall effects or channeling. The magnitude ofthese effects will be reduced, and, therefore, sampling capacity will increase withdeeper, narrower beds. Results obtained in the course of their work led BUTLER andBURKE (1976) to a similar conclusion. The curves in Figs 12 and 13 approach linearityat higher bed-depths. This relationship has now been demonstrated in many othersystems. Extrapolation of the linear region to the baseline gives a minimum bed-depthbelow which breakthrough would be apparently instantaneous. This is the equivalentof the critical bed-depth well known from the theory of breakthrough in respiratorcartridges (WOOD and MOVER, 1989).
Other evidence in the literature confirms that the field of application for the indirectmethod is limited. TANAKA (1978) has shown that the linear relationship between log
at CD
C P
ublic Health Library &
Information C
enter on Septem
ber 16, 2011annhyg.oxfordjournals.org
Dow
nloaded from

86 M. HARPER
(retention volume) and reciprocal absolute temperature, which is necessary in order toextrapolate retention volumes to room temperature, does not always hold. SENUM
(1981) suggested that breakthrough volumes cannot be derived from retention volumesaccording to the method of CROPPER and KAMINSKY (1963) where the number oftheoretical plates is low. PIECEWICZ et al. (1979) demonstrated adverse effects ofrelative humidity on breakthrough volumes on Tenax, although PELLIZARI et al. (1976)did not; HARPER and PURNELL (1990) also noted the effect of water vapour on asupposedly hydrophobic molecular sieve, and the effect of water vapour on many formsof active carbon is well known (WOOD, 1987). This effect has not been accounted for,nor by the indirect method has the effect of any other interferent. However, using thedirect method in this study it has been possible to demonstrate, for instance, that thebreakthrough of organic vapours on Chromosorb 106 is not affected by relativehumidity.
CONCLUSIONS
A method has been demonstrated for the determination of breakthrough volumesof volatile organic compounds on solid sorbent air sampling devices. This method hasthe flexibility necessary to investigate the dependence of breakthrough on a wide rangeof parameters which will be encountered in actual sampling situations, and allows thevalidation of sample tubes according to existing protocols. A number of experimentshave confirmed the usefulness of this approach.
A substantial discrepancy is observed between safe sample volumes derived by thismethod and those derived from the indirect (GC) method. This appears to beprincipally a result of the dependence of breakthrough on concentration, which is notaccounted for in the indirect method. In addition, some other questionableassumptions which are required for the indirect method, have been described. Theeffects of variations in temperature, relative humidity, and the presence of otherinterferences, on adsorbent samplers should be well known, especially when samplerswhich do not possess a back-up section for the recognition of breakthrough are used.These variables cannot be taken into account by the indirect method of breakthroughdetermination.
The majority of challenge vapours used in this study have high PEL concentrations(200 ppm or greater), and in the real world exposures are likely to consist of transientpeaks of rapidly fluctuating, and probably quite low, concentration, rather than acontinuous assault at twice the PEL concentration. For these reasons the experimentsdescribed above represent 'worst-case' conditions that highlight the difference betweensafe sample volumes determined by the two methods. The indirect method may givesafe sample volumes that are applicable to certain situations, but it is important forusers to be aware that the results may differ substantially from those determined usingthe direct methods described in existing NIOSH, OSHA or HSE protocols, and forwhich the term safe sample volume is best reserved. An alternative term for safe samplevolumes based on the indirect method would avoid confusion.
Further research, including a wider range of sorbents and hazards, and a detailedstudy on the effects of different interfering compounds, has been completed. Acompanion paper demonstrating the effect of water vapour on the breakthrough of avariety of volatile organic compounds on carbonaceous sorbents is in preparation. In
at CD
C P
ublic Health Library &
Information C
enter on Septem
ber 16, 2011annhyg.oxfordjournals.org
Dow
nloaded from

Evaluation of solid sorbent sampling methods 87
addition, preliminary work has begun on the possibility of deriving adsorptionisotherms from single breakthrough experiments at high concentrations. Applicationsfrom researchers interested in developing a mathematical treatment of breakthroughbased on the data published here, and particularly its relationship to breakthrough inrespirator cartridges, would be welcomed by the author.
Acknowledgements—The author is indebted to Richard Brown (HSE) for his critical discussion of themanuscript.
A sampling tube containing a 300 mg front section and 150 mg back-up section of specially cleanedChromosorb 106 (Anasorb* 727) is available from SKC Inc, part number 226-75.
Tenax is a registered trademark of Buchem NV. (Enschede, The Netherlands), Chromosorb is aregistered trademark of Celite Corp. (California, U.S.A.), Anasorb is a registered trademark of SKC Inc.(Pennsylvania, U.S.A.).
R E F E R E N C E S
BARRER, R. M. (1978) Zeolites and Clay Minerals as Adsorbents and Molecular Sieves. Academic Press, NewYork.
BERTONI, G., BRUNER, F., LIBERTI, A. and PERRINO, C. (1981) Some critical parameters in collection, recoveryand gas chromatographic analysis of pollutants in ambient air using light adsorbents. J. Chromatogr.203, 263-270.
BIRD, R. B., STEWART, W. E. and LIGHTFOOT, E. N. (1958) Notes on Transport Phenomena. J. Wiley, NewYork.
BROWN, R. H. and PURNELL, C. J. (1979) Collection and analysis of trace organic vapour pollutants inambient atmospheres. J. Chromatogr. 178, 79-90.
BRUNAUER, S., DEMING, L. S., DEMING, W. E. and TELLER, E. (1940) On a theory of the van der Waalsadsorption of gases. J. Am. Chem. Soc. 62, 1723-1732.
BUTLER, L. D. and BURKE, M. F. (1976) Chromatographic characteristics of porous polymers for use asadsorbents in sampling columns. J. Chromatogr. Sci. 14, 117-122.
CASSINELLI, M. E., DELON HULL, R., CRABLE, J. V. and TEASS, A. W. (1987) Protocol for the evaluation ofpassive monitors. In Diffusive Sampling (Edited by BERLIN, A., BROWN, R. J. and SAUNDERS, K. J.),pp. 190-202. Royal Society of Chemistry, London.
CRISP, S. (1980) Solid sorbent gas samplers. Ann. occup. Hyg. 23, 47-76.CROPPER, F. R. and KAMINSKY, S. (1963) Determination of organic compounds in admixture in the
atmosphere by gas chromatography. Analyt. Chem. 35, 735-743.GALLANT, R. F., KING, J. W., LEVINS, P. L. and PIECEWICZ, J. F. (1978) Characterization of sorbent resins for
use in environmental sampling. Environmental Protection Agency Report, EPA-600/7-78-054.GIDDINGS, J. C. (1965) Dynamics of Chromatography, Volume I, p. 88. Marcel Dekker, New York.GREGG, S. J. and SING, K. S. W. (1982) Adsorption, Surface Area and Porosity, p. 3. Academic Press, London.HARPER, M. (1990) Environmental effects on sorbent based air sampling methods. In Indoor Air Quality and
Ventilation (Edited by LUNAU, F. and REYNOLDS, G. L.), pp. 397-408. Selper Ltd, London.HARPER, M. (1992) Measurement of sample capacity by breakthrough volume determination. In Clean Air at
Work (Edited by BROWN, R. H., CURTIS, M., SAUNDERS, K. J. and VANDENDRIESSCHE, S.), pp. 182-185.Royal Society of Chemistry, London.
HARPER, M. and PURNELL, C. J. (1990) Alkylammonium montmorillonites as adsorbents of organic vaporsfrom air. Environ. Sci. Technol. 24, 55-62.
HSE (1986) MDHS 54. Protocol for assessing the performance of a pumped sampler for gases and vapours.HMSO, London.
HSE (1922) MDHS 72. Volatile organic compounds in air. HMSO, London.KEULEMANS, A. I. M. (1959) Gas Chromatography (2nd Edn). Reinhold, New York.LITTLEWOOD, A. B. (1962) Gas Chromatography, Principles, Techniques, and Applications. Academic Press,
New York.NAMIESNIK, J., TORRES, L., KOZLOWSKI, E. and MATHIEU, J. (1981) Evaluation of the suitability of selected
porous polymers for preconcentration of volatile organic compounds. J. Chromatogr. 208, 239-252.NIOSH (1977) N10SH Manual of Analytical Methods (2nd Edn). U.S. Department of Health, Education
and Welfare, Cincinnati, Ohio.OSHA (1985) OSHA Analytical Methods Manual. OSHA Analytical Laboratory, Salt Lake City, Utah.PELLIZARI, E. D., BUNCH, J. E., BERKELEY, R. E. and MCRAE, J. (1976) Collection and analysis of trace
at CD
C P
ublic Health Library &
Information C
enter on Septem
ber 16, 2011annhyg.oxfordjournals.org
Dow
nloaded from

88 M. HARPER
organic vapor pollutants in ambient atmospheres. The performance of a Tenax GC cartridge sampler forhazardous vapors. Analyt. Lett. 9, 45-63.
PIECEWICZ, J. F., HARRIS, J. C. and LEVINS, P. L. (1979) Further characterization of sorbents forenvironmental sampling. Environmental Protection Agency Report, EPA-600/7-79-216.
SENUM, G. I. (1981) Theoretical collection efficiencies of adsorbent samplers. Environ. Sci. Technol. 15,1073-1075.
TANAKA, T. (1978) Chromatographic characterization of porous polymer adsorbents in a trapping columnfor trace organic vapour pollutants in air. J. Chromalogr. 153, 7-13.
VAN DEN HOED, N. and HALMANS, M. T. H. (1987) Sampling and thermal desorption efficiency of tube-typediffusive samplers: selection and performance of adsorbents. Am. ind. Hyg. Ass. J. 48, 364-373.
VIDAL-MADJAR, C , GONNORD, M. F., BENCHAH, F. and GUIOCHON, G. (1978) Performances of variousadsorbents for the trapping and analysis of organohalogenated air pollutants by gas chromatography. J.Chromatogr. Sci. 16, 190-196.
WOOD, G. O. (1987) A model for the adsorption capacities of charcoal beds. I. Relative humidity effects. Am.ind. Hyg. Ass. J. 48, 622-625.
WOOD, G. O. and MOVER, E. S. (1989) A review of the Wheeler equation and comparison of its applicationsto organic vapor respirator cartridge breakthrough data. Am. ind. Hyg. Ass. J. 50, 400-407.
at CD
C P
ublic Health Library &
Information C
enter on Septem
ber 16, 2011annhyg.oxfordjournals.org
Dow
nloaded from
View publication statsView publication stats